Article

Economic Comparison of Satellite, Plane and UAV-Acquired NDVI Images for Site-Specific Nitrogen Application: Observations from Italy

1
Department of Land Environment Agriculture and Forestry, University of Padova, 35020 Legnaro, Italy
2
Department of Agronomy, Food, Natural Resources, Animals, and Environment, University of Padova, 35020 Legnaro, Italy
*
Author to whom correspondence should be addressed.
Submission received: 25 August 2021 / Revised: 6 October 2021 / Accepted: 18 October 2021 / Published: 20 October 2021
(This article belongs to the Special Issue Remote Sensing in Agriculture)

Abstract

:
Defining the most profitable remote sensing platforms is a difficult decision-making process, as it requires agronomic and economic considerations. In this paper, the price and profitability of three levels of remote sensing platforms were evaluated to define a decision-making process. Prices of satellite, plane and UAV-acquired vegetation indices were collected in Italy during 2020 and compared to the economic benefits resulting from variable rate nitrogen application, according to a bibliographic meta-analysis performed on grains. The quality comparison of these three technologies was performed considering the error propagation in the NDVI formula. The errors of the single bands were used to assess the optical properties of the sensors. Results showed that medium-resolution satellite data with good optical properties could be profitably used for variable rate nitrogen applications starting from 2.5 hectares, in case of medium resolution with good optical properties. High-resolution satellites with lower optical quality were profitable starting from 13.2 hectares, while very high-resolution satellites with good optical properties could be profitably used starting from 76.8 hectares. Plane-acquired images, which have good optical properties, were profitable starting from 66.4 hectares. Additionally, a reference model for satellite image price is proposed.

Graphical Abstract

1. Introduction

Site-specific management is one of the main drivers of precision agriculture (PA). Spatial and temporal variability can be deployed to support management decisions and improve the profitability and sustainability of agricultural production, taking advantage of information and communications technologies [1]. Soil properties, vegetation or yield features can be used to delineate homogeneous management zones in order to apply site-specific management [2]. The identification of within-field variability is not a trivial task and can be supported by different technologies. Although homogeneous management zones are usually identified based on farmers’ knowledge [3], it is common practice to take advantage of proximal or remote sensors [4], taking into consideration standardized and consistent data.
Proximal sensors collect data from a distance less than 2 m from the target (e.g., soil or canopy) [5]. The most widely used proximal sensors in PA are yield monitors, weather stations [6], soil apparent electrical conductivity sensors [7] and vegetation spectroradiometers [8]. Proximal data provided by tractor-embedded sensors can be used to detect indirect suitable information to manage field variability (e.g., speed, engine power supplied, fuel consumption). Proximal sensors can collect high-resolution data (high number of samples per hectare). However, they require field surveys, which may be time-consuming and tricky to perform (e.g., after the emergence of arable crops).
Conversely, remote sensors collect data from a distance greater than 2 m [9]. At such distances, sensors commonly use electromagnetic radiation. Different platforms equipped with remote sensors can collect a large amount of data in a short time, ensuring fast data acquisition over large areas. Remote sensors can be classified according to four main characteristics. The first is the spatial resolution, which identifies the minimum surface detectable by the sensors (in m or m2 pixel−1). Spatial resolution directly affects the minimum area manageable with site-specific management. The second feature is the spectral resolution, which identifies the wavelength region to which the sensors are sensitive and the relative bandwidth (nanometers). The third characteristic is the radiometric resolution, which represents the number of values assumed by the reflectance when it is converted to an electrical signal by the sensors (in bits pixel−1). The last feature of remote sensors is the temporal resolution, or revisit time, which represents the number of images provided per unit of time. The temporal resolution of a remote sensor defines the frequency of agricultural field monitoring. Spectral resolution plays a key role in remote sensing applications in agriculture, since healthy vegetation’s spectral signature is characterized by a specific reflectance peak in the near-infrared (800–900 nm) and lower reflectance values in the red region (650–750 nm). The majority of the vegetation indices (VIs) are based on these two wavelengths, thus VIs are usually retrieved from passive optical sensors, even if some application of active radar sensors exists [10]. The most commonly used VI for crop monitoring is the NDVI [11]. VIs are widely used in PA because of their correlation with biomass and Leaf Area Index [12]. Moreover, remote sensors and VIs have been profitably used for variable nitrogen management [13], identification of mechanization level [14], support of Common Agricultural Policy [15], crop stress detection [16], and field variability detection [17]. Remote sensors take advantage of different platforms, among which the most used in agriculture are satellites, planes, and Unmanned Aerial Vehicles (UAVs).
VIs have been used to manage variable rate nitrogen application since the end of the 1990s, with the first application using active proximal sensors [18]. In 1999 the Yara’s Research and Development Center developed a sensor (N-sensor, Yara International ASA, Oslo-Norway) to determine crop nitrogen demand. This sensor uses a proprietary algorithm based on empirical experimentation on multiple crops. Raun et a. [19] developed a new methodology based on a site-specific calibration. This methodology (Oklahoma State University algorithm, OSU) takes advantage of the GreenSeeker (Trimble Inc., Sunnydale, CA, USA) sensor. The amount of nitrogen to apply was decided according to the crop variability detected by the sensor, and it was calibrated on an area with no nitrogen limitations (N-rich strip) [20]. Thomason et al. [21] improved the accuracy of the OSU algorithm by using zero nitrogen strips combined with a N-rich strip to calibrate the sensor. In the very beginning, these sensors were used primarily for staple crops such as wheat, corn, canola, and potato, but in the last decade, they have been applied to other crops [22,23]. Similarly, passive optical remote sensors have been used for VIs estimation. Blondlot et al. [24] proposed a methodology to manage nitrogen fertilization using a SPOT satellite, based on the relationship between NDVI, LAI and chlorophyll content. Shou et al. [25] used high-resolution satellites to evaluate the nitrogen status in winter wheat, finding a good correlation between chlorophyll and nitrogen content. Huang et al. [26] improved the nitrogen status monitoring using a combination of mid-resolution and high-resolution satellites (RapidEye, Formosat, and WorldView-2). RapidEye images were also used by Magney et al. [27] to calculate the normalized difference red edge index (NDRE) and map wheat nitrogen uptake. The correlation between remotely sensed NDVI and nitrogen uptake is used by several decision support systems for precision farming currently available (CropSat, Agrosat, Agrisat, etc) to provide nitrogen recommendations for farmers and final users [28]. More practically, satellite images can be used to delineate stable homogeneous zones when yield data are insufficient. Georgi et al. [29] proposed an algorithm to delineate stable management zones for precision agricultural use, based on automatic segmentation of RapidEye images. Variable rate nitrogen application can provide environmental and economic benefits, such as an increment in energy use efficiency and in the net return on nitrogen application [30]. According to Kayad et al. [31], variable rate nitrogen application led to an improvement in corn yield by 31% over ten years while quantity of nitrogen applied was reduced by 23%.

1.1. Satellite

Satellite application for remote sensing is a consolidated technology which has been used for civil purposes since 1972, when Landsat 1 was launched. Several implementations occurred over the years, increasing satellite capability and accuracy of data provided. Nowadays, several constellations of earth observation satellites have been implemented, which collect data in the radio (~2.5–100 cm), thermal (~8–14 µm), and visible/near-infrared (~400–900 nm) wavelengths. Earth observation satellites with a spectral resolution ranging from 400 to 900 nm are the most used in agriculture, as they allow for the calculation of tens of different VIs. Satellites with spectral resolution suitable for agriculture uses can be managed either by a governmental agency (usually free of charge) or a private company (usually for sale). Several constellations of satellites acquire data continuously (Sentinel, Landsat, RapidEye, PlanetScope, Spot, etc.). Other constellations acquire data according to an acquisition plan or on demand (Worldview, Quickbird). Both data sources have been used for index-based variable rate nitrogen application [27]. Due to the observation distance (400–800 km, depending on the orbit), satellite-acquired images are affected by distortions and noise, making geometric and radiometric correction necessary. In addition, atmospheric disturbance during satellite acquisition requires specific atmospheric correction, which is impossible in some conditions (e.g., clouds, smog).
Recently, a new approach to satellite earth observation was proposed, based on the constellation of hundreds of nanosatellites characterized by limited observation width, instead of constellations of 2–5 satellites with a wide observation width [32]. This new approach was made possible by the decrease in low orbit launching costs.
Figure 1 shows the evolution of data volume provided by several constellations over the years starting from 1972 (Landsat 1 placed in orbit) up to 2020, based on Marinello et al. in 2019 [33]. Data volume per hectare per year summarizes information on spatial, spectral, radiometric and temporal resolutions. Over 50 years, data volume per hectare per year showed an exponential increase from 100 B*(ha year)−1 up to 100 MB*(ha year)−1. The large amount of data provided rapidly and continuously is a strength of satellite remote sensing in agriculture.

1.2. Planes

Airborne sensors are widely used for land monitoring. As in the case of satellite sensors, this technology was originally developed for non-civil uses. Nowadays, planes can carry spectral sensors able to analyze geomorphology, land coverage, or vegetation features. Although airborne surveys are usually based on specific sensors, such as Light Detection and Ranging or Laser Imaging Detection and Ranging (LiDAR) or hyperspectral cameras [34,35], tailored multispectral cameras, suitable for agricultural applications, are sometimes used [36,37]. Images acquired by plane-mounted sensors require photogrammetric and mosaicization processes to stitch images together. The stitching process requires a partial image overlap (~80%) to provide suitable blended images. Plane earth observation requires specific setting of the flight plans and large areas for take-off and landing. This latter condition decreases the scalability of these techniques and increases the costs.

1.3. Unmanned Aerial Vehicles (UAV)

UAVs or Unmanned Aerial Systems (UASs) are a relatively new technology in PA which has spread among agricultural users after 2000. Agricultural UAVs can carry several sensors, such as hyperspectral, multispectral (visible/near-infrared) or thermal cameras [38,39]. Images acquired by UAVs require photogrammetry and mosaicization processes to merge multiple images acquired by the sensors. Similarly to airborne sensors, a specific calibration sensor is needed to correct the incident light during the acquisition time and obtain the correct reflectance value [40]. The spatial resolution of UAV-acquired images is primarily affected by the flight altitude. The higher the altitude, the lower the spatial resolution of the derived images. UAVs used for agricultural purposes are mainly ascribable to two main classes: fixed wings and multi-copters.
Satellite, plane, and UAV-based VIs can be used to map in-field variability and drive variable rate management of the inputs. Nevertheless, the choice of the most appropriate sensors is not always an easy task, as it involves economic and agronomic constraints. Moreover, the actual prices of these different technologies sometimes do not include some costs (minimum order area, take-off, elaboration, etc.), leading to difficult and blinded choices for technicians and farm managers [41].
In the current study, UAV-, plane- and satellite-acquired images were compared according to sensor quality, price, and profitability for variable rate nitrogen management. These sensors’ varied data could be profitably used for several other applications (e.g., variable rate irrigation, stress and disease detection, yield estimation). However, variable rate nitrogen management was chosen as a standard technology because its use is validated by several scientific works involving remote sensors. This work analyzes the economic benefits provided by variable rate nitrogen application taking into account the price of different remote sensing platforms to define the profitability of these technologies by estimating the final cost of images provided.

2. Materials and Methods

2.1. Dataset Composition

The dataset was comprised of the prices collected through a survey among multispectral image (from satellite, plane, and UAV) providers. The surveys were performed in 2017 and 2020 for UAV companies, while for plane and satellite image providers, prices were collected in 2020.
Satellite price collection involved nine satellite image providers for a total of 62 prices for 17 different constellations of satellites. This dataset involved constellations of satellites whose spectral resolution was reasonable for NDVI calculation (from 600 to 900 nm), spatial resolution suitable for PA (set at 30 × 30 m pixel size or less), and revisit time shorter than 20 days, to allow field monitoring even in cloudy environments. The spatial resolution value refers to panchromatic resolution. The panchromatic resolution is obtained from the pan sharpening process by using a wider spectral resolution band with a better spatial resolution to increase the spatial resolution of a band with a narrower spectral resolution. All information about sensor properties was retrieved from the manufacturers’ websites (Table 1) and the European Space Agency (ESA) satellite mission database (https://directory.eoportal.org/web/eoportal/satellite-missions, accessed on 30 April 2020). Usually, companies provide two types of products: archive data and new acquisition. Indeed, some constellations of satellites (especially high spatial resolution satellites) acquire images on-demand, according to the received inquiries. On-demand products rely on new acquisition, while images already acquired are archived. The current study considered the minimum price difference between new acquisition and archived images not older than 90 days (fresh archive), since spatial field variability monitoring may rely on relatively outdated surveys, which are less expensive. Satellite constellations and their main features are reported in Table 1. All prices collected refer to a minimum order area ranging from 2500 ha to 10,000 ha. Minimum order area represents the minimum surface commercialized by the image providers. This area is usually far from the final user needs, which would use only a part of the total surface. This point was considered in the minimum price calculation, multiplying price per hectare by the minimum order area. For open-source satellites, such as Sentinel-2 or Landsat-8, the tile dimension was considered as “minimum order area”. The amount of data per hectare (KB ha−1) was extracted starting from radiometric resolution (bits pixel−1), spatial resolution (m2 pixel−1) and the number of spectral bands, according to the following equation:
K B   h a 1 = 10000 m 2   p i x e l 1 b i t s   p i x e l 1 8 n u m b e r   o f   b a n d s 1000
Airborne image prices were collected via a survey of four Italian companies, which provided six prices for different acquisition conditions.
UAV data were collected in 2017 and 2020 to highlight the evolution of this technology within the Italian market. The UAV dataset was comprised of 44 prices for 2017 and 22 prices for 2020, divided into arable and specialized crops, based on the company’s pricelist classes. Specialized crops were defined according to the USDA definition [42], which includes fruits, vegetables, tree nuts, dried fruits, horticulture, nursery crops and floriculture. On the other hand, arable crops include wheat, corn, soybeans and the majority of commodity crops. This differentiation was necessary since the average income obtained with specialized crops is higher than the average income obtained with arable crops. This study considered only services provided by professionals in PA in Italy.
Due to the high number of sensors available among UAVs and planes, two reference sensors were chosen for UAV and plane datasets to ease the process and to obtain spectral and radiometric features usable for comparison and benchmarking. Tetracam micro-MCA Snap 6 (Tetracam Inc., Chatsworth, CA, USA) was used as the reference sensor for UAVs [43], while Leica DMC III [44] was the reference sensor for plane platforms. Although more commonly used cameras for UAVs exist, the Tetracam micro-MCA Snap 6 was chosen since, in terms of number of bands (six), it is in between professional cameras for UAVs and those used for research and development, which usually have 4–5 and 10–11 bands, respectively. The sample flights considered for this study were 2500 m and 100 m above ground level for planes and UAVs respectively.

2.2. Spectral Accuracy of NDVI and Quality Comparison

NDVI was chosen as the reference VI as it is widely used for spatial pattern delineation of crop biomass [45]. NDVI can be used to manage variable rate nitrogen applications from both proximal and remote sensors [8,21,27].
Silicon sensors can convert photons to an electrical signal proportional to the number of photons that reach the sensors. On the other hand, silicon sensors are affected by electrical noise, due to the electronic component and the composition of the sensor. The magnitude of the sensor noise is commonly summarized using the Signal-to-Noise Ratio (SNR). The SNR of a sensor is the ratio between the signal induced by the photons received divided by the signal from the source and electronics onboard. Noise affects the signal produced by the number of photons, leading to less precise measurements. VIs augment this noise, due to the error propagation of each band used for their calculation.
Taking advantage of SNR data provided for each sensor by the manufacturers, error propagation in the NDVI formula was assessed with 1500 iterations obtained from a Monte Carlo Simulation [46]. The coefficient of variation (CV) of NDVI simulation was used as quality parameter for sensor comparisons.

2.3. Price Composition, Modelization and Profitability Analysis

Comparison among the different platforms and sensors was carried out by dividing satellite sensors into groups using K-means unsupervised classification algorithm [47] based on sensors features (Table 1). This classification algorithm is frequently used for price discretization [48,49]. The elbow method was used to identify the optimal number of groups. These three groups obtained by K-mean classification can be summarized as Very High Resolution (VHR; spatial resolution <1 m), High Resolution (HR; spatial resolution from 1 to 5 m) and Medium Resolution satellites (MR; spatial resolution >10 m). A principal component analysis (PCA) was performed using the satellite features dataset to investigate the main features affecting satellite price per hectare. A regression model was fitted to estimate the price of satellite images.
To evaluate the download costs of images provided by different satellite constellations, the amount of data per hectare was multiplied by the average cost of mobile broadband connection in the European Union-28 (0.93 EUR GB−1 in 2019) [50]. Although nowadays broadband connection costs are relatively low and could be ignored, download cost was considered in this analysis in order to estimate the cost of the amount of data per hectare, which otherwise would not be considered.
Although images are geometrically and radiometrically corrected, atmospheric correction at the Bottom of the Atmosphere (BOA) is not always performed. In the price analysis of the satellite images, a correction cost quota proportional to the spatial resolution was included. The correction cost was estimated according to the labor cost of the geospatial analysis, which is strongly influenced by the spatial resolution. Accordingly, correction cost was 150 EUR for VHR, 100 EUR for HR, and 50 EUR for MR satellites. The correction cost was applied once per image and was not related to the overall area elaborated. These three quotas were estimated considering the average labor cost in the Euro-area, which is 49.2EUR*h−1 for service employees [51].
An additional quota was added to the final price to take into account the analysis costs from professional users to define the management zones, produce prescription maps, and produce agronomic advice. Although management zone delineation and prescription map definition are complex tasks and require knowledgeable professionals, automatic and unsupervised algorithms can nowadays provide meaningful and effective services. According to this latter consideration, processing costs were established as follows: 75 EUR for VHR, 50 EUR for HR and 25 EUR for MR satellites, thus considering the major processing time for higher-resolution images. This processing cost was applied once per image and was not related to the overall area elaborated.
The prices of airborne platforms were composed of the price per hectare obtained from quotes, added to a fixed cost for take-off. The take-off quota was retrieved from the average cost provided by the companies (2000 EUR per flight). The UAV companies involved in the survey did not declare a minimum flight surface and a take-off cost.
UAV and plane companies provided prices of NDVI images already elaborated (georeferenced, mosaicized and radiometrically corrected). For this reason, estimation of the elaboration costs was not performed. As for VHR satellite data, the processing cost (management zone definition and agronomic advice) for UAV and plane images was established as 75 EUR. The resolution of UAV and plane images was, indeed, comparable to that of VHR satellites. Table 2 summarizes the final prices of each platform.
The final prices of each platform were compared to the economic benefits of variable rate nitrogen application, which is one of the most common applications of remotely sensed images in PA. Since variable rate nitrogen application does not require multiple images, this study considered the price of one image per hectare. The economic benefits provided by variable rate nitrogen application were obtained from the meta-analysis of Colaço and Bramley [52], which quantified the impact of sensor-based variable rate nitrogen application of 58 studies and farmers’ profitability.
Statistical analysis was performed using Python 3.6 (pandas, SciPy, and Seaborn libraries) and JMP®, Version 14 (SAS Institute Inc., Cary, NC, USA). Remote sensing image price was compared using a one-way ANOVA, while comparisons between economic benefits provided by variable nitrogen applications and prices of each platform were calculated using linear regression.

3. Results and Discussion

3.1. UAV Prices Analysis

A preliminary price analysis was carried out considering the raw image price per hectare, without fixed, elaboration, and processing costs. This analysis involved prices in 2017 and 2020 for UAV data, while for satellite and plane data the comparison was performed only for 2020.
Figure 2 reports the frequency distribution of all prices detected in 2017 and 2020 for UAV-derived NDVI images for arable and specialized crops. The average price of an NDVI image for arable crops was 72.5 EUR/ha in 2017, while in 2020 it was 43.36 EUR/ha, showing a price decrease of 40.2%. Similarly, the cost of NDVI images for specialized crops was 95.00 EUR/ha in 2017 and 79.00 EUR/ha in 2020, showing a decrease of 16.8% (Figure 2A,B). On the one hand, UAV prices for arable crops in 2020 showed a lower standard deviation (std = 11.60) compared to data collected in 2017 (std = 25.45). On the other hand, differences in the standard deviation of price distribution between 2017 and 2020 were not significant for specialized crops. The price of NDVI images for arable crops in 2017 was 23.7% lower than the one for specialized crops. In 2020 the price difference between images for arable and specialized crops increased: the cost for arable crops was 45.1% lower than that for specialized crops. (Figure 2C,D).
The price reduction between 2017 and 2020 can be justified by the high number of companies that were on the market in 2017. Some of the companies with less competitive prices quit their business by 2020 (five companies from a sample of 22). The smaller price reduction for specialized crops over the same period can be justified by the specific skills (e.g., different camera orientation, computer vision techniques, more ground sampling points) required for UAV flights over specialized crops (e.g., vineyards and orchards). Moreover, to achieve the high-spatial resolution necessary to manage the inputs in these crops, additional time is required. Experienced know-how is demanded to provide NDVI images for specialized crops, thus leading to less competition on the market. Differences between average prices for NDVI images of arable (Figure 2C) and specialized (Figure 2D) crops increased in the 2020 survey, showing a segmentation of the market which better matched arable (low income per hectare) and specialized (high income per hectare) crop needs.
Although results were obtained considering only the Italian UAV market, they suggested that UAV acquired images are more suitable for variable rate application where high spatial and spectral resolution is required and fully exploited (e.g., precision weed control). Moreover, the UAV imaging cost analysis showed that prices decreased between 2017 and 2020 by 28.5%, having two different prices for arable crops (e.g., wheat, corn, soybeans) and specialized ones (e.g., vineyards, vegetables, nursery crops).

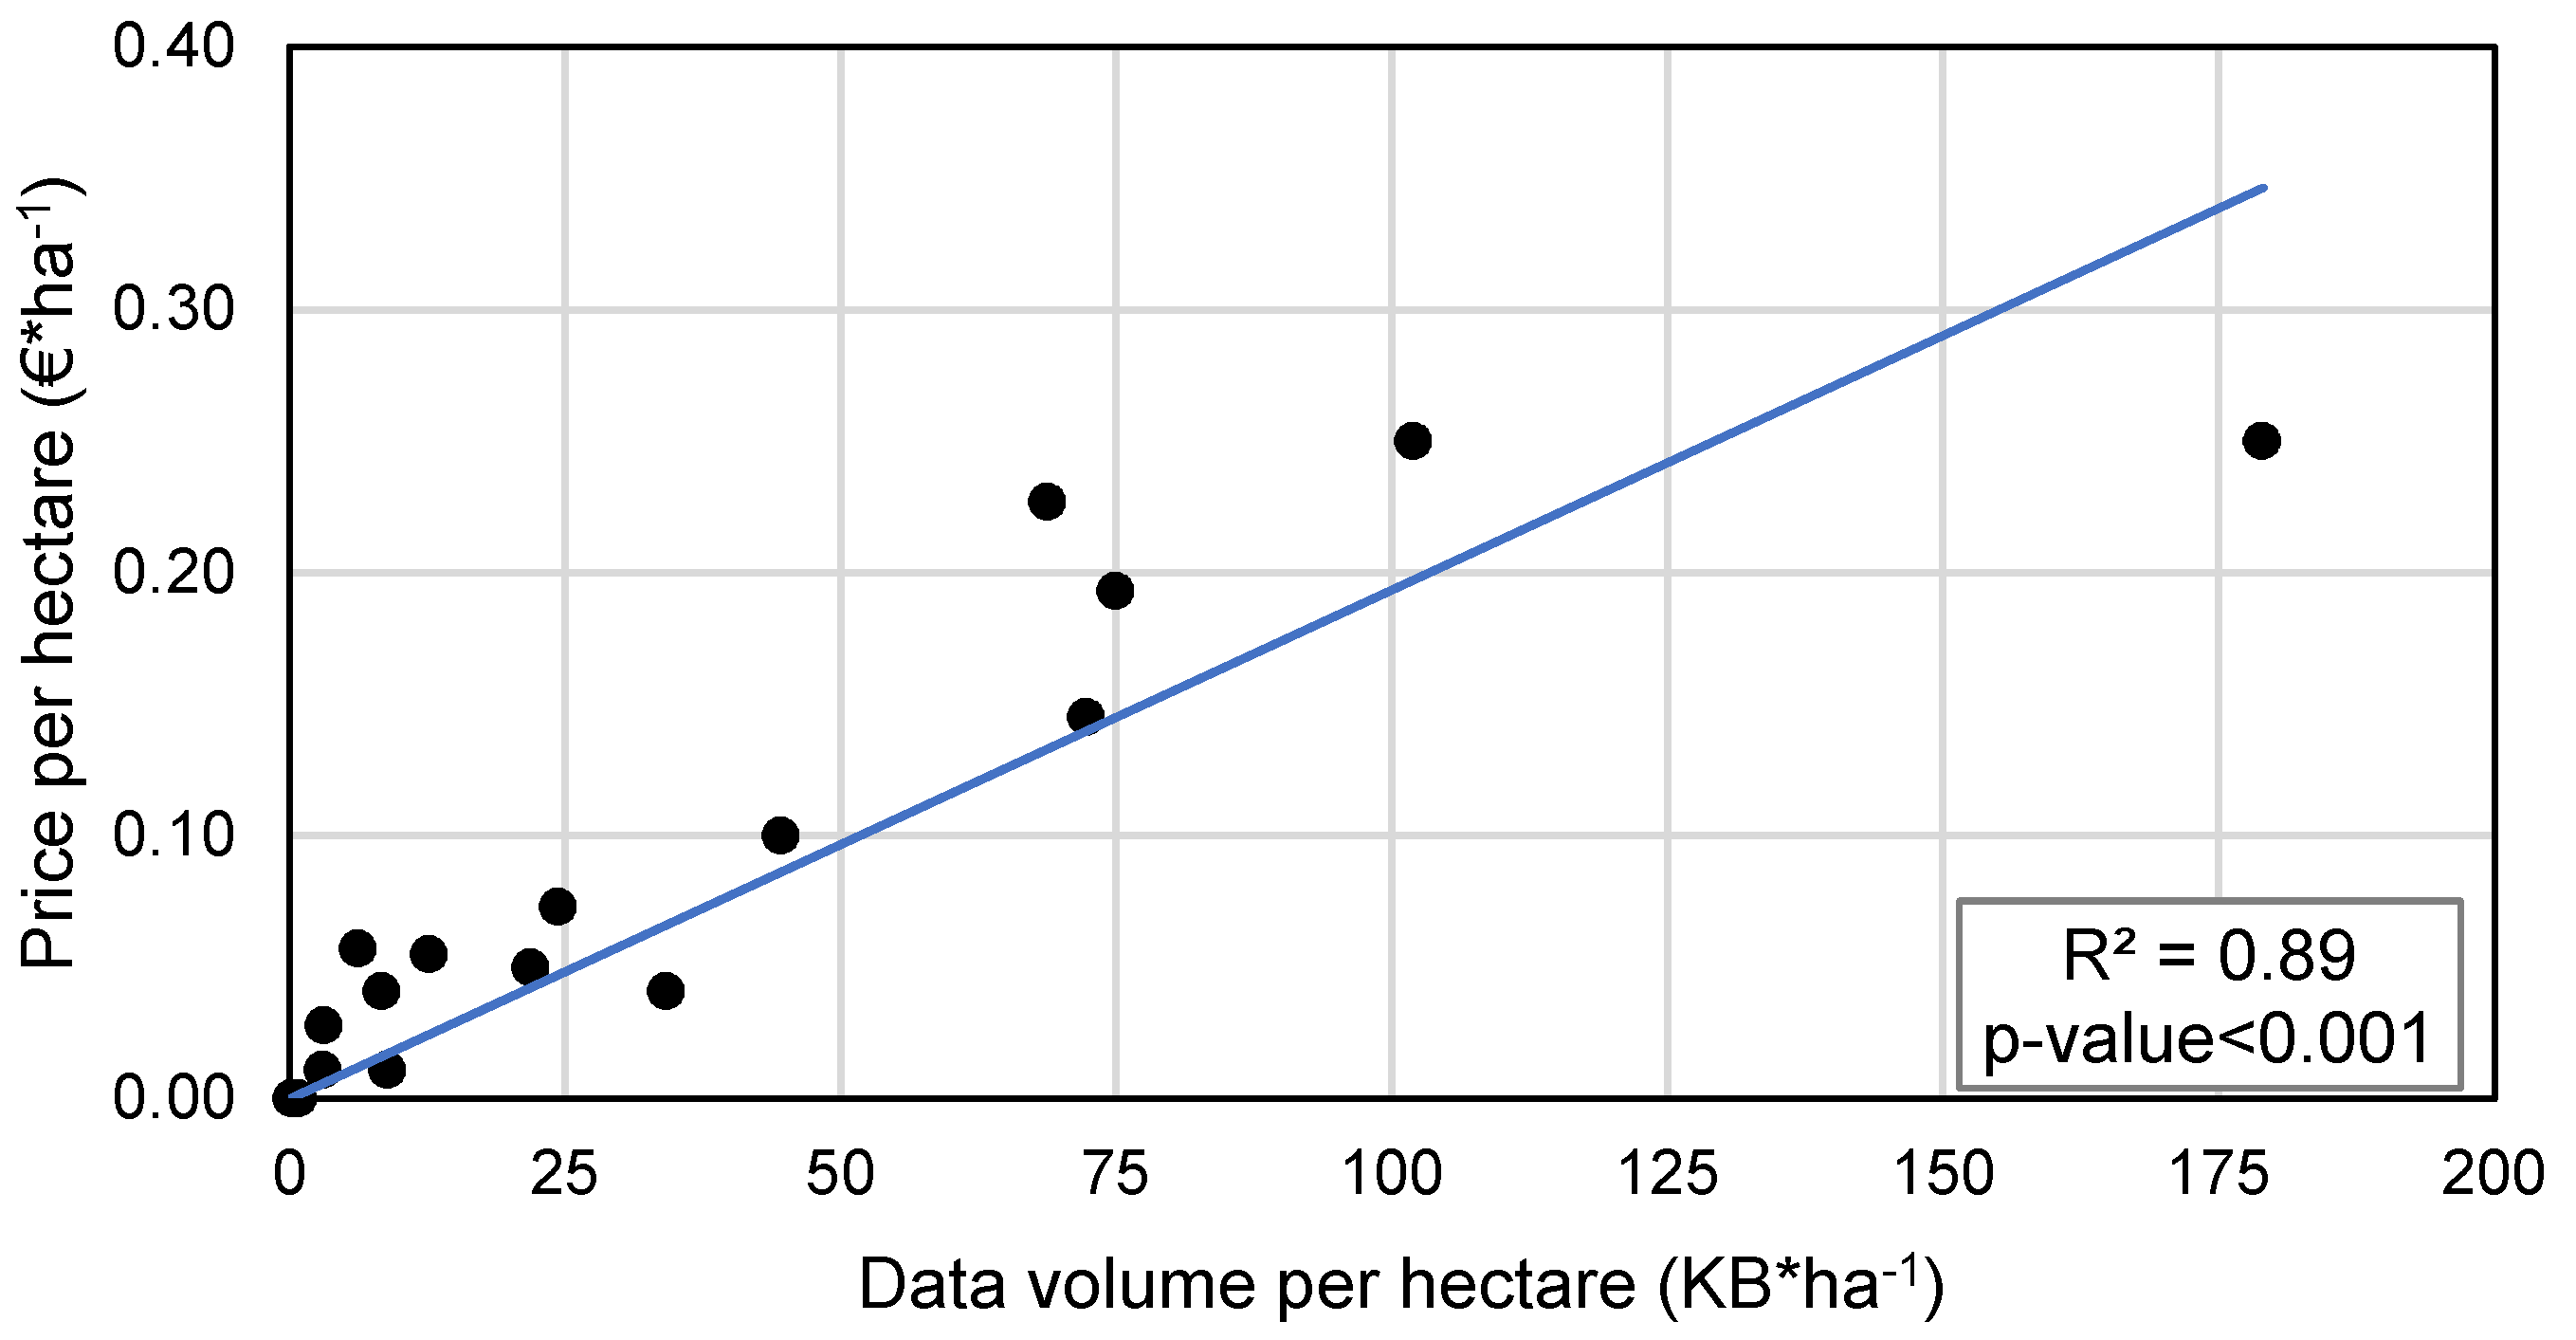
3.2. Raw Image Price per Hectare Comparison

Raw image price refers to raw image cost regardless of minimum order area, take-off costs, and all further image analysis processes. Raw image price per hectare is sometimes used to compare sensor costs. Thus, satellite, plane, and UAV raw image prices per hectare were analyzed to study their range. Figure 3 shows the results of the price per hectare comparison for UAV, plane and satellite raw images, based on the 2020 survey. Average prices ranged from 43.36 EUR ha−1 for UAVs, to 1.68 EUR ha−1 for planes, to 0.09 EUR ha−1 for satellites. Although UAV and plane prices did not show high variability, satellite price distribution showed higher heterogeneity. For this reason, the following analyses were carried out grouping satellite data into three clusters. A K-means unsupervised algorithm based on (i) minimum price per hectare, (ii) data per hectare, (iii) spatial resolution, (iv) radiometric resolution, (v) revisit time, and (vi) error propagation in the NDVI formula was used for clustering. The average cluster value for each feature is reported in Table 3.
Considering that the European average utilized agricultural area per holdings is 16.1 ha, a medium resolution satellite, such as Sentinel-2, could be considered as a dissemination driver of variable rate nitrogen application in Europe. The application of satellite imagery in smallholder farming should take into consideration the reduced capability of medium resolution satellites (above 10 m of spatial resolution) to detect field variability. In that case, higher spatial resolution satellites showed higher consistency [53]; however, the economic sustainability of such sources of information was reduced. Although crop monitoring may not be profitable using the presented satellite constellation to detect field variability below a defined field size, new application and data processing protocols, such as biotic stress monitoring [54] and evapotranspiration assessment [55], may be performed and may contribute to the profitability of such technologies.

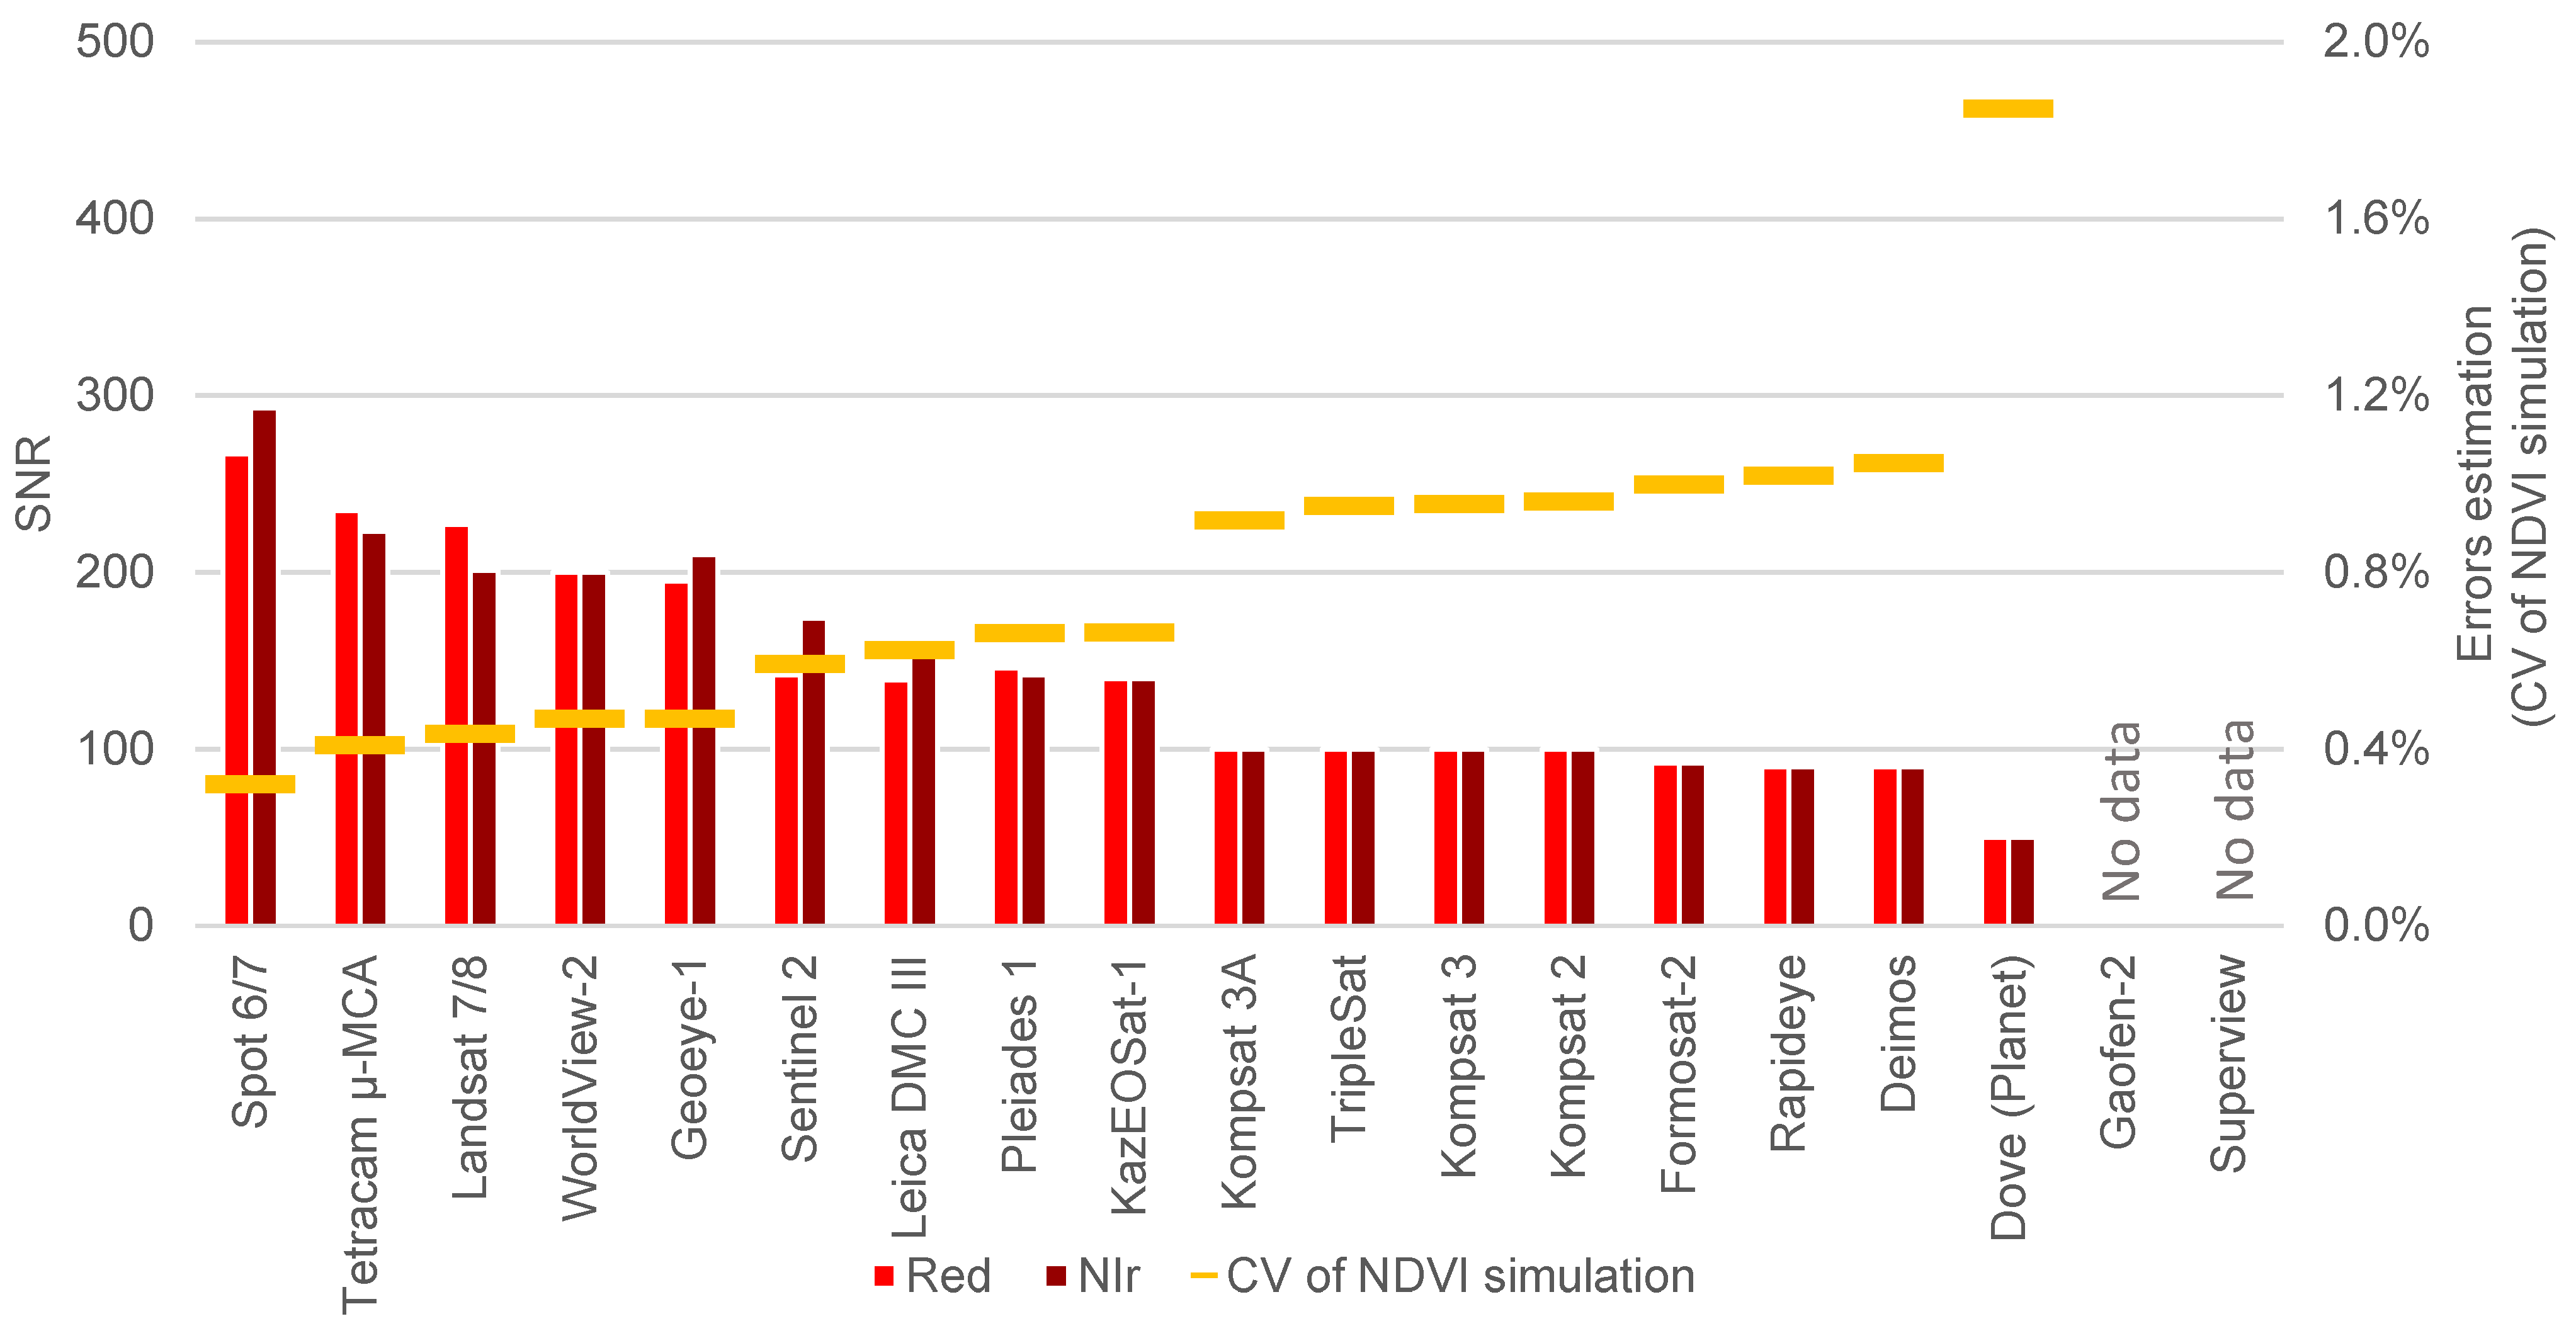
3.3. Sensors Quality Evaluation

The CV of NDVI simulation was combined with SNR as an evaluation parameter for sensor quality. SNR values ranged from 267 for Red and 293 for Near-Infrared bands of Spot 6/7 to 50 for Red and 50 for Near-Infrared bands of Dove satellites. This variability in SNR values led to important differences in CV of NDVI simulation. The CV of NDVI was 0.32% for Spot 6/7 and 1.85% for Dove, which represented the lowest and the highest values respectively. Free of charge satellites showed a low CV: 0.44% for Landsat 7/8 and 0.59% for Sentinel-2. The reference sensors for UAVs (Tetracam micro-MCA) and planes (Leica DMC III) showed a CV of NDVI simulation of 0.43% and 0.63%, respectively. Data reported in Figure 4 shows the SNR of each sensor and the relative CV of NDVI simulation.
The CV of NDVI simulation was used to classify sensors into three groups. The first group had a CV up to 0.5%, and included UAV and plane reference sensors, some of the most recent on demand satellites, and free of charge satellites. The second group included a group of satellites less recently launched, which had CV of NDVI up to 1%. The third group included only the Dove satellite constellation, which showed a CV of NDVI simulation of 1.85%. The presence of free of charge satellites in the first group proves the high quality of the optics installed in the non-commercial satellites. On the other hand, the Dove nano-satellites constellation prioritized reduced size of satellite over optical quality. Reference sensors for UAVs and planes showed a low CV of NDVI simulation, demonstrating the optical consistency of these sensors. The relatively high value of CV of NDVI simulation of the Dove satellites may be caused by the postprocessing applied by PlanetScope (e.g., orthorectification), as highlighted by Anger et al. [56]. The comparable value of CV of NDVI between Sentinel 2, UAV and plane images confirms a previous study [57] which highlighted the consistency of these sources of data for crop monitoring.

3.4. Satellite Image Price Modeling

The satellite features dataset was analyzed considering price per hectare, data volume per hectare, minimum order area, revisit time, spatial resolution, radiometric resolution, raw image price, and CV of NDVI simulation using a PCA. Figure 5 shows the first and the second principal components obtained from the PCA. According to this analysis, price per hectare and data volume per hectare had similar loadings on the first and the second principal components. The CV of NDVI simulation had a large positive impact on the first principal component analysis.
Stepwise regression was performed estimating the price per hectare of satellite imagery considering data volume per hectare, minimum order area, revisit time, spatial resolution, radiometric resolution, raw image price, and CV of NDVI simulation. Although the result of the stepwise regression with the optimization of the Akaike information criterion (AIC) returned a multiple linear regression model based on data volume per hectare and CV of NDVI simulation, the effect of the CV of NDVI simulation was not significant (p-value > 0.05). Based on this, a linear model was fitted plotting price and data volume (Figure 6), returning the function showed in Equation (2).
  h a 1 = 0.0019   K B   h a 1
The definition of a price model to estimate agricultural tools is widely applied to estimate the profitability of agricultural practices [58]. According to the PCA and regression analysis results, the raw satellite price per hectare was primarily influenced by data volume per hectare, calculated according to Equation (1).

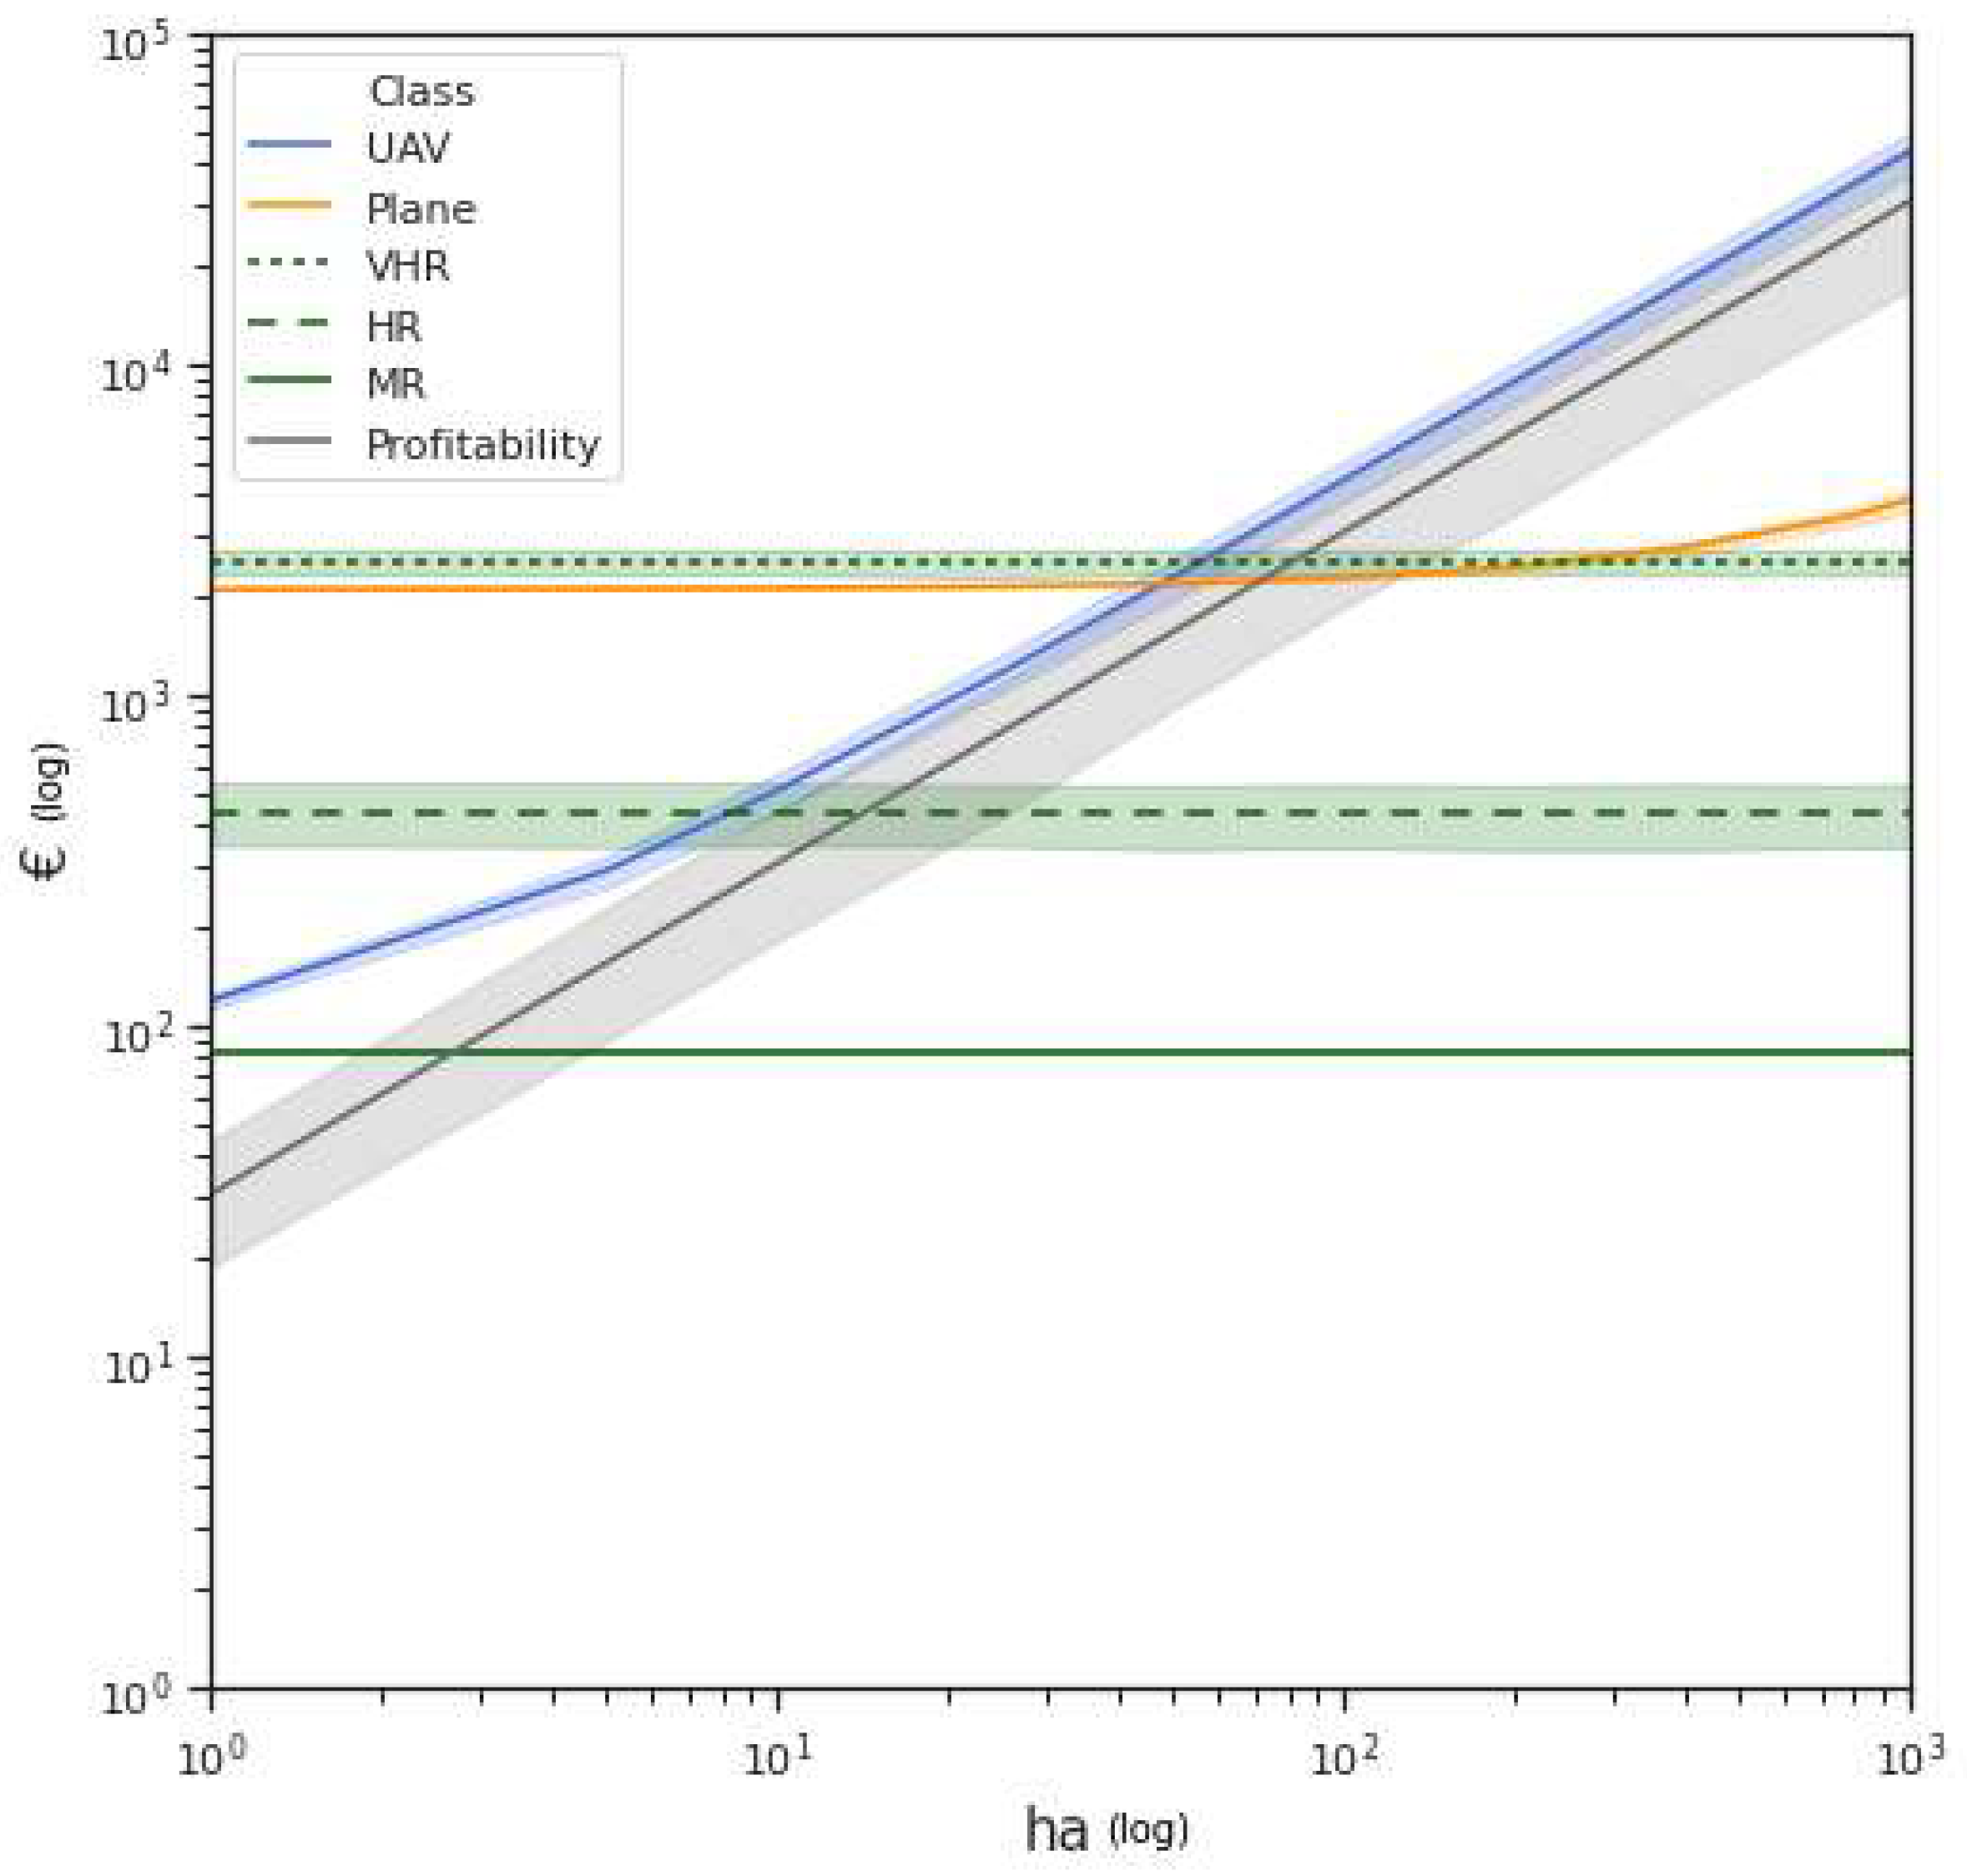
3.5. Variable Rate Nitrogen Application Profitability

Relative prices of the NDVI images were compared to the economic benefits delivered by variable rate nitrogen application, which is a well-known and relatively widespread practice. Final prices of the NDVI images were composed of prices per hectare (considering minimum order area and take-off cost), processing, and elaboration costs. The price of a single NDVI image was then compared to the economic benefits provided by variable rate nitrogen application, as one NDVI image is the minimum required for nitrogen application spatial management. The economic benefits of the variable rate application were extracted from a recent meta-analysis [52], considering all items of the meta-analysis. This meta-analysis analyzed 58 studies applying a N-rich strip approach and sensor-based site-specific N management in grains. Figure 7 shows price trends concerning area variation for UAVs, planes, and VHR, HR and MR satellites. In the same graph, the variation in precision nitrogen management profitability according to area variation is plotted. The intersection between the price trend and the variation in profitability represents the break-even point of this technology. Areas greater than the break-even point represent a profitable use of the specific technology for variable rate nitrogen application. On the other hand, on areas lower than the break-even point, variable rate nitrogen application may not generate economic advantages. Lines are plotted with halos which represent data distribution with a confidence interval of 95%. The equation results from the regression are reported in Table 4.
Table 5 shows that medium-resolution satellites (free of charge satellites) are profitable in fields whose minimum size is 2.52 hectares. For high-resolution satellites, the profitability starts from 13.2 hectares, while very-high-resolution satellite profitability starts from 76.8 hectares. Plane acquired NDVI is profitable on blocks larger than 66.4 hectares (Table 5).
The analysis allowed us to assess that the average price of UAV-acquired NDVI images was 43.36 EUR/ha. The average economic benefit provided by variable nitrogen application was 33 EUR/ha. As such, UAV NDVI images were not affordable for variable rate nitrogen application.
Nevertheless, Figure 7 shows an overlap of price line halos within the 95% confidence intervals. This result means that some UAV image providers can offer profitable data for variable rate nitrogen application when this technique supplies above-average benefits. Values of profitability obtained considering the 95% confidence interval take into account the varying profitability of variable rate nitrogen application on fields with different spatial variability. Besides, high-resolution UAV images provide over-resolved data which are not necessary for fertilization, as the working width of conventional spreaders is usually larger than 6 m. The use of UAVs can remain beneficial when high spatial resolution is required (e.g., leaf disease identification, estimation of wind damage) and if the mapping area is smaller than 77 hectares.
These results were obtained considering an average advantage provided by variable rate nitrogen application on grains according to the meta-analysis of Colaço and Bramley (2018); however, a different result may be obtained considering a lower or higher profitability from variable rate nitrogen application [59]. Site-specific management may also be applied to herbicide application [60], irrigation [61] and harvest management [62]. These strategies may have a significant impact on economic analysis of site-specific management, but were not considered in this study, since their implementation in commercial farms is lower than variable rate nitrogen application. A similar study by Matese et al. [63] found the break-even point between satellite and UAV acquired images at five hectares using RapidEye satellite images as reference. According to the result found in this manuscript, the break-even point between high-resolution satellites (such as RapidEye) and UAV acquired images was 13 hectares. Although a difference of seven hectares may be considered non-significant, this displacement may have the following reasons: (i) the economic analysis of Matese et al. was performed on a limited number of price samples and field sizes (five and 50 hectares); (ii) that study was focused on comparison in terms of variability between sensors, and the economic analysis represented only a small part; (iii) that study was carried out on vineyards, while the current study is focused on grains.
Although the aim of this study is to analyzed the economic benefits provided by remote sensing platforms for variable rate nitrogen application, such techniques can take advantage of proximal sensors [64]. In this latter case, sensors are located close to the vegetation and are often active. As a result, spatial resolution and SNR slightly affect the VI reading. The evaluation of the net returns for variable rate nitrogen application is strongly affected by within-field variability which may increase or reduce the variation in yield and nitrogen requirement with variable rate management [65]. The reference value for profitability was extracted from a deep meta-analysis [52] which included studies with negative net return from variable rate nitrogen application. In these latter cases within-field variability may not be sufficient to be exploited by variable rate management, leading to a negative net return. Moreover, within-field variability and soil type may increase or decrease the potential benefits from nitrogen losses and the related subsidies from environmental policy [66]. The implementation of variable rate nitrogen application and the related net return should take into account the specificities of each field. Indeed, the placement of fields in nitrate vulnerable zones may increase the potential benefits of this practice [67].

4. Conclusions

In this study, three different types of remote sensors were evaluated for their optical quality and profitability for variable rate nitrogen application. A first comparison analyzed the price trend of UAV-derived NDVI image providers in Italy between 2017 and 2020 for arable and specialized crops. In both years arable crops showed lower prices than specialized crops, suggesting differences in survey costs and higher value added to UAV images for specialized crops. A decrease in the average price was observed between 2017 and 2020 for the analyzed service providers. The number of UAV service providers in Italy increased starting from 2015 due to the high interest in this technology by farmers. Due to this latter point, the selection of market operators occurred in the following years. In addition, other sources of multispectral images, such as planes and satellites, compete with UAV image providers. The comparison between UAV, plane and satellite prices per hectare (without taking into account minimum order area, take-off and processing costs) showed that UAV prices were the highest, followed by those of planes and satellites. The optical quality comparison was carried out considering the CV of NDVI simulation and taking advantage of the SNR provided by the manufacturers. Images acquired by high-cost satellite sensors showed optical quality similar to the reference sensors chosen for UAV (Tetracam Micro-MCA) and plane images (Leica DMC III).
Conversely, satellite images with lower prices per hectare showed lower optical quality. These findings highlighted that the prices of satellite images were influenced not only by data volume per hectare but in some cases also by optical quality. Free of charge satellites showed different trends. Although the images were free-of-charge, their optical quality was comparable to the referenced sensors for UAVs and planes, demonstrating the consistency of their data. However, the generalized model for satellite image prices was based only on data volume per hectare, as the optical quality influenced the price of only a limited number of satellites.
The comparison between the cost of remote sensors and the economic benefits provided by variable rate nitrogen application could be useful for farm managers who need to implement the methodology and tools to detect field variability. Medium-resolution satellites proved to be profitable for variable rate nitrogen applications for blocks bigger than 2.52 hectares. Medium-resolution satellites with spatial resolution between 10 and 15 m are accurate enough for managing variable rate fertilization with commonly used sprayers. In case higher resolution is needed, high-resolution satellites were profitable starting from 13.2 hectares, while very high-resolution ones were profitable starting from 76.8 hectares. The choice between high- and very-high-resolution should be made according to the optical quality of the sensors, which was higher in very high-resolution satellites. Plane-acquired NDVI images proved to be profitable in blocks bigger than 66.4 hectares, thus being suitable for large farms or consortiums which require high spatial resolution images. Despite the widespread growth in UAV NDVI image providers in the last few years, UAV-acquired images did not prove to be profitable for variable rate nitrogen fertilization in grains, as the average price per hectare was higher than the average economic benefits resulting from their use. However, UAVs provide very high-resolution images with suitable optical quality, and, compared to satellites, they are not influenced by cloud cover. For this reason, UAV images could be profitably used for high added value applications that could justify their cost (e.g., variability detection for precision herbicide spraying or foliar fertilizer) or for applications in crops other than grains.
In conclusion, the advantages and disadvantages of satellite, plane and UAV remote sensing for variable rate nitrogen application can be highlighted. On the one hand, satellite remote sensing was characterized by a lower break-even point in hectares, especially considering low-resolution satellites. On the other hand, medium- and high-resolution satellite image prices were affected by a minimum required area for purchase, which made these sources of data less suitable for small fields compared to wide field and regional scale applications. In terms of spatial resolution, satellite images were characterized by a wide range of values, making their application suitable for different variable rate applications. Satellite image quality, assessed as CV of NDVI simulation, showed the consistency of satellite data with the reference sensors (UAV and plane). However, low resolution satellite data were characterized by a coarse spatial resolution, making it challenging to identify specific spatial features and often requiring eliminating border pixels [57]. Conversely, plane and UAV images allowed the identification of specific spatial features, thanks to their spatial resolution and optical quality. The main disadvantages of these latter platforms consist of the price per hectare, making them profitable for variable rate nitrogen application on grains only with a wide surface (plane) or in case of high spatial variability (UAV), increasing the potential benefits provided by variable rate nitrogen application. A parallel economic profitability of variable rate nitrogen application may be performed considering active proximal sensors (e.g., GreenSeeker, Yara N-Sensor, OptRx) as providers of VIs, since these sensors are widely used in some areas (e.g., USA, Australia). In this case the economic analysis should take into account the rates of deterioration of sensors and navigation satellite systems required for their use.

Author Contributions

Conceptualization, M.S.; formal analysis, M.S.; data curation, M.S. and F.M.; writing, M.S.; review and editing, A.K., S.G., A.C. and F.M.; supervision, L.S. and F.M. All authors have read and agreed to the published version of the manuscript.

Funding

This research was financially supported by the project financed with BIRD 2020 funds, Dept. TESAF, University of Padova—Italy and by the Land Environment Resources and Health (L.E.R.H.) doctoral course.

Data Availability Statement

Price and quotation are not available due to privacy policy.

Acknowledgments

The authors wish to thank the satellite, plane, and UAV providers who participated in the survey.

Conflicts of Interest

The authors declare no conflict of interest.

References

  1. Fountas, S.; Aggelopoulou, K.; Gemtos, T.A. Precision agriculture. In Supply Chain Management for Sustainable Food Networks; John Wiley & Sons, Ltd.: Chichester, UK, 2016; pp. 41–65. ISBN 9781118937495. [Google Scholar]
  2. Shaddad, S.M.; Madrau, S.; Castrignanò, A.; Mouazen, A.M. Data fusion techniques for delineation of site-specific management zones in a field in UK. Precis. Agric. 2016, 17, 200–217. [Google Scholar] [CrossRef]
  3. Martínez-Casasnovas, J.; Escolà, A.; Arnó, J. Use of farmer knowledge in the delineation of potential management zones in precision agriculture: A case study in maize (Zea mays L.). Agriculture 2018, 8, 84. [Google Scholar] [CrossRef] [Green Version]
  4. De Benedetto, D.; Castrignano, A.; Diacono, M.; Rinaldi, M.; Ruggieri, S.; Tamborrino, R. Field partition by proximal and remote sensing data fusion. Biosyst. Eng. 2013, 114, 372–383. [Google Scholar] [CrossRef]
  5. Viscarra Rossel, R.A.; Adamchuk, V.I. Proximal soil sensing. Vadose Zo. J. 2011, 10, 1340. [Google Scholar]
  6. Madugundu, R.; Al-Gaadi, K.A.; Tola, E.; Kayad, A.G.; Hassaballa, A.A.; Patil, V.C. Seasonal dynamics of surface energy fluxes over a center-pivot irrigated cropland in Saudi Arabia. J. Environ. Biol. 2017, 38, 743–751. [Google Scholar] [CrossRef]
  7. Cillis, D.; Maestrini, B.; Pezzuolo, A.; Marinello, F.; Sartori, L. Modeling soil organic carbon and carbon dioxide emissions in different tillage systems supported by precision agriculture technologies under current climatic conditions. Soil Tillage Res. 2018, 183, 51–59. [Google Scholar] [CrossRef]
  8. Padilla, F.M.; Gallardo, M.; Peña-Fleitas, M.T.; de Souza, R.; Thompson, R.B. Proximal optical sensors for nitrogen management of vegetable crops: A review. Sensors 2018, 18, 2083. [Google Scholar] [CrossRef] [PubMed] [Green Version]
  9. Viscarra Rossel, R.A.; McBratney, A.B.; Minasny, B. Proximal Soil Sensing; Springer: New York, NY, USA, 2010; ISBN 9048188598. [Google Scholar]
  10. Jin, X.; Li, Z.; Yang, G.; Yang, H.; Feng, H.; Xu, X.; Wang, J.; Li, X.; Luo, J. Winter wheat yield estimation based on multi-source medium resolution optical and radar imaging data and the AquaCrop model using the particle swarm optimization algorithm. ISPRS J. Photogramm. Remote Sens. 2017, 126, 24–37. [Google Scholar] [CrossRef]
  11. Rouse, J.W.; Hass, R.H.; Schell, J.A.; Deering, D.W. Monitoring vegetation systems in the great plains with ERTS. In Third Earth Resources Technology Satellite-1 Symposium: The Proceedings of a Symposium Held by Goddard Space Flight Center at Washington, DC on 10–14 December 1973: Prepared at Goddard Space Flight Center (Vol. 351); Scientific and Technical Information Office, National Aeronautics and Space Administration.: Washington, DC, USA, 1974; Volume 1, pp. 309–317. [Google Scholar]
  12. Novelli, F.; Spiegel, H.; Sandén, T.; Vuolo, F.; Novelli, F.; Spiegel, H.; Sandén, T.; Vuolo, F. Assimilation of Sentinel-2 leaf area index data into a physically-based crop growth model for yield estimation. Agronomy 2019, 9, 255. [Google Scholar] [CrossRef] [Green Version]
  13. Kayad, A.; Sozzi, M.; Gatto, S.; Whelan, B.; Sartori, L.; Marinello, F. Ten years of corn yield dynamics at field scale under digital agriculture solutions: A case study from North Italy. Comput. Electron. Agric. 2021, 185, 106126. [Google Scholar] [CrossRef]
  14. Cogato, A.; Pezzuolo, A.; Sørensen, C.G.; De Bei, R.; Sozzi, M.; Marinello, F. A GIS-based multicriteria index to evaluate the mechanisability potential of Italian vineyard area. Land 2020, 9, 469. [Google Scholar] [CrossRef]
  15. Sarvia, F.; Xausa, E.; Petris, S.D.; Cantamessa, G.; Borgogno-Mondino, E. A possible role of copernicus Sentinel-2 data to support common agricultural policy controls in agriculture. Agronomy 2021, 11, 110. [Google Scholar] [CrossRef]
  16. Cogato, A.; Meggio, F.; Collins, C.; Marinello, F. Medium-resolution multispectral data from Sentinel-2 to assess the damage and the recovery time of late frost on vineyards. Remote Sens. 2020, 12, 1896. [Google Scholar] [CrossRef]
  17. Sozzi, M.; Kayad, A.; Tomasi, D.; Lovat, L.; Marinello, F.; Sartori, L. Assessment of grapevine yield and quality using a canopy spectral index in white grape variety. In Proceedings of the Precision Agriculture 2019—Papers Presented at the 12th European Conference on Precision Agriculture, ECPA 2019, Montpellier, France, 8–11 July 2019; pp. 181–186. [Google Scholar]
  18. Ma, B.L.; Morrison, M.J.; Dwyer, L.M. Canopy light reflectance and field greenness to assess nitrogen fertilization and yield of maize. Agron. J. 1996, 88, 915–920. [Google Scholar] [CrossRef]
  19. Raun, W.R.; Solie, J.B.; Johnson, G.V.; Stone, M.L.; Lukina, E.V.; Thomason, W.E.; Schepers, J.S. In-season prediction of potential grain yield in winter wheat using canopy reflectance. Agron. J. 2001, 93, 131. [Google Scholar] [CrossRef] [Green Version]
  20. Raun, W.R.; Solie, J.B.; Stone, M.L.; Martin, K.L.; Freeman, K.W.; Mullen, R.W.; Zhang, H.; Schepers, J.S.; Johnson, G.V. Optical sensor-based algorithm for crop nitrogen fertilization. Commun. Soil Sci. Plant Anal. 2005, 36, 2759–2781. [Google Scholar] [CrossRef] [Green Version]
  21. Thomason, W.E.; Phillips, S.B.; Davis, P.H.; Warren, J.G.; Alley, M.M.; Reiter, M.S. Variable nitrogen rate determination from plant spectral reflectance in soft red winter wheat. Precis. Agric. 2011, 12, 666–681. [Google Scholar] [CrossRef]
  22. Portz, G.; Molin, J.P.; Jasper, J. Active crop sensor to detect variability of nitrogen supply and biomass on sugarcane fields. Precis. Agric. 2012, 13, 33–44. [Google Scholar] [CrossRef]
  23. Arnall, D.B.; Abit, M.J.M.; Taylor, R.K.; Raun, W.R. Development of an NDVI-based nitrogen rate calculator for cotton. Crop Sci. 2016, 56, 3263. [Google Scholar] [CrossRef]
  24. Blondlot, A.; Gate, P.; Poilvé, H. Providing operational nitrogen recommendations to farmers using satellite imagery. In Proceedings of the Precision Agriculture 2005, ECPA 2005, Uppsala, Sweden, 9–12 June 2005; Volume 123, pp. 345–352. [Google Scholar]
  25. Shou, L.; Jia, L.; Cui, Z.; Chen, X.; Zhang, F. Using high-resolution satellite imaging to evaluate nitrogen status of winter wheat. J. Plant Nutr. 2007, 30, 1669–1680. [Google Scholar] [CrossRef]
  26. Huang, S.; Miao, Y.; Yuan, F.; Gnyp, M.; Yao, Y.; Cao, Q.; Wang, H.; Lenz-Wiedemann, V.; Bareth, G.; Huang, S.; et al. Potential of RapidEye and WorldView-2 satellite data for improving rice nitrogen status monitoring at different growth stages. Remote Sens. 2017, 9, 227. [Google Scholar] [CrossRef] [Green Version]
  27. Magney, T.S.; Eitel, J.U.H.; Vierling, L.A. Mapping wheat nitrogen uptake from RapidEye vegetation indices. Precis. Agric. 2017, 18, 429–451. [Google Scholar] [CrossRef]
  28. Lundström, C.; Lindblom, J. Considering farmers’ situated knowledge of using agricultural decision support systems (AgriDSS) to Foster farming practices: The case of CropSAT. Agric. Syst. 2018, 159, 9–20. [Google Scholar] [CrossRef]
  29. Georgi, C.; Spengler, D.; Itzerott, S.; Kleinschmit, B. Automatic delineation algorithm for site-specific management zones based on satellite remote sensing data. Precis. Agric. 2018, 19, 684–707. [Google Scholar] [CrossRef] [Green Version]
  30. Stamatiadis, S.; Schepers, J.S.; Evangelou, E.; Glampedakis, A.; Glampedakis, M.; Dercas, N.; Tsadilas, C.; Tserlikakis, N.; Tsadila, E. Variable-rate application of high spatial resolution can improve cotton N-use efficiency and profitability. Precis. Agric. 2019, 21, 695–712. [Google Scholar] [CrossRef]
  31. Yuan, L.; Pu, R.; Zhang, J.; Wang, J.; Yang, H. Using high spatial resolution satellite imagery for mapping powdery mildew at a regional scale. Precis. Agric. 2016, 17, 332–348. [Google Scholar] [CrossRef]
  32. Houborg, R.; McCabe, M.; Houborg, R.; McCabe, M.F. High-resolution NDVI from planet’s constellation of earth observing nano-satellites: A new data source for precision agriculture. Remote Sens. 2016, 8, 768. [Google Scholar] [CrossRef] [Green Version]
  33. Marinello, F.; Bramley, R.G.V.; Cohen, Y.; Fountas, S.; Guo, H.; Karkee, M.; Martínez-Casasnovas, J.A.; Paraforos, D.S.; Sartori, L.; Sorensen, C.G.; et al. Agriculture and digital sustainability: A digitization footprint. In Proceedings of the Precision Agriculture ’19, Montpellier, France, 8–11 July 2019; Wageningen Academic Publishers: Wageningen, The Netherlands, 2019; pp. 83–89. [Google Scholar]
  34. Ryu, C.; Suguri, M.; Umeda, M. Model for predicting the nitrogen content of rice at panicle initiation stage using data from airborne hyperspectral remote sensing. Biosyst. Eng. 2009, 104, 465–475. [Google Scholar] [CrossRef] [Green Version]
  35. Camino, C.; González-Dugo, V.; Hernández, P.; Sillero, J.C.; Zarco-Tejada, P.J. Improved nitrogen retrievals with airborne-derived fluorescence and plant traits quantified from VNIR-SWIR hyperspectral imagery in the context of precision agriculture. Int. J. Appl. Earth Obs. Geoinf. 2018, 70, 105–117. [Google Scholar] [CrossRef]
  36. Yang, C.; Everitt, J.H.; Bradford, J.M.; Escobar, D.E. Mapping grain sorghum growth and yield variations using airborne multispectral digital imagery. Trans. Am. Soc. Agric. Eng. 2000, 43, 1927–1938. [Google Scholar] [CrossRef]
  37. Yang, C.; Everitt, J.H.; Bradford, J.M. Comparison of QuickBird satellite imagery and airborne imagery for mapping grain sorghum yield patterns. Precis. Agric. 2006, 7, 33–44. [Google Scholar] [CrossRef]
  38. Mogili, U.R.; Deepak, B.B.V.L. Review on application of drone systems in precision agriculture. In Procedia Computer Science; Elsevier: Amsterdam, The Netherlands, 2018; Volume 133, pp. 502–509. [Google Scholar]
  39. Daponte, P.; De Vito, L.; Glielmo, L.; Iannelli, L.; Liuzza, D.; Picariello, F.; Silano, G. A review on the use of drones for precision agriculture. In IOP Conference Series: Earth and Environmental Science; IOPscience: Bristol, UK, 2019; Volume 275, p. 012022. [Google Scholar]
  40. Dubbini, M.; Pezzuolo, A.; De Giglio, M.; Gattelli, M.; Curzio, L.; Covi, D.; Yezekyan, T.; Marinello, F. Last generation instrument for agriculture multispectral data collection. Agric. Eng. Int. CIGR J. 2017, 19, 87–93. [Google Scholar]
  41. Sozzi, M.; Kayad, A.; Giora, D.; Sartori, L.; Marinello, F. Cost-effectiveness and performance of optical satellites constellation for Precision Agriculture. In Proceedings of the Precision Agriculture ’19, Montpellier, France, 8–11 July 2019; Wageningen Academic Publishers: Wageningen, The Netherlands, 2019; pp. 501–507. [Google Scholar]
  42. USDA. USDA Definition of Specialty Crop; USDA: Washington, DC, USA, 2016.
  43. Minařík, R.; Langhammer, J. Rapid radiometric calibration of multiple camera array using insitu data for UAV multispectral photogrammetry. In International Archives of the Photogrammetry, Remote Sensing and Spatial Information Sciences—ISPRS Archives; ISPRS: Hannover, Germany, 2019; Volume 42, pp. 209–215. [Google Scholar]
  44. Leica Geosystems AG. Leica DMC III Product Specifications; Leica Geosystems: Heerbrugg, Switzerland, 2017. [Google Scholar]
  45. Mulla, D.J. Twenty five years of remote sensing in precision agriculture: Key advances and remaining knowledge gaps. Biosyst. Eng. 2013, 114, 358–371. [Google Scholar] [CrossRef]
  46. Anderson, G.M. Error propagation by the Monte Carlo method in geochemical calculations. Geochim. Cosmochim. Acta 1976, 40, 1533–1538. [Google Scholar] [CrossRef]
  47. Hartigan, J.A.; Wong, M.A. Algorithm AS 136: A K-means clustering algorithm. Appl. Stat. 1979, 28, 100. [Google Scholar] [CrossRef]
  48. Martínez-Álvarez, F.; Troncoso, A.; Riquelme, J.C.; Riquelme, J.M. Partitioning-clustering techniques applied to the electricity price time series. Lect. Notes Comput. Sci. 2007, 4881, 990–999. [Google Scholar] [CrossRef]
  49. Ma, C.; Liu, Z.; Cao, Z.; Song, W.; Zhang, J.; Zeng, W. Cost-sensitive deep forest for price prediction. Pattern Recognit. 2020, 107, 107499. [Google Scholar] [CrossRef]
  50. Empirica Gesellschaft für Kommunikations-und Technologieforschung mbH; TÜV Rheinland. Mobile Broadband Prices in Europe; Publications Office of the European Union: Luxembourg, 2019. [Google Scholar]
  51. Eurostat. Labour Cost, Wages and Salaries, Direct Remuneration (Excluding Apprentices) by NACE Rev. 2 Activity)—LCS Surveys 2008, 2012 and 2016; Eurostat: Luxembourg, 2016. [Google Scholar]
  52. Colaço, A.F.; Bramley, R.G.V. Do crop sensors promote improved nitrogen management in grain crops? Field Crops Res. 2018, 218, 126–140. [Google Scholar] [CrossRef]
  53. Breunig, F.M.; Galvão, L.S.; Dalagnol, R.; Santi, A.L.; Della Flora, D.P.; Chen, S. Assessing the effect of spatial resolution on the delineation of management zones for smallholder farming in southern Brazil. Remote Sens. Appl. Soc. Environ. 2020, 19. [Google Scholar] [CrossRef]
  54. Wu, M.; Yang, C.; Song, X.; Hoffmann, W.C.; Huang, W.; Niu, Z.; Wang, C.; Li, W.; Yu, B. Monitoring cotton root rot by synthetic Sentinel-2 NDVI time series using improved spatial and temporal data fusion. Sci. Rep. 2018, 8, 2016. [Google Scholar] [CrossRef] [PubMed] [Green Version]
  55. Guzinski, R.; Nieto, H.; Sandholt, I.; Karamitilios, G. Modelling high-resolution actual evapotranspiration through Sentinel-2 and Sentinel-3 data fusion. Remote Sens. 2020, 12, 1433. [Google Scholar] [CrossRef]
  56. Anger, J.; de Franchis, C.; Facciolo, G. Assessing the sharpness of satellite images: Study of the planetscope constellation. In Proceedings of the IGARSS 2019—2019 IEEE International Geoscience and Remote Sensing Symposium, Yokohama, Japan, 28 July–2 August 2019; pp. 389–392. [Google Scholar] [CrossRef] [Green Version]
  57. Sozzi, M.; Kayad, A.; Marinello, F.; Taylor, J.; Tisseyre, B. Comparing vineyard imagery acquired from Sentinel-2 and unmanned aerial vehicle (UAV) platform. OENO One 2020, 54, 189–197. [Google Scholar] [CrossRef] [Green Version]
  58. Yezekyan, T.; Benetti, M.; Armentano, G.; Trestini, S.; Sartori, L.; Marinello, F. Definition of reference models for power, mass, working width, and price for tillage implements. Agriculture 2021, 11, 197. [Google Scholar] [CrossRef]
  59. Stamatiadis, S.; Schepers, J.S.; Evangelou, E.; Tsadilas, C.; Glampedakis, A.; Glampedakis, M.; Dercas, N.; Spyropoulos, N.; Dalezios, N.R.; Eskridge, K. Variable-rate nitrogen fertilization of winter wheat under high spatial resolution. Precis. Agric. 2018, 19, 570–587. [Google Scholar] [CrossRef]
  60. Ørum, J.E.; Kudsk, P.; Jensen, P.K. Economics of Site-Specific And Variable-Dose Herbicide Application; Springer: Cham, Switzerland, 2017; pp. 93–110. [Google Scholar]
  61. Farquharson, R.; Welsh, J. The Economics and Perspectives of Site Specific Irrigation Management in Australia; Springer: Cham, Switzerland, 2017; pp. 111–127. [Google Scholar]
  62. Gandorfer, M.; Meyer-Aurich, A. Economic Potential of Site-Specific Fertiliser Application and Harvest Management; Springer: Cham, Switzerland, 2017; pp. 79–92. [Google Scholar]
  63. Matese, A.; Toscano, P.; Di Gennaro, S.; Genesio, L.; Vaccari, F.; Primicerio, J.; Belli, C.; Zaldei, A.; Bianconi, R.; Gioli, B. Intercomparison of UAV, aircraft and satellite remote sensing platforms for precision viticulture. Remote Sens. 2015, 7, 2971–2990. [Google Scholar] [CrossRef] [Green Version]
  64. Sozzi, M.; Bernardi, E.; Kayad, A.; Marinello, F.; Boscaro, D.; Cogato, A.; Gasparini, F.; Tomasi, D. On-the-go variable rate fertilizer application on vineyard using a proximal spectral sensor. In Proceedings of the 2020 IEEE International Workshop on Metrology for Agriculture and Forestry (MetroAgriFor), Trento, Italy, 4–6 November 2020; pp. 343–347. [Google Scholar] [CrossRef]
  65. Roberts, R.K.; English, B.C.; Mahajanashetti, S.B. Evaluating the returns to variable rate nitrogen application. J. Agric. Appl. Econ. 2000, 32, 133–143. [Google Scholar] [CrossRef] [Green Version]
  66. Roberts, R.K.; Mahajanashetti, S.B.; English, B.C.; Larson, J.A.; Tyler, D.D. Variable rate nitrogen application on corn fields: The role of spatial variability and weather. J. Agric. Appl. Econ. 2002, 34, 111–129. [Google Scholar] [CrossRef] [Green Version]
  67. Basso, B.; Dumont, B.; Cammarano, D.; Pezzuolo, A.; Marinello, F.; Sartori, L. Environmental and economic benefits of variable rate nitrogen fertilization in a nitrate vulnerable zone. Sci. Total Environ. 2016, 545–546, 227–235. [Google Scholar] [CrossRef] [Green Version]
Figure 1. Evolution of data volume per hectare provided by different constellations of satellites. Since the first civil satellite for earth observation was launched (Landsat 1), the amount of data provided per hectare has increased from 100 B to 100 MB (Pleiades-Neo).
Agronomy 11 02098 g001
Figure 2. Comparison of UAV-acquired VI prices in Italy between 2017 and 2020 for arable and specialized crops. (A) and (B) shows the price for arable and specialized in 2017 and 2020. (C) and (D) shows the price in 2017 and 2020 for arable and specialized crops. The average price of a VI map acquired by UAVs decreased by 28.5% between 2017 and 2020.
Agronomy 11 02098 g002
Figure 3. Comparison of different platforms for image acquisition considering only the price per hectare in 2020 (without fixed costs for take-off, minimum order area, elaboration, and processing costs).
Agronomy 11 02098 g003
Figure 4. Signal-to-Noise ratio of sensors and CV of NDVI simulation as error estimation.
Agronomy 11 02098 g004
Figure 5. Loading plot of the first and the second principal components of satellites features obtained from PCA.
Agronomy 11 02098 g005
Figure 6. Linear model of price per hectare based on data volume per hectare.
Agronomy 11 02098 g006
Figure 7. Break-even point of different sensor platforms used for site-specific nitrogen application (halo represents data distribution with a confidence interval of 95%; data are in logarithmic scale).
Agronomy 11 02098 g007
Table 1. Sensor features and data sources. Additional data were retrieved from the ESA satellite mission database (https://directory.eoportal.org/web/eoportal/satellite-missions, accessed on 20 February 2019). * data represent the panchromatic resolution ** data obtained from survey *** data obtained from Equation (1).
Platform
Name
Minimum
Area
Price per HectareData Volume per HectareSpatial Resolution *Radiometic ResolutionRevisit
Time
Data
Source
ha minEUR ha−1 **KB ha−1 ***mBits Pixel−1Days
Deimos-210,0000.05512.70.75102www.elecnor-deimos.com, accessed on 20 February 2019
Dove (Planet)10,0000.0118.893161www.planet.com, accessed on 20 February 2019
Formosat-214,4000.0283.13281www.nspo.narl.org.tw, accessed on 20 February 2019
GaoFen-225000.04134.20.8145www.cast.cn, accessed on 20 February 2019
GeoEye-110.0000.2501020.5113www.maxar.com, accessed on 5 July 2020
KazEOSat-125000.0576.253121www.airbus.com, accessed on 5 July 2020
Kompsat-225000.05021.91146www.kari.re.kr, accessed on 20 February 2019
Kompsat-325000.10044.60.7143www.kari.re.kr, accessed on 20 February 2019
Kompsat-3A25000.14572.30.55143www.kari.re.kr, accessed on 20 February 2019
Landsat-7/83,700,0000.20315128www.nasa.gov, accessed on 20 February 2019
Pleiades-110,0000.19375.00.5121www.airbus.com, accessed on 20 February 2019
Rapideye10,0000.0113.005125.5www.planet.com, accessed on 20 February 2019
Sentinel-21,200,0000.83810165www.esa.int, accessed on
Spot-6/710,0000.0418.331.5121www.airbus.com, accessed on 20 February 2019
Superview-110,0000.22768.80.5114www.spaceview.com, accessed on 20 February 2019
TripleSat25000.07324.40.8101www.earthi.space, accessed on 20 February 2019
WorldView-3/410,0000.2501790.3111www.maxar.com, accessed on 20 February 2019
Plane (Leica DMC III)1.6890000.112www.leica-geosystems.com, accessed on 14 April 2020
UAV (Tetracam µ-MCA)43.425,0000.0510www.tetracam.com, accessed on 14 April 2020
Table 2. Description of final prices composition: dataset was populated with prices detected from different providers of UAV, Plane and satellite acquired images.
UAVPLANESATELLITE
Dataset44 prices from
22 companies in 2017
22 prices
from 11 companies in 2020
Six prices from four
companies
62 prices from 17 constellation of satellites
Price and sensors
features
-Price per hectare(€ ha−1)
Reference sensor:
Tetracam Micro-MCA [43]
-Price per hectare(EUR ha−1)
-Take off cost
Reference sensor:
Leica DMC III [44]
Sensor properties used:
-Price per hectare(EUR ha−1)
-Minimum Area (ha)
-Data Volume per Hectare (KB ha−1)
NDVI
elaboration
Included in price per
hectare
Included in price per
hectare
Download cost:
-Data Volume per Hectare (KB ha−1)
-Price per Data Volume (EUR KB−1) [50]
Correction cost:
150 (VHR)-100(HR)–50 (MR) EUR
Processing cost75 EUR75 EUR75 (VHR)/50(HR)/25(MR) EUR
Table 3. Average satellite cluster features.
Price per HectareData Volume per HectareSpatial ResolutionRadiometic ResolutionRevisit
Time
CV of NDVI
EUR minKB ha−1mBits Pixel−1Days
MR76.10.5212.514.06.500.501%
HR43421.81.5512.43.140.737%
VHR25271060.4511.32.250.579%
Table 4. Equation of value of service according to hectare variation.
ServicesEquations
UAV V a l u e = 43.6 × h a + 75
Plane V a l u e = 1.75 × h a + 2075 .
VHR V a l u e = 6 × 10 16 × h a + 2536
HR V a l u e = 8 × 10 17 × h a + 434
MR V a l u e = 2 × 10 17 × h a + 83.1
Profitability V a l u e = 33 × h a
Table 5. Break-even point in hectare and EUR for each sensor.
Break-Even Points
SensorsHectaresEUR
MR2.5283.1
HR13.2434
Plane66.42191
VHR76.82536
UAVn/an/a
Publisher’s Note: MDPI stays neutral with regard to jurisdictional claims in published maps and institutional affiliations.

