Article

Socio-Economic Implications and Potential Structural Adaptations of the Tunisian Agricultural Sector to Climate Change

1
International Center for Agricultural Research in the Dry areas (ICARDA), Tunis 2049, Tunisia
2
Research Center in Applied Economics for Development (CREAD), Alger BP.197, Algeria
3
National Institute for Research in Rural Engineering, Water & Forestry (INRGREF), Carthage University; P.O. Box 10, Tunis 2080, Tunisia
4
National Agronomic Institute of Tunisia, Carthage University, Tunis 1054, Tunisia
*
Author to whom correspondence should be addressed.
Submission received: 6 September 2021 / Revised: 15 October 2021 / Accepted: 18 October 2021 / Published: 21 October 2021
(This article belongs to the Special Issue Transforming AgriFood Systems under a Changing Climate)

Abstract

:
Climate change is expected to have serious economic and social impacts on Tunisian rural farmers. The extent of these impacts will largely depend on the level of political and structural adaptations. This study aims to evaluate the effect of increasing water shortages on agricultural income and employment. It also analyzes structural adaptation strategies implemented by farmers in response to this challenge. We have therefore developed a regionally disaggregated supply model to simulate three types of scenarios concerning (i) decreasing quantities of irrigation water at the regional level; (ii) enhanced irrigation water use efficiency; and (iii) higher production prices. Observed crop production data for 21 crops and 24 districts of Tunisia have been used. Districts have been aggregated into five regions based on bioclimatic homogeneity. Results show that climate change will lead to the reduction of irrigated areas and an increased importance of rainfed agriculture. It will also have a negative impact on farm income and employment. This negative effect can be fully mitigated by improving water use efficiency, at farm and perimeter levels, and can be reversed by offering more attractive producer prices to farmers through enhanced value chain integration.

1. Introduction

The agricultural sector in Tunisia is economically and socially important. It has important implications on water and land resources, as most of the water resources (about 80%) and fertile lands are used for food production. The sector also has a significant contribution to developing exports and reducing the country’s trade deficits [1,2,3], as well as supporting employment generation and reduction of the rural exodus in the marginalized regions of Tunisia. The Tunisian population is around 11.6 million, while the total GDP in 2019 was around USD 51,515.3 million (at constant 2010 prices), leading to a GDP per capita of about USD 3447 (at current prices of 2019). Agricultural land occupies about 65% of the total area of Tunisia and contains 516,000 farms. The total agricultural land has increased from 86,480 km2 in 1961 to 100,730 km2 in 2016, including 4.9 million hectares of arable land and 4 million hectares actually cultivated in 2016. Agriculture employs more than 15% of the country’s labor force. It contributes 9% to the GDP and represents 7.5% of economic investments. It represents 9% of exports and 8% of imports [4].
The main cultivated crops in Tunisia are cereals, olives, dates, and fresh fruits equally important for export and domestic consumption. Livestock production, especially small ruminants (sheep and goats) and dairy cattle, is also important and contributes about 48% to the total agricultural GDP. Vegetables such as tomatoes and potatoes occupy a smaller portion of land and generally produce to supply local markets. The livestock production index is characterized by a stable increase, unlike the crop production and food indexes, which are, rather, fluctuating due to climate variability.
These global sectoral characteristics and figures will be affected by the future expected climate change and water stress. It is thus important to assess the impact of water scarcity on the macroeconomic contribution of the agricultural sector to total GDP, employment and poverty. It is further relevant to consider developing future scenarios of structural changes which can help in maintaining (and perhaps optimizing) the economic and social contribution of the agricultural sector through enhanced land use and resources allocation. This means providing guidelines for irrigated and rainfed land allocation which can enhance the overall water productivity and valuation in the agricultural sector of Tunisia. From an economic development perspective, climate change adaptation and mitigation measures need to be integrated into global, national, and local development policies, approaches and strategies. They need to be considered when planning for future strategic structural changes as part of countries’ adaptation and mitigation plans. Thus, appropriate policies (incentives and others) need to be considered to encourage a shift towards more sustainable production systems and economic development. However, studies which assess and provide pathways and future agricultural development scenarios based on accurate projections of constraints and opportunities remains very scarce in the literature focusing on the specific case of Tunisia.
The objective of this paper is to provide pathways for future adaption to climate change by optimizing land allocation in Tunisia. To do so, we used the positive mathematical program (PMP) method to construct and calibrate an agricultural supply model (ASM) which represents both rainfed and irrigated sectors in Tunisia with the aim of optimizing land allocation across 21 (fruits, cereals, and vegetables) crops and 24 districts of the country. The optimization will be conducted under different scenarios of water scarcity (−25% of water availability), higher irrigation water use efficiency, and changes in crop prices. The ASM will then provide optimal land allocation in each of the regions based on maximizing the marginal water value for the set of crops cultivated in the given considered districts. The rest of the paper provides an overview of the potential impacts of climate change and water scarcity on macroeconomic aggregates. This will be followed by a methodology section where the “agricultural supply model of Tunisia” (ASMOT) model will be presented, and finally, this paper will end with results and discussions.

2. Literature Framework: Impact of Climate Change on Agriculture

Several studies have assessed the potential impact of climate change at regional, community, and household levels and highlight changes on livelihoods and respective adaptation options in developing countries [5,6,7]. It appears that the most frequent farmers’ responses were related to crop diversification and integration of livestock, changing crop and seedling schedules, and replacement of traditional varieties with late varieties having shorter growing (or different) cycles [8,9,10,11,12,13,14]. Studies conducted in Ghana by [15,16] reveal that farmers who are well aware of climate change are more likely to reduce rice cultivation in favor of less water- and labor-intensive crops, such as peanuts. Other authors, such as [17,18], who used modelling to study the impact of reduced water availability and climate change have shown a change in crop production. More specifically, irrigated areas will be transformed to dryland crop production. It also appears that farmers do not change crops in an arbitrary way. They rather choose crops that generate higher profits in order to improve their living conditions and make agricultural systems less vulnerable to climate variability [19,20]. Similarly, [16] reports that farmers in Ghana are switching to cash crops to adapt to climate change. These changes are sometimes accompanied by technological change. Further studies show that climate change leads to technical innovations, such as the use of solar energy [21,22] and the expansion of the use of water-efficient irrigation systems [23,24].
Another important impact of climate change is related to the socio-economic conditions of farmers. Climate change will have an economic and social impact on a major proportion of the population where agriculture is the main source of livelihood [25]. The impacts of climate change have increased population poverty levels, reduced employment and income opportunities, reduced individual livelihood diversification and increased emigration [26,27]. On the other hand, due to lower production and employment, [28] show a negative effect on agricultural GDP in the Legal Amazon. A study conducted by [29] on small-scale coffee farms in Mexico reveals that rainfall variability impacted farmers’ incomes and made agricultural activities no longer viable. It is further known that climate change will affect the annual availability and domestic supply of agri-food products. These changes in the supply of certain commodities, due to the lack of rainfall and other sources of water supply, may further effect input and output market prices [30,31] and increase social inequalities [32], thus threatening the viability of smallholder farmers. As a result, [29,33] report that members of smallholder households would immigrate temporarily or permanently to work in non-agricultural activities.
Wide heterogeneity exists across households in terms of impact and adaptation to climate change and water shortage. In arid areas, these impacts and adaptations are influenced by several factors attributed to spatial variability (i.e., physical environment), type of production and other household and farm characteristics [34,35]. In their studies. [36] highlight the importance of awareness and knowledge about local contexts and specific climate change aspects as main determinants of farmers’ adaptation to climate change. Other authors [37,38] found that education and the level of human capital may contribute to improving farmers’ perception of risks and influencing farmers’ practices and adaptations. Other studies show that the level of education of the head of the household is positively correlated with the adoption of new technologies, which help to adapt to climate change [39,40].

3. Materials and Methods: The ASMOT Model and Scenarios of Water Scarcity and Efficiency

The ASMOT model is an agricultural supply model (ASM) calibrated through positive mathematical programming (PMP) [41]. It is the first model of its kind to be developed for Tunisia. Two types of data were used to calibrate the model. Primary data on the quantities of inputs used (water, labour, and land) and the outputs obtained at the regional level were completed by official statistics on land use and the availability of land and water.
ASMOT considers the 21 main crops in Tunisia classified into 4 groups: cereals, olives and almond, fruits trees, and vegetables (Table 1). ASMOT includes 67% of the total agricultural area (3.34 Million ha) and 78% of the total irrigated areas (352 thousand ha illustrated in the model) of Tunisia. These agricultural and irrigated areas are distributed across 23 districts of Tunisia (Table 1), which have been then grouped (in the model) into 5 bioclimatic regions (Northwest, Northeast, Central West, Central East and South) (Figure 1 and Table 1).
ASMOT optimizes regional agricultural GDP by re-allocating land use at the regional level, and then aggregates into a national agricultural GDP. The optimization process is conducted under a set of biophysical (regional water availability) and economic (marginal return of commodities in the different regions) constraints (see next section).

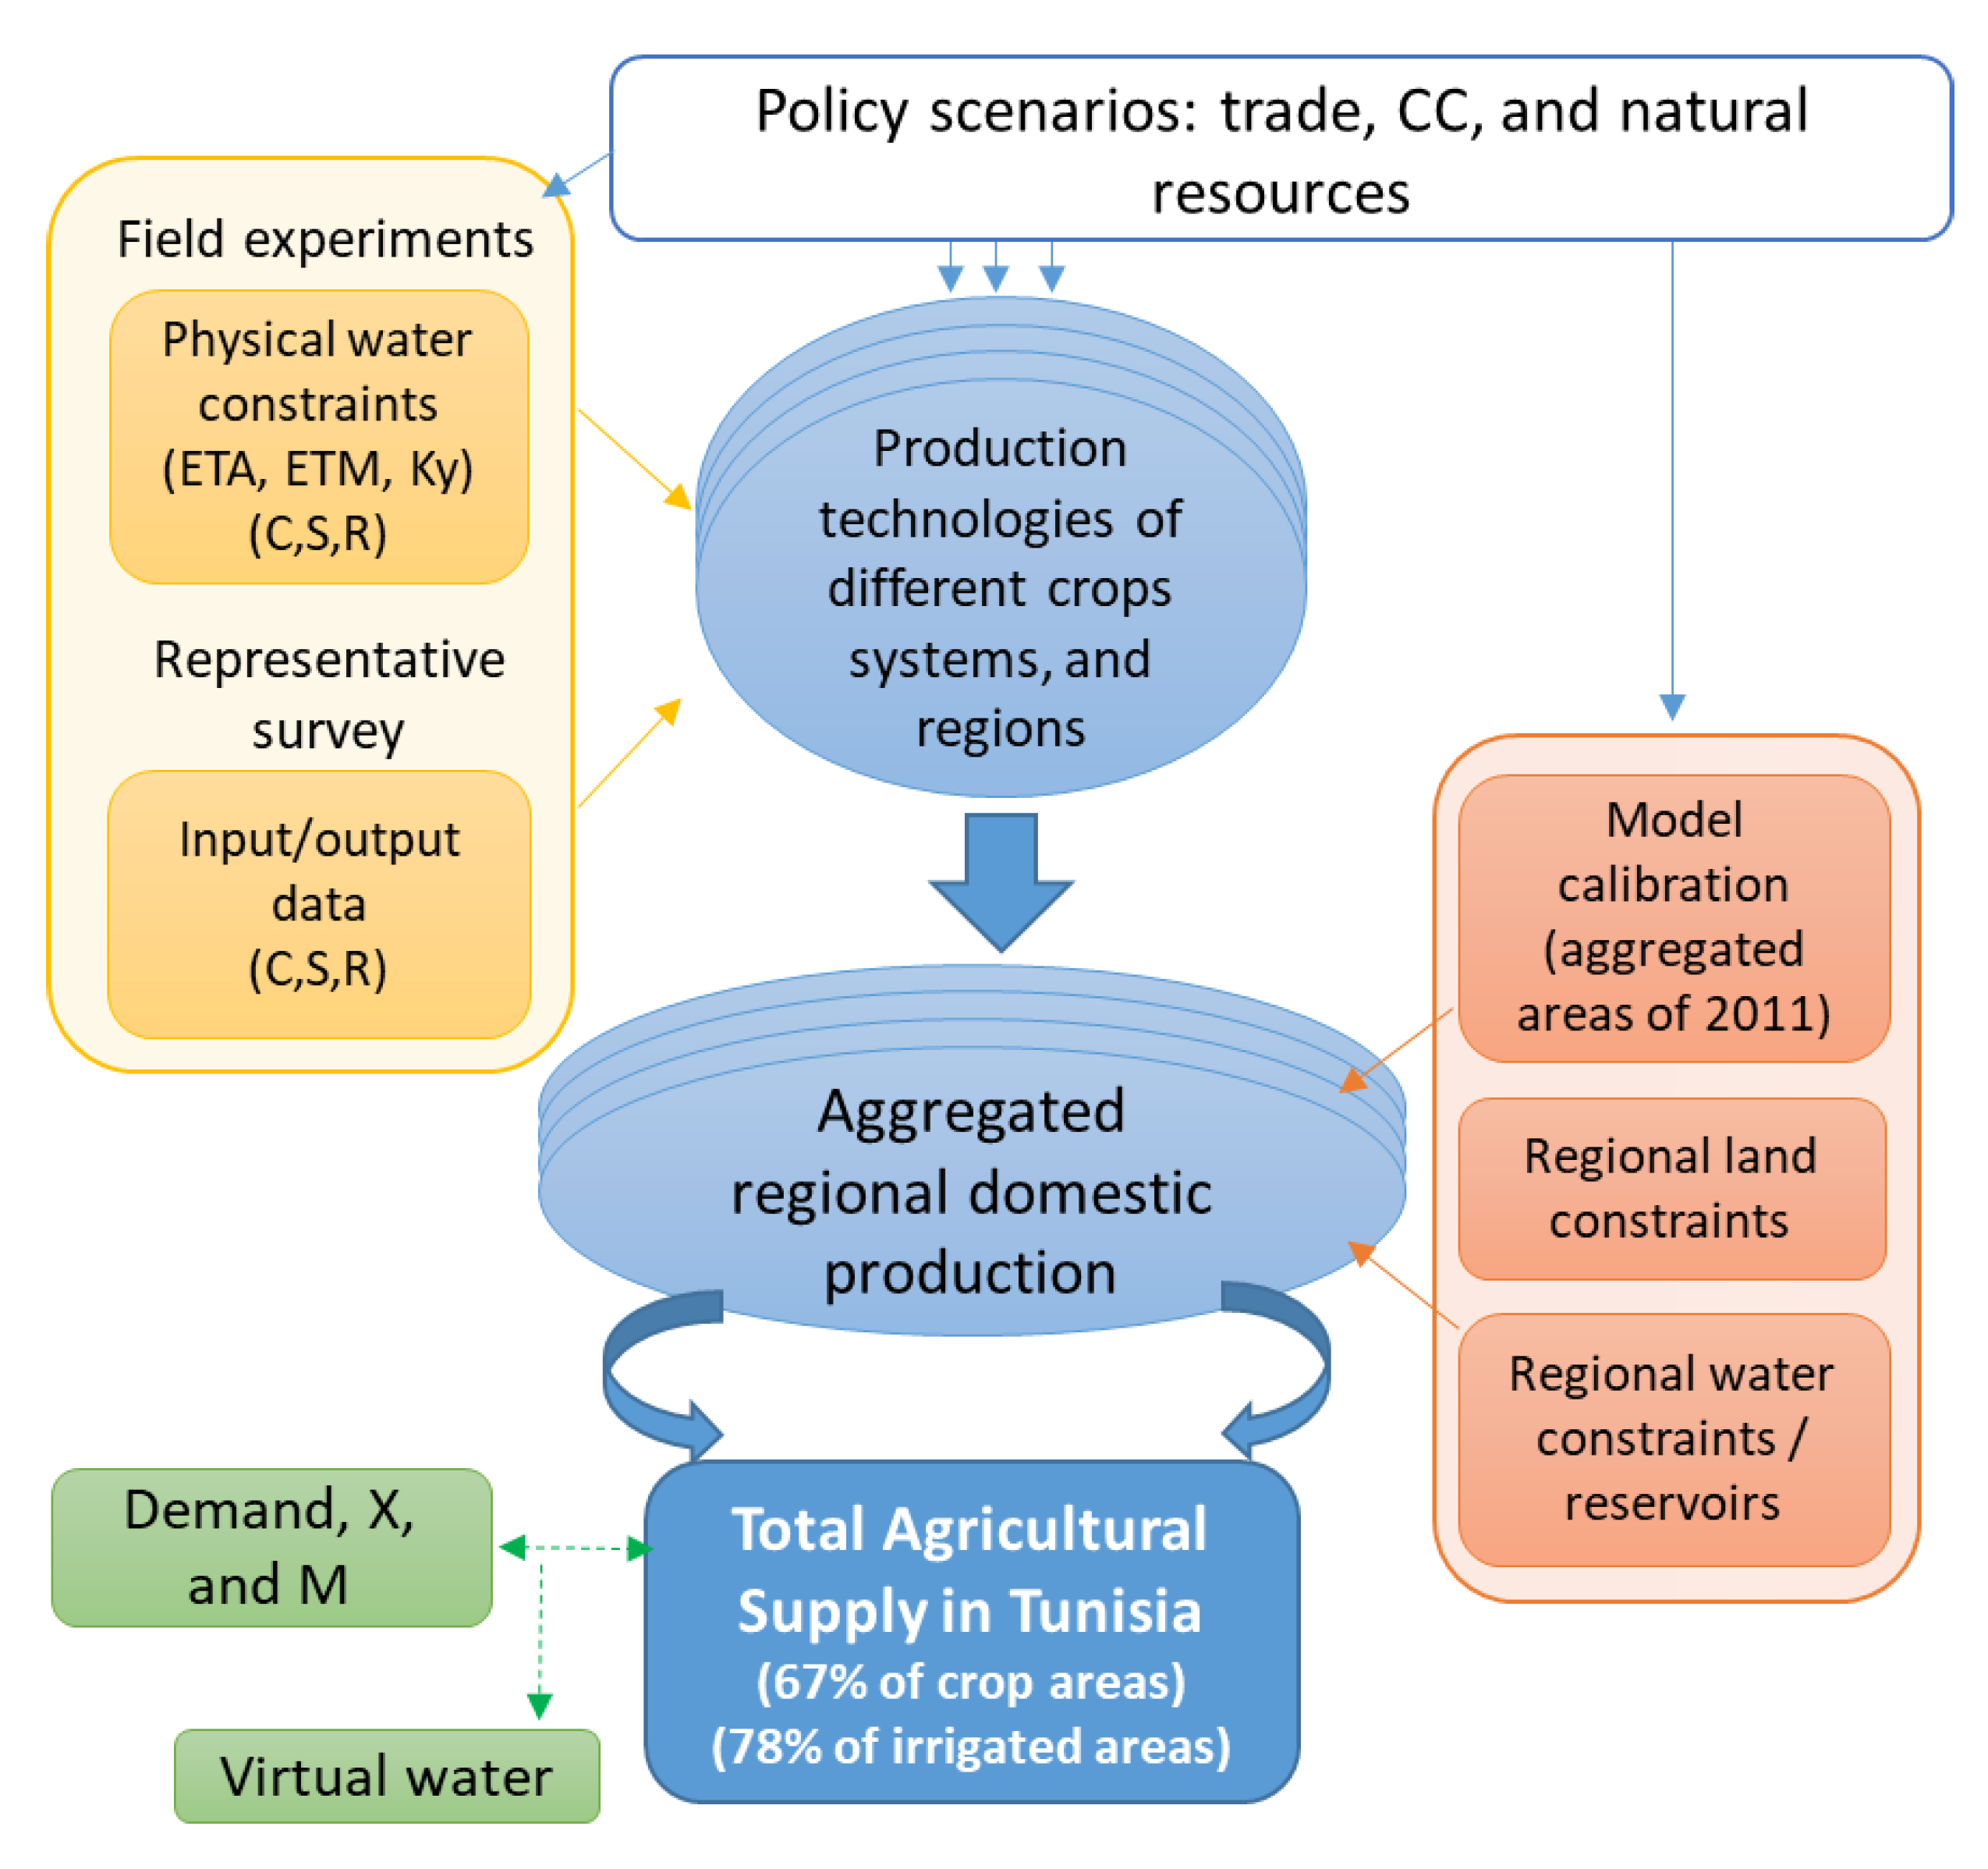
3.1. Structure of the ASMOT Model

The aggregated agricultural supply Equation (1) of the model calculates the aggregated gross value of the agricultural supply in Tunisia as the sum of regional agricultural gross production values. Equation (1) can be read as follows:
AS c , s = r RAS r , c , s = r { [ P c ( Y r , c , s Δ Y r , c , s ) ] [ A C r , c , s + WP r ] }   X r , c , s
where ASc,s is the total agricultural supply of different crops (c) in given (rainfed or irrigated) systems (s). RASr,c,s indicates the aggregated value of the regional (r) agricultural production by region for all crops and systems existing in a given region. Pc is the farm-gate price of crop c, Yr,c,s is the crop yield, and ΔY is the calculated variation of yields under hydric stress (higher temperatures and evaporations). ΔY is calculated based on Equation (2) to account for the potential impact of higher evapotranspiration values and their respective effect on yields. AC is the average cost of crop production (not including water costs). WP is the irrigation water price in the different considered regions. Finally, Xc,r,s is the main variable of the model objective function (agricultural supply equation) and is defined as being the crop area under rain-fed and irrigated systems in the different considered regions. The observed values of Xc,r,s for 2011 have been used for PMP calibration of the model (1). Once the model is calibrated, the ‘Xc,r,s’ variable (referring to land use) can be optimized under different contexts/scenarios. The resulting values of ‘Xc,r,s’ under a given scenario (e.g., lower water availability) provides optimal land allocation by region across different crops and systems which can maximize the agricultural GDP in Tunisia under the model constraints. Yield variation ΔY is calculated as follows:
Δ Y r , c , s =   Y ky   ( 1 Eta ETM )
where ky is the coefficient of yield variation, and Eta and ETM are, respectively, the real and maximal evapotranspiration.
c , s X r , c , s   A r
c , ( s = i r r ) X r , c , s   I A r
( c = t r e e s ) , s X r , c , s   T A r + ( 1 + γ c = t r e e s )  
c , s w r , c , s X r , c , s   W A r
X r , c , s   X r , c , s o ( 1 + ε )
Constraint 3 ensures that the total cultivated area in each region is equal or lower to the currently observed cultivated area. Constraint (4) indicates that the sum of irrigated crop areas in each region should not exceed the total irrigable areas (IA) available in that region. Constraint (5) bounds the annual tree area expansion in each region to its historical annual growth rate of the last 20 years. Constraint (6) indicates that the sum of all crops’ water requirements in each region does not exceed water availability (WA) in that region. Constraint (7) is a PMP calibration constraint. The objective of this constraint is to estimate the calibration coefficients ( α and β) of the ASMOT cost function. The average cost (AC) function is a nonlinear equation (Equation (8)) estimated using both coefficients α and β, which were, in turn, calculated by solving Equation (1) under the set of all considered constraints (3–7), including the calibration constraint [41,42]. Coefficients α and β were estimated using the dual values of constraints (7) and following the approach of [42,43], where additional exogenous information about land rents was used for α and β estimation. The PMP approaches used in this work has been widely validated and approved for modelling and calibrations [44,45,46,47,48,49].
  A C r , c , s = α r , c , s + 1 2 β r , c , s   X r , c , s
Once α and β are known, Equation (8) will be replaced in Equation (1), thus resulting in the following nonlinear calibrated objective function (9).
AS c , s = r RAS r , c , s = r { [ P c ( Y r , c , s Δ Y r , c , s ) ] [ ( α r , c , s + 1 2 β r , c , s ) + WP r ] }   X r , c , s
The final step of our model building refers to the validation of the calibration process. To do so, we optimize Equation (1) under all constraints, except the initial calibration, Equation (7). If the results are the same as the initial land allocation observed during the base year, then we assume that our model is well validated and can be used for scenario simulations. Results of AMOST validation and calibration will be presented in the Results section.

3.2. Source of Data

Several methods and data of different sources have been used to build the ASMOT model. First, surveys of farmers during the 2012/2013 season in all provinces of Tunisia (conducted by the “Virtual Water and Food Security in Tunisia” (EVSAT) research project, funded by the IDRC) allowed us to collect input and output data of the 21 considered crops for each province. In addition, focus groups with regional experts in crop production were conducted to verify the coherence of data collected from farmers. Other coefficients of the model, such as the annual tree area growth rates, were calculated based on historical FAO data (FAOstat). In addition, secondary data on water availability and land tenure by crop and by type of production system (irrigated or rainfed) were obtained from official national data listed on the ONAGRI (Observatoire National de l’Agriculture) open data platform. Finally, field experimental studies conducted by the EVSAT research team during the years 2012 and 2013 helped to measure water requirements and evapotranspiration coefficients of different crops in different systems and regions.

3.3. Water and Price Scenarios

In this study, we simulated different scenarios (Table 2) centered on decreased water availability. Indeed, like [50], we consider that Tunisia will face water scarcity in the coming years. These same authors estimate an average annual decrease of 28% in rainfall in the northern regions of Africa by the end of the next decade. In addition to this, demand from other sectors (urban and economic sectors) will certainly increase. As a result, the amount of water allocated to the agricultural sector will be reduced. Accordingly, our first scenario refers to a reduction of water availability by 25%. Our second scenario will consider an enhancement of irrigation water use efficiency (IWUE) at the plot level. Research carried out by [51] has shown that the EUE is close to 55% at the national level and that this level of efficiency could be improved by giving more importance to water-saving technologies (which occupy only 69% of the total irrigated area in Tunisia), among others. The third scenario simulates increased producers’ prices in parallel with the decrease in water availability and the improvement of IWUE. Enhanced producer prices may be possible by improving agricultural value chains [52], which can be considered as indirect market incentives allowing farmers to increase their technical investments and adaptation capacities [53,54]. Better producer prices for some commodities may also have an effect on farmers’ decisions to shift to more profitable crops which may (or not) result in better water valuation. Table 2 summarizes the three scenarios simulated by the ASMOT model. Results of these scenarios will be compared to a status quo scenario referring to the baseline trend with no changes in terms of water availability, WUE, and market prices.

4. Results

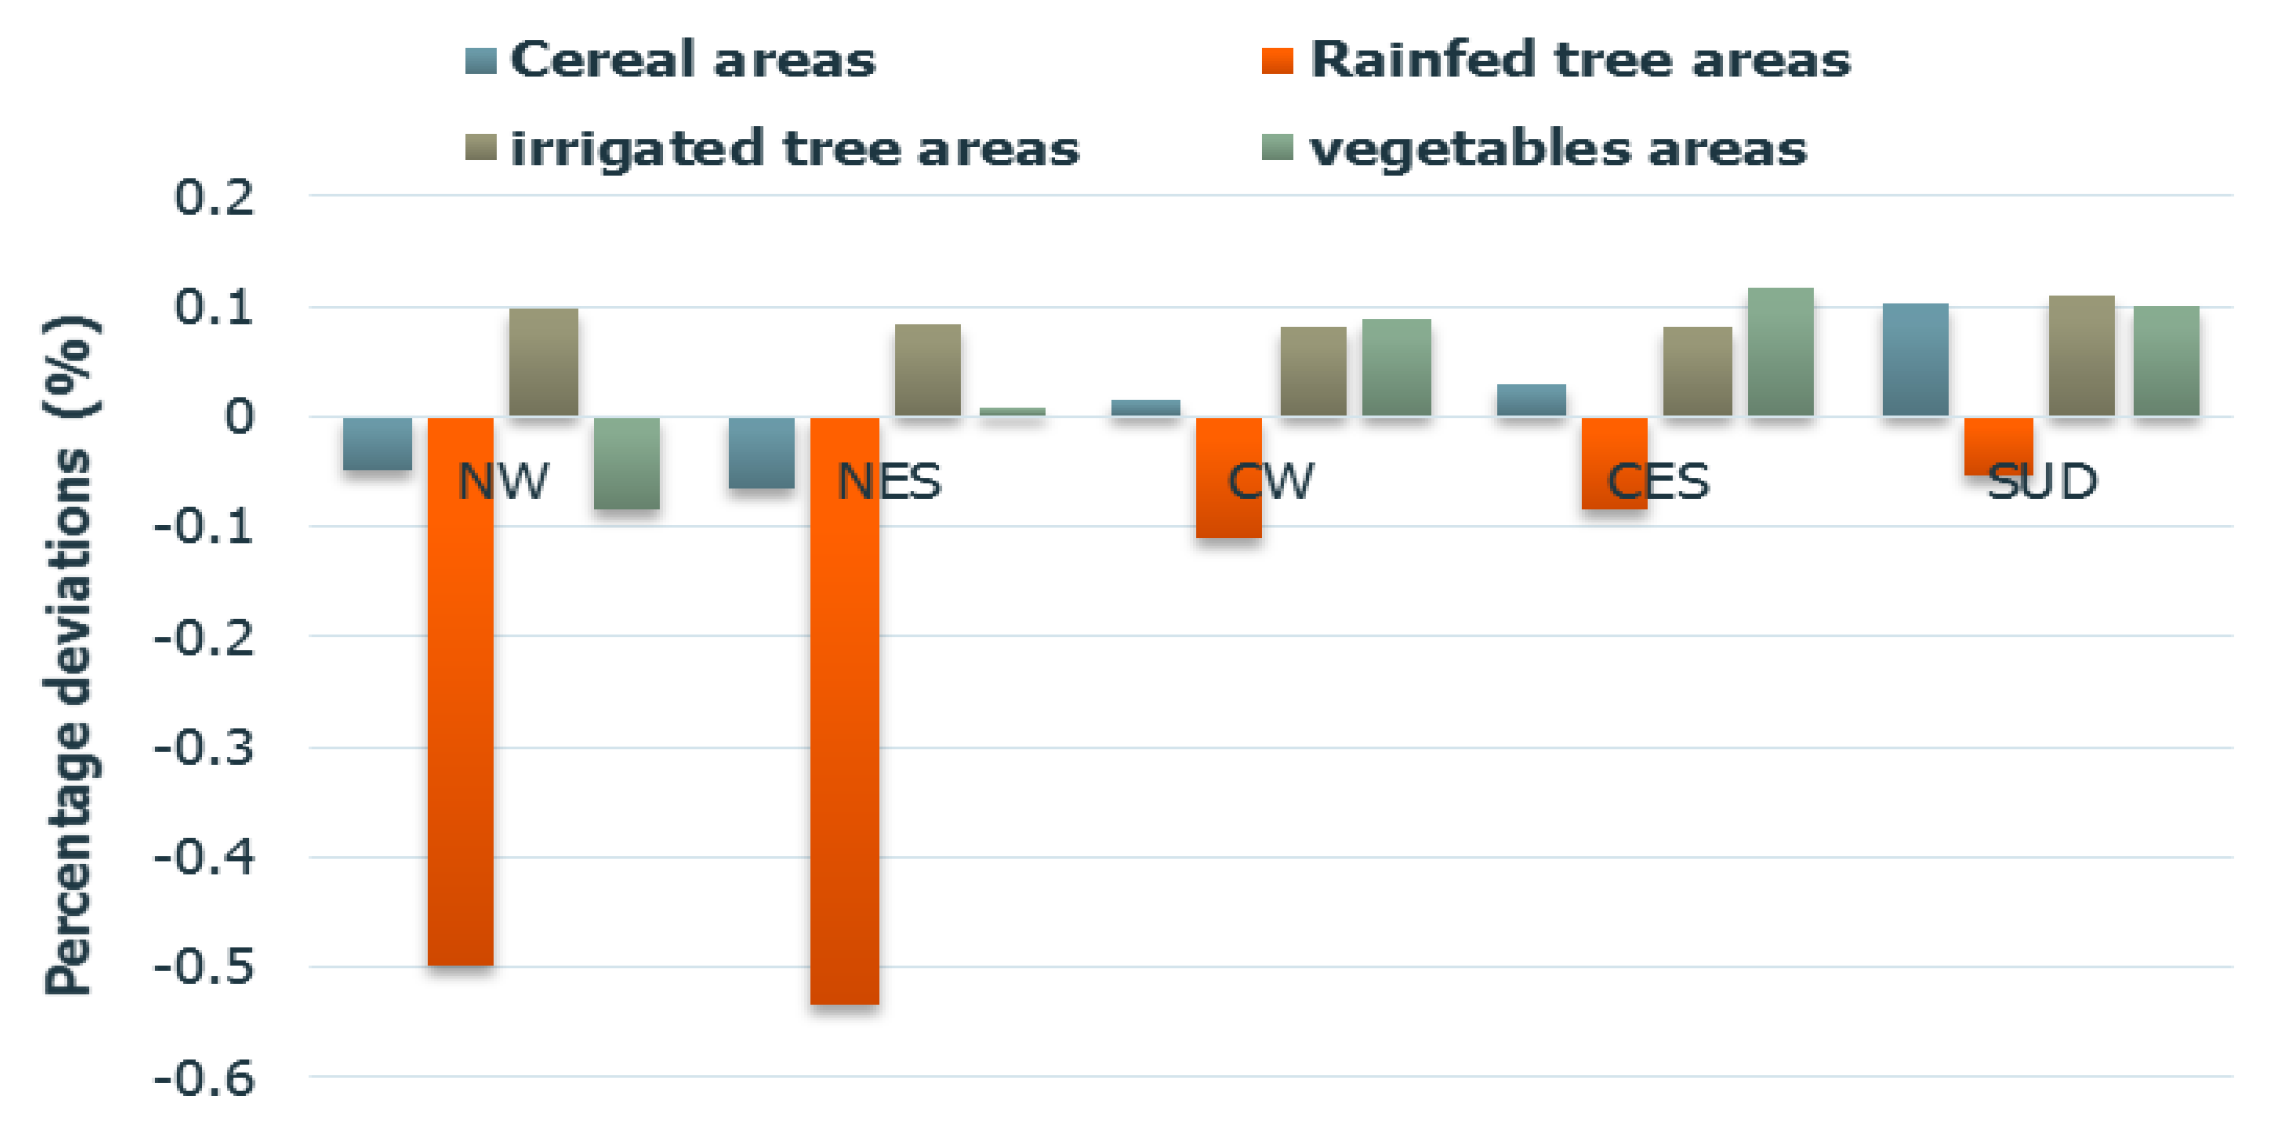
4.1. Model Calibration

In this study, we used the PMP method introduced by [41] for our farm model calibration. Model calibration consists of replicating the situation observed during a reference year (Table 3). In our case, data from 2011 was used during the calibration. After calculating the calibration coefficients of the objective function (Equation (8)), the ASMOT model has been relaunched to see if the results of the status quo simulation correspond to the observed crop allocation (see Figure 2).
Figure 2 shows that deviations of simulated land use variables (Xr,c,s) compared to the observed values of 2011 are almost all in range [−1%, 1%], meaning that the model is well calibrated [47] and can be a credible tool for scenario simulations. The next step is the modification of the appropriate parameters (such as the amount of water and the price of different products) to simulate changes in farmers’ practices to cope with the external shocks.

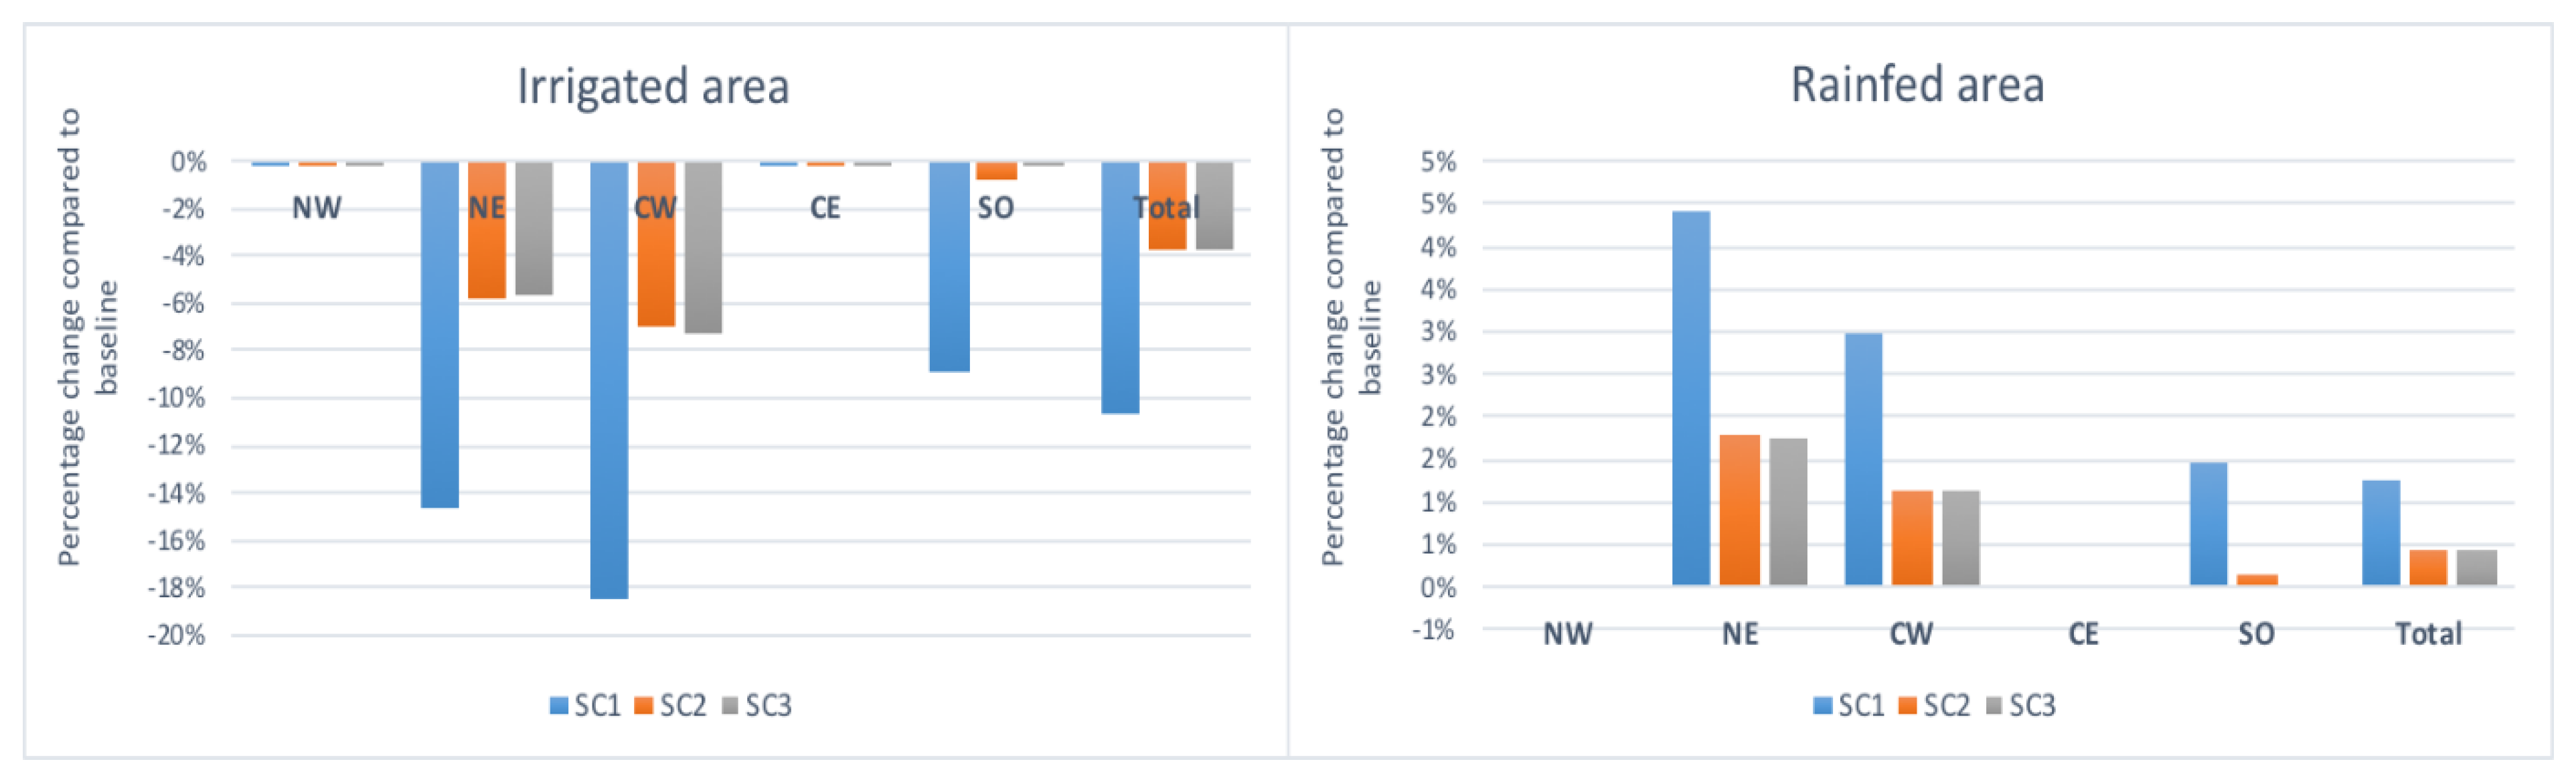
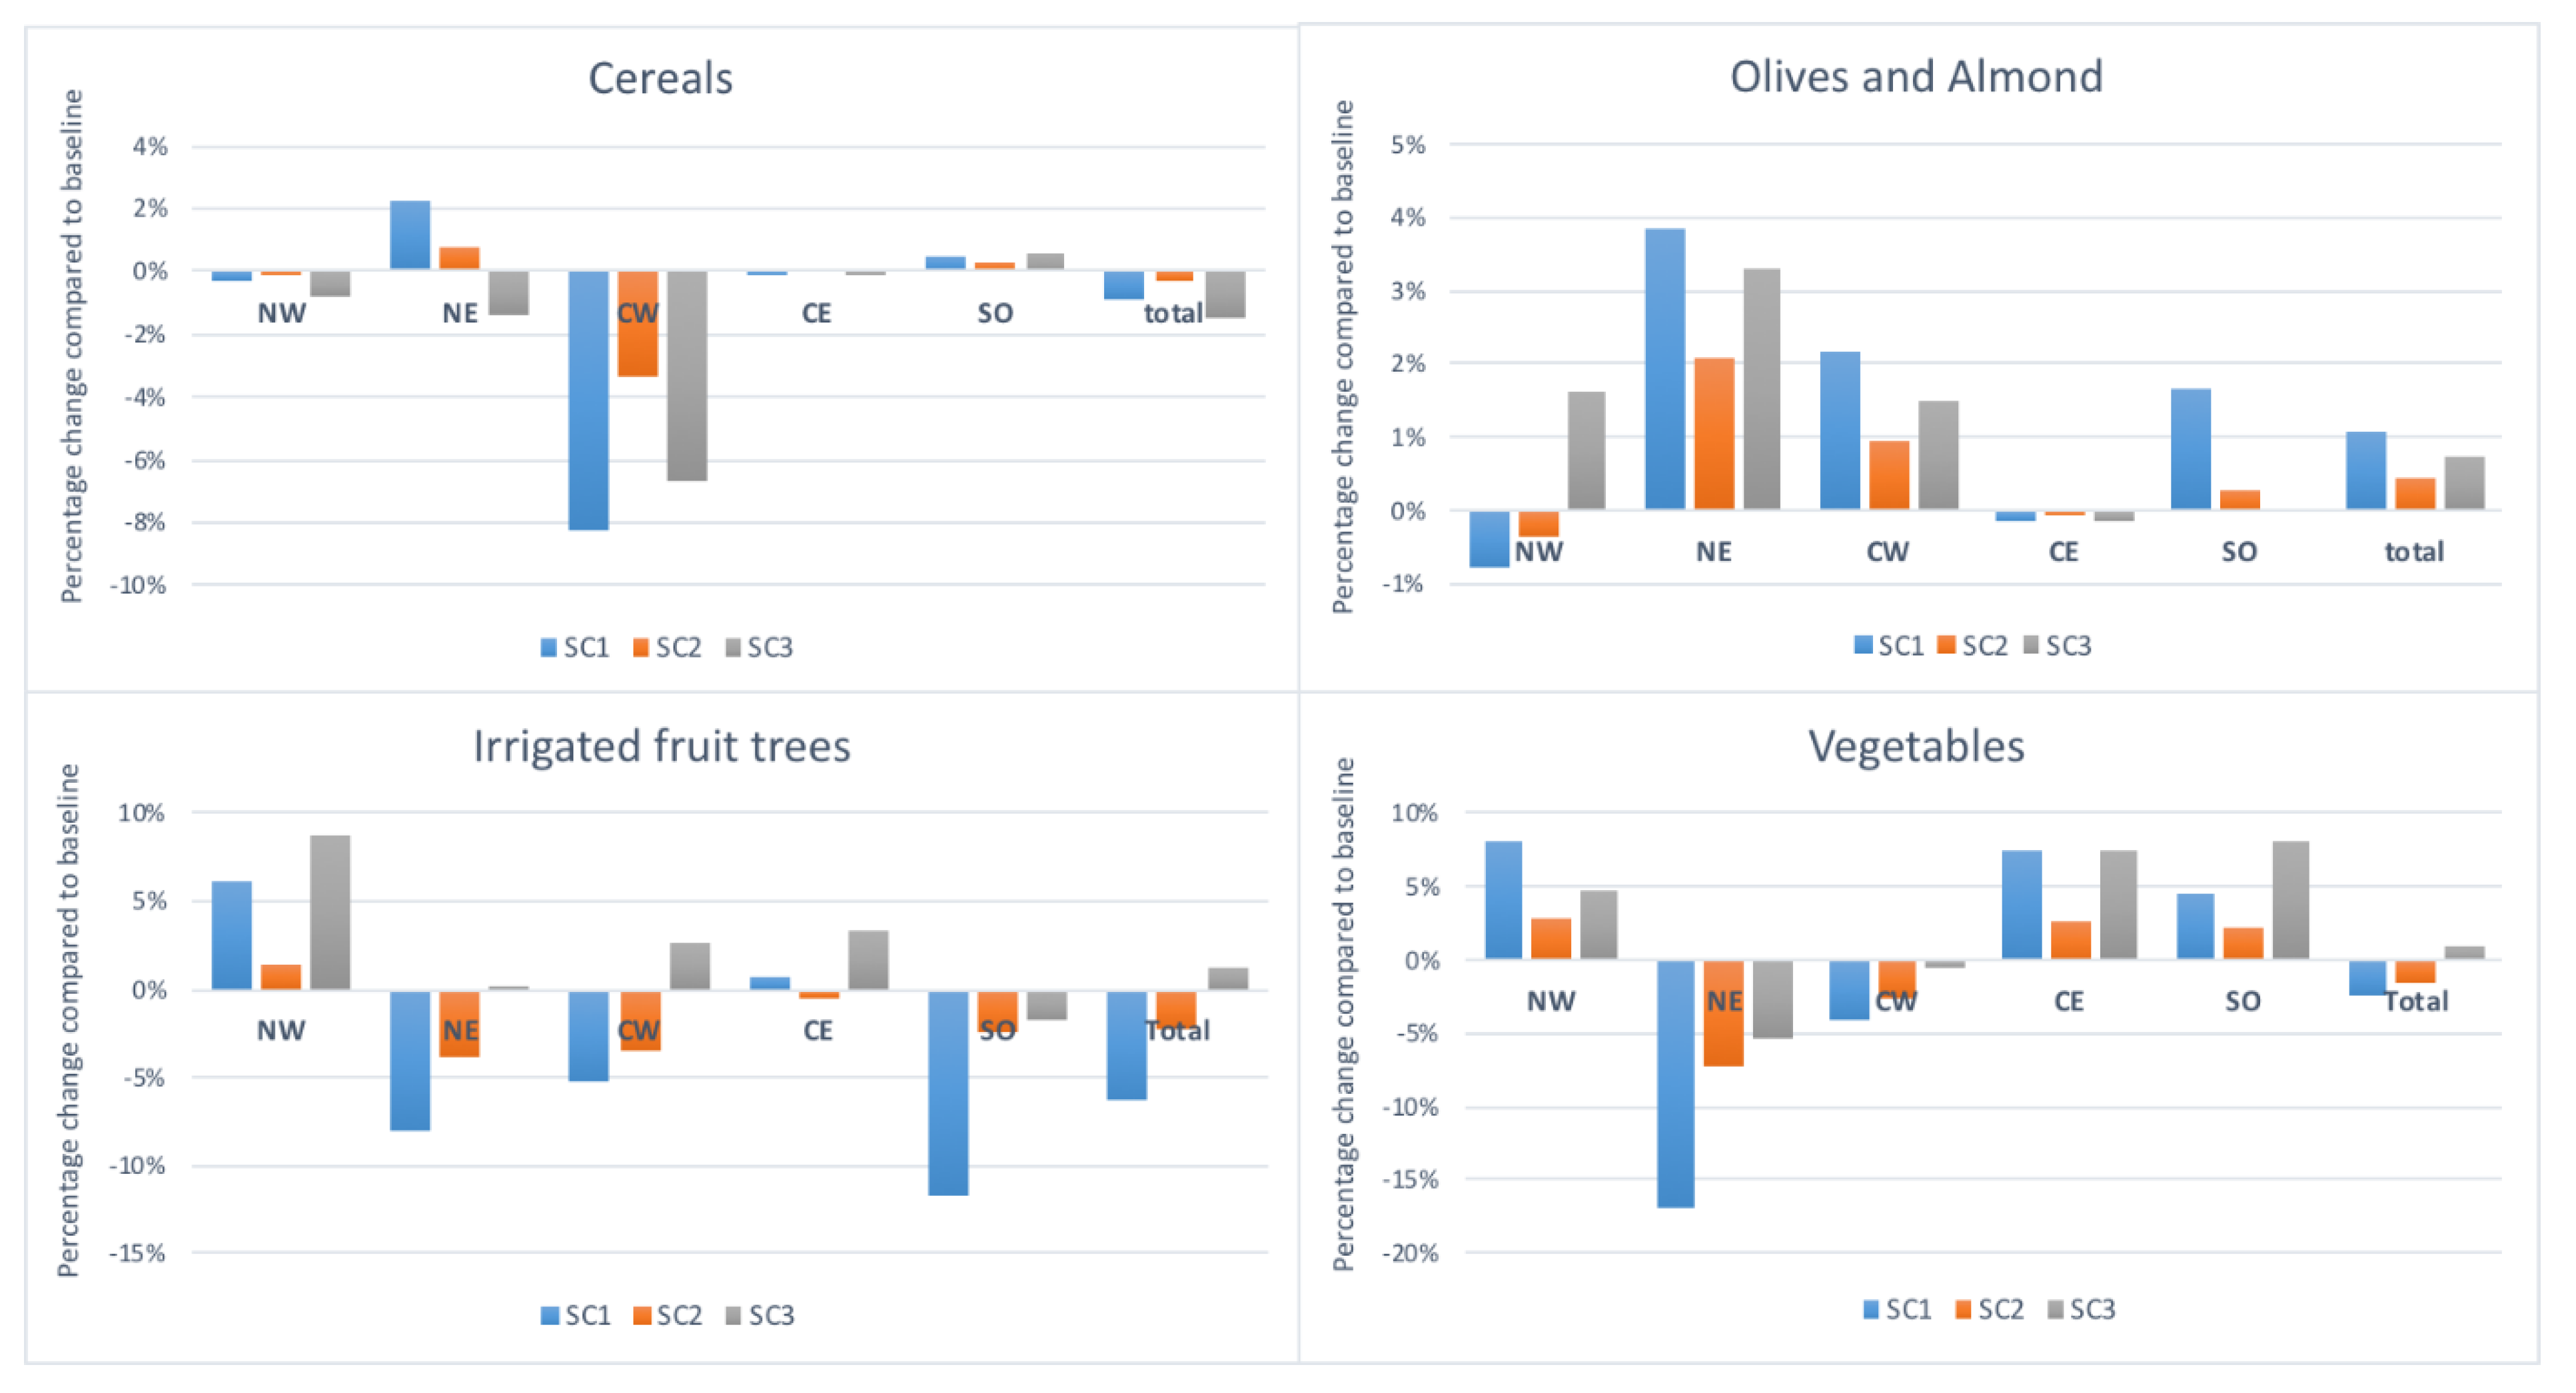
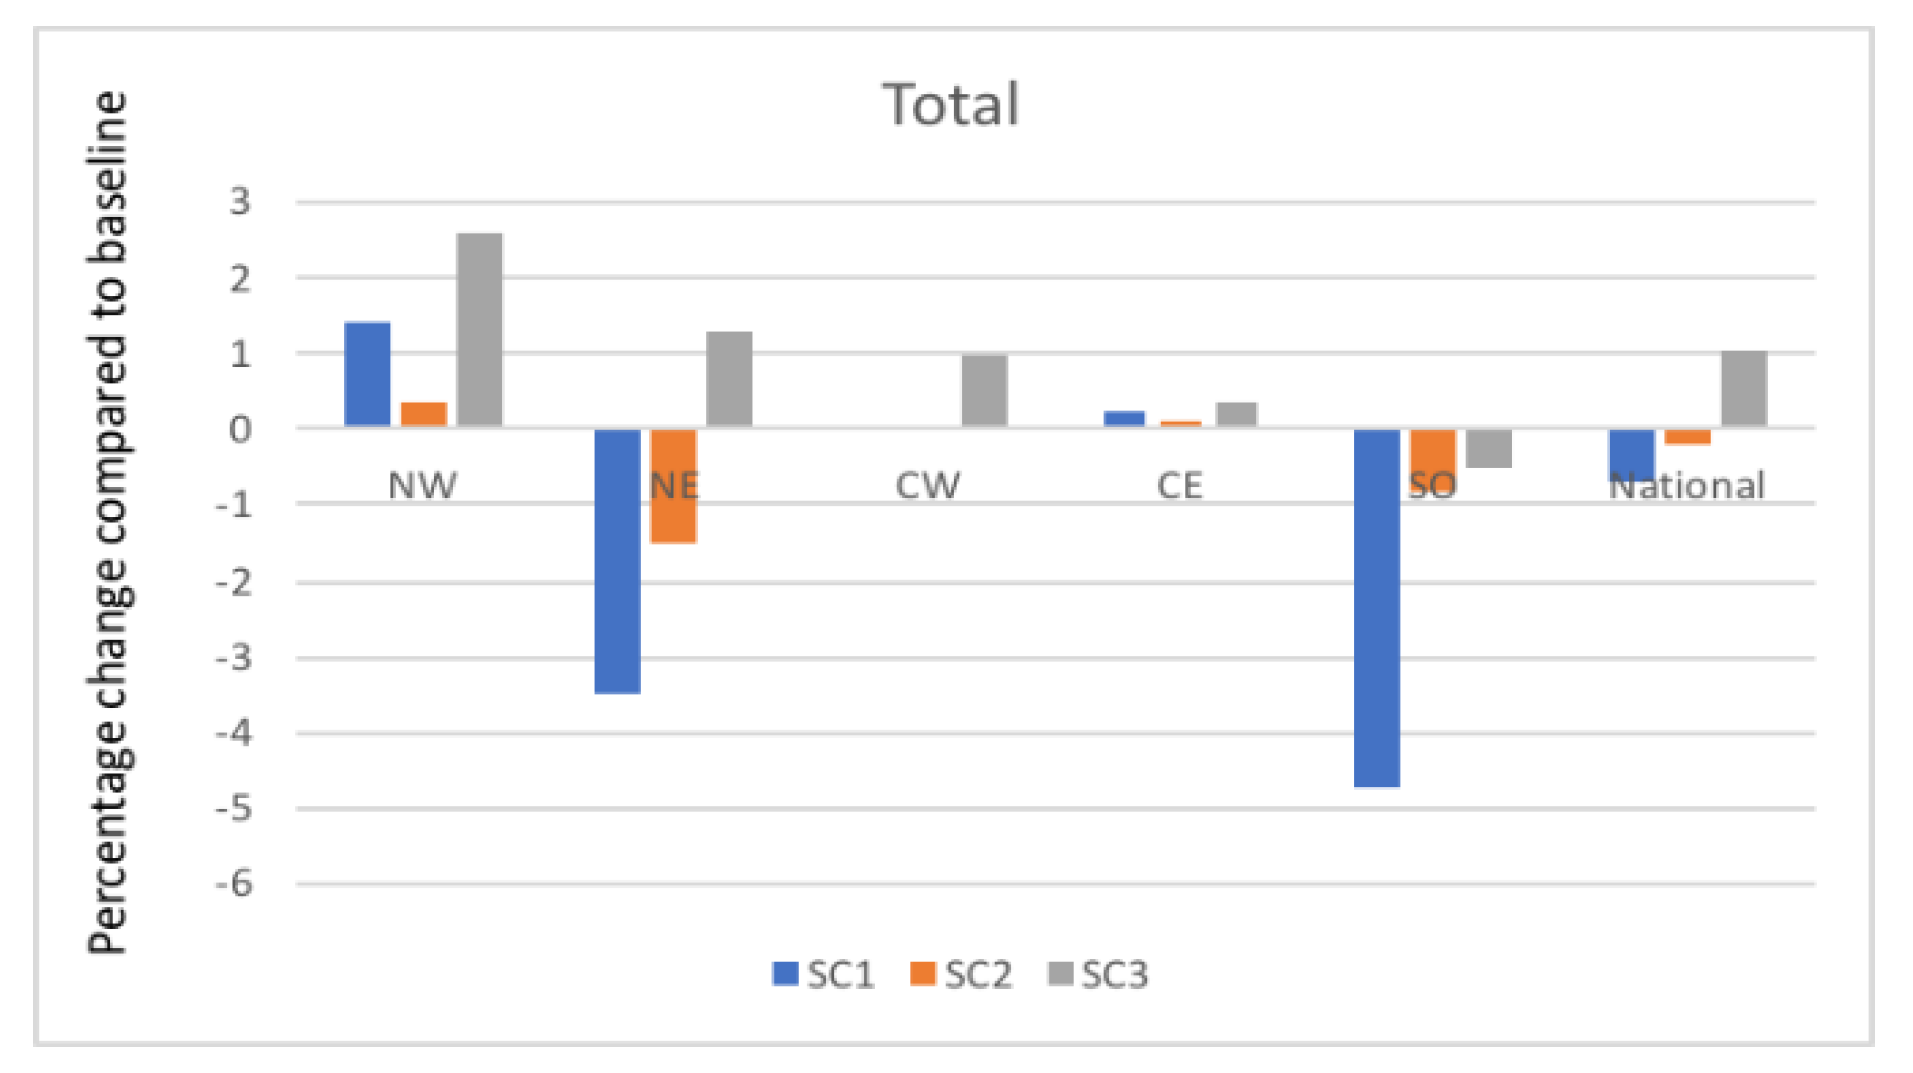
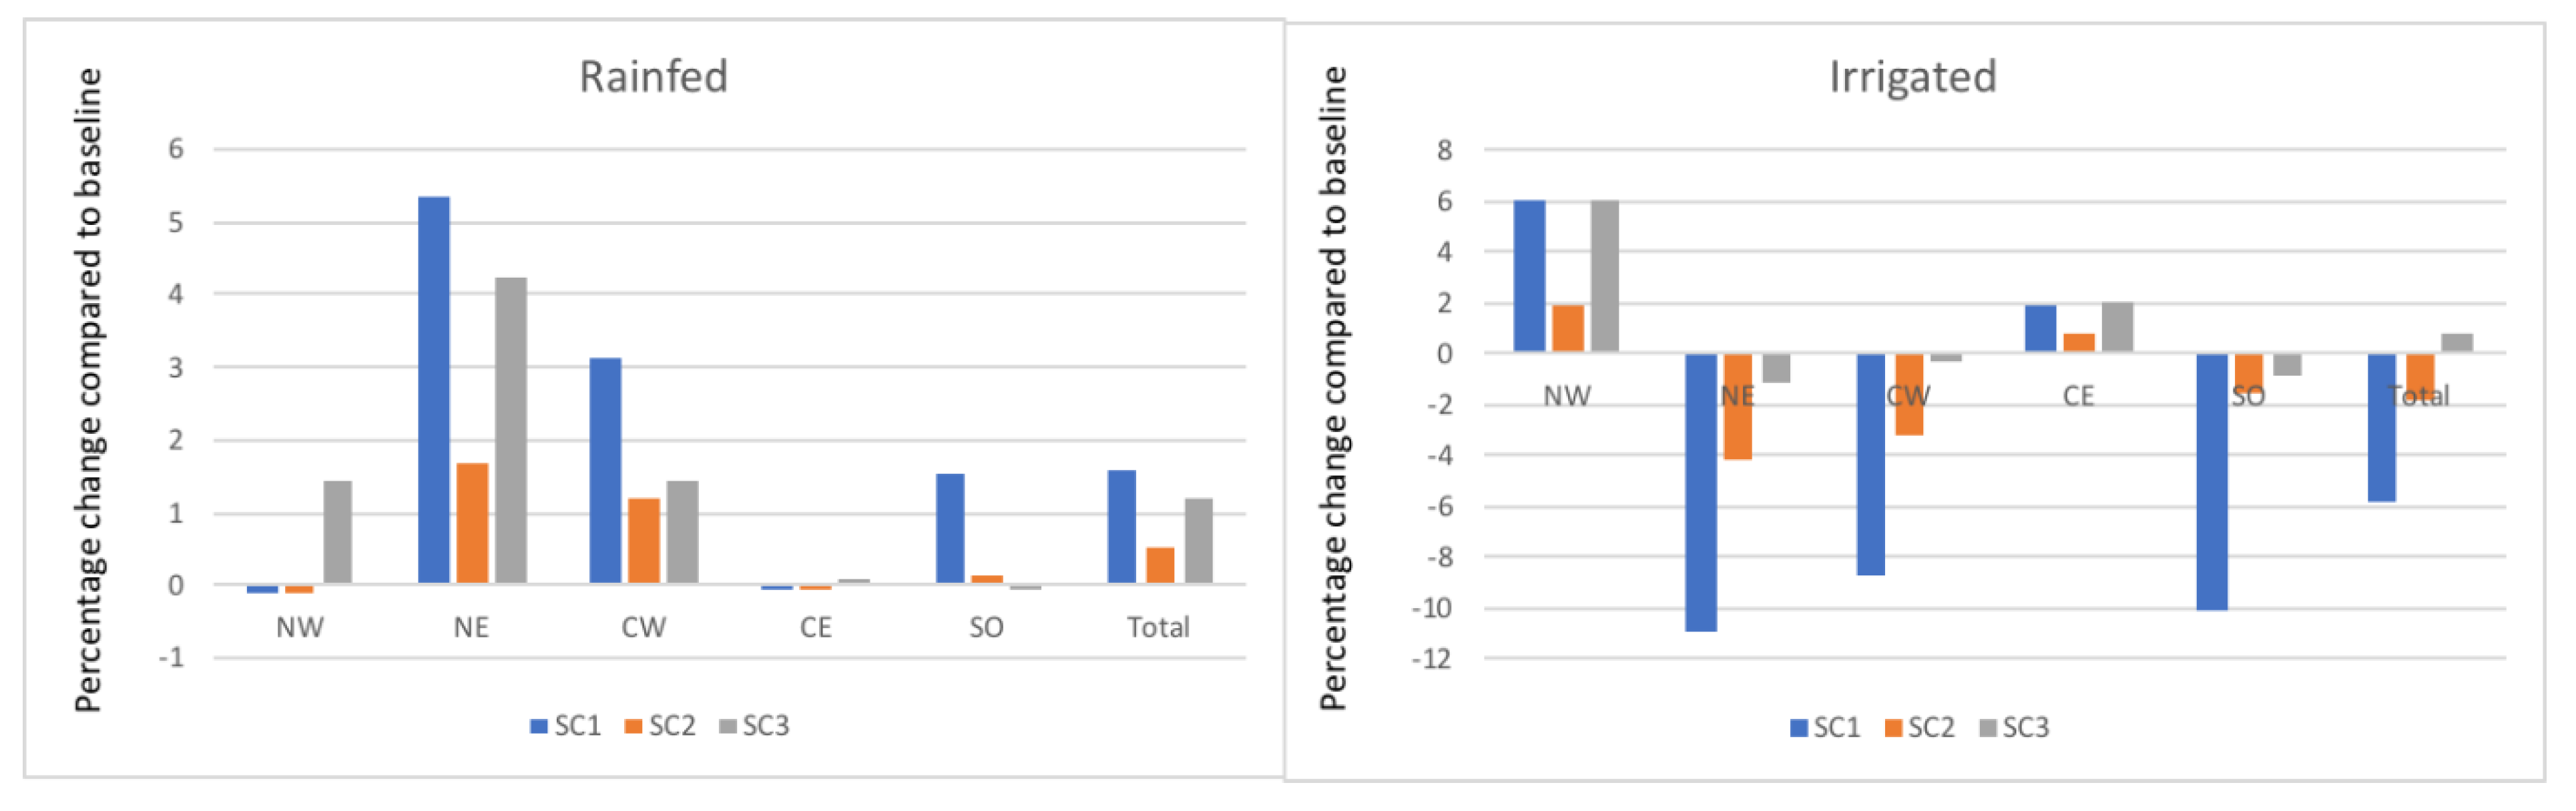
4.2. Scenarios’ Impact on Land Use

First, we analysed change in cropping patterns at the farm level as farmers adapt to changing water availability and crop prices (Figure 3). The results show that the impact on crop allocation varies between crops as well as the way the crop is conducted (i.e., rain-fed or irrigated). Simulation results show that, as a result of climate change, overall area allocated to irrigated crops decreases by 10.73%, 3.75% and 3.71%, respectively, under SC1, SC2 and SC3. This result suggests that improving water use efficiency (SC2) and changing crop prices (SC3) can reduce the impact of climate change on declining irrigated areas.
Simulation results (Figure 4) show that arboriculture areas have been the most impacted due to water availability decrease with an average decrease of around 6.23% and 2.24% under SC1 and SC2, respectively. It is followed by vegetables with a decline of 2.38% and 1.48%, and finally by cereal with 0.86% and 0.33% under SC1 and SC2, respectively. However, in terms of area, cereals represent the largest loss of irrigated area with 10,075 and 3900 ha under both scenarios. In addition, the increase in crop prices (SC3) is used to invert this situation. Indeed, the results of SC3 show that the area of arboriculture as well as that of vegetables can be increased by 1.22% (1599 ha) and 1.05% (1033 ha) for both crops, respectively.
From the results, the decline in irrigated areas is accompanied by an increase in rain-fed areas. These increase by 1.26%, 0.44% and 0.42% or 37,508, 13,093 and 12,611 ha on average for all bioclimatic areas under SC1, SC2 and SC3 (Figure 3), respectively. In particular, olive and almond show the greatest increase in the cultivated area. Their area increases by 1.06, 0.43 and 0.75%, i.e., a difference of 20,551, 8292 and 14,445 ha compared to the baseline under SC1, SC2 and SC3, respectively.
Results also show regional differences (i.e., a different impact depending on the bioclimatic region where the study area is located). Thus, according to Figure 3, the decrease in the area allocated to irrigated crops is more pronounced in the CW and NE compared to other regions, with a change of 18.44, 7 and 7.22% for the CW region and 14.59, 5.86 and 5.72% for the NE region compared to the SQ, respectively, for SC1, SC2 and SC3. On the other hand, if we limit ourselves to Figure 3, we could conclude that the different scenarios have little or no impact on farmers in the NW and the EC. However, Figure 4 shows that farmers in these areas are adapting in a different way. These replace irrigated crops. Indeed, from Figure 4, there has been an increase in fruit and vegetable areas in parallel to a reduction of cereals and irrigated olives area.
It is also noted that cereal acreage is increasing in the NE region, as cereal are mainly rain-fed in this region (Figure 4 and Table 3). On the other hand, it is observed that the cereal area decreases in the CW region. This is because cereals in this region are known to be irrigated. From Figure 4, cereal area will be reduced by 8.25% (5673 ha) compared to the reference situation under SC1. This reduction will be accompanied by an increase in olive and almond trees area of 13,819 ha, or 2.17%, under the same scenario.

4.3. Impact on Farm Income

The ASMOT model also simulates the impact of the different scenarios on the added value obtained by crop type and by bioclimatic zone. A key result is that impacts of declining water availability (SC1 and SC2) on the added value are negative at the national level (Table 4). These losses are the result of the reduction in irrigated crops characterized by high added value. The results of SC1 show an average decline in value added of 0.5%, or a loss of TND 15 million at the national level. However, the improvement in water use efficiency (SC2) and the change in agricultural production prices (SC3) will have a positive impact on agricultural value added. Indeed, results show that the farm income is improved by 0.2% (a different of TND 5 million) and by 13.2% (TND 397 million) compared to the SQ and for SC2 and SC3, respectively.
Since farmers’ adaptation in terms of crop allocation differs from region to region, the impact on value added will also be different. Based on Table 4, the most sensitive regions are the CW and CE. Their value-added decreases by 1.9% and 0.9% (a loss of TND 11 and 3 million compared to the SQ), respectively, for the two regions and under SC1.

4.4. Impact on Employment

As expected, farmers’ land use adaptation under all scenarios induces changes in labour by region and by crop. Figure 5 shows that the decline in water availability (SC1) will have a low impact on employment at the national level. This reduction in labour demand is 0.7% on average under SC1. As for the case of added value, enhanced water use efficiency (SC2) leads to a labour demand close to the SQ. Based on the results of SC2, labour demand decreased by 0.2% on average compared to the SQ. However, if we consider higher crop prices (SC3), the results show a positive impact even in harder climatic conditions. The latter scenario results in an increase in labour demand by around 1.1% compared to the initial situation (Figure 5). This is because under SC3, the olive tree, which has low labour requirements, is replaced by cereals and fruit trees (Figure 4), which require more labour.
From Figure 6, we see that climate change will have a negative impact on labour demand for irrigated crops. The latter decrease by 5.9 and 1.8% compared to SQ, respectively, under SC1 and SC2. Moreover, the impact of SC3 is positive on labour demand for irrigated crops (up 0.7% compared to the SQ). This is due to the fact that under SC3, farmers increase the area of arboriculture and vegetables which are more labour-intensive.
Unlike irrigated crops, simulated results show an increase in total labour needs for rainfed crops under all scenarios (Figure 6). This increases by 1.6, 0.5 and 1.2%, respectively, under SC1, SC2 and SC3. As with the impact of climate change on crop allocation, the most affected regions are NE and CW. These experience a decline in labour demand for irrigated crops of 11 and 8.7%, respectively, for NE and CW and under SC1. Measures such as improved water use efficiency (SC2) and change in crop prices (SC3) can mitigate the impact of these climate changes on employment. In this situation, labour demand in these regions decreases by −4.14 and −1.13% for the NE region and −3.19 and −0.28% for the CW region for SC2 and SC3, respectively. However, labour demand for dry crops increases in these same regions. These increase by 5.34, 1.68 and 4.26% for the NE region and by 3.12, 1.18 and 1.45% for the CW region for SC1, SC2 and SC3, respectively (Figure 6).

5. Discussion

In order to study the impact of climate change on the agricultural sector in different regions in Tunisia, we have developed a disaggregated model in which we analyse changes in land use and crops, as well as socio-economic impacts, particularly on farm income and employment in agriculture. The results were generated with or without additional measures (different scenarios) such as enhanced water use efficiency and increased crop prices.
The results show that the impact of water shortage (SC1) leads to a reduction in irrigated area (10.73% under SC1, or 2606 ha). As an adaptation, there is an increase in rain-fed areas (1.26% under SC1, or 37,507 ha). This result is consistent with those of [56,57], which report a shift in cultivation patterns and the cultivation of larger farms as adaptation strategies for climate change. However, despite this substitution of irrigated crops by rain-fed ones, this study shows a decline in agricultural income (0.5%, or the equivalent of TND 15 million) and of employment (0.7%, or the equivalent of 552 employed individuals) at the national level. This is due to the fact that rainfed crops are less labour intensive and provide a lower income. However, improving water use efficiency by 10% (SC2) improves farm income (up to 0.2% or TND 5 million compared to the status quo) and reduces the negative impact on employment (−0.2%, or a decrease of 157 employed individuals). This result shows the importance of improving water use efficiency as it counteracts the negative effect of water scarcity. This can be achieved through the adoption of water conservation techniques and better management [58,59]. More importance has been given to the rainfed agriculture in Tunisia in the previous decennia. Some ongoing strategies for soil and water conservation by 2050 are considering rainfed agriculture as a strategic cluster. Strategic orientations and investments for increasing the use of advanced ICT tools for piloting irrigation in addition to the modernisation of irrigation networks are also recorded. These can help in adapting to the water scarcity resulting from CC, but further coordination and complementarity across these strategic policies needs to be further explored for wider impact.
The present study also showed that the negative effect of climate change on farm income can be mitigated by higher producer prices (SC3). Total farm income can be increased by about 13% (or TND 397 million nationally) if the price of agricultural products becomes more attractive to farmers. This may be possible through enhanced management, control of agri-food value chains, and regulations. Guaranteeing a high price for certain products, as is done in Europe through the common agricultural policy (CAP), represents an opportunity to indirectly stimulate environmentally sustainable production [60]. The latter scenario (SC3) will also have a positive impact on employment (up 1.1% nationally). As a result, higher producer prices can invert the effects of climate change on agricultural employment. Indeed, the results show that the increase in producer prices allows the production of labour-intensive irrigated fruit trees and vegetables to be increased. Therefore, in addition to promoting specific agricultural production [53], this strategy (SC3) can be used to increase the need for agricultural labour. Despite the relevance of this scenario, Tunisia, as is true of many other developing countries, is still struggling with enhancing the effectiveness and sustainability of its value chains. The diversity of actors and intermediaries involved in agricultural storage and trade, in addition to the low regulatory and enforcement mechanisms for value chain monitoring, remain problematic.

6. Conclusions

In this study, we defined a range of future combined scenarios of water scarcity, enhanced water use efficiencies and producer prices, and explored their impact on the agricultural sector in Tunisia. The study showed that a shift to rain-fed agriculture may be an appropriate adaptation strategy to minimize the impact of climate change. Indeed, the present study showed that substituting irrigated crops with rain-fed crops minimizes losses in farm income and absorbs unemployment from the irrigated sector. Other strategies can be implemented to minimize the impact of climate change on Tunisia’s agricultural sector. Indeed, this study showed that improving water use efficiency reduces the impact on farm income and employment. Moreover, the best scenario to improve farm income and agricultural employment demand is the third scenario, where producer prices are increased. This study also illustrates that the impact of climate change differs from region to another. Our study showed that heterogeneity between regions in terms of agricultural land use (practiced crops), water needs of different crops, and respective prices will determine the extent and scope of climate change impact as well as the type of adaptation adopted by farmers.

Author Contributions

Conceptualization, A.F., A.C. and M.M.; methodology, A.F., A.C., M.M.; software, A.F.; validation, A.F., A.C. and M.M.; formal analysis, A.F.; investigation, M.M., A.O.; resources, A.F. and A.C.; data curation, A.F.; writing—original draft preparation, A.O., A.F.; writing—review and editing, A.O., A.F.; visualization, A.F., A.O.; supervision, A.F. and A.C.; project administration, A.F. and A.C.; funding acquisition, A.F. and A.C. All authors have read and agreed to the published version of the manuscript.

Funding

This research was carried out by ICARDA and conducted as part of the CGIAR Research Program on Policies, Institutions, and Markets (PIM) and the CGIAR Research Program on on WHEAT, which are supported by contributors to the CGIAR Trust Fund. Part of the data used in this paper was generated through IDRC funding of the “Eau Virtuelle et Securite Alimentaire en Tunisie” project.

Institutional Review Board Statement

Not aplicable.

Informed Consent Statement

Not applicable.

Data Availability Statement

We did not report any data, but data remains available upon request to the corresponding authors.

Conflicts of Interest

The authors declare no conflict of interest. The funders had no role in the design of the study; in the collection, analyses, or interpretation of data; in the writing of the manuscript, or in the decision to publish the results.

References

  1. Alvarez-Coque, J.M.G. Agriculture in North Africa: A Chance for Development. Mediterranean Policy Program-Series on the Region and the Economic Crisis; The German Marshall Fund of the United States: Washington, DC, USA, 2012. [Google Scholar]
  2. Radhouane, P.L. Why don’t Adapt Tunisian Agriculture to Climate Change? 1. Climate Change and Agriculture in Tunisia. Int. J. Sci. Environ. Technol. 2018, 7, 1495–1508. Available online: https://www.researchgate.net/publication/328065881_WHY_DON%27T_ADAPT_TUNISIAN_AGRICULTURE_TO_CLIMATE_CHANGE_1_CLIMATE_CHANGE_AND_AGRICULTURE_IN_TUNISIA (accessed on 1 October 2021).
  3. Institut Tunisien des Etudes Stratégiques. Système Hydraulique de la Tunisie à l’horizon 2030; ITES–Tunisian Institute for Strategic Studies: Tunis, Tunisia, 2014. [Google Scholar]
  4. Guesmi, A. Food security in Tunisia: Challenges and priorities. In Proceedings of the International Experts forum on Food Security in GDA Members, Institut des Régions Arides, Médenine, Tunisia, 27–28 June 2018. (In Arabic). [Google Scholar]
  5. Williams, P.A.; Crespo, O.; Abu, M.; Simpson, N.P. A systematic review of how vulnerability of smallholder agricultural systems to changing climate is assessed in Africa. Environ. Res. Lett. 2018, 13, 103004. [Google Scholar] [CrossRef]
  6. Gentle, P.; Thwaites, R.; Race, D.; Alexander, K.; Maraseni, T. Household and community responses to impacts of climate change in the rural hills of Nepal. Clim. Chang. 2018, 147, 267–282. [Google Scholar] [CrossRef]
  7. Wichern, J.; Descheemaeker, K.; Giller, K.E.; Ebanyat, P.; Taulya, G.; van Wijk, M.T. Vulnerability and adaptation options to climate change for rural livelihoods—A country-wide analysis for Uganda. Agric. Syst. 2019, 176, 102663. [Google Scholar] [CrossRef]
  8. Kurukulasuriya, P.; Rosenthal, S. Climate Change and Agriculture: A Review of Impacts and Adaptations; Environment department papers; no. 91. Climate change Series; World Bank: Washington, DC, USA, 2013; License: CC BY 3.0 IGO; Available online: https://openknowledge.worldbank.org/handle/10986/16616 (accessed on 1 October 2021).
  9. Patt, A.; Siebenhüner, B. Agent based modeling and adaption to climate change. Vierteljahrsh. Zur Wirtsch. 2005, 74, 310–320. [Google Scholar] [CrossRef] [Green Version]
  10. Preston, B.L.; Stafford-Smith, M. Framing Vulnerability and Adaptive Capacity Assessment: Discussion Paper; Working Paper No. 2; CSIRO Climate Adaptation National Research Flagship: Aspendale, Australia, 2009; ISBN 1921605057. Available online: https://research.csiro.au/climate/wp-content/uploads/sites/54/2016/03/2_Working-Paper2_CAF_PDF-Standard.pdf (accessed on 1 October 2021).
  11. Jouve, P. Pratiques et stratégies d’adaptation des agriculteurs aux aléas climatiques en Afrique subsaharienne. In S’adapter Aux Aléas Oui Mais Comment; Grain de sel n° 49; 2010; pp. 15–16. Available online: https://www.inter-reseaux.org/wp-content/uploads/pdf_p15_16_Jouve.pdf (accessed on 1 October 2021).
  12. Laube, W.; Schraven, B.; Awo, M. Smallholder adaptation to climate change: Dynamics and limits in Northern Ghana. Clim. Chang. 2012, 111, 753–774. [Google Scholar] [CrossRef] [Green Version]
  13. Troost, C.; Calberto, G.; Berger, T.; Ingwersen, J.; Priesack, E.; Warrach-Sagi, K.; Walter, T. Agent-based modeling of agricultural adaptation to climate change in a mountainous area of Southwest Germany. In Proceedings of the 6th International Congress on Environmental Modelling and Software, Leipzig, Germany, 1–5 July 2012. [Google Scholar]
  14. Iwamura, T.; Lambin, E.F.; Silvius, K.M.; Luzar, J.B.; Fragoso, J.M. V Agent-based modeling of hunting and subsistence agriculture on indigenous lands: Understanding interactions between social and ecological systems. Environ. Model. Softw. 2014, 58, 109–127. [Google Scholar] [CrossRef]
  15. Schindler, J. A Multi-Agent System for Simulating Land-Use and Land-Cover Change in the Atankwidi Catchment of Upper East Ghana. 2010. Available online: https://bonndoc.ulb.uni-bonn.de/xmlui/handle/20.500.11811/4160 (accessed on 1 October 2021).
  16. Amadou, M.L.; Villamor, G.B.; Kyei-Baffour, N. Simulating agricultural land-use adaptation decisions to climate change: An empirical agent-based modelling in northern Ghana. Agric. Syst. 2018, 166, 196–209. [Google Scholar] [CrossRef]
  17. Cotterman, K.A.; Kendall, A.D.; Basso, B.; Hyndman, D.W. Groundwater depletion and climate change: Future prospects of crop production in the Central High Plains Aquifer. Clim. Chang. 2018, 146, 187–200. [Google Scholar] [CrossRef]
  18. Deines, J.M.; Schipanski, M.E.; Golden, B.; Zipper, S.C.; Nozari, S.; Rottler, C.; Guerrero, B.; Sharda, V. Transitions from irrigated to dryland agriculture in the Ogallala Aquifer: Land use suitability and regional economic impacts. Agric. Water Manag. 2020, 233, 106061. [Google Scholar] [CrossRef]
  19. Hageback, J.; Sundberg, J.; Ostwald, M.; Chen, D.; Yun, X.; Knutsson, P. Climate variability and land-use change in Danangou watershed, China—Examples of small-scale farmers’ adaptation. Clim. Chang. 2005, 72, 189–212. [Google Scholar] [CrossRef]
  20. Yang, H.; Villamor, G.B.; Su, Y.; Wang, M.; Xu, J. Land-use response to drought scenarios and water policy intervention in Lijiang, SW China. Land Use Policy 2016, 57, 377–387. [Google Scholar] [CrossRef]
  21. Linder, S. Räumliche Diffusion von Photovoltaik-Anlagen in Baden-Württemberg. Ph.D. Thesis, Universität Würzburg, Würzburg, Germany, 2013. [Google Scholar]
  22. Kousksou, T.; Allouhi, A.; Belattar, M.; Jamil, A.; El Rhafiki, T.; Arid, A.; Zeraouli, Y. Renewable energy potential and national policy directions for sustainable development in Morocco. Renew. Sustain. Energy Rev. 2015, 47, 46–57. [Google Scholar] [CrossRef]
  23. Zou, X.; Li, Y.; Gao, Q.; Wan, Y. How water saving irrigation contributes to climate change resilience—a case study of practices in China. Mitig. Adapt. Strateg. Glob. Chang. 2012, 17, 111–132. [Google Scholar] [CrossRef] [Green Version]
  24. Deligios, P.A.; Chergia, A.P.; Sanna, G.; Solinas, S.; Todde, G.; Narvarte, L.; Ledda, L. Climate change adaptation and water saving by innovative irrigation management applied on open field globe artichoke. Sci. Total Environ. 2019, 649, 461–472. [Google Scholar] [CrossRef]
  25. Bhadouria, R.; Singh, R.; Singh, V.K.; Borthakur, A.; Ahamad, A.; Kumar, G.; Singh, P. Agriculture in the era of climate change: Consequences and effects. In Climate Change and Agricultural Ecosystems; Elsevier: Amsterdam, The Netherlands, 2019; pp. 1–23. [Google Scholar]
  26. Etzold, B.; Ahmed, A.U.; Hassan, S.R.; Neelormi, S.; Afifi, T. Rainfall variability, hunger, and social inequality, and their relative influences on migration: Evidence from Bangladesh. In Environmental Migration and Social Inequality; Springer: Berlin/Heidelberg, Germany, 2016; pp. 27–41. [Google Scholar]
  27. Call, M.; Gray, C.; Jagger, P. Smallholder responses to climate anomalies in rural Uganda. World Dev. 2019, 115, 132–144. [Google Scholar] [CrossRef]
  28. Do Prado Tanure, T.M.; Miyajima, D.N.; Magalhães, A.S.; Domingues, E.P.; Carvalho, T.S. The impacts of climate change on agricultural production, land Use and economy of the legal Amazon region between 2030 and 2049. EconomiA 2020, 21, 73–90. [Google Scholar] [CrossRef]
  29. Ruiz Meza, L.E. Adaptive capacity of small-scale coffee farmers to climate change impacts in the Soconusco region of Chiapas, Mexico. Clim. Dev. 2015, 7, 100–109. [Google Scholar] [CrossRef]
  30. Wheeler, T.; Von Braun, J. Climate change impacts on global food security. Science 2013, 341, 508–513. [Google Scholar] [CrossRef]
  31. Hertel, T.W.; Burke, M.B.; Lobell, D.B. The poverty implications of climate-induced crop yield changes by 2030. Glob. Environ. Chang. 2010, 20, 577–585. [Google Scholar] [CrossRef] [Green Version]
  32. Djoudi, H.; Locatelli, B.; Vaast, C.; Asher, K.; Brockhaus, M.; Sijapati, B.B. Beyond dichotomies: Gender and intersecting inequalities in climate change studies. Ambio 2016, 45, 248–262. [Google Scholar] [CrossRef] [Green Version]
  33. Gray, C.; Mueller, V. Drought and population mobility in rural Ethiopia. World Dev. 2012, 40, 134–145. [Google Scholar] [CrossRef] [PubMed] [Green Version]
  34. Antle, J.M. Parsimonious multi-dimensional impact assessment. Am. J. Agric. Econ. 2011, 93, 1292–1311. [Google Scholar] [CrossRef]
  35. Fosu-Mensah, B.Y.; Vlek, P.L.G.; MacCarthy, D.S. Farmers’ perception and adaptation to climate change: A case study of Sekyedumase district in Ghana. Environ. Dev. Sustain. 2012, 14, 495–505. [Google Scholar] [CrossRef]
  36. Ali, A.; Erenstein, O. Assessing farmer use of climate change adaptation practices and impacts on food security and poverty in Pakistan. Clim. Risk Manag. 2017, 16, 183–194. [Google Scholar] [CrossRef]
  37. Ellis, J.E.; Swift, D.M. Stability of African pastoral ecosystems: Alternate paradigms and implications for development. Rangel. Ecol. Manag. Range Manag. Arch. 1988, 41, 450–459. [Google Scholar] [CrossRef] [Green Version]
  38. Daberkow, S.G.; McBride, W.D. Farm and operator characteristics affecting the awareness and adoption of precision agriculture technologies in the US. Precis. Agric. 2003, 4, 163–177. [Google Scholar] [CrossRef]
  39. Maddison, D. The Perception of and Adaptation to Climate Change in Africa; World Bank Publications: Washington, DC, USA, 2007; Volume 4308. [Google Scholar]
  40. Deressa, T.T.; Hassan, R.M.; Ringler, C.; Alemu, T.; Yesuf, M. Determinants of farmers’ choice of adaptation methods to climate change in the Nile Basin of Ethiopia. Glob. Environ. Chang. 2009, 19, 248–255. [Google Scholar] [CrossRef] [Green Version]
  41. Howitt, R.E. Positive mathematical programming. Am. J. Agric. Econ. 1995, 77, 329–342. [Google Scholar] [CrossRef]
  42. Heckelei, T.; Britz, W. Models based on positive mathematical programming: State of the art and further extensions. In Proceedings of the 89th SeminarEuropean Association of Agricultural Economists (EAAE), Parma, Italy, 2–5 February 2005. [Google Scholar]
  43. Kanellopoulos, A.; Berentsen, P.; Heckelei, T.; Van Ittersum, M.; Lansink, A.O. Assessing the forecasting performance of a generic bio-economic farm model calibrated with two different PMP variants. J. Agric. Econ. 2010, 61, 274–294. [Google Scholar] [CrossRef]
  44. Gómez-Limón, J.A.; Gutiérrez-Martín, C.; Riesgo, L. Modeling at farm level: Positive multi-attribute utility programming. Omega 2016, 65, 17–27. [Google Scholar] [CrossRef]
  45. Graveline, N. Economic calibrated models for water allocation in agricultural production: A review. Environ. Model. Softw. 2016, 81, 12–25. [Google Scholar] [CrossRef]
  46. Howitt, R.E.; Medellín-Azuara, J.; MacEwan, D.; Lund, J.R. Calibrating disaggregate economic models of agricultural production and water management. Environ. Model. Softw. 2012, 38, 244–258. [Google Scholar] [CrossRef]
  47. Medellín-Azuara, J.; Howitt, R.E.; Harou, J.J. Predicting farmer responses to water pricing, rationing and subsidies assuming profit maximizing investment in irrigation technology. Agric. water Manag. 2012, 108, 73–82. [Google Scholar] [CrossRef]
  48. Solazzo, R.; Pierangeli, F. How does greening affect farm behaviour? Trade-off between commitments and sanctions in the Northern Italy. Agric. Syst. 2016, 149, 88–98. [Google Scholar] [CrossRef]
  49. Torres, M.d.O.; Howitt, R.; Rodrigues, L.N. Modeling the economic benefits and distributional impacts of supplemental irrigation. Water Resour. Econ. 2016, 14, 1–12. [Google Scholar] [CrossRef]
  50. Paeth, H.; Born, K.; Girmes, R.; Podzun, R.; Jacob, D. Regional climate change in tropical and northern Africa due to greenhouse forcing and land use changes. J. Clim. 2009, 22, 114–132. [Google Scholar] [CrossRef] [Green Version]
  51. Blinda, M. More efficient water use in the Mediterranean. Plan Bleu Pap. 2012. [Google Scholar]
  52. Trebbin, A. Linking small farmers to modern retail through producer organizations–Experiences with producer companies in India. Food Policy 2014, 45, 35–44. [Google Scholar] [CrossRef]
  53. Bahinipati, C.S.; Venkatachalam, L. What drives farmers to adopt farm-level adaptation practices to climate extremes: Empirical evidence from Odisha, India. Int. J. Disaster Risk Reduct. 2015, 14, 347–356. [Google Scholar] [CrossRef]
  54. Mwinjaka, O.; Gupta, J.; Bresser, T.O.N. Adaptation strategies of the poorest farmers in drought-prone Gujarat. Clim. Dev. 2010, 2, 346–363. [Google Scholar] [CrossRef]
  55. ONAGRI. Official Online Database of Agricultural Productions, Consumptions and Markets. 2016. Available online: http://onagri.africadata.org/en (accessed on 1 October 2021).
  56. Yaro, J.A. The Social Dimensions of Adaptation of Climate Change in Ghana; The World Bank: Washington, DC, USA, 2010. [Google Scholar]
  57. Dumenu, W.K.; Obeng, E.A. Climate change and rural communities in Ghana: Social vulnerability, impacts, adaptations and policy implications. Environ. Sci. Policy 2016, 55, 208–217. [Google Scholar] [CrossRef]
  58. Turral, H.; Burke, J.; Faurès, J.-M. Climate Change, Water and Food Security; Food and Agriculture Organization of the United Nations (FAO): Roma, Italy, 2011; ISBN 9251067953. [Google Scholar]
  59. Mandryk, M.; Reidsma, P.; van Ittersum, M.K. Crop and farm level adaptation under future climate challenges: An exploratory study considering multiple objectives for Flevoland, the Netherlands. Agric. Syst. 2017, 152, 154–164. [Google Scholar] [CrossRef]
  60. Recanati, F.; Maughan, C.; Pedrotti, M.; Dembska, K.; Antonelli, M. Assessing the role of CAP for more sustainable and healthier food systems in Europe: A literature review. Sci. Total Environ. 2019, 653, 908–919. [Google Scholar] [CrossRef]
Figure 1. Conceptual illustration of the ASMOT model.
Agronomy 11 02112 g001
Figure 2. Percentage deviation of simulated vs observed crops areas in different regions included in the ASMOT model.
Agronomy 11 02112 g002
Figure 3. Predicting (percentage %) change of total irrigated and rain-fed areas in the five bioclimatic regions and under the three scenarios.
Agronomy 11 02112 g003
Figure 4. Impact of the different simulated scenarios on land allocation across crops, systems and within each region.
Agronomy 11 02112 g004
Figure 5. Percentage change in regional labor demand in the agricultural sector under different combined scenarios of water scarcity.
Agronomy 11 02112 g005
Figure 6. Impact on regional and global agricultural employment.
Agronomy 11 02112 g006
Table 1. Different crops and regions considered by the ASMOT model.
CropsRegions and Districts
Cereal crops: Durum wheat, soft wheat, barley
Olive and almond (considered separately)
Irrigated fruit trees: palm date, citrus, grape, peach, apple, pear, grenade
Vegetable crops: tomato, potato, pepper, onion, garlic, artichoke, melon, watermelon, strawberry
Bizerte, Beja, Seliana, Le Kef, Jendouba (aggregated into North West (NW))
Nabeul, Ariana, Manouba, Ben Arous, Zaghouan (aggregated into North Est (NE))
Sidi Bouzid, Kasserine, Kairouan, Gafsa (Aggregated into Center West (CW))
Sfax, Mahdia, Monastir, Sousse (aggregated into Center Est (CE))
Tozeur, Kebili, Tataouine, Médenine, Gabes (aggregated into South (SO))
Table 2. Scenarios simulated in ASMOT.
DescriptionComments
Scenario 1Linear reduction of freshwater availability by 25% in all considered regionsThis reduction is supposed to be linear across all (districts) regions of the country
Scenario 2Linear reduction of freshwater availability by 25% and increase of irrigation water use efficiency by 10%Improvement of IWUE in ASMOT is simulated by decreasing water volumes required by crops/systems by 10%
Scenario 3Linear reduction of freshwater availability by 25%, increase of irrigation water use efficiency by 10% and higher producer prices offered to farmers. The suggested increase of producer prices are as following: + 10% for fruits and vegetable prices and + 5% for cereal prices Cereal prices are mostly fixed by the government and change slightly across years. However, fruits and vegetables are commercialized in a free market, and prices received by farmers are very low compared to consumer prices. Better integration of farmers in value chains may reduce this gap
Table 3. Crop distribution by production system and by bioclimatic zone for the reference year (official 2011 data).
CerealsOlives and AlmondFruit TreesVegetables
Irrigated (ha)NW330,186272119,10525,178
NE104,904840544,16824,779
CW102,36641,92911,42031,218
CE60,941907110,92611,724
SO50,599401944,9995549
Sum648,99766,145130,61898,449
Rainfal (ha)NW712,379150,816--
NE161,25298,947--
CW130,950594,948--
CE95,521748,228--
SO54,671277,033--
Sum1,154,7721,869,972--
Total (ha)NW1,042,565153,53719,10525,178
NE266,156107,35244,16824,779
CW233,316636,87811,42031,218
CE156,462757,29810,92611,724
SO105,270281,05244,9995549
Sum1,803,7691,936,117130,61898,449
Source: [55].
Table 4. Impact of different scenarios on crops’ gross margin (relative change compared to SQ scenario or % difference to SQ scenario).
SQSC1SC2SC3
RegionsGross Margin% Diff.% Diff.% Diff.
Rain-fedNOU1150.909.6
NES3090010.7
COU3833.93.115.9
CES1782.20.610.1
SUD772007.4
National17571.16.415.9
IrrigatedNOU201−2.0018.9
NES102−1.0019.6
COU300−4.3−1.315.7
CES388−3.9−1.017.0
SUD260−0.8017.7
National1251−2.8−0.617.3
TotalNOU316−0.9015.5
NES411−0.2012.9
COU683−0.31.215.8
CES566−1.9−0.5314.8
SUD1032−0.2010.0
National3008−0.50.213.2
Publisher’s Note: MDPI stays neutral with regard to jurisdictional claims in published maps and institutional affiliations.

