Article

Modelling the Effect and Variability of Integrated Weed Management of Phalaris minor in Rice-Wheat Cropping Systems in Northern India

by
Chun Liu
1,*,
Makhan Singh Bhullar
2,
Tarundeep Kaur
2,
Jitendra Kumar
3,
Sriyapu Reddy Sreekanth Reddy
2,
Manpreet Singh
2 and
Shiv Shankhar Kaundun
1
1
Herbicide Bioscience, Jealott’s Hill International Research Centre, Syngenta, Bracknell RG42 6EY, UK
2
Department of Agronomy, Punjab Agricultural University, Ludhiana 141004, India
3
Syngenta India Ltd., D-2 Block, Southern Park, Unit 405, 4th Floor, New Delhi 110002, India
*
Author to whom correspondence should be addressed.
Submission received: 16 October 2021 / Revised: 5 November 2021 / Accepted: 15 November 2021 / Published: 18 November 2021

Abstract

:
Phalaris minor Retz. (littleseed canarygrass) is the most problematic and herbicide-resistant weed in the rice-wheat cropping system in India. As such, it poses a severe threat to wheat yield and food security. A number of herbicidal and agronomic practices have been identified for the effective control of P. minor. These include crop rotation, crop establishment methods, herbicide spray technology, sowing time, weed seed harvest and effective herbicide mixtures. A population model of P. minor was built based on the life cycle of the species, herbicide resistance mechanisms and the effects of weed control practices. The model simulated the interactions of these factors and provided the best management recommendations for sustainably controlling this noxious weed species. Model results indicate that integration of chemical and non-chemical control methods was the most effective and sustainable strategy. For example, the integration of a happy seeder (a tractor-mounted mulching and sowing machine) with an effective post-emergence herbicide reduced the probability of weed control failure by 32% compared to the scenario with a rotavator and the same herbicide. Similarly, more conventional crop establishment methods such as a rotavator and conventional tillage could be accompanied by pre- or post-emergence applications of herbicide mixtures. Adoption of good herbicide spray technology and weed seed harvest delayed the onset of resistance evolution by up to four years. Furthermore, effective crop rotation such as the inclusion of sugarcane in place of rice in the summer season reduced the risk of resistance evolution by 31% within the 10 year simulation period. In addition to the scenarios using representative parameter values, the variability of model predictions was investigated based on some field experiments. The model provided a powerful tool for promoting Integrated Weed Management and the sustainable use of herbicides. Pragmatic ways of dealing with uncertainty in model prediction are discussed.

1. Introduction

Phalaris minor Retz. is the most common grass weed in wheat agro-ecosystems in India and was effectively managed by tillage, manual weeding and diversified crop rotations in the past. The green revolution in the late 1960s saw large increases in wheat yields in India, and rice-wheat rotation became popular in areas with high soil fertility and assured irrigation, such as Punjab and Haryana. However, rice cultivation favours the persistence of P. minor [1], and growers have relied heavily on herbicides for the control of this weed. In the 1970s, isoproturon, a photosystem II (PSII) inhibitor, provided effective control of P. minor. Since the late 1990s, evolved resistance to isoproturon [2,3] has led to the introduction and high adoption of herbicides with alternative modes of action (MoAs), for example, clodinafop and fenoxaprop, both acetyl CoA carboxylase (ACCase) inhibitors, and sulfosulfuron, an acetolactate synthase (ALS) inhibitor. After around six years of continuous use, resistance to these herbicides [4,5,6] again led to the introduction of newer products, such as pinoxaden (PXD), an ACCase inhibitor, and mesosulfuron and iodosulfuron, both ALS inhibitors. More recently, evolved resistance to these latter herbicides has also been reported [6,7,8]. In 2017–2018, many growers in the rice-wheat belt sprayed the herbicides two to three times but still failed to control the weed. Due to its prolific seed production, P. minor densities can reach as high as 1000–2000 plants/m2, causing yield losses of 50–100% [9]. Even at modest densities of 5–50 plants/m2, wheat yield can be reduced by 8–50% [10]. In some fields with high resistance levels, where herbicides have failed to control P. minor, the crops have sometimes been cut for fodder, resulting in huge financial loss to the growers. The increasing occurrence of multiple herbicide resistance indicates that relying on a single herbicide for long-term control of P. minor populations is unrealistic, and so Integrated Weed Management (IWM) strategies are recommended [11,12]. An effective IWM approach should include strategies to prevent the soil seedbank from flourishing, to understand the weed biology, and to determine the critical control window and the actual control practices [13]. The principle of IWM is to combine cultural, mechanical and herbicidal practices to make cropping systems unfavourable for weeds to survive and reproduce [14]. There are multiple factors to balance in IWM, and population models can be particularly useful for studying the interactions of these factors [15,16]. Models can quantify the contribution of “many little hammers” [17] and predict the integrated effect on the population dynamics and resistance evolution. As “no two problems are the same—even in adjacent fields” [18], predictive models can help growers plan for appropriate responses while recognising the field-specific aspects of the weed control problem.
Weeds and the agricultural systems are highly variable by nature. Different soil texture, temperature, water availability, nutrients and light conditions could lead to varying patterns in weed emergence and their responses to anthropogenic activities (e.g., [17,19,20,21]). Consequently, the effect of agronomic practices on weed control also varies. For example, delayed autumn drilling reduces Alopecurus myosuroides Huds. populations by 31% on average, but the effect could range from −71% to 97%, due to the increased vulnerability to inclement weather with delayed drilling [22]. In a dryland field experiments in the US, cover crop had inconsistent effects on suppressing weed density, possibly due to the variable moisture retained in the soil with cover crops [23]. These variabilities are often the source of uncertainty in agricultural reality but are not necessarily reflected in model predictions. Uncertainty can have a big impact on the quality of environmental decision making [24,25]. Previous attempts to address uncertainty in decision-support tools include multicriteria decision analysis (MCDA), data uncertainty engine (DUE), integration of fuzzy-rule-based models and probabilistic data-driven techniques, Bayesian probability, model divergence correction, etc. [24,26,27]. In addition to these modelling techniques, field experiments specifically designed to inform model parameterisation could be helpful. In this study, we built a population model based on the life cycle of the weed, herbicide resistance mechanisms and the effects of chemical and non-chemical weed control practices. Ten core scenarios representing the management practices of P. minor in the rice-wheat agro-ecosystems in India were simulated. The influence and interactions of multiple factors on weed density and resistance evolution were analysed based on the model predictions. Uncertainties around some of the scenarios were explored via varying parameters based on field experiments.

2. Materials and Methods

2.1. Field Experiments on the Variation around Non-Chemical Weed-Control Methods

The model and the core scenarios were parameterised based on existing knowledge and literature data and therefore were independent of the field experiments. The purpose of the field experiments was to better understand the realistic range and help introduce variations to the effects of non-chemical weed control methods in the model. Field experiments were conducted in a field with sandy-loam soil in 2019–2020 at Punjab Agricultural University (30°54′ N, 75°48′ E) to study P. minor emergence (Experiment 1), seedbank density and the effects of weed seed harvest (Experiment 2) and herbicide spray nozzles (Experiment 3). The experimental site is within the Central Plain Region of Punjab under the Trans-Gangetic agroclimate zone of India. The climatic conditions of the area are listed in Table 1. Each experiment plot consisted of 12 × 7 m rows, and the plots were separated by 0.5 m ridges. Plots were arranged in a randomised complete block design, with four replications for Experiments 1 and 3 and three replications for Experiment 2. The replications were separated by 2 m paths. All experiments were conducted in the wheat season after puddle transplanted rice.

2.1.1. Experiment 1: P. minor Emergence Pattern and Effect of Conventional Tillage (CT)

The experimental field was under a rice-wheat cropping system. All rice residues were removed at ground level at the time of harvest. After harvesting the paddy rice, a pre-sowing irrigation was applied to ensure adequate moisture in the soil for wheat sowing. When the field attained a workable soil moisture, the seed bed was prepared by one pass of ploughing with a disc harrow followed by two passes of ploughing with a tyne cultivator. The treatment details, seed bed preparation, sowing method, and fertilisation and irrigation details are given in Table 2. The number of emerged P. minor seedlings was recorded as three discrete cohorts during the wheat season: Cohort 1, emerging before first irrigation (21 days after sowing); Cohort 2, emerging after first irrigation; and Cohort 3, emerging after second irrigation (four weeks after first irrigation) (Table 3: #9, #10).

2.1.2. Experiment 2: Seedbank Density and Effect of Weed Seed Harvest (WSH)

The nine treatment combinations consisted of three crop establishment methods and three weed management levels (Table 2). The treatment details, seed bed preparation, sowing method, and fertilisation and irrigation details are given in Table 2. The soil samples for the weed seedbank were taken in the top 15 cm soil layer, one day after paddy harvest, from four spots taken diagonally in each plot. The number of P. minor seeds were counted from cylindrical core sampler (11.0 cm diameter and 15 cm depth) soil samples and averaged across three replications for CT, HS and RW, respectively (Table 3: #4). The soil was washed through a mesh and reduced to a small mass, which was placed evenly on Whatman No.1 filter paper in 9 cm Petri dishes. Petri dishes were kept under laboratory conditions at 20/15 °C (optimum temperature) and weekly counts of P. minor seedlings were recorded, which continued for 30 days; at every count, germinated seedlings were uprooted. The experimental plots were the second season under the same layout and treatment; hence, the efficacy of the weed seed harvest (WSH) was calculated based on the comparison of number of surviving seedlings in the herbicide + WSH treatment vs. the herbicide-only treatment and transformed from a two-year rate to an annual rate (Table 3: #23).

2.1.3. Experiment 3: Effect of Spray Nozzles

The paddy rice crop was harvested with a combine harvester. All residues were retained on the soil surface at the time of harvest. After the paddy rice was harvested, a pre-sowing irrigation was applied to ensure adequate moisture in the soil for sowing of the wheat. When the field attained a workable soil moisture, the residues were cut into small pieces (7.5–15.0 cm) with one pass of cutter-cum-spreader. Wheat was sown directly (zero-tillage) using a happy seeder on 5 November 2019 using 100 kg seeds ha−1. The seeds were placed at 4–5 cm depth in 20 cm spaced rows. Recommended doses of fertilisers, 137.5 kg ha−1 DAP (18% N and 46% P2O5) and 275 kg ha−1 Urea (46% N), were applied. The full dose of DAP was drilled at sowing. Urea was applied before irrigation at a workable field moisture. PXD was applied 30 days after sowing, after first irrigation, using three different spray nozzles: flat fan (FF), which was the default nozzle type in all other experiments, air induction twin jet (AI), and field jet (FJ). All nozzles delivered 625 L water per ha. Weed control efficacy was calculated based on the number of surviving seedlings in the treated plots vs. untreated weedy control at the end of the season. Efficacy values for FF were calculated and used as a benchmark for comparison with AI and FJ. For each nozzle type, average, standard deviation, and minimum and maximum values were calculated from four replications (Table 3: #22).

2.2. Model Description

The individual-based model algorithm followed the model of Liu et al. [34], which incorporates the life cycle of the annual weed P. minor, the resistance profile to the herbicides of interest and the effects of chemical and non-chemical weed control tactics (Table 3). Three major cohorts of emerged P. minor were considered in the wheat season, which were divided by sowing and first and second irrigations. The amount of weed emergence in the cohorts differed with wheat establishment methods and sowing time. Herbicides were assumed to provide optimal efficacy at recommended rates, with a 5% variation. Resistance to PXD and MTZ was assumed to be endowed by single target-site mutations (qualitative trait denoted by genotypes RR, RS and SS), while resistance to PDM and PYR was assumed to be endowed by non-target-site mechanisms (quantitative trait denoted by phenotypic value Pz). Weed density and % evolved resistance emerged from the 10 year iterations. The model was implemented in NetLogo 6.0 [35].
Ten representative scenarios with varying crop rotation, wheat establishment method, sowing time, herbicides, and WSH were tested in the model (Table 4). Additionally, variations around P. minor emergence, herbicide efficacy and the effect of herbicide spray nozzles were introduced, based on the field experiments described above. Since not all parameters were tested in the field experiments, the account of variability only applied to a sub-set of the scenarios (S4 (var.) and S7 (var.)).
In the model, weed density was capped at 10 plants/m2, an economic threshold above which yield loss was deemed, and the simulations were stopped; hence, not all scenarios were run for 10 years.

2.3. Statistical Analysis

Each scenario in the model was run with 100 replicates, all of which were presented by different coloured lines in the resulting figures for visual comparison of weed density and % resistance over the 10 year simulation period. The probability of density exceeding 10 plants/m2 and % resistance exceeding 20% out of the 100 replicates were also presented. For model predictions presented in the form of probabilities, statistical tests that depend on the number of replicates (t-tests etc.) are of little relevance because the number of replicates in the simulations can always be increased (in contrast to lab or field experiments) until a significant difference is achieved [25]. In addition, probability data by nature are bound between 0 and 1 and are often not normally distributed, which means the prerequisite for statistical tests such as ANOVA is not met. In this study, the number of replicates was explored in advance, and 100 replicates proved sufficient for differentiating and ranking between the scenarios.

3. Results

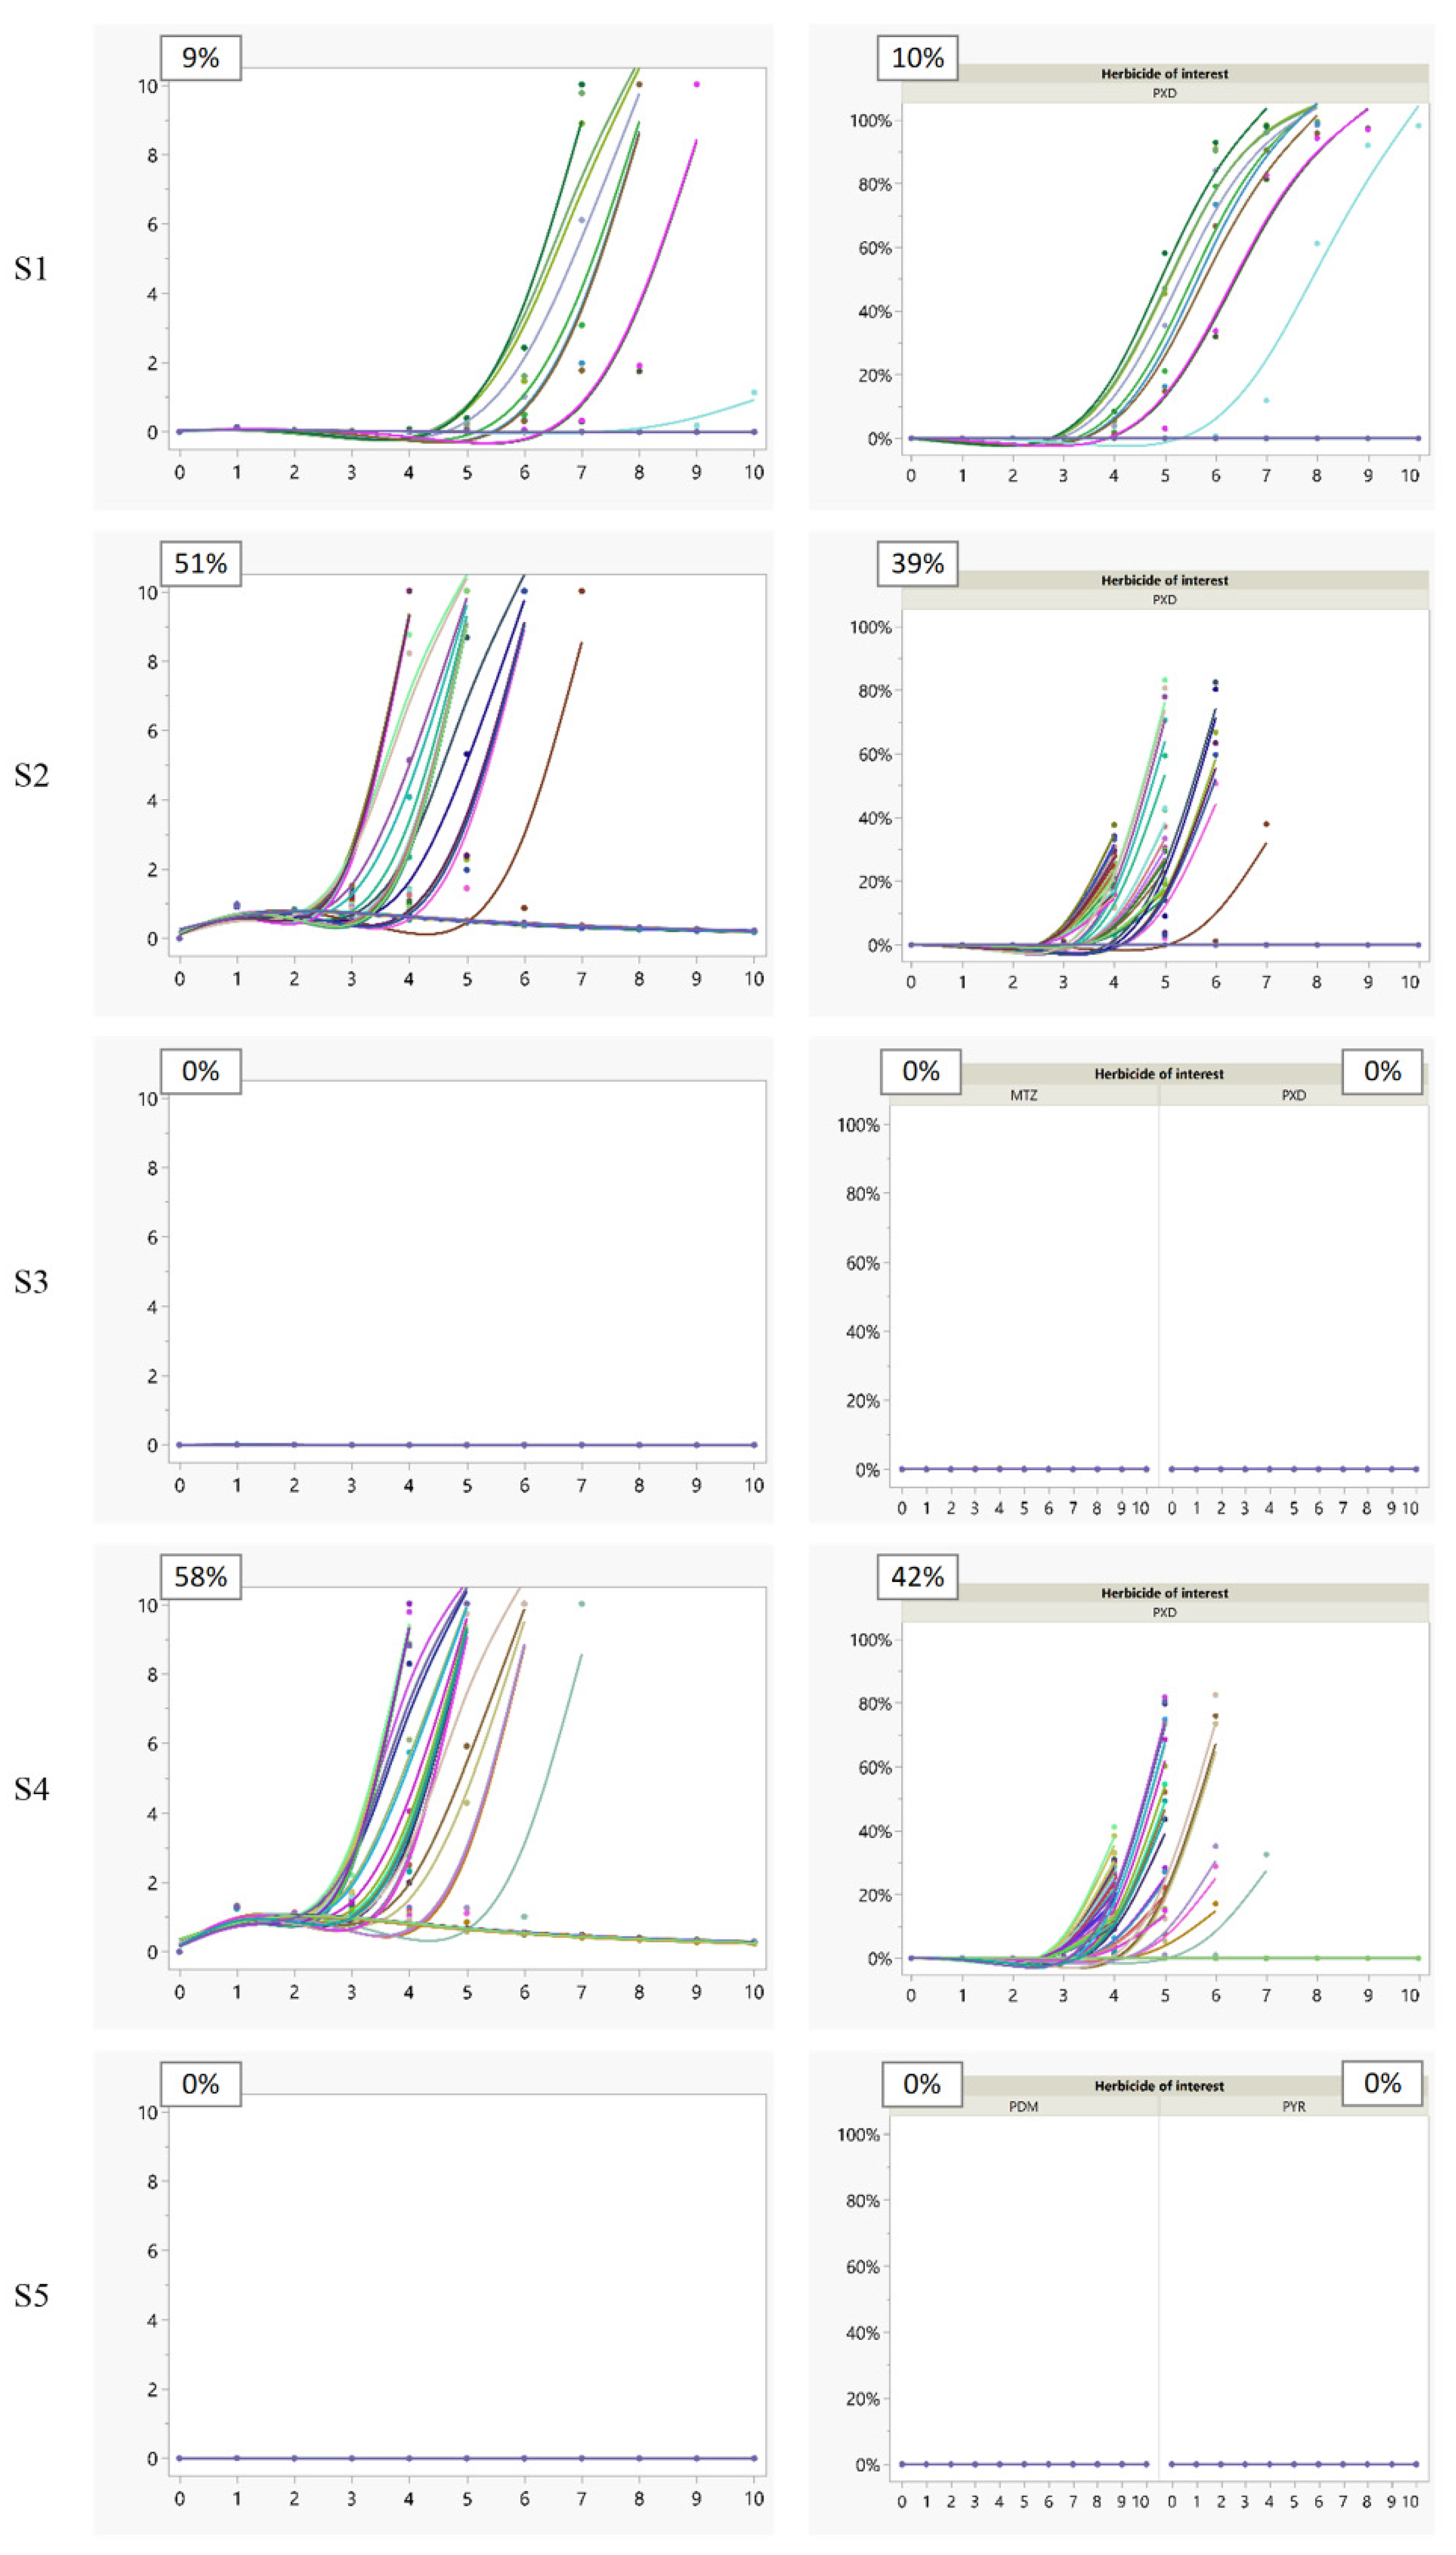
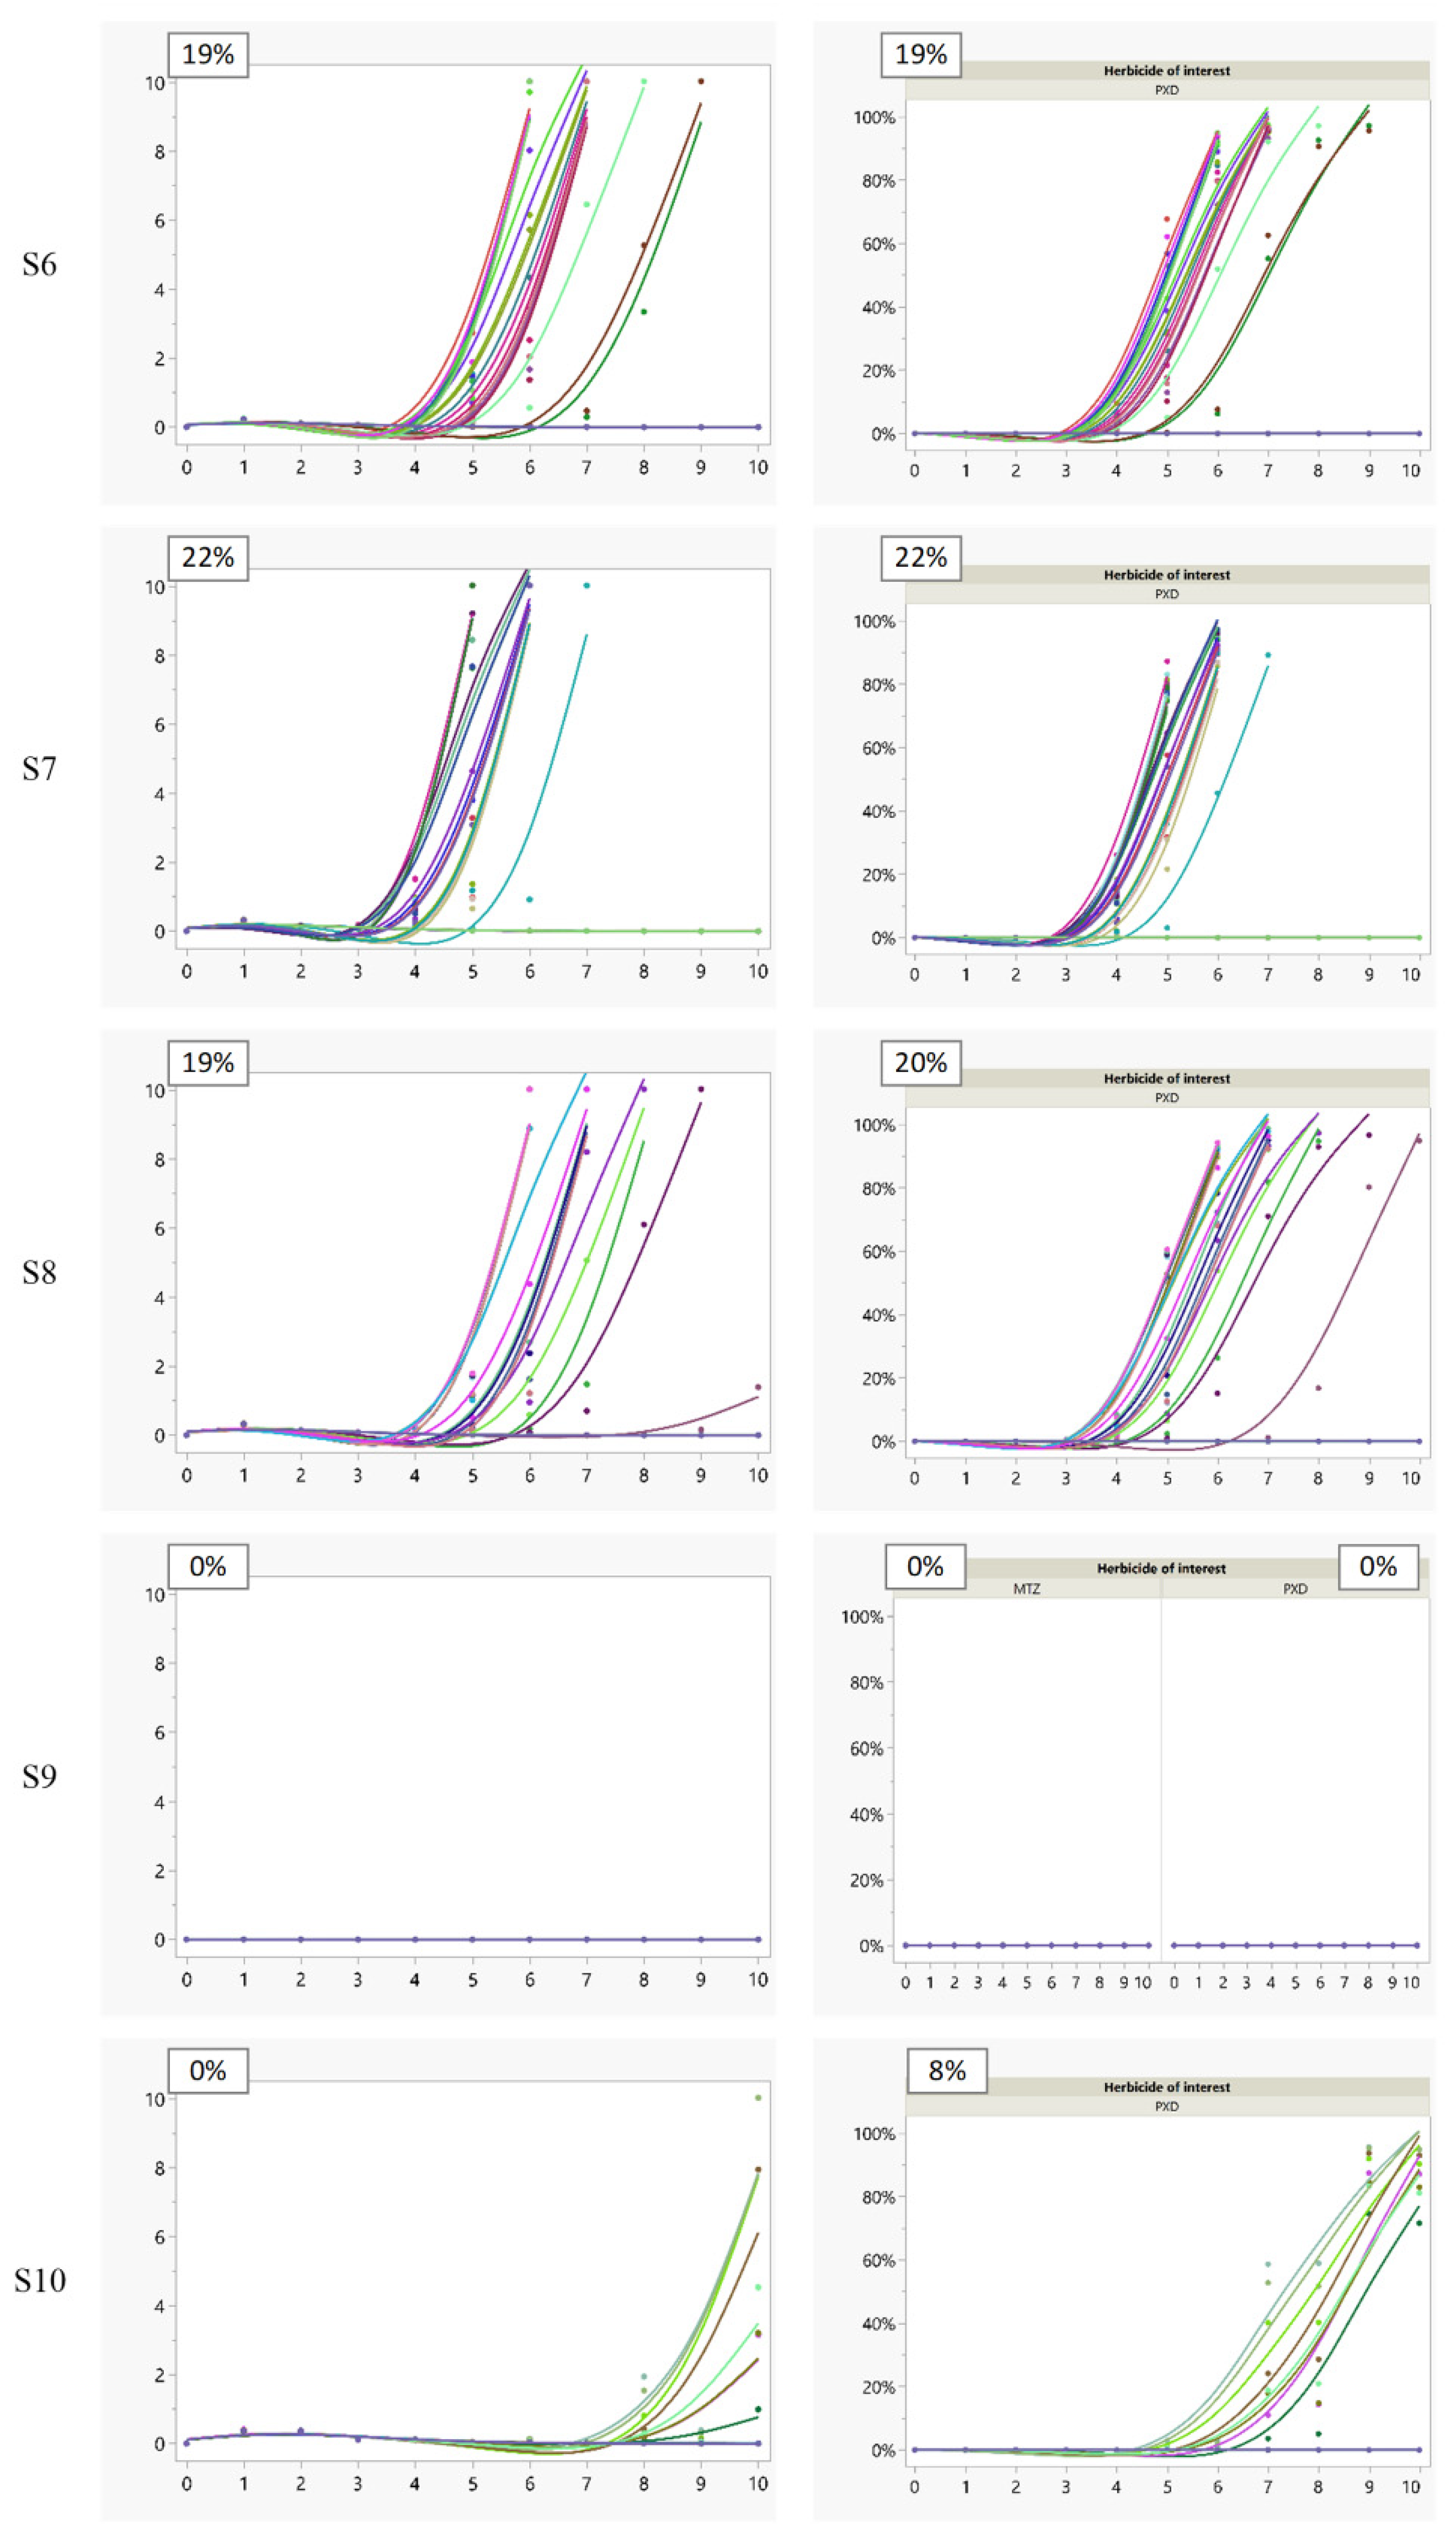
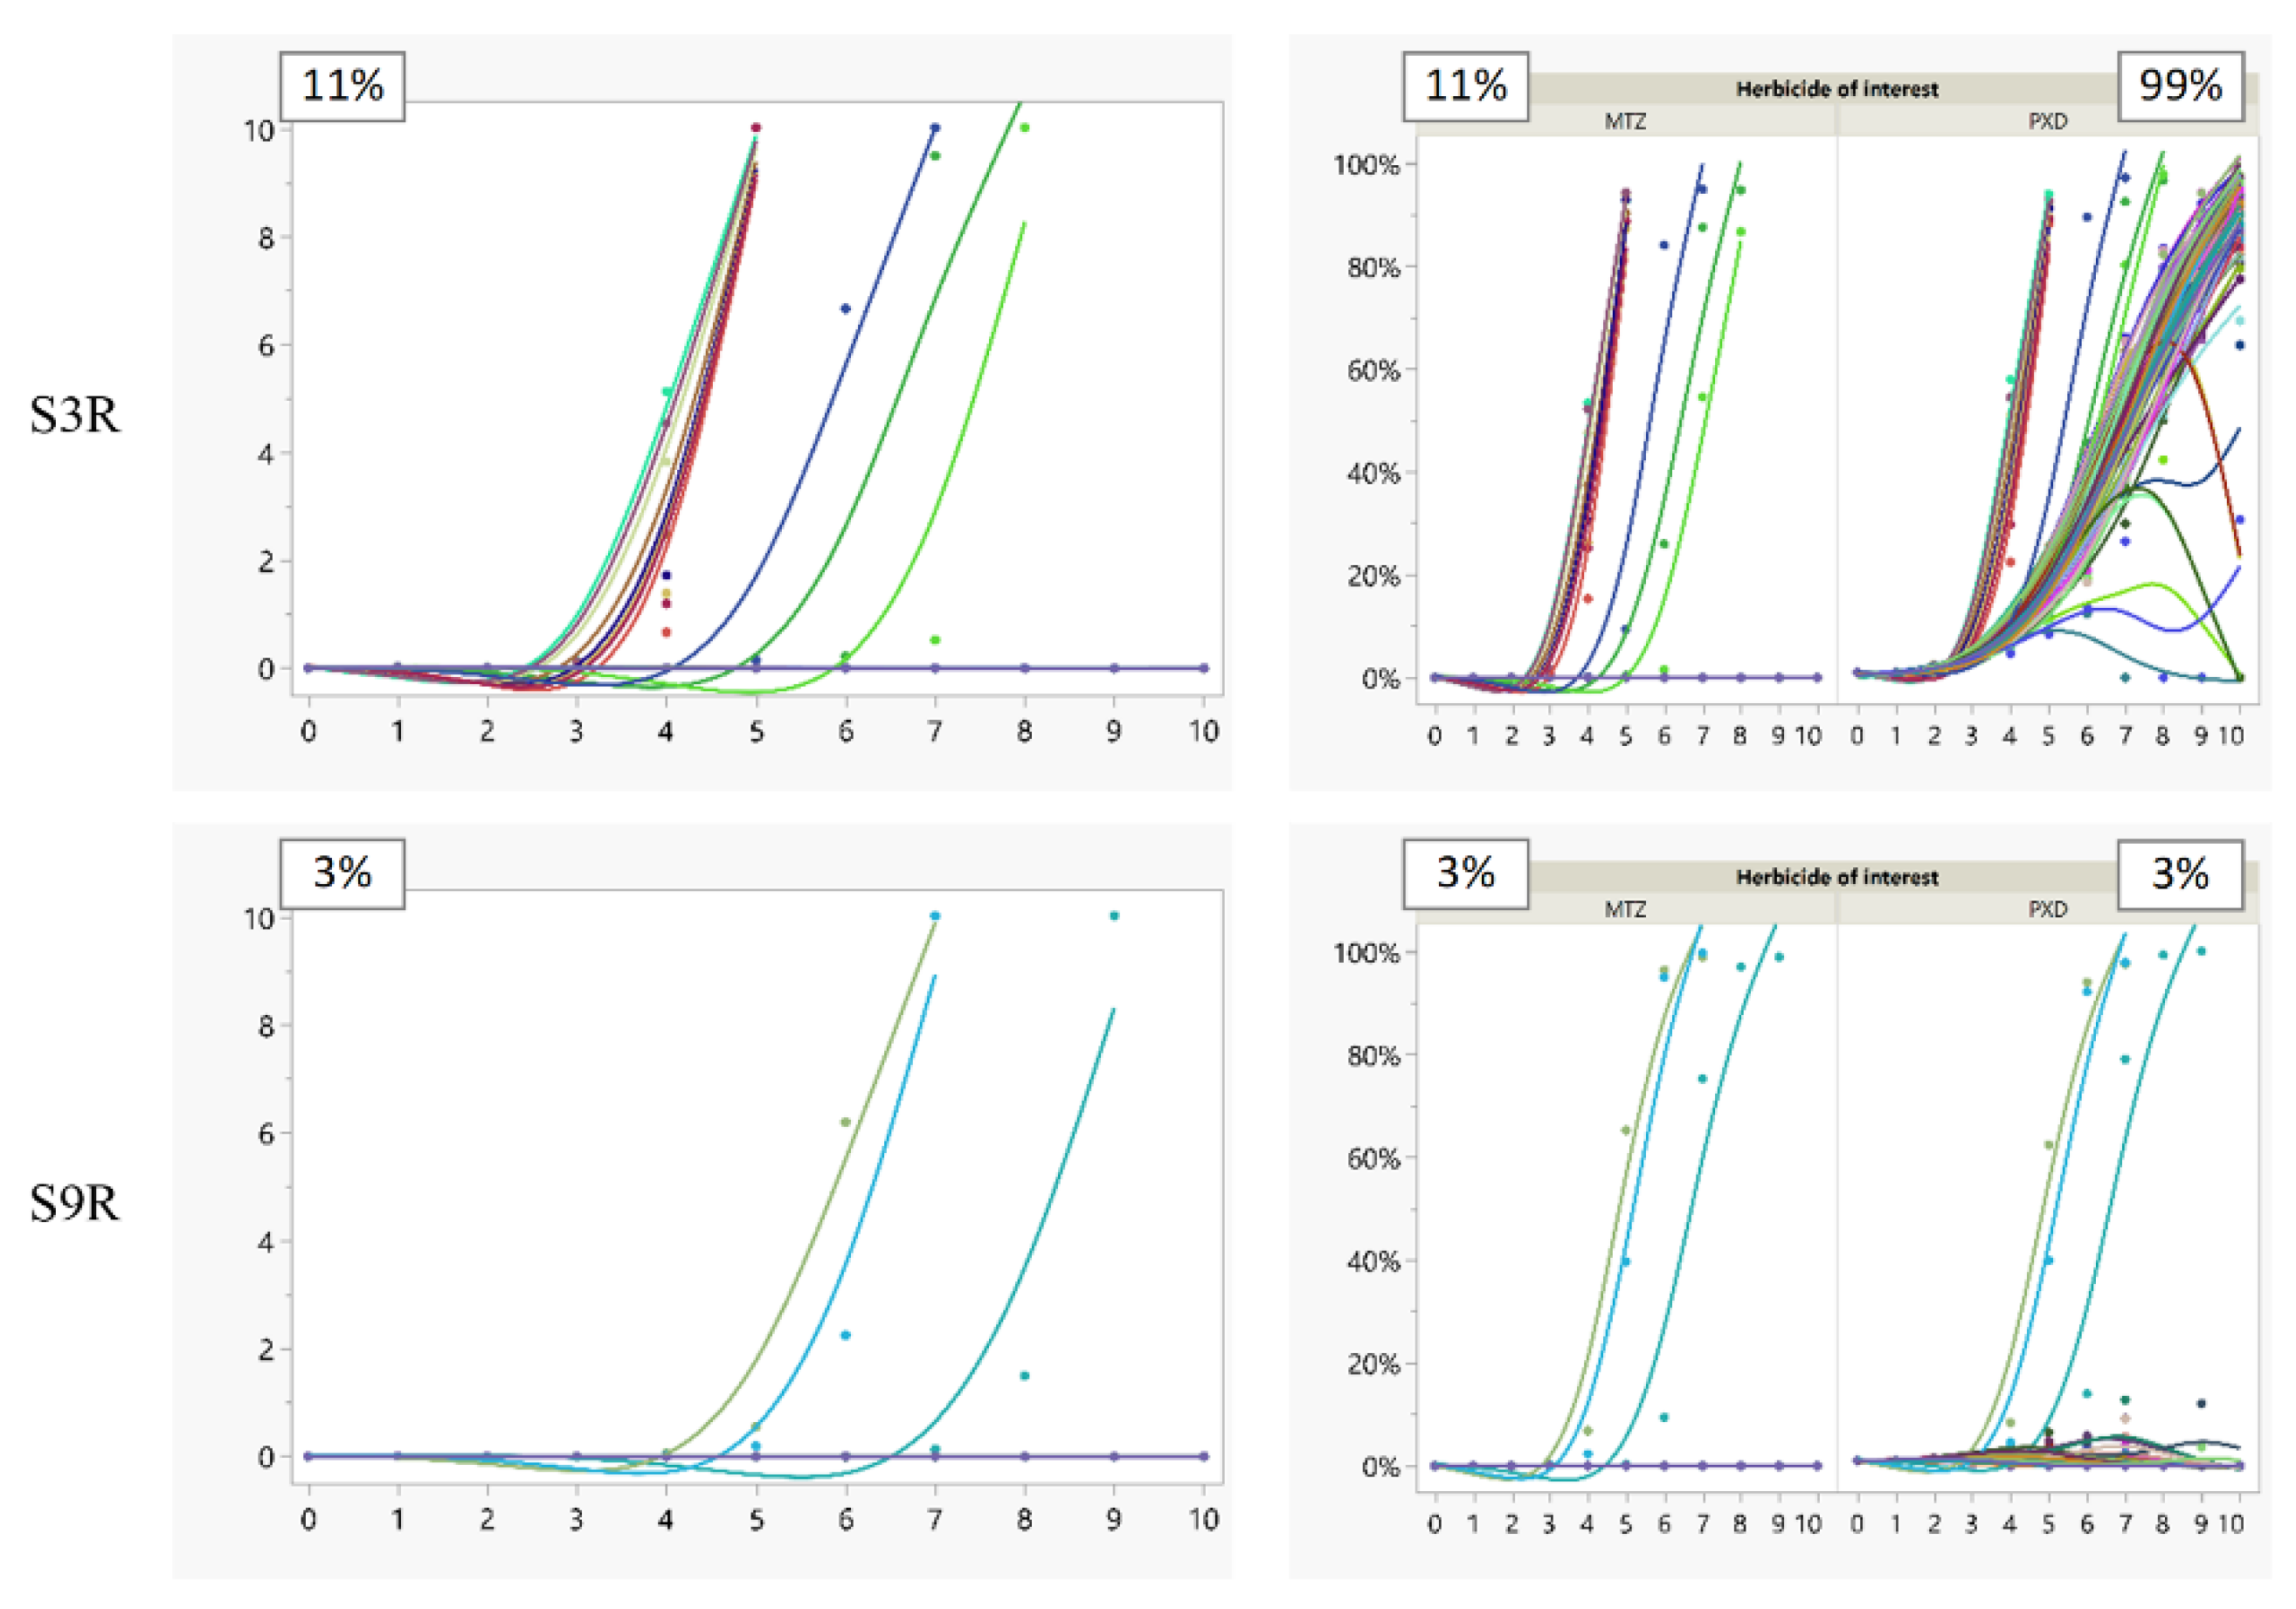
3.1. Representative Scenarios

In fields with sensitive P. minor populations, when pinoxaden (PXD) was used as the solo herbicide in the weed control programme, resistance evolved in 8–42% of the simulations (Figure 1S1,S2,S4,S6–S8,S10), whereas with mixtures of two herbicide MoAs, PXD plus metribuzin (MTZ) or pendimethalin (PDM) plus pyroxasulfone (PYR), resistance did not evolve in any of the replicated simulations (Figure 1S3,S5,S9). Among the different wheat establishment methods, burning (BN) resulted in the lowest risk of resistance and population density (Figure 1S1): in 91% of the cases, population density was maintained below two plants/m2 for 10 years, and the earliest sight of PXD-resistance (i.e., when it exceeded 20%) was in year five. The low risk was mainly because a total of only 12% P. minor emerged in the wheat season in BN (vs. benchmark of 100% in rotavator (RW) or conventional tillage (CT)). When wheat establishment was changed from BN to RW, using single herbicide PXD, resistance evolved in 39% of the cases, and the weed density exceeded the economic threshold of 10 plants/m2 soon after four years (Figure 1S2). Adding MTZ, a herbicide with a different MoA, PSII, had a strong effect in reducing resistance risk and maintaining optimum weed control (Figure 1S3): average weed density was <1 plant/m2 for 10 years in all the 100 replicates. CT resulted in similar weed density and resistance risk to RW when PXD solo was applied (Figure 1S4). Residual herbicides PDM mixed with PYR effectively controlled P. minor (density < 1 plant/m2). The mixture also leveraged the selection pressure on either herbicide, resulting in a low level of evolved resistance to PDM and PYR, even after 10 years of use (Figure 1S5). The happy seeder (HS) suppressed P. minor emergence by more than 60% compared to RW or CT (Table 3: #9), and so the probability of having weed control failure (i.e., density > 10 plants/m2) was three times lower than in RW and CT, using single herbicide MoA, PXD (Figure 1S6). Late sowing led to more P. minor emergence in Cohorts 1 and 2 (Table 3: #9), which produced more seeds than those emerging later in the season, and so resulted in 3% higher probability of weed control failure than early sowing (Figure 1S7 vs. Figure 1S6). Additionally, weed seed harvest (WSH) towards the end of the season further reduced weed density, and growers could gain one to two more years of good control (Figure 1S8 vs. Figure 1S7). Although the probability of evolved resistance did not reduce within the 10 year time scale, the onset of resistance was effectively delayed by WSH. Adding MTZ to the POST application in HS had a stronger effect in reducing weed density than WSH (Figure 1S9 vs. Figure 1S8). Where sugarcane replaced rice in the crop rotation, P. minor density and herbicide resistance were kept at lower levels than HS + WSH (Figure 1S10 vs. Figure 1S8), because of the smothering effect of sugarcane during its late stage of growth, the frequent mechanical control, as well as the use of residual herbicides such as atrazine and diuron at sufficiently high doses, controlling seedlings of all cohorts of P. minor.
In fields where P. minor have already started to evolve resistance (1%) to PXD, MTZ is often added to the programme to control the resistant plants. HS was more effective in reducing the risk of MTZ resistance and so led to lower weed density than RW (Figure 2S9R vs. Figure 2S3R).

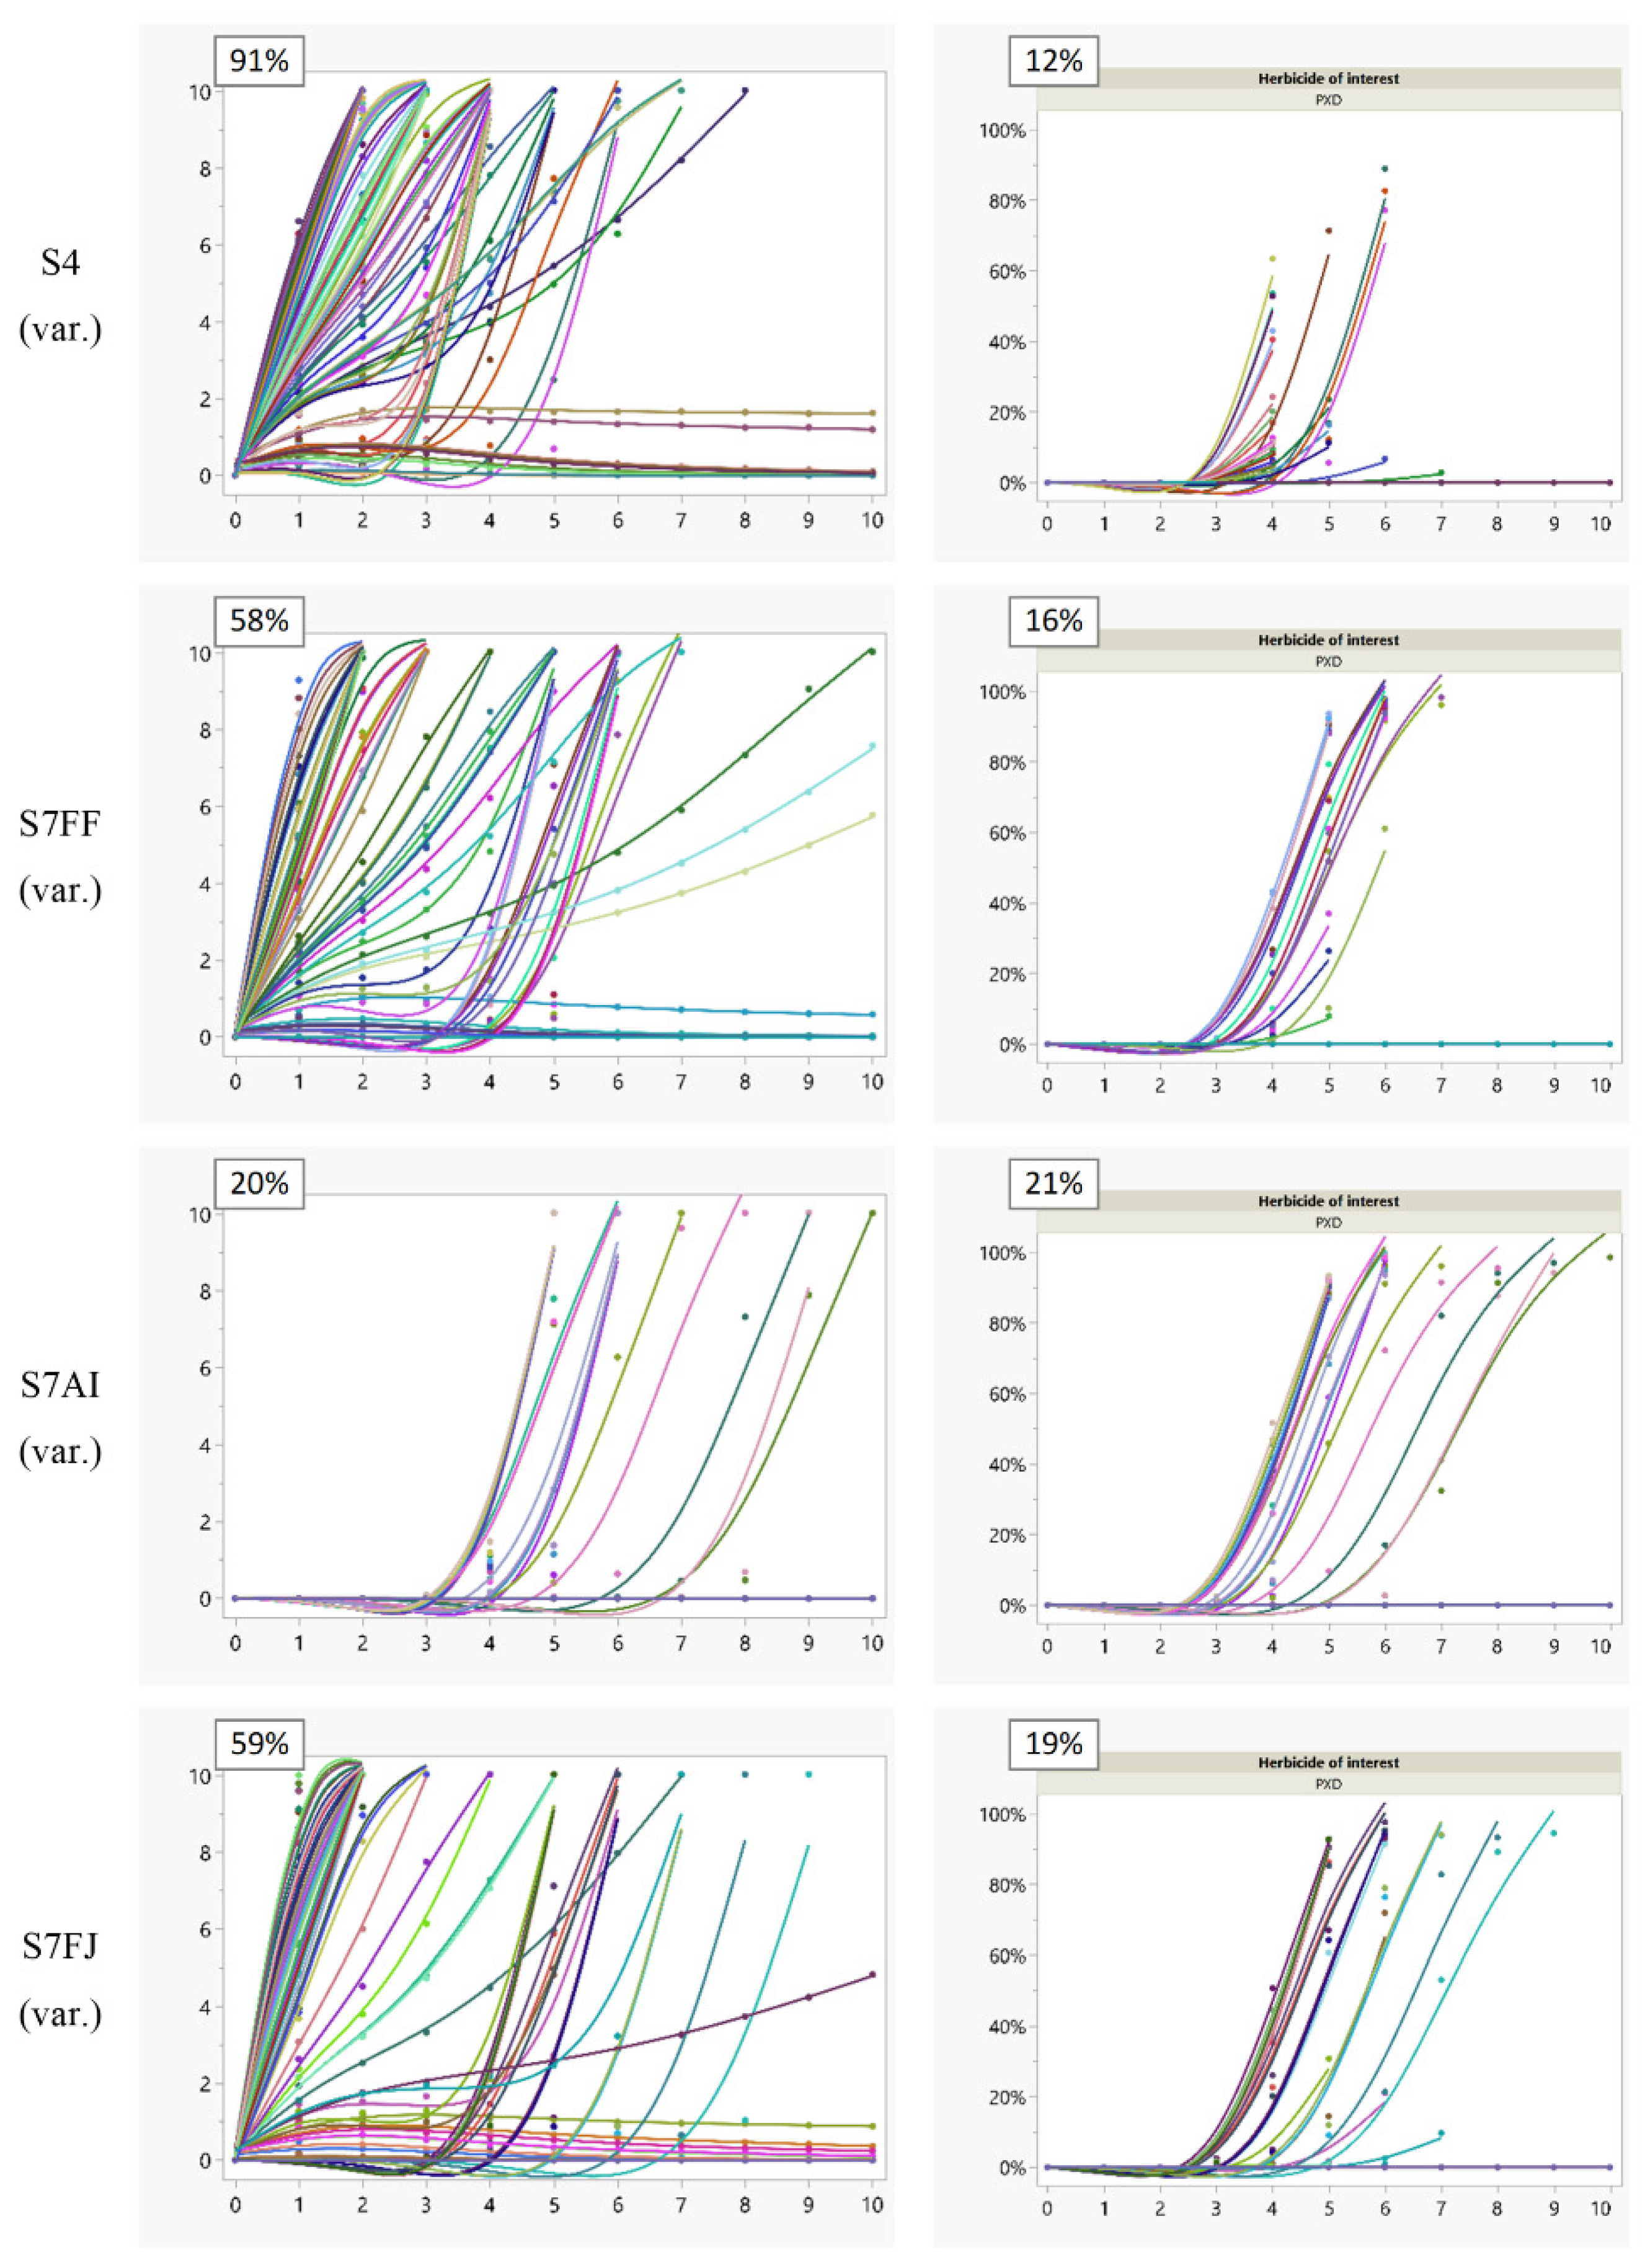
3.2. Variability in Model Predictions

When variation around P. minor emergence and PXD efficacy was considered in CT, the resulting probability of evolved PXD resistance was lower but the probability of weed density exceeding the economic threshold was higher than when variation was not considered (Figure 3S4 (var.) vs. Figure 1S4), indicating the importance of other factors in agricultural reality, for example, weather affecting weed emergence and herbicide performance. In HS, the magnitude of variation around P. minor emergence was minute (Table 3: #10), and the major source of variation was the nozzle type (Table 3: #22). Air induction (AI) had the most stable performance (Figure 3S7 AI (var.)) and was effective in delaying resistance evolution compared to the default nozzle type, flat fan (FF) (Figure 1S7). Field jet (FJ) had similar levels of variation to FF, in which the best case still resulted in 10 years of low weed density, similar to the simulation without variation (Figure 1S7). However, the average density across 100 simulations in, e.g., year four, was 6–10 times higher in FF (var.) and FJ (var.) (Figure 3) than that without variation (Figure 1S7). When herbicide efficacy was low, despite the quick weed control failure, more sensitive individuals survived in the population and resulted in a dilution effect and delayed evolution of resistance (e.g., Figure 3S7 FJ (var.)).

4. Discussion

In this study, we used a population model of P. minor to quantify the interactions of different chemical and agronomic weed control practices in an Integrated Weed Management (IWM) programme. This demonstrates the value of technological advancement, such as information systems and decision support tools, in the design of IWM [36]. We concluded that using a single herbicide mode of action resulted in a high risk of resistance and weed control failure. Agronomic practices, such as a happy seeder (HS), when used alone, provided moderate mitigation effects, and a stronger effect was achieved when it was combined with weed seed harvest (WSH). When two herbicide MoAs were concerned, HS also reduced the risk of metribuzin resistance as compared to a rotavator. Integrating herbicides with agronomic practices proved the most effective and sustainable solution (Figure 1S9 and Figure 2S9R). Despite the potential benefits of IWM, growers may not always be willing or ready to adopt these programmes, as the efficacy of agronomic practices is usually lower than herbicides, and their performance is often perceived as fluctuating and unreliable [15,37]. In our simulations, when variation associated with spray nozzles was considered, the added value was limited; in the best case, weed control quality was similar to non-IWM programmes, while the poorer cases were more detrimental than non-IWM programmes. Other barriers for IWM adoption include lack of direct economic benefit and sustained support from the government, availability and cost of cover crop seeds, the short window between harvest and sowing making it impractical to introduce cover crops, higher water consumption, and the lack of transportation and channels to sell less popular and profitable commodities [15,38,39]. Since IWM focuses on the causes of weed problems rather than simply reacting to existing weed populations [14], it requires growers to have sufficient understanding of agro-ecology and ecological diversity [15]. Population models can contribute to grower education by demonstrating the consequences of good and bad practices. For example, in this study, the importance of reducing weed seed input into the soil seedbank using WSH or effective crop rotations was highlighted (Figure 1S8,S10).
Population models can also contribute to the exploration of variability in the performance of IWM. Depending on the purpose of the model, uncertainty can be reduced or addressed in different ways. For example, for educational models that aim to promote good management practices, such as the first part of our work, variability relating to atypical weather or unrecommended practices such as spraying herbicides at reduced rates can be ignored; whereas for models supporting decision making on a site- and time-specific basis [14], the potential variability needs to be accounted for. In the present work, we had the opportunity to conduct field experiments that specifically fed into the model to represent the variability of natural emergence patterns and nozzle efficacy, in addition to the ten non-variable scenarios. The experiments pointed to some cases where RW gave better weed control than HS (Figure 1S2,S3 vs. Figure 3S7FF (var.)). Normally, a happy seeder suppresses weed emergence by creating a mulch of rice residue on the soil surface. A rotavator (RW) incorporates rice residue and leads to high soil moisture, which favours weed emergence. However, when sub-optimum nozzles were used in HS, there was a risk of the herbicide solution not effectively reaching the weeds that were hidden under the rice residue, whereas in RW-sown wheat, all weed plants were exposed and hence better controlled. In these circumstances, expert judgement provided an important interpretation of the seeming outliers in the experiments. According to the central theme of “pattern-oriented modelling”, the basic mechanisms driving a biological system are best identified when we simultaneously look at a diversified range of general patterns, instead of attempting to quantitatively match model outputs with a few detailed and context-specific patterns [25]. Expert judgement here essentially served as pattern-oriented modelling, on the basis of many years of agronomy knowledge and field experience. It is also important to note that uncertainty in parameter values and variability of the modelled system are two different concepts. Variability from a replication experiment does not necessarily represent all sources of variability in the real system [25]. For example, our experiments were done in adjacent areas and within the same season, and so temporal variation across years could not be addressed. In the future, with the wide adoption of farm management tools, the amount of multi-year, multi-site data under various conditions will grow exponentially and become available for use in models. Mechanistic effect models may find it challenging to explore such massive data spaces. The fast development of machine-learning techniques presents a special opportunity in dealing with these multimodality, multifidelity data, revealing the correlations between intertwined phenomena [40]. Although current machine-learning models in weed science focus mainly on image analysis and physiological predictions of plant growth [41], they have the potential to go further and make more complicated predictions on evolutionary processes such as resistance. A hybrid model between data-driven approaches and knowledge-based mechanistic effect models is a promising direction, as proved by the preliminary success in adjacent disciplines such as hydrology [42], biomedical and human health [40], earth system sciences [43] and environmental sciences [44].
In addition to herbicide resistance, weeds also show evolutionary adaption to non-chemical control methods [45] (e.g., Echinochloa crus-galli adapted to hand weeding by mimicking the morphological characteristics of rice, A. myosuroides adapted to spring cropping), although this is more likely to happen over a longer time scale, considering the moderate selection pressure as compared to herbicides. Therefore, recurrent parameterisation and recalibration of weed models will be necessary as the environment changes and weed control tactics evolve [15,24,41]. Finally, factors other than weed control and resistance evolution are also important in sustainable agriculture, and an ideal digital tool will also model and balance land value, soil health, water quality, biodiversity and ecosystems.

Author Contributions

Conceptualization, C.L., M.S.B. and S.S.K.; methodology, C.L., M.S.B., J.K. and S.S.K.; software, C.L.; validation, C.L. and M.S.B.; formal analysis, C.L., M.S.B. and T.K.; investigation, C.L., M.S.B., T.K., J.K., S.R.S.R. and M.S.; data curation, C.L., M.S.B., T.K., S.R.S.R. and M.S.; writing—original draft preparation, C.L.; writing—review and editing, M.S.B., T.K., J.K. and S.S.K.; visualization, C.L.; supervision, M.S.B. and S.S.K.; project administration, J.K. All authors have read and agreed to the published version of the manuscript.

Funding

This research received no external funding.

Data Availability Statement

The original contributions presented in the study are included in the article; further inquiries can be directed to the corresponding author.

Acknowledgments

The authors would like to thank Punjab Agricultural University Ludhiana for providing the required facilities for conducting the field research trials and Gael Le Goupil for helpful discussions.

Conflicts of Interest

Authors C.L., J.K. and S.S.K. are employees of Syngenta, which sells sulfosulfuron, clodinafop, pinoxaden, metribuzin, atrazine and pendimethalin. This work was a collaboration between Syngenta and Punjab Agricultural University.

Abbreviations

ACCaseacetyl CoA carboxylase
AIair induction twin jet nozzle
ALSacetolactate synthase
BNburning followed by zero-tillage
CTbaling followed by conventional tillage
DAPDiammonium Phosphate
DUEdata uncertainty engine
FFflat fan nozzle
FJfield jet nozzle
HShappy seeder, a tractor-mounted mulching and sowing machine zero-tillage with rice residue on soil surface
IWMIntegrated Weed Management
MCDAmulticriteria decision analysis
MoAmode of action
MTZmetribuzin
PDMpendimethalin
POSTpost-emergence application
PREpre-emergence application
PSIIphotosystem II
PXDpinoxaden
PXD-Rpinoxaden-resistance or pinoxaden-resistant
PYRpyroxasulfone
RBDrandomized complete block
RWincorporation with rotavator
var.variability
WSHweed seed harvest

References

  1. Franke, A.; Singh, S.; McRoberts, N.; Nehra, A.; Godara, S.; Malik, R.; Marshall, G. Phalaris minor seedbank studies: Longevity, seedling emergence and seed production as affected by tillage regime. Weed Res. 2007, 47, 73–83. [Google Scholar] [CrossRef]
  2. Malik, R.K.; Singh, S. Evolving strategies for herbicide use in wheat: Resistance and integrated weed management. In Integrated Weed Management for Sustainable Agriculture, Proceedings of Silver Jubilee International Symposium, Indian Soc Weed Sci, Hisar, Haryana, India, 18–20 November 1993; Malik, R.K., Ed.; Indian Society of Weed Science: Hisar, India, 1993; pp. 225–238. [Google Scholar]
  3. Walia, S.S.; Brar, L.S.; Dhaliwal, B.K. Resistance to isoproturon in Phalaris minor Retz. in Punjab. Plant Prot. Q. 1997, 12, 138–140. [Google Scholar]
  4. Chhokar, R.S.; Sharma, R.K. Multiple herbicide resistance in littleseed canarygrass (Phalaris minor): A threat to wheat production in India. Weed Biol. Manag. 2008, 8, 112–123. [Google Scholar] [CrossRef]
  5. Bhullar, M.S.; Walia, U.S.; Brar, L.; Gill, G. Studies on cross resistance behaviour in isoproturon resistant Phalaris minor to different herbicides. In Proceedings of the International Workshop “Herbicide Resistance Management and Zero-Tillage in Rice-Wheat Cropping System”, Hisar, India, 4–6 March 2002; Malik, R.K., Balyan, R.S., Yadav, A., Pahwa, S.K., Eds.; pp. 24–26. [Google Scholar]
  6. Bhullar, M.S.; Punia, S.S.; Tomar, S.S.; Singh, V.P.; Sharma, J.D. Littleseed canarygrass resistance to clodinafop in Punjab: Farmers’ perspective. Indian J. Weed Sci. 2014, 46, 237–240. [Google Scholar]
  7. AICRP-WM. 42nd Annual Technical Report of All India Coordinated Research Project on Weed Management; Department of Agronomy, Punjab Agricultural University: Ludhiana, India, 2019; p. 106. [Google Scholar]
  8. Kaur, N.; Kaur, T.; Kaur, S.; Bhullar, M.S. Development of cross resistance in Phalaris minor Retz. L. in Punjab. Agric. Res. J. 2016, 53, 69–72. [Google Scholar] [CrossRef]
  9. Malik, R.K.; Singh, S. Littleseed canarygrass (Phalaris minor) resistance to isoproturon in India. Weed Technol. 1995, 9, 419–425. [Google Scholar] [CrossRef]
  10. Singh, S.; Kirkwood, R.; Marshall, G. Biology and control of Phalaris minor Retz. (littleseed canarygrass) in wheat. Crop Prot. 1999, 18, 1–16. [Google Scholar] [CrossRef]
  11. Om, H.; Kumar, S.; Dhiman, S.D. Biology and management of Phalaris minor in rice–wheat system. Crop. Prot. 2004, 23, 1157–1168. [Google Scholar] [CrossRef]
  12. Bajwa, A.A.; Mahajan, G.; Chauhan, B.S. Nonconventional weed management strategies for modern agriculture. Weed Sci. 2015, 63, 723–747. [Google Scholar] [CrossRef]
  13. Scavo, A.; Mauromicale, G. Integrated weed management in herbaceous field crops. Agronomy 2020, 10, 466. [Google Scholar] [CrossRef] [Green Version]
  14. Buhler, D.D. 50th anniversary—Invited article: Challenges and opportunities for integrated weed management. Weed Sci. 2002, 50, 273–280. [Google Scholar] [CrossRef]
  15. Swanton, C.J.; Mahoney, K.J.; Chandler, K.; Gulden, R.H. Integrated weed management: Knowledge-based weed management systems. Weed Sci. 2008, 56, 168–172. [Google Scholar] [CrossRef]
  16. Renton, M.; Busi, R.; Neve, P.; Thornby, D.; Vila-Aiub, M. Herbicide resistance modelling: Past, present and future. Pest Manag. Sci. 2014, 70, 1394–1404. [Google Scholar] [CrossRef]
  17. Liebman, M.; Gallandt, E.R.; Jackson, L. Many little hammers: Ecological management of crop-weed interactions. Ecol. Agric. 1997, 1, 291–343. [Google Scholar]
  18. Begon, M.; Townsend, C.R.; Harper, J.L. Ecology: From Individuals to Ecosystems, 4th ed.; Blackwell: Oxford, UK, 2006; p. 448. [Google Scholar]
  19. Peters, K.; Breitsameter, L.; Gerowitt, B. Impact of climate change on weeds in agriculture: A review. Agron. Sustain. Dev. 2014, 34, 707–721. [Google Scholar] [CrossRef] [Green Version]
  20. Wu, C.X.; Owen, M.D.K. When is the best time to emerge: Reproductive phenology and success of natural common waterhemp (Amaranthus rudis) cohorts in the Midwest United States? Weed Sci. 2014, 62, 107–117. [Google Scholar] [CrossRef]
  21. Ziska, L.H. The role of climate change and increasing atmospheric carbon dioxide on weed management: Herbicide efficacy. Agric. Ecosyst. Environ. 2016, 231, 304–309. [Google Scholar] [CrossRef] [Green Version]
  22. Lutman, P.J.W.; Moss, S.R.; Cook, S.; Welham, S.J. A review of the effects of crop agronomy on the management of Alopecurus myosuroides. Weed Res. 2013, 53, 299–313. [Google Scholar] [CrossRef]
  23. Hay, M.M.; Dille, J.A.; Peterson, D.E. Integrated pigweed (Amaranthus spp.) management in glufosinate-resistant soybean with a cover crop, narrow row widths, row-crop cultivation, and herbicide program. Weed Technol. 2019, 33, 710–719. [Google Scholar] [CrossRef]
  24. Ascough, J.C.; Maier, H.R.; Ravalico, J.K.; Strudley, M.W. Future research challenges for incorporation of uncertainty in environmental and ecological decision-making. Ecol. Model. 2008, 219, 383–399. [Google Scholar] [CrossRef]
  25. Railsback, S.F.; Grimm, V. Agent-Based and Individual-Based Modeling: A Practical Introduction; Princeton University Press: Princeton, NJ, USA, 2019. [Google Scholar]
  26. Kiker, G.A.; Bridges, T.S.; Varghese, A.; Seager, T.P.; Linkov, I. Application of multicriteria decision analysis in environmental decision making. Integr. Environ. Assess. Manag. 2005, 1, 95–108. [Google Scholar] [CrossRef]
  27. Brown, J.D.; Heuvelink, G.B.M. The data uncertainty engine (DUE): A software tool for assessing and simulating uncertain environmental variables. Comput. Geosci. 2007, 33, 172–190. [Google Scholar] [CrossRef]
  28. Menalled, F.D.; Marino, P.C.; Renner, K.A.; Landis, D.A. Post-dispersal weed seed predation in Michigan crop fields as a function of agricultural landscape structure. Agric. Ecosyst. Environ. 2000, 77, 193–202. [Google Scholar] [CrossRef]
  29. Sarabi, V. Factors that influence the level of weed seed predation: A review. Weed Biol. Manag. 2019, 19, 61–74. [Google Scholar] [CrossRef]
  30. Om, H.; Kumar, S.; Dhiman, S. Dormancy and viability of Phalaris minor seed in a rice–wheat cropping system. Weed Res. 2005, 45, 140–148. [Google Scholar] [CrossRef]
  31. Chhokar, R.; Singh, S.; Sharma, R.; Singh, M. Influence of straw management on Phalaris minor Retz. control. Indian J. Weed Sci. 2009, 41, 150–156. [Google Scholar]
  32. Bhan, V.; Choudary, D. Germination, growth and reproductive behaviour of Phalaris minor Retz. as affected by date of planting. Indian J. Weed Sci. 1976, 8, 126–130. [Google Scholar]
  33. Singh, R.; Yadav, D.B.; Yadav, A.; Punia, S.S. Characterization of herbicide use and factors responsible for herbicide resistance in Phalaris minor in wheat in Haryana, India. Crop. Prot. 2021, 144, 105581. [Google Scholar] [CrossRef]
  34. Liu, C.; Bridges, M.E.; Kaundun, S.S.; Glasgow, L.; Owen, M.D.; Neve, P. A generalised individual-based algorithm for modelling the evolution of quantitative herbicide resistance in arable weed populations. Pest Manag. Sci. 2017, 73, 462–474. [Google Scholar] [CrossRef]
  35. Wilensky, U. NetLogo. 1999. Available online: http://ccl.northwestern.edu/netlogo/ (accessed on 9 October 2019).
  36. Young, S.L.; Pitla, S.K.; Van Evert, F.K.; Schueller, J.K.; Pierce, F.J. Moving integrated weed management from low level to a truly integrated and highly specific weed management system using advanced technologies. Weed Res. 2017, 57, 1–5. [Google Scholar] [CrossRef] [Green Version]
  37. Moss, S. Integrated weed management (IWM): Why are farmers reluctant to adopt non-chemical alternatives to herbicides? Pest Manag. Sci. 2019, 75, 1205–1211. [Google Scholar] [CrossRef] [PubMed]
  38. Rubione, C. Can herbicide resistance evolve due to factors other than a repeated use of technology? Argentina, a case to consider. Outlooks Pest Manag. 2017, 28, 213–219. [Google Scholar] [CrossRef]
  39. Gerhards, R.; Schappert, A. Advancing cover cropping in temperate integrated weed management. Pest Manag. Sci. 2020, 76, 42–46. [Google Scholar] [CrossRef] [PubMed]
  40. Alber, M.; Buganza Tepole, A.; Cannon, W.R.; De, S.; Dura-Bernal, S.; Garikipati, K.; Karniadakis, G.; Lytton, W.W.; Perdikaris, P.; Petzold, L.; et al. Integrating machine learning and multiscale modeling—perspectives, challenges, and opportunities in the biological, biomedical, and behavioral sciences. NPJ Digit. Med. 2019, 2, 115. [Google Scholar] [CrossRef]
  41. Bagavathiannan, M.V.; Beckie, H.J.; Chantre, G.R.; Gonzalez-Andujar, J.L.; Leon, R.G.; Neve, P.; Poggio, S.L.; Schutte, B.J.; Somerville, G.J.; Werle, R.; et al. Simulation models on the ecology and management of arable weeds: Structure, quantitative insights, and applications. Agronomy 2020, 10, 1611. [Google Scholar] [CrossRef]
  42. Shortridge, J.E.; Guikema, S.D.; Zaitchik, B.F. Machine learning methods for empirical streamflow simulation: A comparison of model accuracy, interpretability, and uncertainty in seasonal watersheds. Hydrol. Earth Syst. Sci. 2016, 20, 2611–2628. [Google Scholar] [CrossRef] [Green Version]
  43. Reichstein, M.; Camps-Valls, G.; Stevens, B.; Jung, M.; Denzler, J.; Carvalhais, N. Deep learning and process understanding for data-driven Earth system science. Nature 2019, 566, 195–204. [Google Scholar] [CrossRef]
  44. Langford, M.A.; Cheng, B.H.C. Enhancing learning-enabled software systems to address environmental uncertainty. In Proceedings of the 2019 IEEE International Conference on Autonomic Computing (ICAC), Umeå, Sweden, 16–20 June 2019; pp. 115–124. [Google Scholar]
  45. Bagavathiannan, M.V.; Davis, A.S. An ecological perspective on managing weeds during the great selection for herbicide resistance. Pest Manag. Sci. 2018, 74, 2277–2286. [Google Scholar] [CrossRef]
Figure 1. Simulated weed density (plants/m2, left panel) and % evolved resistance (right panel) to PXD, MTZ, PDM and PYR in PXD-sensitive fields in 10 years, with non-variable parameter settings. For scenario settings, see Table 4. X-axis = years. Different coloured lines represent 100 replicated simulations. Squared percentage values indicate the probability of weed density > 10 plants/m2 (left panel) and the probability of % evolved resistance >20% (right panel).
Agronomy 11 02331 g001aAgronomy 11 02331 g001b
Figure 2. Simulated weed density (plants/m2, left panel) and % evolved resistance (right panel) to PXD, MTZ, PDM and PYR in PXD-resistant fields in 10 years, with non-variable parameter settings. For scenario settings, see Table 4. X-axis = years. Different coloured lines represent 100 replicated simulations. Squared percentage values indicate the probability of weed density >10 plants/m2 (left panel) and the probability of % evolved resistance >20% (right panel).
Agronomy 11 02331 g002
Figure 3. Simulated weed density (plants/m2, left panel) and % evolved resistance (right panel) to PXD in 10 years, when variability around seedling emergence, herbicide efficacy and nozzle effect (only in S7 (var.)) was considered. For scenario settings, see Table 4. X-axis = years. Different coloured lines represent 100 replicated simulations. Squared percentage values indicate the probability of weed density >10 plants/m2 (left panel) and the probability of % evolved resistance >20% (right panel).
Agronomy 11 02331 g003
Table 1. Normal (long time average) climatic conditions during wheat growing period at Ludhiana.
MonthMaximum Temperature
(°C)
Minimum Temperature
(°C)
Precipitation (mm)
October31.816.85
November26.610.813
December20.66.521
January18.05.721
February21.27.939
March23.19.231
April34.717.520
Table 2. Experimental sites, treatments, seed bed preparation, sowing, fertilisation and irrigation details of field experiments at Ludhiana.
AttributeExperiment 1Experiment 2Experiment 3
1.
Experimental soil (0–15 cm)
Soil textureSandy loamSandy loamSandy loam
Sand (%)69.865.869.8
Silt (%)17.617.617.6
Clay (%)12.516.512.5
Organic carbon (%)0.380.450.38
pH7.407.87.40
EC (dsm−1) at 25° C0.450.140.45
Available N (kg ha−1)238242238
Available P2O5 (kg ha−1)21.317.521.3
Available K2O (kg ha−1)347262347
2.
Cropping season
2019–202019–20202019–2020
3.
Cropping system
Rice-wheatRice-wheatRice-wheat
4.
Treatments
Factor A (Date of sowing:3)
  • 26 October
  • 15 November
  • 5 December
Factor B (Weed control:2)
  • Untreated check
  • Pinoxaden 50 g per ha as post-emergence in 375 L water using flat fan nozzle
Factor A (Crop establishment:3)
C1. Conventional (all paddy residue removed)
C2. All paddy residue retained as surface mulch
C3. All paddy residue incorporated
Factor B (Weed control:3)
  • Untreated check
  • Herbicide (pre-mix of clodinafop 12% plus metribuzin 42% at 270 g ai per ha as post-emergence in 375 L water using flat fan nozzle
  • Herbicide followed by weed seed harvest (WSH) at late wheat stage. WSH was realised by running a power-operated handheld tea cutter across the field in the third week of March, to trim the P. minor ear panicles when they came up above the crop canopy.
Factor A (Herbicide:2)
  • Untreated check
  • Pinoxaden 50 g per ha as post-emergence in 625 L water
Factor B (Nozzle type:3)
  • Air induction twin jet
  • Field jet boomless with extra wide even spray
  • Flat fan
5.
Experimental design
Randomized complete block (RBD)RBDRBD
6.
Replications
434
7.
Seed bed preparation
All rice residues were removed at ground level at harvest and pre-sowing irrigation was applied. When field attained workable soil moisture, seed bed was prepared by one ploughing with disc harrow followed by two ploughings with tyne cultivator. C1: Same as in Experiment 1
C2: All rice residues retained on soil surface at harvest and pre-sowing irrigation was applied. When field attained workable soil moisture, residues were cut into small pieces with one pass of cutter-cum-spreader.
C3: All rice residues retained on soil surface, cut into small pieces with one pass of cutter-cum-spreader, incorporated with one pass of rotavator; pre-sowing irrigation was applied. When field attained workable soil moisture, seed bed prepared with another pass of rotavator.
Same as under C2 in Experiment 2
8.
Sowing method
Manually operated drillC1: Seed-cum-Fertiliser drill
C2: Happy Seeder
C3: Seed-cum-Fertiliser drill
Same as under C2 in Experiment 2
9.
Sowing date
As per treatment 7 November 20195 November 2019
10.
Seed rate per ha
100 kg 100 kg 100 kg
11.
Sowing depth
4–5 cm4–5 cm4–5 cm
12.
Row spacing
20 cm20 cm20 cm
13.
Fertilisation
137.5 kg ha−1 Di ammonium Phosphate (DAP; 18% N and 46% P2O5) and 275 kg ha−1 Urea (46% N). Full dose of DAP drilled at sowing. Urea broadcast in two equal splits, after first and second irrigation.Same as in Experiment 1, except urea application under C2 was made just before irrigationSame as under C2 in Experiment 2
14.
First irrigation
21 days after sowing 21 days after sowing21 days after sowing
15.
Harvest date
20 April 202024 April 202022 April 2020
Disc harrow: Medium tillage (10–15 cm depth) implement that cuts through and loosens the soil, chops up and incorporates plant residue. Tyne cultivator: Secondary tillage (5–10 cm depth) implement used for breaking clods and working soil to a fine tilth in preparation of seedbed. Seed-cum-fertiliser drill: Tractor-mounted machine that sows wheat and drills fertiliser at the same time. Happy seeder: Tractor-mounted machine that cuts and lifts paddy straw and sows wheat and drills fertilisers into soil directly after paddy harvest under zero till conditions and deposits paddy residue over sown area as surface mulch. Cutter-cum-Spreader: A small tractor-mounted implement that cuts paddy straw into small pieces (7.5–15.0 cm) and spreads uniformly across the field. Rotavator: A versatile tractor-mounted implement used for loosening and aerating soil up to a depth of 10–15 cm. It performs different functions, such as mixing soil, pulverisation and levelling, at the same time.
Table 3. Parameter values in the P. minor model. Variability was introduced to parameters #10, #21 and #22. fb = followed by. PXD = pinoxaden. MTZ = metribuzin. PDM = pendimethalin. PYR = pyroxasulfone. PXD-R = pinoxaden-resistance. BN = burning fb zero-tillage. RW = incorporation with rotavator. HS = happy seeder, i.e., zero-tillage with rice residue on soil surface. CT = baling fb conventional tillage. Cohort 1: before first irrigation; Cohort 2: between first and second irrigations; Cohort 3: after second irrigation.
#ParameterValue and UnitReferences
1Simulation replicates100
2Field size4047 m2
3Wheat sowing timeEarly: 25 October–7 November; Late: 8 November–5 December
4Initial seedbank densityBN or RW: 744; HS: 763; CT: 1042 seeds/m2Field experiment
5Old seeds annual mortality60% in rice; 70% in other crops[1]
6Fresh seeds viability90%[10]
7Fresh seeds predation risk70%[28,29]; expert judgement
8% Annual germination (RW)15% in wheat, 12% in sugarcane[30]
9% Seedling emergence in Cohorts 1, 2 and 3 (using RW as benchmark 100%) without variationBN: 5%, 5%, 2%; HS: early sowing 8%, 12%, 17%/late sowing 15%, 13%, 6%; RW: 45%, 40%, 15%; CT: 45%, 37%, 18%[1,10,31]; expert judgement
10% Seedling emergence in Cohorts 1, 2 and 3 with variationCT early sowing: 42–48%, 33–41%, 11–25% (adds up to 100%); HS late sowing: 14–15%, 12–14%, 5–7%Field experiment
11Reproductive systemDiploid, monoecious, assuming 95% self-pollinating[10]
12Seed production vs. cohortsCohort 1: 1750–2000; Cohort 2: 600–1200; Cohort 3: 100–300 seeds/plant[10,32]
13Seed return in sugarcane<1%[33]
14Initial proportion of PXD-R10−6 (sensitive field); 10−2 (resistant field)Assumption based on field observations
15Initial proportion of MTZ-R10−5Assumption
16Initial proportion of PDM-R10−12Assumption
17Initial proportion of PYR-R10−14Assumption
18Inheritance of PDM-R and PYR-R0.8Assumption
19Sigma of PDM-R and PYR-R phenotypes0.5Assumption
20Standard herbicide efficacy on sensitive biotypePXD or MTZ: 99%; PDM or PYR: 99.5%Field trials
21Range of herbicide efficacy on sensitive biotype95% (incl.)–100% (excl.)Assumption
22% Increased PXD efficacy by nozzles with HS late sowing: average (standard deviation) [minimum value, maximum value]Air induction: 32% (9%) [23%, 46%]; Field jet: 1% (20%) [−28%, 23%]; Flat fan: 0% (17%) [−28%, 15%]Field experiment
23Efficacy of weed seed harvest 1×CT: 15%; HS: 27%; RW: 25%Field experiment
Table 4. Simulation settings. Variability (var.) was implemented on weed emergence, herbicide efficacy and spray nozzles in HS (Table 3, parameters #10, #21 and #22). The default spray nozzle in all scenarios was flat fan (FF). Air induction (AI) and field jet (FJ) were also tested in S7 (var.). POST = post-emergence application. PRE = pre-emergence application. S3R and S9R represent PXD-resistant populations, and the rest represent PXD-sensitive populations, with initial PXD-R proportions of 10−2 and 10−6, respectively.
ScenarioCrop RotationWheat EstablishmentSowing TimeWheat Herbicide(s)Weed Seed Harvest
S1Rice-wheatBNEarlyPXD POSTNo
S2Rice-wheatRWEarlyPXD POSTNo
S3, S3RRice-wheatRWEarlyPXD + MTZ POSTNo
S4, S4 (var.)Rice-wheatCTEarlyPXD POSTNo
S5Rice-wheatCTEarlyPDM + PYR PRENo
S6Rice-wheatHSEarlyPXD POSTNo
S7, S7 FF (var.), S7 AI (var.), S7 FJ (var.)Rice-wheatHSLatePXD POSTNo
S8Rice-wheatHSLatePXD POST
S9, S9RRice-wheatHSEarlyPXD + MTZ POSTNo
S10Sugarcane-wheatRWEarlyPXD POSTNo
Publisher’s Note: MDPI stays neutral with regard to jurisdictional claims in published maps and institutional affiliations.

