Article

Rendering Multivariate Statistical Models for Genetic Diversity Assessment in A-Genome Diploid Wheat Population

by
Zareen Sarfraz
1,†,
Mohammad Maroof Shah
1,†,
Muhammad Sajid Iqbal
2,
Mian Faisal Nazir
2,
Ibrahim Al-Ashkar
3,
Muhammad Ishaq Asif Rehmani
4,*,
Muhammad Shahid Iqbal
2,*,
Najeeb Ullah
5 and
Ayman El Sabagh
6,*
1
Department of Biotechnology, COMSATS University Islamabad, Abbottabad Campus, Abbottabad 22060, Pakistan
2
Cotton Research Station, Ayub Agricultural Research Institute, Faisalabad 38850, Pakistan
3
Department of Plant Production, College of Food and Agriculture, King Saud University, Riyadh 11451, Saudi Arabia
4
Department of Agronomy, Ghazi University, Dera Ghazi Khan 32200, Pakistan
5
Queensland Alliance for Agriculture and Food Innovation|Centre for Plant Science, The University of Queensland Wilsonton Heights, Toowoomba, QLD 4350, Australia
6
Department of Agronomy, Kafrelsheikh University, Kafrelsheikh 3315, Egypt
*
Authors to whom correspondence should be addressed.
Both authors contributed equally.
Submission received: 25 September 2021 / Revised: 8 November 2021 / Accepted: 8 November 2021 / Published: 19 November 2021

Abstract

:
Diversifying available natural resources to cope with abrupt climatic changes and the necessity to equalize rising agricultural production with improved ability to endure environmental influence is the dire need of the day. Inherent allelic variability regarding significant economic traits featuring both enhanced productivity and environmental adaptability is one such prominent need. To address this requirement, a series of analyses were conducted in this study for exploring natural diploid wheat germplasm resources. The current study involved 98 Recombinant Inbred Lines (RILs) populations developed by crossing two diploid ‘A’ sub-genome wheat species, Triticum monococcum and Triticum boeoticum, enriched with valuable alleles controlling, in particular, biotic and abiotic stresses tolerance. Their 12 phenotypic traits were explored to reveal germplasm value. All traits exhibited vast diversity among parents and RILs via multivariate analysis. Most of the investigated traits depicted significant (p < 0.05) positive correlations enlightening spikelet per spike, total biomass, seed weight per spike, number of seeds per spike, plant height, and days to heading as considerably focused traits for improving hexaploid wheat. Principal component analysis (PCA) exhibited 61.513% of total variation with three PCs for 12 traits. Clustering of genotypes happened in three clades, and the two parents were separated into two extreme clusters, validating their enrichment of diversity. This study provided beneficial aspects of parental resources rich in diverse alleles. They can be efficiently exploited in wheat improvement programs focusing on introgression breeding and the recovery of eroded genetic factors in currently available commercial wheat cultivars to sustain calamities of environmental fluctuations.

1. Introduction

In this era of highly advanced technology, modern agricultural practices, mechanization policies as well as urbanization, all are challenging the biodiversity on this planet. Above all is the unwanted human action towards diminishing the global ecosystem [1]. The significant approach considered is the exploration of available resources to attain sustenance in food production via conservation of agriculture system. Unfortunately, an inadequate amount of efforts are conducted to conserve and enhance biodiversity of major food crops. A series of research results during the recent two decades, reviewed in this regard, exhibited an enormous amount of erosion in biodiversity residing in functional ecosystems [2]. Many significant research results in the previous scientific era reflected the diversification existence in plant communities that can endure and recuperate from abiotic and biotic stresses [3,4,5,6,7]. The prominent factors involved in the loss of biodiversity are habitat demolition and overexploitation, invasion of alien species, climate variation, extinction cascades, among others [1,8,9,10].
At the global level, wheat (Triticum aestivum) holds a backbone in feeding a significant proportion of world’s population. It delivers 20% of total proteins and diet calories of human nutrition [11,12]. The cytogenetics studies of T. aestivum revealed it as a hexaploid species harboring three sets of essential genomes: A, B, and D sub-genomes (each sub-genome encloses seven chromosomes, constituting n = 21). The chromosomes from three sub-genomes are organized in a homoeologous pairing pattern [13,14]. It is recognized in several previous studies that three notable diploid ‘A’ sub-genome ancestral species, i.e., Triticum monococcum (AmAm), Triticum boeoticum (AbAb), and Triticum urartu (AuAu) exist, with anchorage of several desirable genetic factors and with homology to the hexaploid ‘A’ sub-genome [15,16,17,18,19]. Hence, an event of desirable alleles transfer can efficiently occur from wild ‘A’ sub-genome chromosomes to the cultivated homolog without any linkage drag, as direct hybridization can be easily made between them [15]. Singh et al. developed a Recombinant Inbred Lines (RIL) population with hybridization between T. monococcum (acc. pau14087) and T. boeoticum (acc. pau5088) [20], and established a linkage map to identify variable alleles controlling economic traits.
Due to the utilization of cultivated einkorn for its beneficial genomic attributes in wheat, breeding is a significant need of the current time. It is mainly restricted due to the mutual incompatibility of diploid and hexaploid wheat and the formation of their sterile F1 hybrids [21,22,23,24,25]. The alternate approach that may be adopted for pyramiding beneficial genes is crossing diploid ancestors of bread wheat. Then, the generated amphiploids could subsequently be crossed with cultivated hexaploid bread wheat [26]. However, modern-day wheat varieties lack genetic diversity, compared to wild relatives or landraces, which are rich in variability and harbor potential alleles [27]. Hence, dissection of diploid or tetraploid landraces genetic factors underlying yield-related and agronomic traits can prove beneficial in wheat improvement programs [28,29].
The available hexaploid wheat germplasm is characterized by less genetic diversity, and lacks valuable alleles against biotic and abiotic stresses of the surrounding environment [30]. The prerequisite to broaden its genetic base includes exploratory studies on the genetic divergence of its genetic stock [31]. Thus, for this purpose, diploid species enriched with extraordinary elite alleles for economic traits, as well as against both biotic and abiotic stresses [32], were utilized in the experimental study. The acquaintance of knowledge about sufficient variability in the available germplasm resources, especially regarding yield component attributes, is the foremost step before initiating programs related to crop improvement [33,34]. It enables the plant breeder to correctly choose the best/appropriate parents to develop diverse populations by considering the morphological attributes as main criteria [35,36,37]. It would pave the way to generate superior parental genotypes to develop the best hybrid combinations. To ease the selection of desirable wheat genotypes, the wheat breeder must have information regarding the nature and extent of relationships among yield-related components [38]. Some powerful methods and strategies to analyze the degree of functional genetic divergence in the available germplasm include multivariate analysis [39,40,41]. Various statistical techniques, including correlation analysis, PCA, regression, cluster, and factor analyses, are at hand to the model yield of crops by accessing yield and its component features [42,43].
In the above perspective, the current study was undertaken (i) to determine the nature and extent of the relationship among studied attributes of experimental genotypes; and (ii) to evaluate the existence of diversity between the two parents investigated. The data were subjected to PCA and cluster analysis to exploit the diversity available in parental lines and RILs. The information generated in this study would be helpful to improve significant economic traits of bread wheat.

2. Materials and Methods

2.1. Plant Material and Experimental Design

The current study involved plant materials consisting of 100 accessions of diploid wheat (2n = 2x = 14), including 2 parents, namely T. monococcum and T. boeoticum, and their 98 Recombinant Inbred Lines (RILs) at F7:8 generations. The experiment was executed during winter 2011–2012 in the research area of the Department of Biotechnology, COMSATS University Islamabad, Abbottabad Campus, Pakistan. The experiment was conducted using a triplicated randomized complete block design (RCBD). Land preparations related practices were carried out under standard protocols and recommendations by following local extension department recommendations for the crop with East-West ridges, keeping in view the symmetry of plot and to acquire planting space, 30 cm p × p distance was maintained. Sowing was accomplished during the first week of October, following a dibbling method with 3–4 seeds per dibble. Space planting has been carried out to avoid issues in data collection and any bias due to plant interactions. After germination, thinning was carried out to maintain a single seedling in each dibble. Standard cultural, agronomic, and plant protection practices were carried out throughout the season following local recommendations for fertilizer application including nitrogen (N) 80 kg ha−1, phosphorus (P2O5) 50 kg ha−1, and potash (K2O) 60 kg ha−1, for wheat crops in the area for optimum crop growth and development.

2.2. Data Collection

The data of twelve phenotypic attributes including plant height (PH), days to heading (DH), flag leaf length (FLL), flag leaf diameter (FLD), peduncle length (PdL), number of tillers (Till), spike length (SpL), number of spikelets per spike (SpS), total biomass (TBM), Seed weight per spike (SWsp), number of seeds per spike (NSS), and grain yield (GY) were collected. The traits were measured according to the recommendations available at list of descriptors of wheat [44]. The data of these traits were recorded from 10 guarded plants which were randomly selected. Each of these selected plants had been harvested, threshed, and processed individually to obtain the grain yield (GY) for each plant in grams (gm).

2.3. Statistical Analysis

The recorded data against various morphological characters were subjected to a combined analysis of variance using standard least-square fit [45]. The multivariate analyses were performed including basic statistics, correlation analysis, principal component analysis (PCA), and cluster analysis, categorizing genotypes into corresponding groups. All the analyses were carried out using statistical software package SAS-JMP Pro 15 (SAS Institute Inc., Cary, NC, USA, 1989–2019).

3. Results

The higher genetic variability of traits among experimental genotypes is most desirable for the success of enhancement-based breeding programs. The summary statistics of studied characteristics are demonstrated in Table 1. There existed a vast diversity among the experimental genotypes regarding traits in question. DH revealed a maximum value of 161 and a minimum of 108, with a mean of 128.4, followed by PH showing a maximum of 158.2 and a minimum of 88.9, with an 118.0 mean value, while the least values were depicted by FLD with a maximum of 0.97 and minimum of 0.45, and a mean of 0.67; followed by SWsp with a maximum of 4.63 and minimum of 0.60, and a mean of 2.46 (Table 1). The maximum standard deviation was observed for TBM with 19.14, and the minimum found for FLD was 0.11. These results revealed a wide range of variability in the recombinant wheat genotypes, which acted as a base for performing further analyses.
A summary of effects and effect tests concluded in the form of ANOVA revealed significant values, as depicted by F-ratios coupled with Log worth, regarding variation in all the studied traits of experimental genotypes, and no differences among replications. The details are given in Table 2. These variations in genotypes regarding studied traits and non-significant replications were further validated by standard least-square fit-based surface profilers in Figure 1. These plots are depicting the existence of variation among genotypes regarding studied traits rather than in replications. This uniformity in replications supported the suitability of the experimental design used.

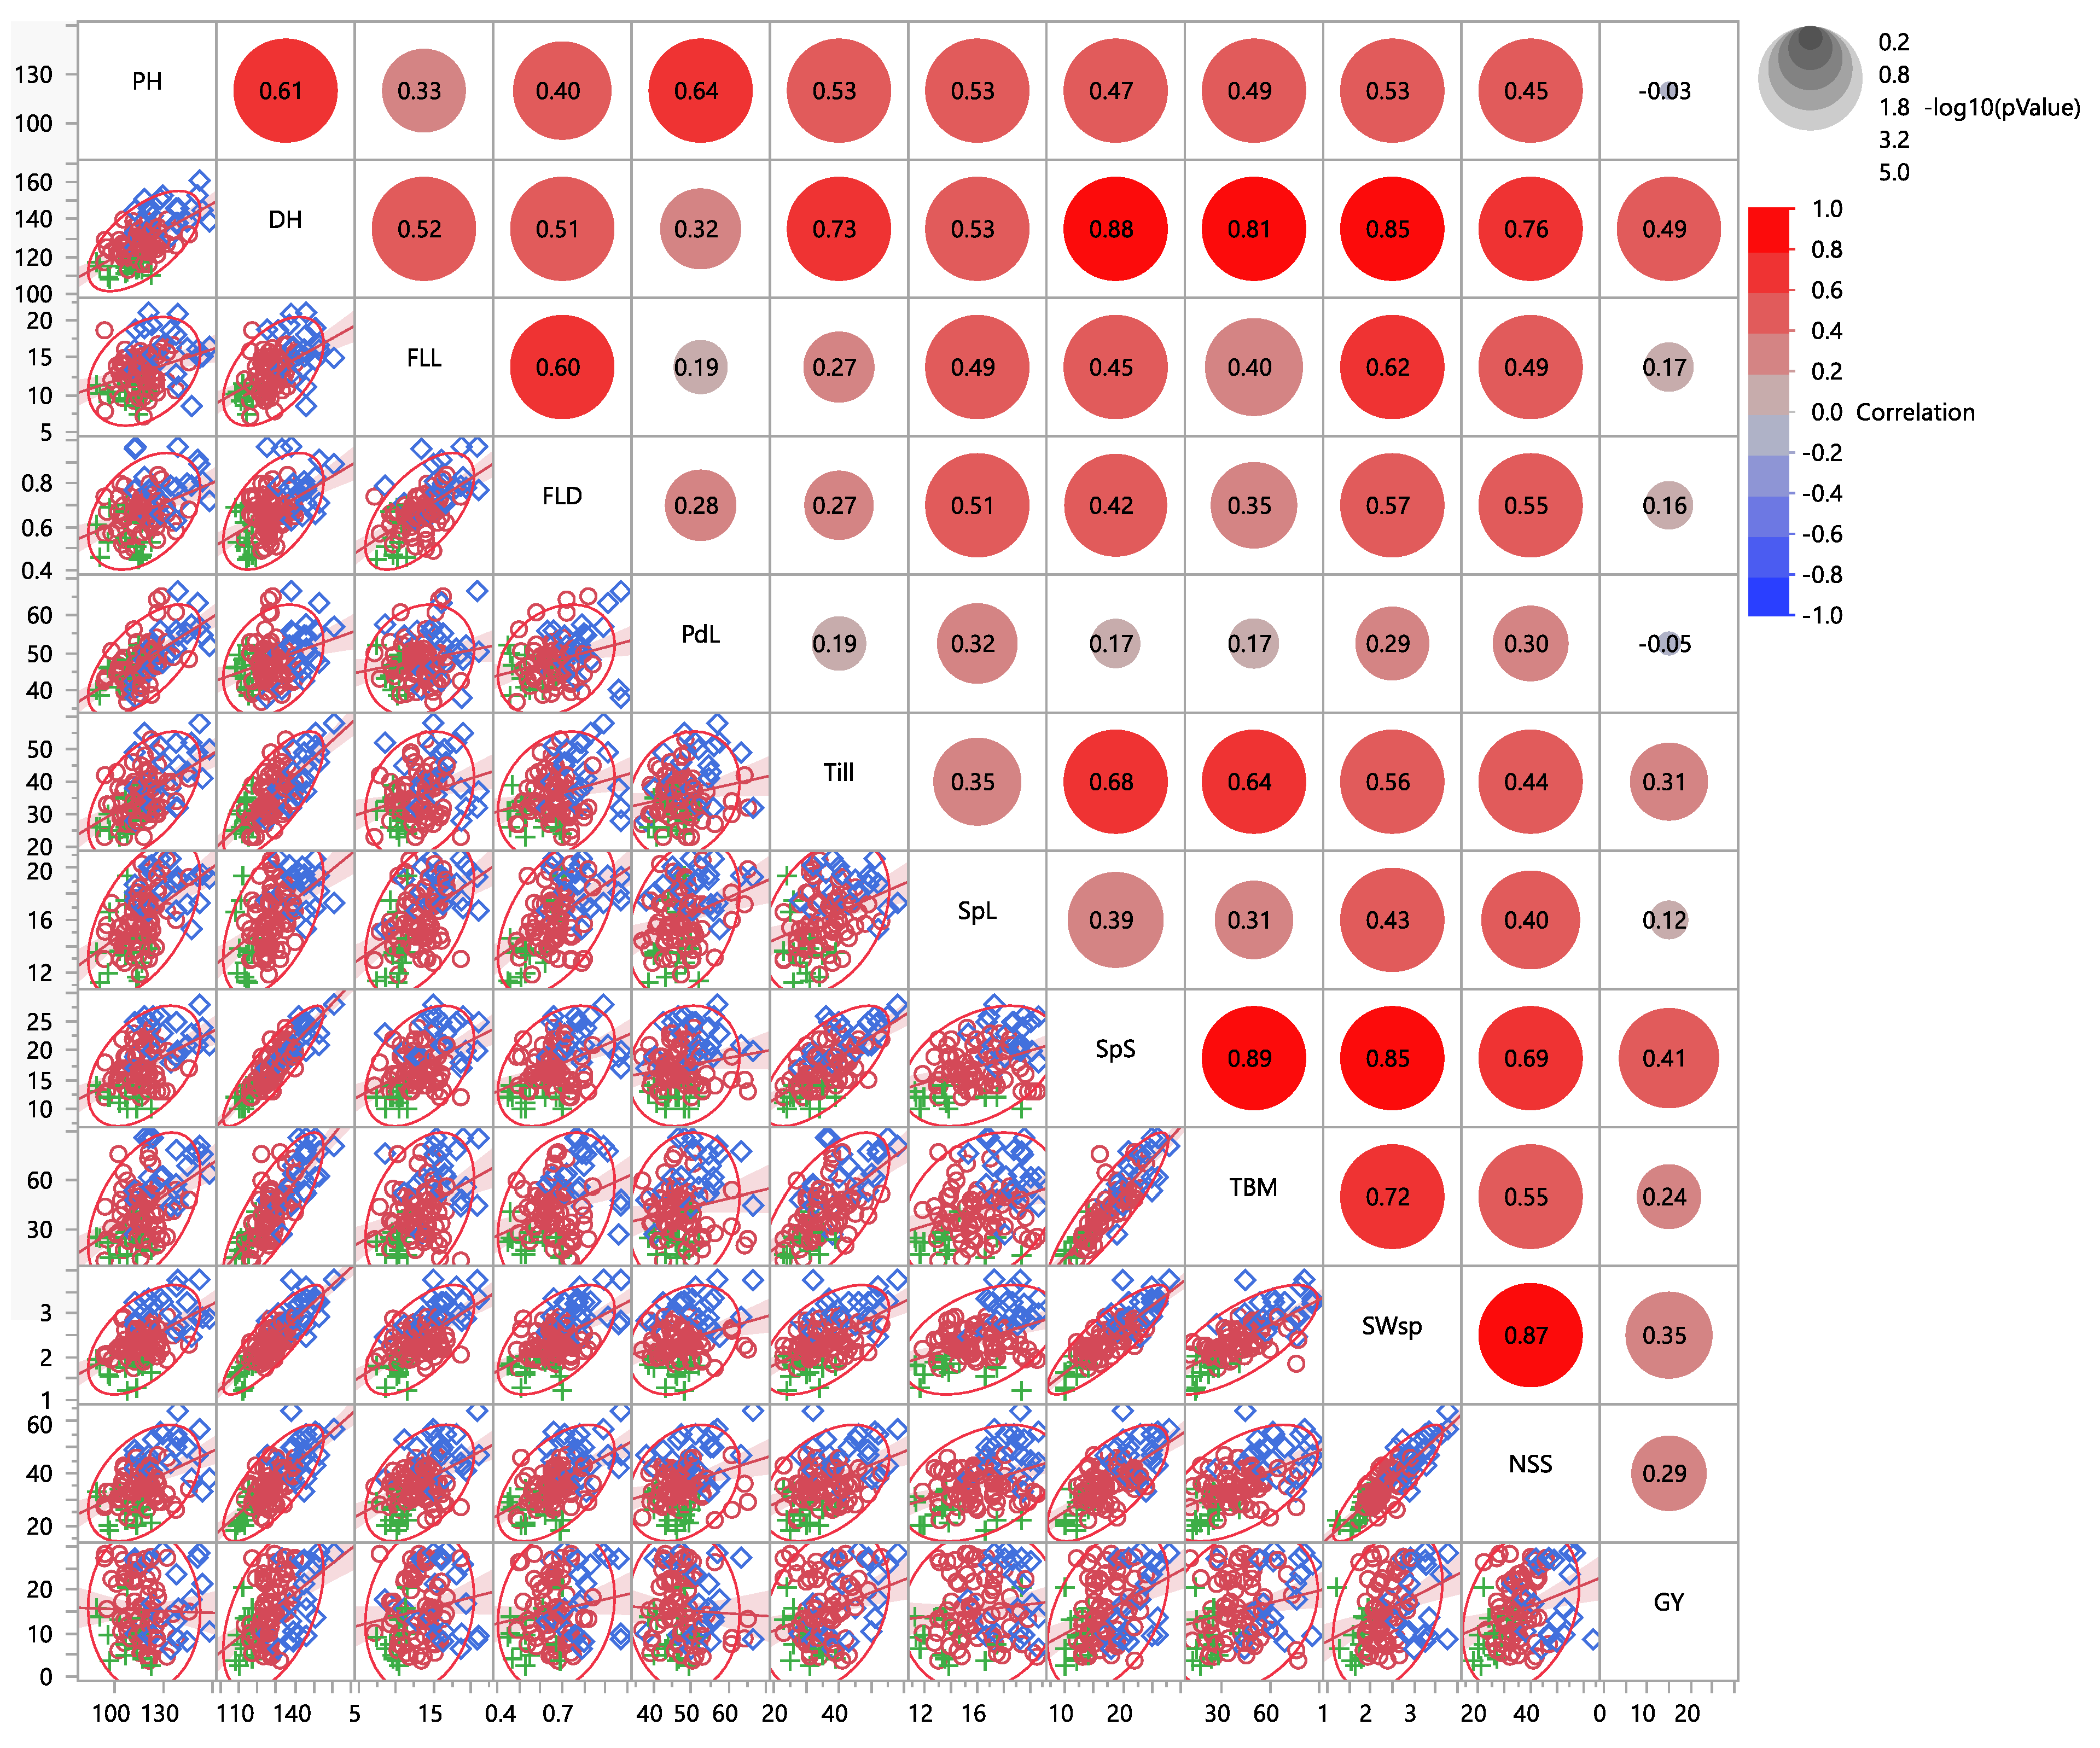
3.1. Pearson Correlation Coefficients

In Figure 2, the scatterplot matrix is presented to exhibit correlation among phenotypic traits and density distribution of RILs data. In the upper triangle matrix, correlation among all the attributes in question is displayed in circles with the gradient in size to show the correlation between that particular pair of traits. Almost all of the features under study revealed highly significant (p < 0.05) positive correlation among themselves, except non-significant negative correlations of PH with GY (−0.03) and PdL with GY (−0.05). SpS displayed maximum and highly positive correlation with TBM (0.89), followed by DH (0.88), and SWsp with NSS (0.87) (Figure 2, Table S1). The lower triangle matrix represents the density distribution plots against pairwise dependencies of investigated phenotype traits with ellipses and a central regression line. The narrower ellipse with more distribution on the mainline is more correlated with that particular pair of attributes. A round ellipse with no diagonally oriented distribution demonstrates less or no correlation. Our data showed three colors in density distribution plots in every cell, revealing three types of segregates in the whole RILs population.

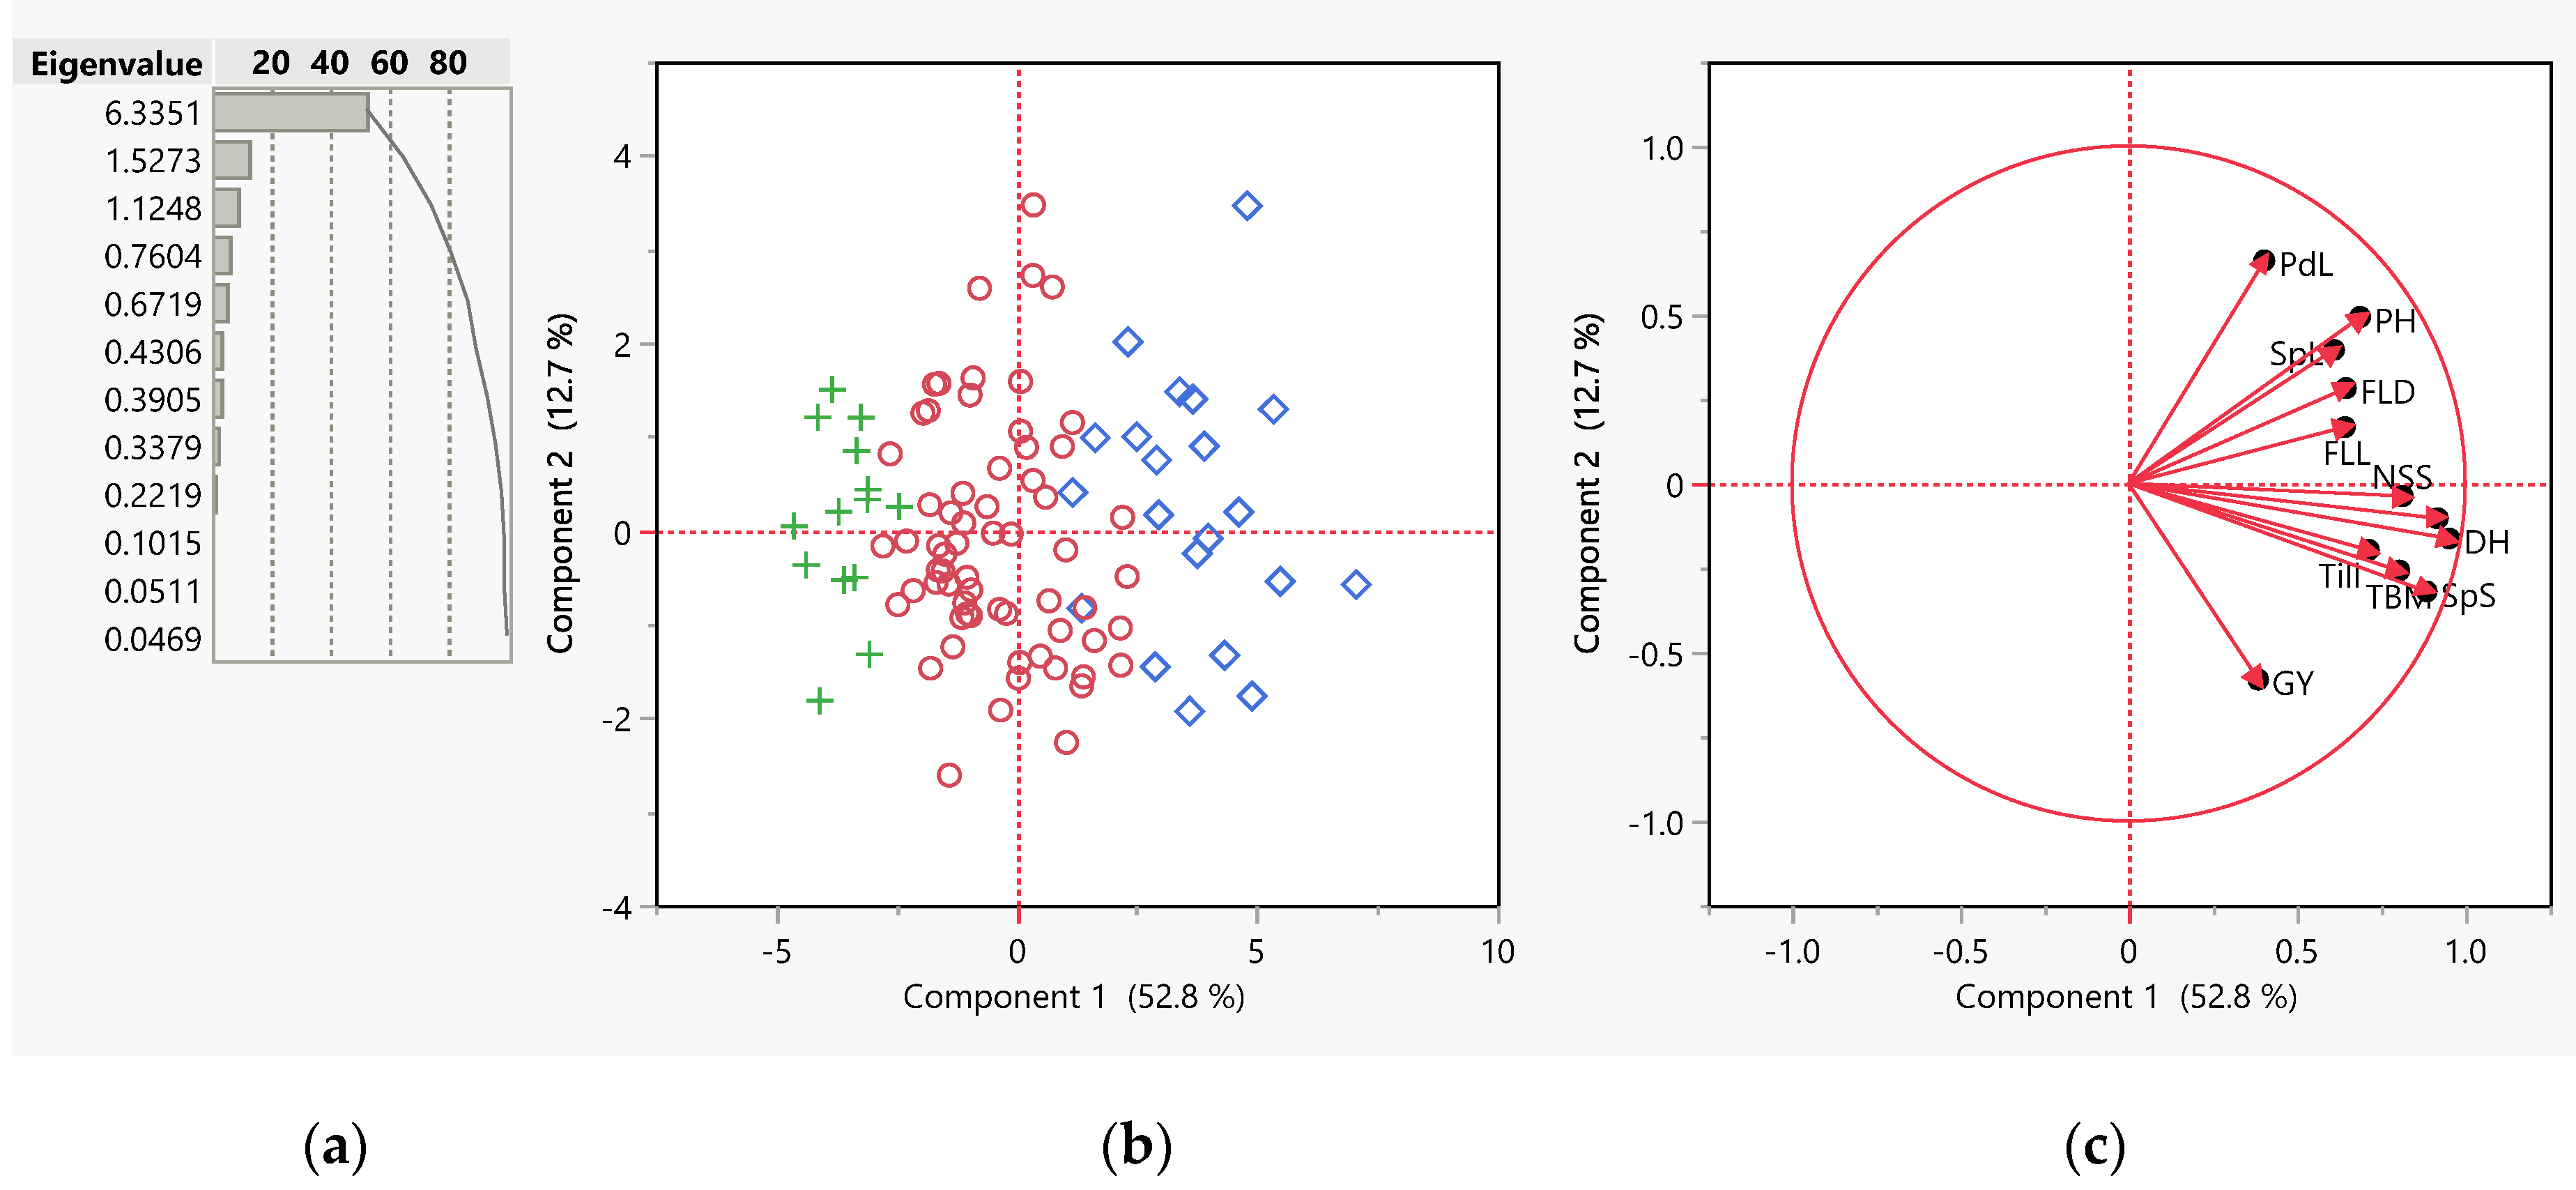
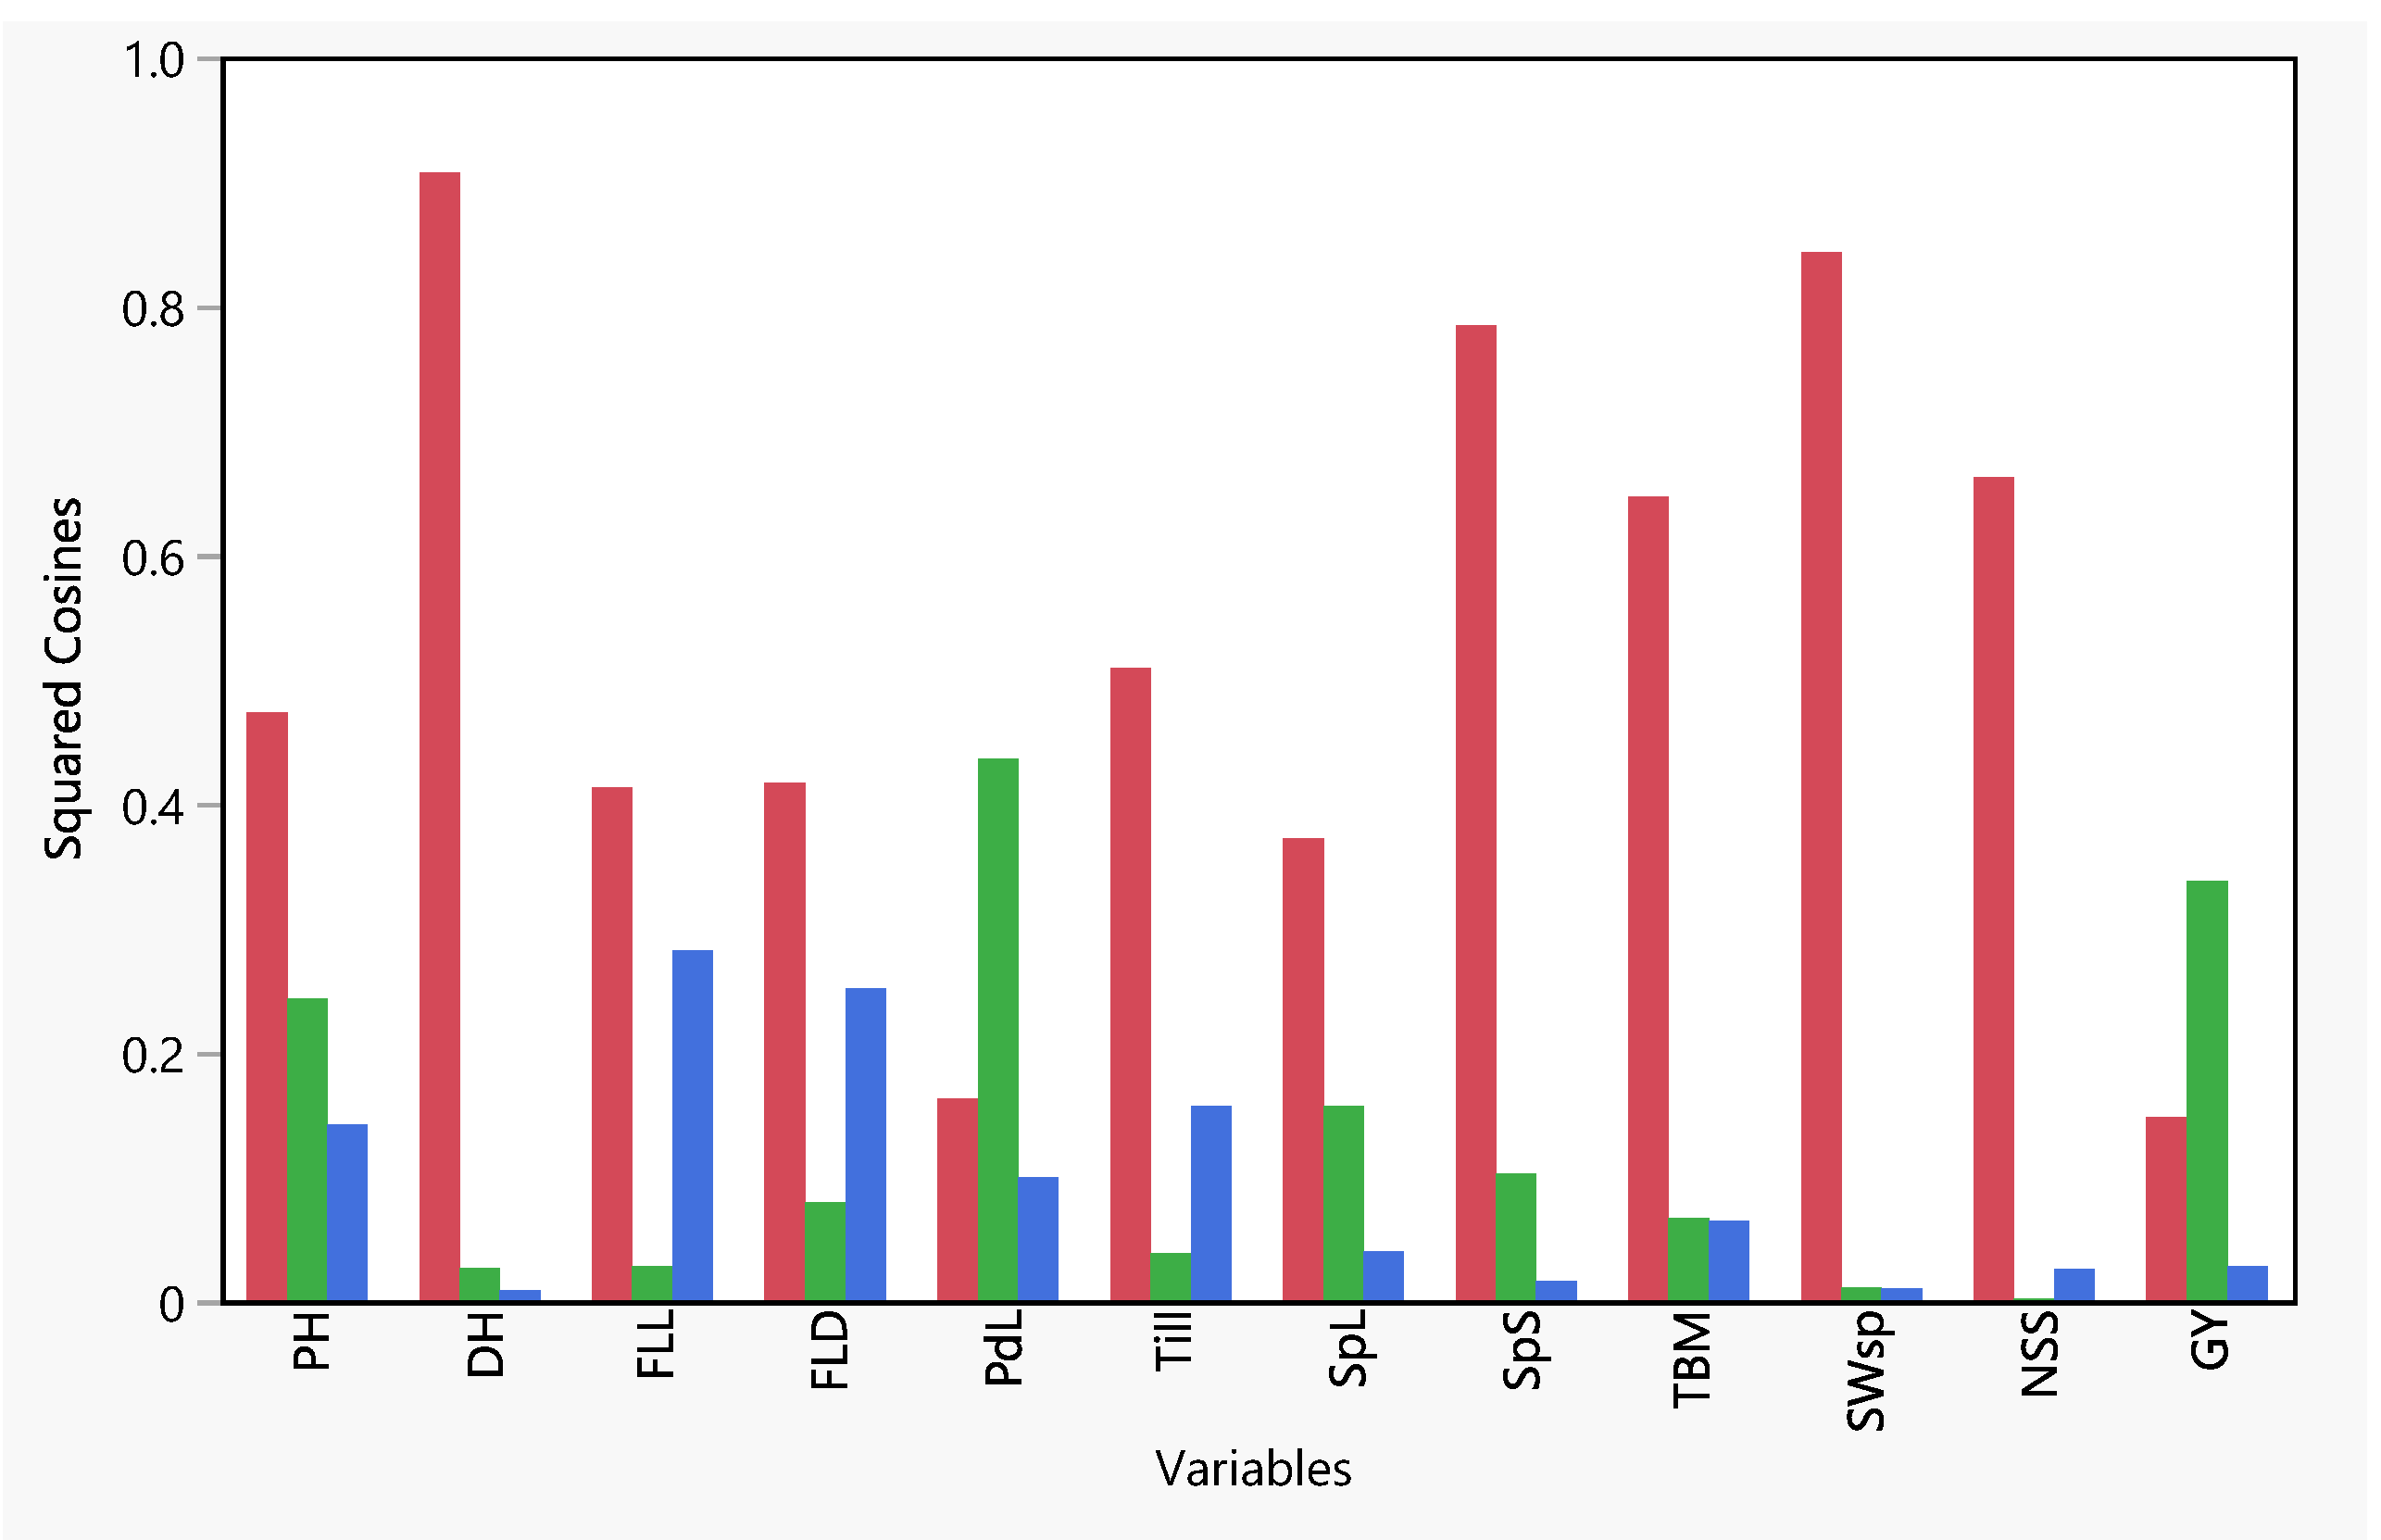
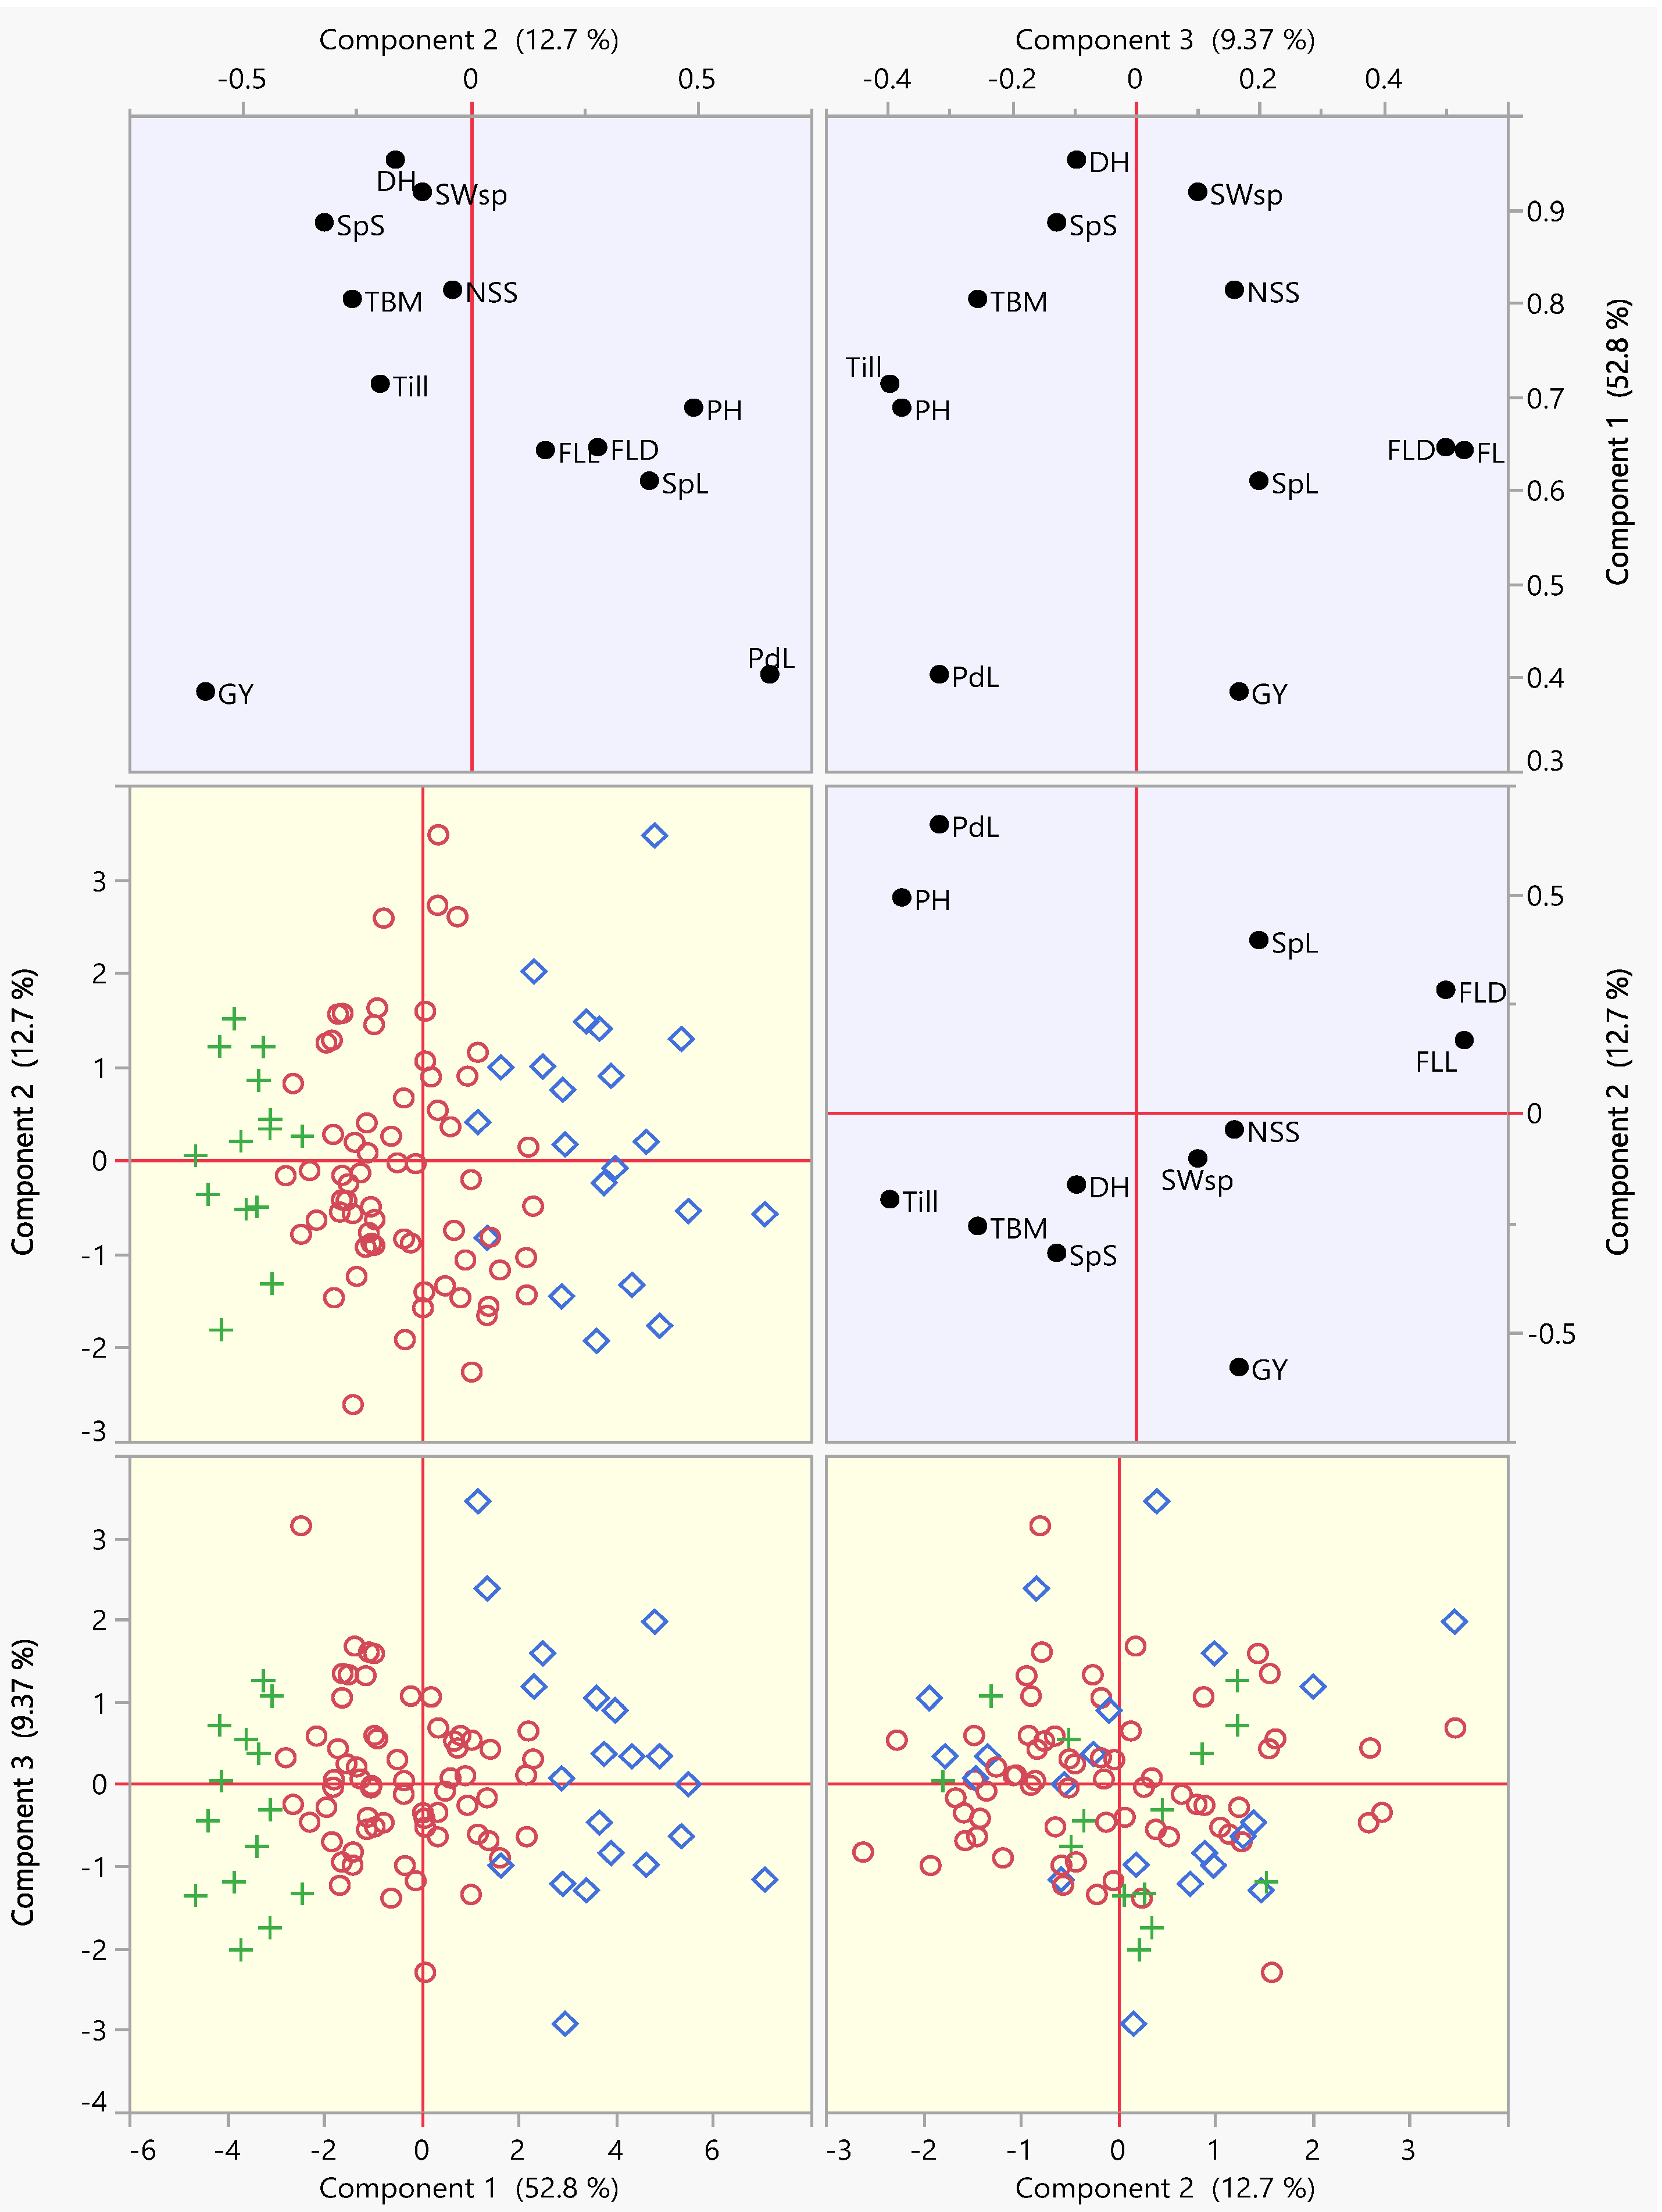
3.2. Principal Component Analysis (PCA)

The yield principal component analysis (PCA) conducted via multivariate approach mainly focuses on dimension reduction across dependent and independent attributes contributing to the dataset. Based on correlation existing across 12 studied traits, PCA was carried out. A total of 12 PCs were extracted from data of 12 traits through this analysis, but three were observed with above 1 Eigenvalues (Table S2). Furthermore, Scree plot demonstrated that the first three PCs with above 1 Eigenvalues sufficiently covered 74.894% of the total variation out of these three PCs (Table S2). The summary plots of variables under study with magnitudes of variation contributed are presented in Figure 3. The Eigenvalue pareto plot manifested percentages of variation contributed by each PC (Figure 3a). All of the genotypes were distributed in three distinct groups in the score plot between PC1 and PC2 (Figure 3b). The loading plot between PC1 and PC2 significantly demonstrated that the variables are positively and highly correlated. The length of originating vectors is depicting the amount of correlation between variables and. DH and SWsp are significantly correlated with each other, lying in the direction of PC1 with the highest contribution. Similarly, FLL and FLD are highly correlated, and contribute minor variation projected between PC1 and PC2 (Figure 3c).
As per the results of PCA, 74.894% of the total variance was covered by the first three PCs. It is further elaborated by a factors map of squared coordinates/cosines. The long bars in the chart for a particular variable are a higher contribution of squared cosine against it. All the yield contributing traits covered PC1 with maximum contribution, except for two traits: PdL and GY. However, PdL and GY achieved maximum values in PC2 (Figure 4). Further distribution-related details of traits in the first three PCs were presented in Figure 5. Loading plots showed that DH, SWSp, SpS, and TBM lay close to each other in PC1 and PC2, depicting their correlation among themselves. In the loading plot of PC1 and PC3, FLL and FLD were lying closely with maximum contribution (Figure 5). The PC analysis revealed considerable variability regarding investigated traits in the wheat genotypes of the RILs population. Additionally, the biplots of genotypes distribution exhibited variability among 100 wheat genotypes of parents and the RILs population. The distribution biplots gave the detailed classification image by dividing the genotypes into three distinct colored clusters regarding studied phenotype traits. However, genotypes that lied close to each other may be more alike (Figure 5).

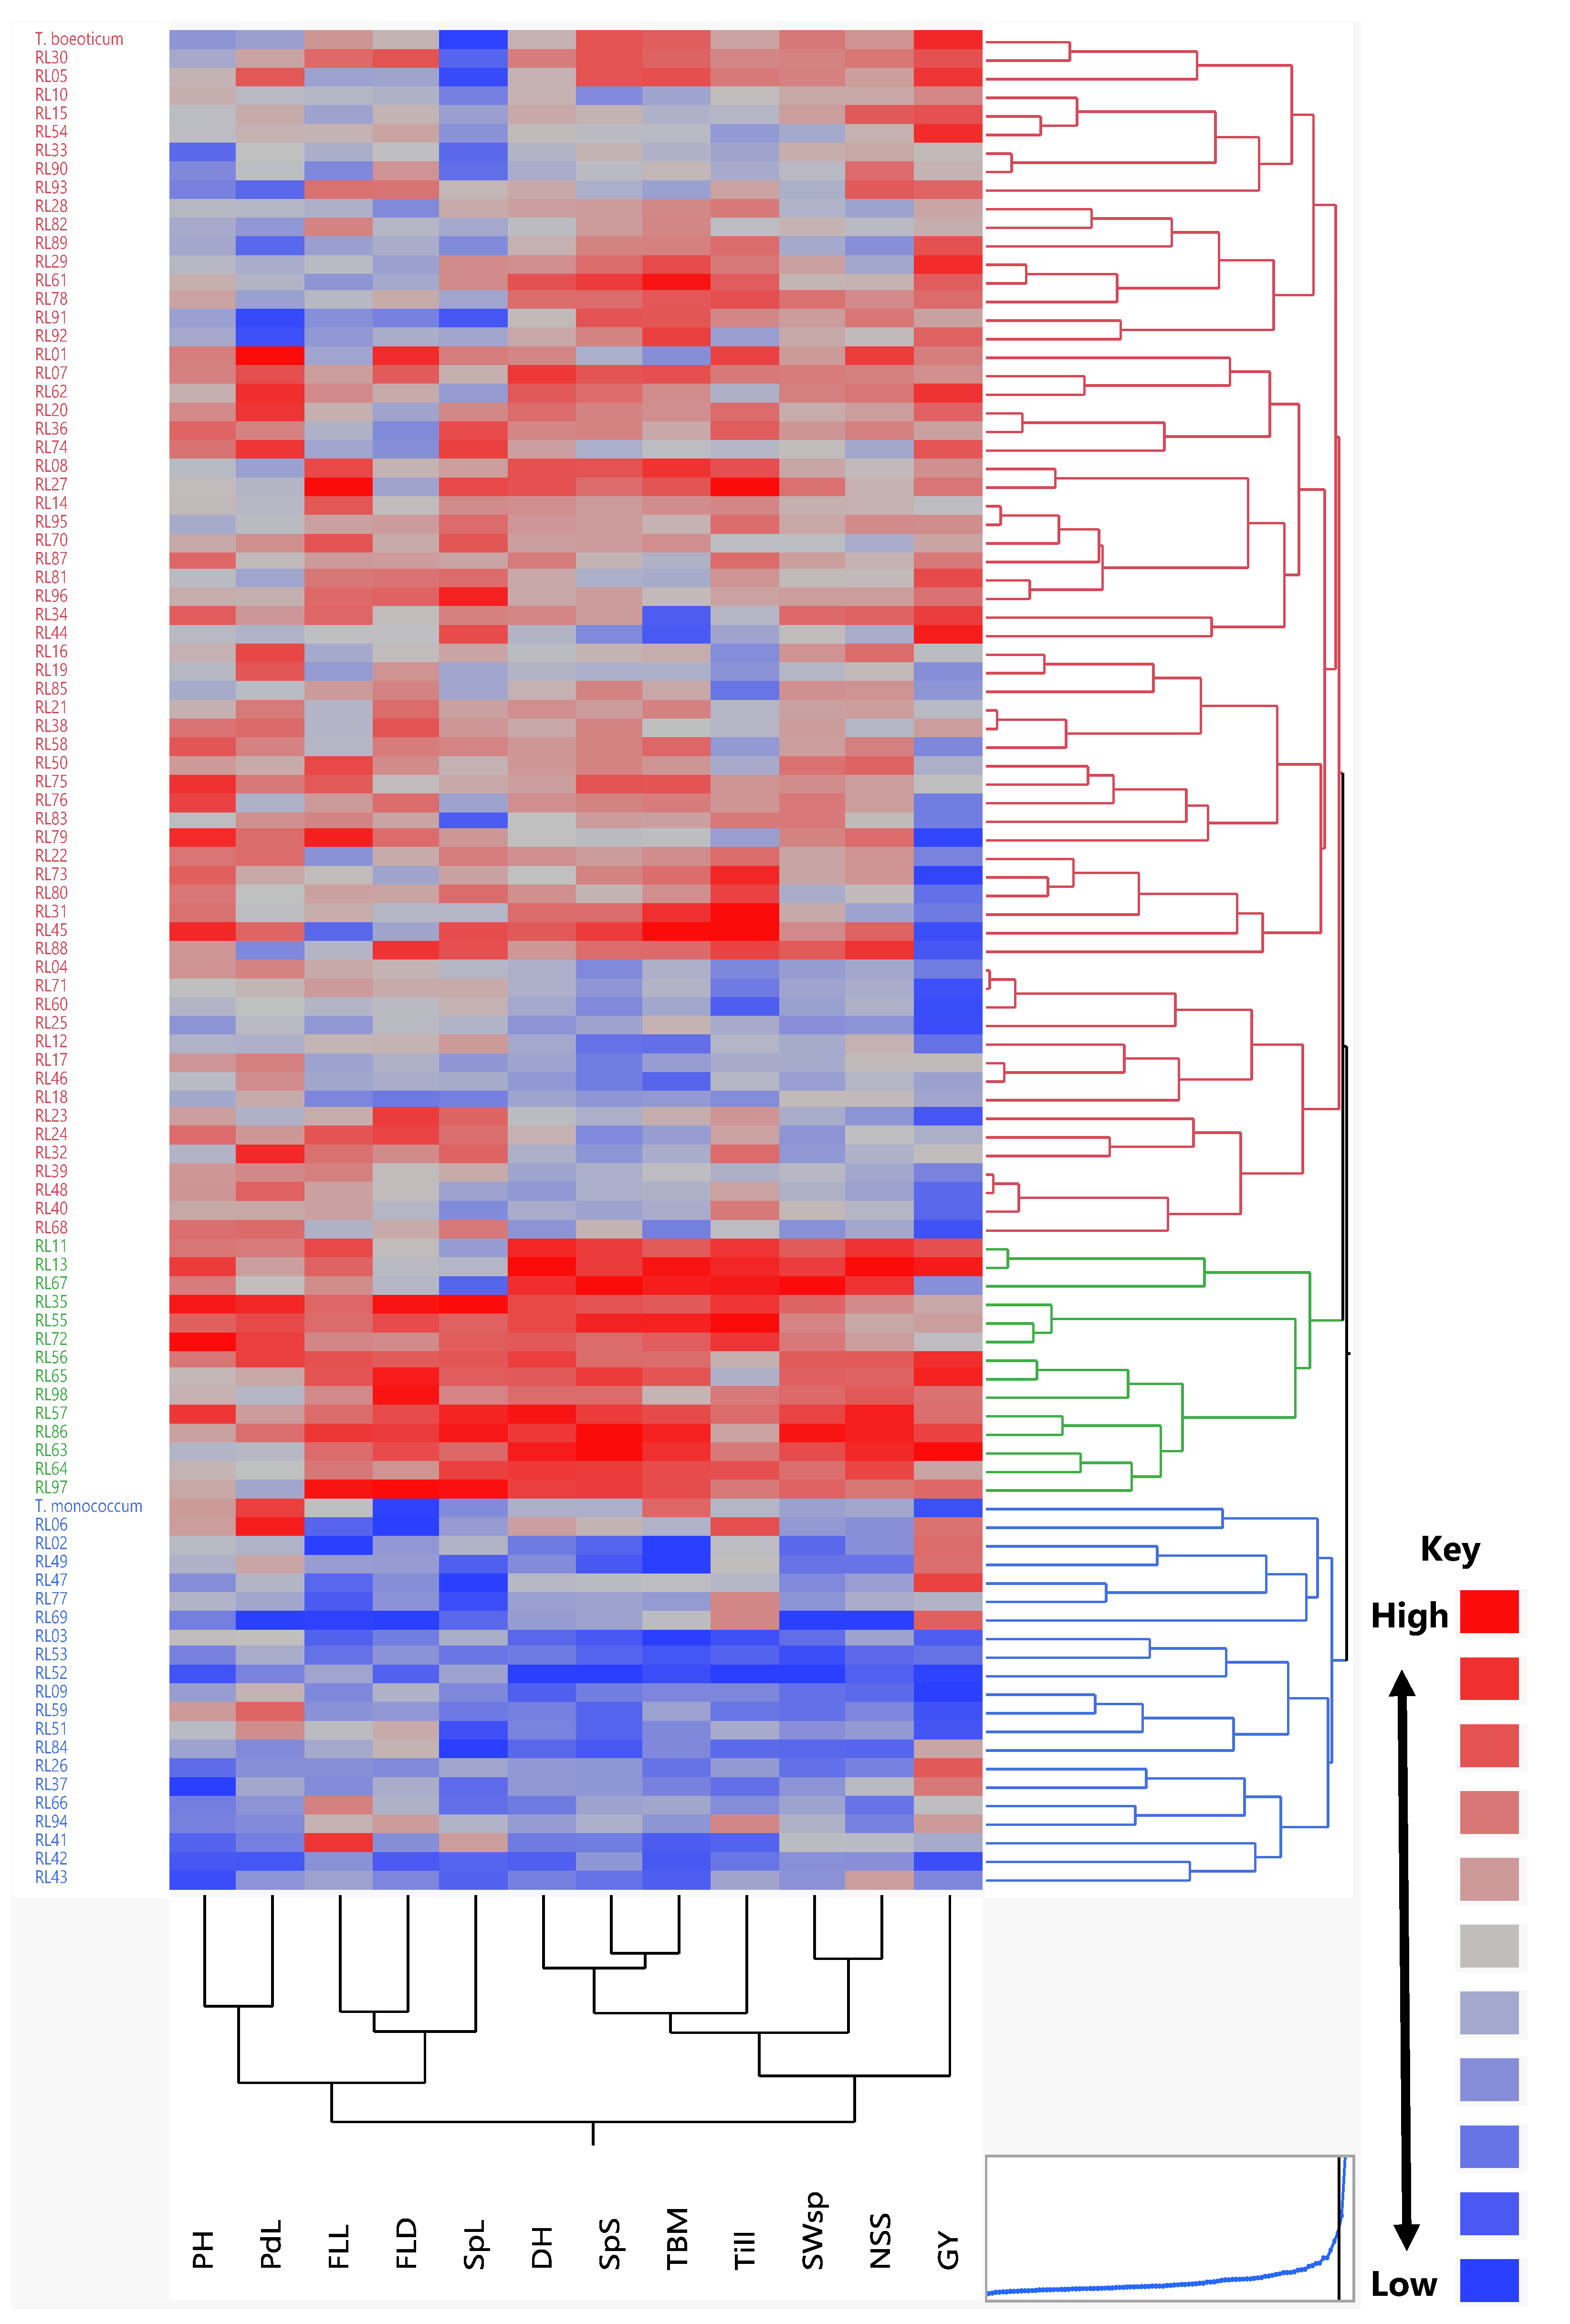
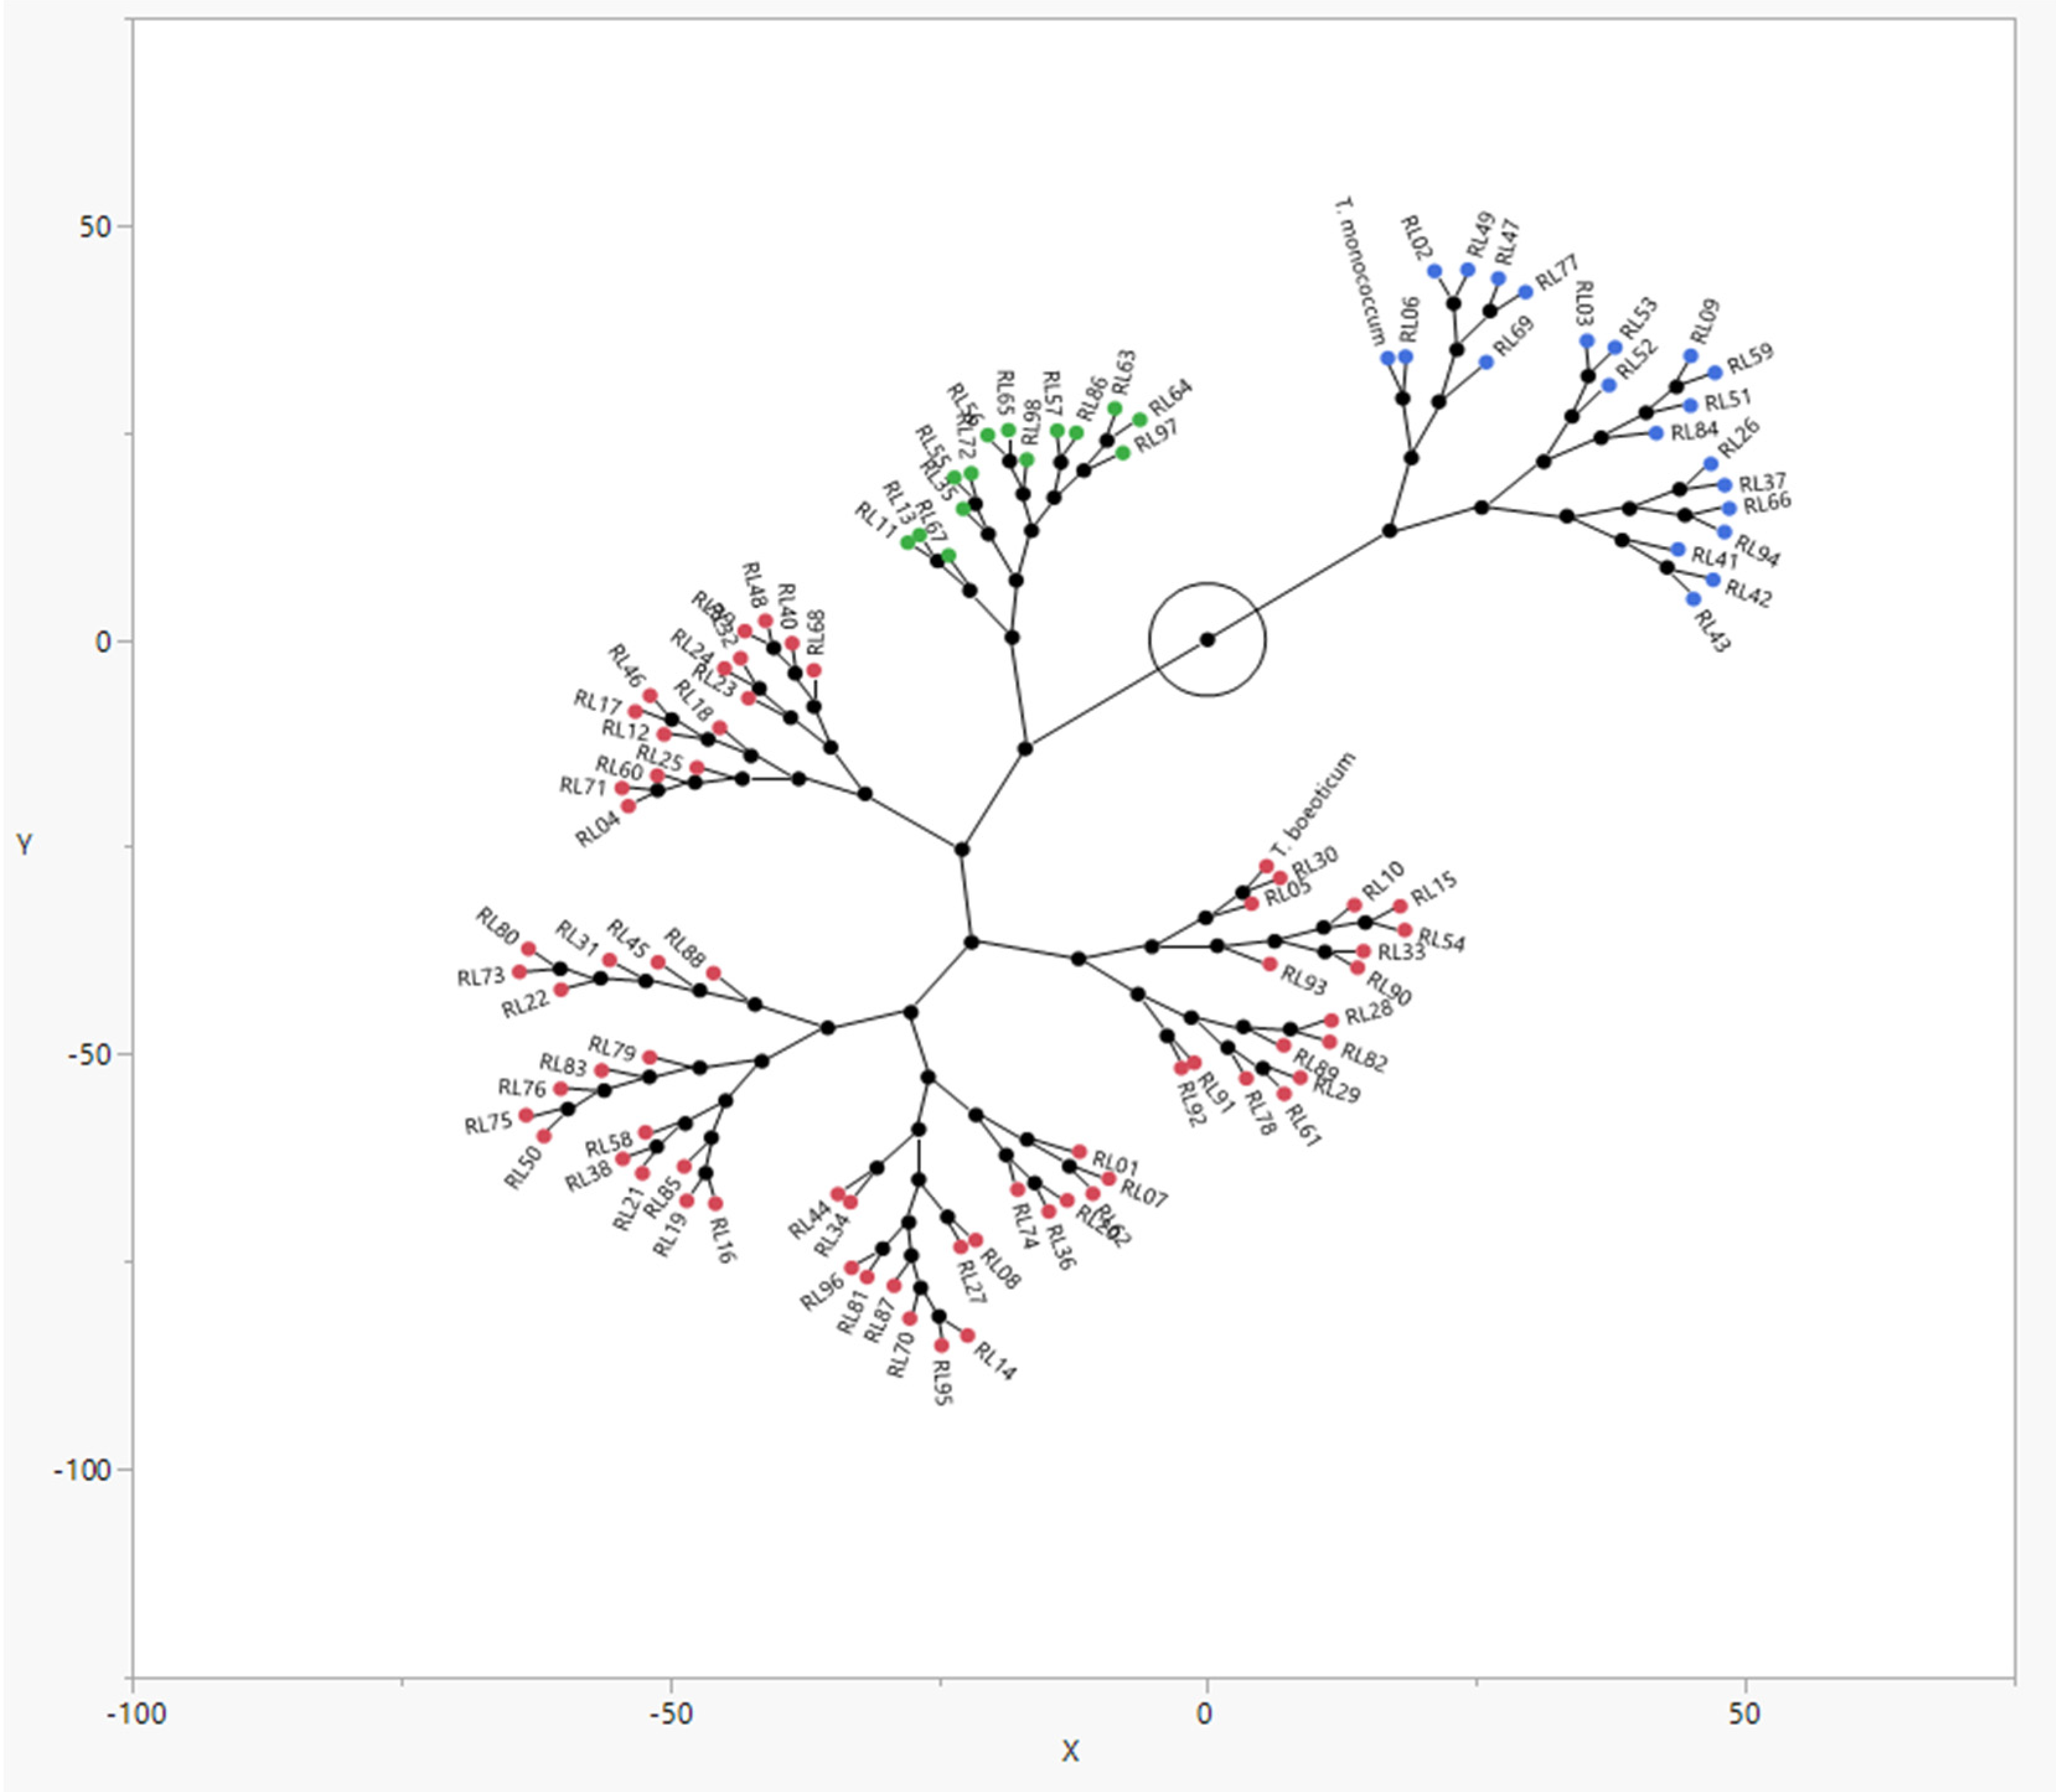
3.3. Cluster Analysis

The degree of similarity or dissimilarity residing among the parental genotypes and RILs was estimated via hierarchical clustering. These clustering methods are widely adopted and implemented due to their simplistic nature. A cluster tree or hierarchy was generated by utilizing the morphological data of genotypes through the agglomerative approach, based on the ‘bottom-up’ norm. This approach takes every observation as a separate cluster at the initial level. The observations are paired up successively, moving towards the next level, producing a hierarchy until forming a final single cluster. Here, we operated the squared Euclidean distance method to calculate the distances between every pair of genotypes. The genotypes were then clustered together via Ward’s method to generate a dendrogram. The two-way clustering approach was executed via the AHC method, which gave a two-way cluster diagram and constellation plots (Figure 6).
The dendrogram depicted that all of the experimental genotypes were separated into three clades. At the first node, the genotypes were divided into two clades, and then at the second node again, two clades were separated. Finally, three clades were generated with clades I and II at the first node. Clade I comprised 65 genotypes including a parent T. boeoticum and 64 RILs, and Clade II enclosed 14 RILs. The second node gave Clade III having a parent T. monococcum and 20 RILs, comprising 21 genotypes in total (Figure 6). Furthermore, to visualize the clade relationships among the experimental genotypes, we constructed the constellation plot of the dendrogram. The constellation plot is advantageous due to the spread of the clades. The plot arranged all of the experimental genotypes as endpoints, and each cluster joined as a new point, with lines drawn to connect the closest genotypes on a 2D plane. The multivariate analysis of variance enabled us to determine the number of optimal clusters (Figure 7).

4. Discussion

Alien species are more often considered an asset for increasing genetic diversity in crop plants [46,47]. In wheat, the wild and domesticated diploid ‘A’ genome species were found to have more variety of genes controlling best agronomic traits variations, and numerous biotic and abiotic stress resistance [48,49,50,51]. The T. monococcum (2n = 2x = 14, AmAm) einkorn wheat is the earliest cultivated wheat around 10,000 years ago [15,52]. The T. boeoticum (2n = 2x = 14) is a wild form of T. monococcum ssp. monococcum. Both T. monococcum and T. boeoticum have compatibility due to less differentiation in their genomes [53] and form their hybrids.
In this study, we evaluated 98 RILs and two parents regarding their 12 yield-related attributes. Observed significant variations in the studied 12 yield traits of recombinant genotypes are confirmed by values of means, range, and standard deviation. The higher variability attributes, DH and PH, varied greatly among genotypes, and lower values of variation exhibited by FLD and SWsp with the most miniature range are congruent with earlier reports [54,55,56,57]. Such a trend of high range and mean values in PH is typical in wheat landraces [58]. It enables the plant to support kernel development with higher stem reserves mobilization [59]. Furthermore, significant differences for DH, GY, and PH were previously reported [38,58,59]. Such a variability trend is essential for any breeding program aiming at germplasm improvement regarding resistance and tolerance to various biotic, abiotic stresses, quality, and yield improvement [60,61].
The correlation coefficient analysis exhibited several significant correlations among studied traits. PH showed a significant positive correlation with NSS, previously discovered in a study on wheat genotypes evaluation [62]. Till also showed a significant positive correlation with TBM and SpS, as reported earlier [63,64]. Significant positive correlation of SpL, SpS, and NSS were earlier observed in studies on diploid wheat T. urartu [65]. A strong positive phenotypic correlation has been found between SWsp and NSS, which was formerly discovered too [66]. In this study, FLL and FLD traits were observed in strong positive correlation with yield traits such as SpL, SWsp, NSS, and TBM, as reported earlier in a study on RILs population and wheat genotypes [29,67,68,69,70,71]. DH was observed in significant positive correlation with GY like earlier findings [64,72].
Both HCA and PCA are usual unsupervised multivariate methods. The clustering or display analysis of species enables us to explore their absence or closeness in the dataset and check for outliers without utilizing any information of class membership in calculations [73]. PCA, the term belonging to the factor analysis group, exhibits the degree of residing variation among the species by providing a qualitative image of data [74]. The visual display in 2D or 3D projections of species data is constructed utilizing axes as factors. One most widely used criterion for determining the number of PCs is based on the Kaiser rule [75], in which Eigenvalues greater than 1 are considered for finding powerful PCs. In this study, three principal component axes (PCAs) were retained as significant, with Eigenvalues more than 1 out of 12 PCs. As the first PC should cover most of the explained variance [76], our data revealed 52.8% of variance covered by PC1. The correlation between PCs and variables is connected with the concentrated quantity of data-related variation [76]. The maximum contributing factors to the total variation in PC1 among parents and RILs include ten traits: TBM, SWsp, NSS [77,78,79,80], DH [79], PH [79], SpS [78], SpL [78,81], FLD, Till, and FLL [77]. The traits of GY [82] and PdL were observed to be the main contributor to variation in PC2. The main focus of breeders in most of the crop improvement programs remained on yield, which could prove deceitful while selecting desirable genotypes. Hence, the yield contributing traits should be emphasized for improvement and selection of genotypes, and this study also revealed the yield contributing traits as main variation contributors.
Diploid wheat, renowned for harboring valuable genetic factors underlying resistance against stresses (biotic and abiotic), includes three notable species, namely T. monococcum, T. boeoticum, and T. urartu [83]. Our HCA clustering revealed three distinct groups of experimental genotypes comprising RILs of two diploid wheat species, T. monococcum, and T. boeoticum. Both the diploid parental species obtained a place in separate, distinct clades, with each cluster having one species. Their dissimilarity at the subspecies level, although having close relatedness, is already confirmed in the previous study based on clustering via principal coordinate analysis (PCoA) and AFLP fingerprinting [84]. This study claimed the two parents as a trustworthy resource of diversity, with T. boeoticum being significantly diverse. Such findings were presented formerly in a study on different landraces of T. boeoticum collected from various origins. Those genotypes were divided into three clusters, based on AFLP markers and PCo analysis [85,86]. The third group enclosing only the RILs is the interesting combination of distinct alleles from the two diploid species, which could beneficially be utilized in the breeding improvement programs. Further mechanistic studies encompassing MAS, QTL, and genomic studies could be a future perspective.

5. Conclusions

Plant breeding works on the principle of continuous selection regarding favorable alleles existent in the available germplasm for the improved performance of cultivars or elite lines against major biotic or abiotic stresses in their surroundings. There are maximum chances of unique and desirable allele contribution at different loci from wild or ancestral genotypes or landraces. The grouping of RILs and their parents via multivariate methods in the current study would be of significant practical value for scientists and breeders regarding the selection of germplasm. Understanding the distribution of RILs genotypes in distinct Clade II could provide an attractive feature of the study, and may prove essential in exploring and enhancing biological diversity and their further exploitation for crop improvement. T. boeoticum and T. monococcum anchor appropriate variability, fulfilling some of the future requirements of wheat breeding improvement programs. There is a need to allocate more resources regarding their conservancy and exploitation to be further utilized in current and future breeding programs for the maintenance of biodiversity, coupled with ample wheat crop performance.

Supplementary Materials

The following are available online at https://0-www-mdpi-com.brum.beds.ac.uk/article/10.3390/agronomy11112339/s1, Table S1: Correlation coefficients and p-values for different morphological traits in A-genome donor diploid wheat, Table S2: Eigenvalues contributing to different PCs for morphological traits in A-genome donor diploid studied wheat traits.

Author Contributions

Conceptualization, Z.S. and M.M.S.; performed experiment, Z.S., M.F.N., M.S.I. (Muhammad Sajid Iqbal); analyzed data Z.S., I.A.-A., M.S.I. (Muhammad Shahid Iqbal); wrote the manuscript, Z.S., M.S.I. (Muhammad Shahid Iqbal), M.I.A.R.; review and editing, M.S.I. (Muhammad Shahid Iqbal), M.I.A.R., I.A.-A., N.U., A.E.S.; funding acquisition, I.A.-A. All authors have read and agreed to the published version of the manuscript.

Funding

The authors extend their appreciation to the Researchers Supporting Project number (RSP-2021/298), King Saud University, Riyadh, Saudi Arabia.

Institutional Review Board Statement

Not applicable.

Informed Consent Statement

Not applicable.

Data Availability Statement

Not applicable.

Acknowledgments

The authors extend their appreciation to the Researchers Supporting Project number (RSP-2021/298), King Saud University, Riyadh, Saudi Arabia. The authors thank Syed Tahir Ata-Ul-Karim for the valuable suggestions for data analysis.

Conflicts of Interest

The authors declare no conflict of interest.

References

  1. Girma, E. Genetic erosion of wheat (Triticum spp.): Concept, research results and challenges. J. Nat. Sci. Res. 2017, 7, 72–81. [Google Scholar]
  2. Cardinale, B.J.; Duffy, J.E.; Gonzalez, A.; Hooper, D.U.; Perrings, C.; Venail, P.; Narwani, A.; Mace, G.M.; Tilman, D.; Wardle, D.A. Biodiversity loss and its impact on humanity. Nature 2012, 486, 59–67. [Google Scholar] [CrossRef]
  3. Zavaleta, E.S.; Pasari, J.R.; Hulvey, K.B.; Tilman, G.D. Sustaining multiple ecosystem functions in grassland communities requires higher biodiversity. Proc. Natl. Acad. Sci. USA 2010, 107, 1443–1446. [Google Scholar] [CrossRef] [Green Version]
  4. Choudhary, S.K.; Kumar, V.; Singhal, R.K.; Bose, B.; Chauhan, J.; Alamri, S.; Siddiqui, M.H.; Javed, T.; Shabbir, R.; Rajendran, K.; et al. Seed Priming with Mg(NO3)2 and ZnSO4 Salts Triggers the Germination and Growth Attributes Synergistically in Wheat Varieties. Agronomy 2021, 11, 2110. [Google Scholar] [CrossRef]
  5. Abhinandan, K.; Skori, L.; Stanic, M.; Hickerson, N.M.N.; Jamshed, M.; Samuel, M.A. Abiotic Stress Signaling in Wheat An Inclusive Overview of Hormonal Interactions During Abiotic Stress Responses in Wheat. Front. Plant Sci. 2018, 9, 734. [Google Scholar] [CrossRef]
  6. Zaheer, M.S.; Ali, H.H.; Soufan, W.; Iqbal, R.; Habib-Ur-Rahman, M.; Iqbal, J.; Israr, M.; El Sabagh, A. Potential Effects of Biochar Application for Improving Wheat (Triticum aestivum L.) Growth and Soil Biochemical Properties under Drought Stress Conditions. Land 2021, 10, 1125. [Google Scholar] [CrossRef]
  7. Chen, X. Pathogens which threaten food security: Puccinia striiformis, the wheat stripe rust pathogen. Food Secur. 2020, 12, 239–251. [Google Scholar] [CrossRef]
  8. Brook, B.W.; Sodhi, N.S.; Bradshaw, C.J.A. Synergies among extinction drivers under global change. Trends Ecol. Evol. 2008, 23, 453–460. [Google Scholar] [CrossRef]
  9. Dunn, R.R.; Harris, N.C.; Colwell, R.K.; Koh, L.P.; Sodhi, N.S. The sixth mass coextinction: Are most endangered species parasites and mutualists? Proc. R. Soc. B Biol. Sci. 2009, 276, 3037–3045. [Google Scholar] [CrossRef] [Green Version]
  10. Shmelev, S.E.; Salnikov, V.; Turulina, G.; Polyakova, S.; Tazhibayeva, T.; Schnitzler, T.; Shmeleva, I. Climate Change and Food Security: The Impact of Some Key Variables on Wheat Yield in Kazakhstan. Sustainability 2021, 13, 8583. [Google Scholar] [CrossRef]
  11. Gupta, P.K.; Mir, R.R.; Mohan, A.; Kumar, J. Wheat Genomics: Present Status and Future Prospects. Int. J. Plant Genom. 2008, 2008, 1–36. [Google Scholar] [CrossRef]
  12. Sarfraz, Z.; Shah, M.M.; Iqbal, M.S.; Nazir, M.F.; Fatima, S.A. Identification of Valuable Traits Through Molecular and Morphological Markers in Diploid Wheat. Pak. J. Biotechnol. 2020, 17. [Google Scholar] [CrossRef]
  13. Endo, T.R.; Gill, B.S. The Deletion Stocks of Common Wheat. J. Hered. 1996, 87, 295–307. [Google Scholar] [CrossRef]
  14. Sears, E.R. Nullisomic-tetrasomic combinations in hexaploid wheat. In Chromosome Manipulations and Plant Genetics; Springer: Berlin/Heidelberg, Germany, 1966; pp. 29–45. [Google Scholar]
  15. Dhaliwal, H.S.; Singh, H.; Gill, K.S.; Randhawa, H.S. Evaluation and cataloguing of wheat germplasm for disease resistance and quality. In Biodiversity and Wheat Improvement; Damania, A.B., Ed.; John Wiley and Sons: Chichester, UK, 1993; pp. 123–140. [Google Scholar]
  16. Feldman, M.; Sears, E.R. The Wild Gene Resources of Wheat. Sci. Am. 1981, 244, 102–112. [Google Scholar] [CrossRef]
  17. Hussien, T.; Bowden, R.L.; Gill, B.S.; Cox, T.S.; Marshall, D.S. Performance of Four New Leaf Rust Resistance Genes Transferred to Common Wheat from Aegilops tauschii and Triticum monococcum. Plant Dis. 1997, 81, 582–586. [Google Scholar] [CrossRef] [Green Version]
  18. Qiu, Y.C.; Zhou, R.H.; Kong, X.Y.; Zhang, S.S.; Jia, J.Z. Microsatellite mapping of a Triticum urartu Tum. derived powdery mildew resistance gene transferred to common wheat (Triticum aestivum L.). Theor. Appl. Genet. 2005, 111, 1524–1531. [Google Scholar] [CrossRef]
  19. Dvořák, J.; Di Terlizzi, P.; Zhang, H.-B.; Resta, P. The evolution of polyploid wheats: Identification of the A genome donor species. Genome 1993, 36, 21–31. [Google Scholar] [CrossRef]
  20. Singh, K.; Ghai, M.; Garg, M.; Chhuneja, P.; Kaur, P.; Schnurbusch, T.; Keller, B.; Dhaliwal, H.S. An integrated molecular linkage map of diploid wheat based on a Triticum boeoticum × T. monococcum RIL population. Theor. Appl. Genet. 2007, 115, 301–312. [Google Scholar] [CrossRef]
  21. Cox, T.S.; Harrell, L.G.; Chen, P.; Gill, B.S. Reproductive Behavior of Hexaploid/Diploid Wheat Hybrids 1. Plant Breed. 1991, 107, 105–118. [Google Scholar] [CrossRef]
  22. Plamenov, D.; Belchev, I.; Kiryakova, V.; Spetsov, P. Fungal resistance of Triticum durumT. monococcum ssp. aegilopoides amphiploid. J. Plant Dis. Prot. 2009, 116, 60–62. [Google Scholar] [CrossRef]
  23. The, T.; Baker, E. Basic Studies relating to the Transference of Genetic Characters From Triticum Monococcum L. to Hexaploid Wheat. Aust. J. Biol. Sci. 1975, 28, 189. [Google Scholar] [CrossRef] [Green Version]
  24. Bhagyalakshmi, K.; Vinod, K.K.; Kumar, M.; Arumugachamy, S.; Prabhakaran, A.J.; Raveendran, T.S. Interspecific Hybrids from Wild × Cultivated Triticum Crosses—A Study on the Cytological Behaviour and Molecular Relations. J. Crop. Sci. Biotechnol. 2008, 11, 257–262. [Google Scholar]
  25. Nazir, M.; Sarfraz, Z.; Mangi, N.; Shah, M.N.; Mahmood, T.; Mahmood, T.; Iqbal, M.; Rehmani, M.I.A.; El-Sharnouby, M.; Shabaan, M.; et al. Post-Anthesis Mobilization of Stem Assimilates in Wheat under Induced Stress. Sustainability 2021, 13, 5940. [Google Scholar] [CrossRef]
  26. Dorofeev, V.F.; Udachin, R.A.; Semenova, L.V.; Novikova, M.V.; Grazhdaninova, O.D.; Shitova, I.P.; Merezhko, A.F.; Filatenko, A.A. World Wheat; Agropromizdat: Saint Petersburg, Russia, 1987; p. 560. (In Russian) [Google Scholar]
  27. Hao, C.; Wang, L.; Ge, H.; Dong, Y.; Zhang, X. Genetic Diversity and Linkage Disequilibrium in Chinese Bread Wheat (Triticum aestivum L.) Revealed by SSR Markers. PLoS ONE 2011, 6, e17279. [Google Scholar] [CrossRef] [Green Version]
  28. Ladizinsky, G. Founder effect in crop-plant evolution. Econ. Bot. 1985, 39, 191–199. [Google Scholar] [CrossRef]
  29. Liu, K.; Xu, H.; Liu, G.; Guan, P.; Zhou, X.; Peng, H.; Yao, Y.; Ni, Z.; Sun, Q.; Du, J. QTL mapping of flag leaf-related traits in wheat (Triticum aestivum L.). Theor. Appl. Genet. 2018, 131, 839–849. [Google Scholar] [CrossRef] [Green Version]
  30. Petronaitis, T.; Simpfendorfer, S.; Hüberli, D. Importance of Fusarium spp. in Wheat to Food Security: A Global Perspective. In Plant Disease Food Security 21st Century; Springer: Berlin/Heidelberg, Germany, 2021; pp. 127–159. [Google Scholar]
  31. Mengistu, D.D.; Degaga, D.T.; Tsehay, A.S. Analyzing the contribution of crop diversification in improving household food security among wheat dominated rural households in Sinana District, Bale Zone, Ethiopia. Agric. Food Secur. 2021, 10, 1–15. [Google Scholar] [CrossRef]
  32. Mirzaghaderi, G.; Mason, A.S. Broadening the bread wheat D genome. Theor. Appl. Genet. 2019, 132, 1295–1307. [Google Scholar] [CrossRef]
  33. Singh, S.; Vikram, P.; Sehgal, D.; Burgueño, J.; Sharma, A.; Singh, S.K.; Sansaloni, C.P.; Joynson, R.; Brabbs, T.; Ortiz, C.; et al. Harnessing genetic potential of wheat germplasm banks through impact-oriented-prebreeding for future food and nutritional security. Sci. Rep. 2018, 8, 12527. [Google Scholar] [CrossRef] [Green Version]
  34. Pour-Aboughadareh, A.; Ahmadi, J.; Mehrabi, A.A.; Etminan, A.; Moghaddam, M. Insight into the genetic variability analysis and relationships among some Aegilops and Triticum species, as genome progenitors of bread wheat, using SCoT markers. Plant Biosyst. Int. J. Deal. Asp. Plant Biol. 2017, 152, 694–703. [Google Scholar] [CrossRef]
  35. Badr, S.S.M. Evaluation of some Egyptian cotton varieties by the yield and seven methods of earliness of crop maturity measurements. Egypt. J. Agric. Res. 2003, 81, 671–688. [Google Scholar]
  36. Batool, S.; Khan, N.U.; Makhdoom, K.; Bibi, Z.; Hassan, G.; Marwat, K.B.; Farhatullah, F.; Mohammad, R.; Khan, I.A. Heritability and genetic potential of upland cotton genotypes for morpho-yield traits. Pak. J. Bot. 2010, 42, 1057–1064. [Google Scholar]
  37. Soomro, Z.A.; Larik, A.S.; Kumbhar, M.B.; Khan, N.U.; Panhwar, N.A. Correlation and path analysis in hybrid cotton. Sabrao J. Breed. Genet. 2008, 40, 49–56. [Google Scholar]
  38. Roostaei, M.; Kamali, M.R.J.; Roohi, E.; Mohammadi, R. Evaluation of Sardari bread wheat ecotypes under the rainfed cold conditions of Iran. J. Agric. Sci. 2018, 156, 504–514. [Google Scholar] [CrossRef]
  39. Abbasov, M.; Akparov, Z.; Gross, T.; Babayeva, S.; Izzatullayeva, V.; Hajiyev, E.; Rustamov, K.; Gross, P.; Tekin, M.; Akar, T.; et al. Genetic relationship of diploid wheat (Triticum spp.) species assessed by SSR markers. Genet. Resour. Crop. Evol. 2018, 65, 1441–1453. [Google Scholar] [CrossRef]
  40. Singh, P.; Narayanam, S.S. Biometical Techniques in Plant Breeding; Kalyani Publishers: New Delhi, India, 2007. [Google Scholar]
  41. Ihsan, M.; Nazir, N.; Ghafoor, A.; Khalil, A.A.K.; Zahoor, M.; Nisar, M.; Khames, A.; Ullah, R.; Shah, A.B. Genetic Diversity in Local and Exotic Avena sativa L. (Oat) Germplasm Using Multivariate Analysis. Agronomy 2021, 11, 1713. [Google Scholar] [CrossRef]
  42. Murube, E.; Beleggia, R.; Pacetti, D.; Nartea, A.; Frascarelli, G.; Lanzavecchia, G.; Bellucci, E.; Nanni, L.; Gioia, T.; Marciello, U.; et al. Characterization of Nutritional Quality Traits of a Common Bean Germplasm Collection. Foods 2021, 10, 1572. [Google Scholar] [CrossRef]
  43. Johnson, R.A.; Wichern, D.W. Applied Multivariate Statistical Analysis; Prentice Hall: Upper Saddle River, NJ, USA, 2002; Volume 5, pp. 426–475. [Google Scholar]
  44. International Board for Plant Genetic Resources (IBPGR). Descriptors for Wheat (Revised); International Board for Plant Genetic Resources Secretariat: Rome, Italy, 1985; p. 12. [Google Scholar]
  45. Steel, R. Analysis of variance II: Multiway classifications. In Principles and Procedures of Statistics: A Biometrical Approach; McGraw-Hill Co. Inc.: New York, NY, USA, 1997; pp. 204–252. [Google Scholar]
  46. Mujeeb-Kazi, A.; Kimber, G. The Production, Cytology and Practically of Wide Hybrids in the Triticeae. Cereal Res. Commun. 1985, 13, 111–124. [Google Scholar]
  47. Bernhardt, N.; Brassac, J.; Dong, X.; Willing, E.M.; Poskar, C.H.; Kilian, B.; Blattner, F.R. Genome-wide sequence information reveals recurrent hybridization among diploid wheat wild relatives. Plant J. 2019, 102, 493–506. [Google Scholar] [CrossRef]
  48. Gill, B.S.; Browder, L.E.; Hatchett, J.H.; Harvey, T.L.; Martin, T.J.; Raupp, W.J.; Sharma, H.C.; Waines, J.G. Disease and Insect Resistance in Wild Wheats. In Proceedings of the Sixth International Wheat Genetics Symposium, Kyoto, Japan, 28 November–3 December 1983. [Google Scholar]
  49. Marshall, D.R.; Brown, A.H.D. Optimum sampling strategies in genetic conservation. In Crop Genetic Resources for Today and Tomorrow; Frankel, O.H., Hawkes, J.G., Eds.; Cambridge University Press: Cambridge, UK, 1975; pp. 53–80. [Google Scholar]
  50. Sharma, H.C.; Waines, J.G.; Foster, K.W. Variability in Primitive and Wild Wheats for Useful Genetic Characters 1. Crop. Sci. 1981, 21, 555–559. [Google Scholar] [CrossRef]
  51. Waines, J.G. Genetic Resources in Diploid Wheats: The Case for Diploid Commercial Wheats. In Proceedings of the Sixth International Wheat Genetics Symposium, Kyoto, Japan, 28 November–3 December 1983. [Google Scholar]
  52. Heun, M.; Schäfer-Pregl, R.; Klawan, D.; Castagna, R.; Accerbi, M.; Borghi, B.; Salamini, F. Site of Einkorn Wheat Domestication Identified by DNA Fingerprinting. Science 1997, 278, 1312–1314. [Google Scholar] [CrossRef] [Green Version]
  53. Dvorak, J.; McGuire, P.E.; Cassidy, B. Apparent sources of the A genomes of wheats inferred from polymorphism in abundance and restriction fragment length of repeated nucleotide sequences. Genome 1988, 30, 680–689. [Google Scholar] [CrossRef]
  54. Zhao, F.; Li, Y.; Yang, B.; Yuan, H.; Jin, C.; Zhou, L.; Pei, H.; Zhao, L.; Li, Y.; Zhou, Y.; et al. Powdery mildew disease resistance and marker-assisted screening at the Pm60 locus in wild diploid wheat Triticum urartu. Crop. J. 2019, 8, 252–259. [Google Scholar] [CrossRef]
  55. Chhuneja, P.; Kaur, S.; Garg, T.; Ghai, M.; Kaur, S.; Prashar, M.; Bains, N.S.; Goel, R.K.; Keller, B.; Dhaliwal, H.S.; et al. Mapping of adult plant stripe rust resistance genes in diploid A genome wheat species and their transfer to bread wheat. Theor. Appl. Genet. 2007, 116, 313–324. [Google Scholar] [CrossRef]
  56. Aharizad, S.; Sabzi, M.; Mohammadi, S.A.; Khodadadi, E. Multivariate analysis of genetic diversity in wheat (Triticum aestivum L.) recombinant inbred lines using agronomic traits. Ann. Biol. Res. 2012, 3, 2118–2126. [Google Scholar]
  57. Qaseem, M.F.; Qureshi, R.; Illyas, N.; Jalal-Ud-Din, S.G. Multivariate statistical analysis for yield and yield components in bread wheat planted under rainfed conditions. Pak. J. Bot. 2017, 49, 2445–2450. [Google Scholar]
  58. Blum, A.; Shpiler, L.; Golan, G.; Mayer, J. Yield stability and canopy temperature of wheat genotypes under drought-stress. Field Crop. Res. 1989, 22, 289–296. [Google Scholar] [CrossRef]
  59. Jaradat, A.A. Phenotypic divergence for morphological and yield-related traits among landrace genotypes of durum wheat from Jordan. Euphytica 1991, 52, 155–164. [Google Scholar] [CrossRef]
  60. Takumi, S.; Mitta, S.; Komura, S.; Ikeda, T.M.; Matsunaka, H.; Sato, K.; Yoshida, K.; Murai, K. Introgression of chromosomal segments conferring early heading date from wheat diploid progenitor, Aegilops tauschii Coss., into Japanese elite wheat cultivars. PLoS ONE 2020, 15, e0228397. [Google Scholar] [CrossRef] [Green Version]
  61. Liu, Y.; Lin, Y.; Gao, S.; Li, Z.; Ma, J.; Deng, M.; Chen, G.; Wei, Y.; Zheng, Y. A genome-wide association study of 23 agronomic traits in Chinese wheat landraces. Plant J. 2017, 91, 861–873. [Google Scholar] [CrossRef] [Green Version]
  62. Picascia, S.; Camarca, A.; Malamisura, M.; Mandile, R.; Galatola, M.; Cielo, D.; Gazza, L.; Mamone, G.; Auricchio, S.; Troncone, R.; et al. In Celiac Disease Patients the In Vivo Challenge with the Diploid Triticum monococcum Elicits a Reduced Immune Response Compared to Hexaploid Wheat. Mol. Nutr. Food Res. 2020, 64, e1901032. [Google Scholar] [CrossRef]
  63. Prasad, P.; Bhardwaj, S.C.; Gangwar, O.P.; Kumar, S.; Khan, H.; Kumar, S.; Rawal, H.C.; Sharma, T.R. Population Differentiation of Wheat Leaf Rust Fungus Puccinia triticina in South Asia. Curr. Sci. 2017, 112. [Google Scholar] [CrossRef]
  64. Sakhare, S.B.; Ghawat, N.P. Correlation and path analysis in durum wheat. PKV. Res. J. 2011, 35, 23–25. [Google Scholar]
  65. Sarfraz, Z.; Shah, M.M.; Iqbal, M.S.; Nazir, M.F.; Fatima, S.A. Cause and effect relationship of morphological attributes with yield in a-genome Wheat. J. Appl. Res. Plant Sci. 2020, 1, 13–19. [Google Scholar]
  66. Wang, X.; Luo, G.; Yang, W.; Li, Y.; Sun, J.; Zhan, K.; Liu, D.; Zhang, A. Genetic diversity, population structure and marker-trait associations for agronomic and grain traits in wild diploid wheat Triticum urartu. BMC Plant Biol. 2017, 17, 112. [Google Scholar] [CrossRef]
  67. Marza, F.; Bai, G.-H.; Carver, B.F.; Zhou, W.-C. Quantitative trait loci for yield and related traits in the wheat population Ning7840 × Clark. Theor. Appl. Genet. 2005, 112, 688–698. [Google Scholar] [CrossRef] [PubMed]
  68. Khan, M.H.; Dar, A.N. Correlation and path coefficient analysis of some quantitative traits in wheat. Afr. Crop. Sci. J. 2010, 18. [Google Scholar] [CrossRef] [Green Version]
  69. Kumar, R.; Gaurav, S.S.; Bhushan, B.; Pal, R. Study of genetic parameters and genetic divergence for yield and yield components of bread wheat (Triticum aestivum L.). J. Wheat Res. 2013, 5, 39–42. [Google Scholar]
  70. Muhammad, K.; Khalil, I.H.; Abdul, B.; Mohammad, T.; Shahid, A.; Sajjad, A.; Amjad, A.; Muhammad, I. Assessment of heritability estimates for some yield traits in winter wheat (Triticum aestivum L.). Pak. J. Bot. 2011, 43, 2733–2736. [Google Scholar]
  71. Sarfraz, Z.; Shah, M.M.; Iqbal, M.S. Estimation of components of variation of morphological traits and yield in A-genome wheat populations. SABRAO J. Breed. Genet. 2016, 48, 105–109. [Google Scholar]
  72. Sheikh, S.; Singh, I. Studies on path co-efficient analysis of harvest index and its related traits in wheat. Indian J. Agric. Res. 2001, 35, 127–129. [Google Scholar]
  73. Sarfraz, Z.; Shah, M.M.; Iqbal, M.S. Genetic variability, heritability and genetic advance for agronomic traits among A-genome donor wheat genotypes. J. Agric. Res. 2016, 54, 15–20. [Google Scholar]
  74. Lee, I.; Yang, J. Common Clustering Algorithms. In Comprehensive Chemometrics; Brown, S.D., Tauler, R., Walczak, B., Eds.; Chemical and Biochemical Data Analysis; Elsevier: Amsterdam, The Netherlands, 2009; Volume 2, pp. 577–618. [Google Scholar]
  75. Massart, D.L.; Vandeginste, B.G.; Buydens, L.M.; Lewi, P.J.; Smeyers-Verbeke, J.; Jong, S.D. Handbook of Chemometrics and Qualimetrics; Elsevier Science Inc.: Amsterdam, The Netherlands, 1998. [Google Scholar]
  76. Kaiser, H.F. The Application of Electronic Computers to Factor Analysis. Educ. Psychol. Meas. 1960, 20, 141–151. [Google Scholar] [CrossRef]
  77. Abdi, H.; Williams, L.J. Principal component analysis. Wiley Interdiscip. Rev. Comput. Stat. 2010, 2, 433–459. [Google Scholar] [CrossRef]
  78. Chairi, F.; Sanchez-Bragado, R.; Serret, M.D.; Aparicio, N.; Nieto-Taladriz, M.T.; Araus, J.L. Agronomic and physiological traits related to the genetic advance of semi-dwarf durum wheat: The case of Spain. Plant Sci. 2020, 295, 110210. [Google Scholar] [CrossRef]
  79. Dutamo, D.; Alamerew, S.; Eticha, F.; Fikre, G. Genetic Variability in Bread Wheat (Triticum aestivum L.) Germplasm for Yield and Yield Component Traits. J. Biol. Agric. Healthc. 2015, 5, 39–46. [Google Scholar]
  80. Getachew, A.; Worede, F.; Alamerew, S. Multivariate analysis of phenotypic diversity of bread wheat (Triticum aestivum L.) in the highlands of northern Ethiopia. Adv. Crop. Sci. Technol. 2017, 5, 1–7. [Google Scholar]
  81. Wolde, T.; Eticha, F.; Alamerew, S.; Assefa, E.; Dutamo, D. Multivariate Analysis of Some Metric Traits in Durum Wheat (Triticum durum L.) Accessions. Food Sci. Qual. Manag. 2016, 74, 26–31. [Google Scholar]
  82. Hailu, F.; Merker, A.; Singh, H.; Belay, G.; Johansson, E. Multivariate Analysis of Diversity of Tetraploid Wheat Germplasm from Ethiopia. Genet. Resour. Crop. Evol. 2006, 53, 1089–1098. [Google Scholar] [CrossRef]
  83. Vaishnav, G.; Shukla, R.; Pandey, S. Assessment of principal component analysis for yield and its attributing traits in bread wheat (Triticum astivum L.) for normal and late sown conditions. J. Pharmacogn. Phytochem. 2020, 9, 1706–1709. [Google Scholar]
  84. Faris, J.D. Wheat Domestication: Key to Agricultural Revolutions Past and Future. In Genomics of Plant Genetic Resources; Springer: Berlin/Heidelberg, Germany, 2014; pp. 3, 439–464. [Google Scholar] [CrossRef]
  85. Anker, C.C.; Buntjer, J.B.; Niks, R.E. Morphological and molecular characterisation confirm that Triticum monococcum s.s. is resistant to wheat leaf rust. Theor. Appl. Genet. 2001, 103, 1093–1098. [Google Scholar] [CrossRef]
  86. Malaki, M.; Naghavi, M.R.; Alizadeh, H.; Potki, P.; Kazemi, M.; Pirseyedi, S.M.; Mardi, M.; Fakhre-Tabatabaei, S. Study of Genetic Variation in Wild Diploid Wheat (Triticum boeoticum) from Iran Using AFLP Markers. Iran. J. Biotechnol. 2006, 4, 269–274. [Google Scholar]
Figure 1. A panel of 3D Surface profilers on the basis of standard least-square fit model to validate non-significant differences among replications and significant differences among experimental wheat genotypes regarding studied morphological traits.
Agronomy 11 02339 g001
Figure 2. Scatterplot matrix to visualize several attributes by pairwise dependencies of twelve phenotypic traits. The upper triangle matrix is representing correlations among twelve studied traits. The lower triangle matrix is the revelation of bivariate density distribution with ellipses between each pair of attributes. The legends at the top right corner of the color gradient (red to blue), and the size of circles show the amount of correlation and log (p) values for the significance threshold, respectively.
Agronomy 11 02339 g002
Figure 3. Summary plots having (a) Eigenvalue Pareto plot depicting eigenvalues and a bar chart of variation percentage accounted for by each PC; (b) sore plot between PC-1 and PC-2 displaying the distribution of 101 wheat genotypes in three groups; (c) loading plot with correlations between variables and the selected two PCs.
Agronomy 11 02339 g003
Figure 4. Squared cosines associated with the principal components for twelve studied traits of 101 parental wheat genotypes and RILs.
Agronomy 11 02339 g004
Figure 5. The Scatterplot matrix of first three PCs arranging score plots (yellow background) and loading plots (blue background) for all studied traits of experimental wheat genotypes, including parents and RILs in one space. The loading-plots (blue background) showed the correlation between traits in question and the three PCs. The score plots (yellow background) are exhibiting the distribution of diploid wheat genotypes with colored dots for the representation of genotype groups. The red dots depicted Clade-I genotypes (with parent T. boeoticum), and green dots are for the representation of Clade-II genotypes, while the blue dots represent Clade-III genotypes (with parent T. monococcum).
Agronomy 11 02339 g005
Figure 6. Agglomerative hierarchical clustering (AHC) to calculate the Euclidean distance matrix of parental genotypes and 98 RILs. The plot was constructed in JMP pro. V. 16 (SAS Institute Inc., Cary, NC, USA) using Ward’s minimum variance on standardized data The horizontal axis and vertical axis represent clades formation based on the division of traits and genotypes, respectively, following the two-way clustering approach.
Agronomy 11 02339 g006
Figure 7. Constellation plot of the dendrogram generated via agglomerative hierarchical clustering (AHC) cataloging parental and RILs genotypes in discrete clusters. Clusters I, II, and III represent red, green, and blue points, respectively. Data for twelve phenotypic traits were appended to 100 parental genotypes and RILs correlation coefficients, and jointly submitted to principal component analysis followed by hierarchical clustering of the first three principal components. The corresponding dendrogram is illustrated in the form of a constellation plot in dimensionless units. The plot was constructed in JMP v 16 (SAS Institute Inc., Cary, NC, USA) using Ward’s minimum variance hierarchical clustering method on standardized data.
Agronomy 11 02339 g007
Table 1. Summary Statistics for studied morphological traits of 98 RILS and parents of A-genome wheat.
PopPHDHFLLFLDPdLTillSpLSpSTBMSWspNSSGY
MeanParents122.213012.60.8146.63619.41626.252.3437.0015.90
RILS118.012813.20.6748.03616.11742.782.3936.2415.28
MaxParents132.013313.40.9653.03820.61927.002.7542.0027.20
RILS158.216121.10.9766.65820.72886.003.7864.0028.90
MinParents112.412711.80.6640.13418.11325.501.9332.004.60
RILS88.91087.10.4536.82311.21010.831.2218.002.50
SDParents9.8030.80.156.521.330.750.415.0011.30
RILS14.011.03.00.116.182.4419.100.529.187.47
Mean Average value, SD: standard deviation, Min: minimum value, Max: maximum value. PH: plant height, DH: days to heading, FLL: flag leaf length, FLD: flag leaf diameter, PdL: peduncle length, Till: tillers per plant, SpL: spike length, SpS: number of spikelets per spike, TBM: total biomass, SWsp: Seed Weight per Spike, NSS: number of seeds per spike, GY: grain yield.
Table 2. Analysis of variance (ANOVA) and summary of effects of least squares for studied morphological traits in A-genome wheat genotypes.
TraitSourceDFSum of SquareF-RatioLog WorthSummary Graphp Value
PHGen.9959,007.0953.371812.730 Agronomy 11 02339 i001<0.0001 *
Rep.2868.5052.45661.0540.0883
DHGen.9936,247.2377.071130.775 Agronomy 11 02339 i002<0.0001 *
Rep.2281.847002.72171.1660.0682
FLLGen.992658.45153.911315.757 Agronomy 11 02339 i003<0.0001 *
Rep.24.62420000.33680.1460.7145
FLDGen.993.61481473.157811.495 Agronomy 11 02339 i004<0.0001 *
Rep.20.02090400.90390.3910.4066
PdLGen.9911,141.5333.473413.310 Agronomy 11 02339 i005<0.0001 *
Rep.290.8250001.40160.6040.2486
TillGen.9918,548.3193.737714.798 Agronomy 11 02339 i006<0.0001 *
Rep.2217.097002.16550.9300.1174
SpLGen.991761.95103.295312.291 Agronomy 11 02339 i007<0.0001 *
Rep.232.2757002.98801.2780.0527
SpSGen.995231.96445.863425.553 Agronomy 11 02339 i008<0.0001 *
Rep.243.0383002.38751.0250.0945
TBMGen.99108,816.516.528528.500 Agronomy 11 02339 i009<0.0001 *
Rep.2727.570002.16070.9280.1180
SWspGen.9979.4464674.081216.682 Agronomy 11 02339 i010<0.0001 *
Rep.20.06301900.16020.0700.8520
NSSGen.9925,167.9033.142211.404 Agronomy 11 02339 i011<0.0001 *
Rep.2263.847001.63060.7020.1984
GYGen.9917,190.1577.757033.500 Agronomy 11 02339 i012<0.0001 *
Rep.2111.461002.48971.0680.0855
PH: plant height, DH: days to heading, FLL: flag leaf length, FLD: flag leaf diameter, PdL: peduncle length, Till: tillers per plant, SpL: spike length, SpS: number of spikelets per spike, TBM: total biomass, SWsp: seed weight per spike, NSS: number of seeds per spike, GY: grain yield, probability level: (* p < 0.05).
Publisher’s Note: MDPI stays neutral with regard to jurisdictional claims in published maps and institutional affiliations.

