Article

Assessment and Prediction of Maize Production Considering Climate Change by Extreme Learning Machine in Czechia

1
Department of Economics, Faculty of Economics and Management, Czech University of Life Sciences Prague, 16500 Prague, Czech Republic
2
Department of Landscape and Urban Planning, Faculty of Environmental Sciences, Czech University of Life Sciences Prague, Kamýcká 129, 16500 Praha–Suchdol, Czech Republic
3
Department of Trade and Finance, Faculty of Economics and Management, Czech University of Life Sciences Prague, 16500 Prague, Czech Republic
4
Department of Geography, Faculty of Education, University of South Bohemia, 37115 České Budějovice, Czech Republic
*
Author to whom correspondence should be addressed.
These authors contributed equally to this work.
Submission received: 4 November 2021 / Revised: 16 November 2021 / Accepted: 17 November 2021 / Published: 19 November 2021

Abstract

:
Machine learning algorithms have been applied in the agriculture field to forecast crop productivity. Previous studies mainly focused on the whole crop growth period while different time windows on yield prediction were still unknown. The entire growth period was separated into each month to assess their corresponding predictive ability by taking maize production (silage and grain) in Czechia. We present a thorough assessment of county-level maize yield prediction in Czechia using a machine learning algorithm (extreme learning machine (ELM)) and an extensive set of weather data and maize yields from 2002 to 2018. Results show that sunshine in June and water deficit in July were vastly influential factors for silage maize yield. The two primary climate parameters for grain maize yield are minimum temperature in September and water deficit in May. The average absolute relative deviation (AARD), root mean square error (RMSE), and coefficient (R2) of the proposed models are 6.565–32.148%, 1.006–1.071%, 0.641–0.716, respectively. Based on the results, silage yield will decrease by 1.367 t/ha (3.826% loss), and grain yield will increase by 0.337 t/ha (5.394% increase) when the max temperature in May increases by 2 °C. In conclusion, ELM models show a great potential application for predicting maize yield.

1. Introduction

Climate change has established its reality on affecting temperatures and precipitation, with much evidence confirming the increase of global temperature and change in the rainfall rates. The changes in the temperature and precipitation often come in the form of heat waves, changes in frequency and intensity of precipitation, or other extreme events. Over the last century, studies have shown an increase in global temperatures [1] and alterations in rainfall patterns. The precipitation shifts are twofold: first is “wet get wetter, dry get drier,” and the second is a change in storms that should move away from the equator toward the poles [2].
Climate change is causing an impact on food production, and maize is no exception [3]. Temperature and precipitation are the two main climate factors influencing maize productivity. It will be reduced when extreme temperature events occur during pollination and are further exaggerated when there are water deficits. During the grain-filling period, warm temperatures above the upper threshold cause a reduction in yield. Model estimates suggest that for every 1 °C increase in temperature, there is nearly a 10% yield reduction [3]. Tigchelaar et al. (2018) predicted maize production under the climate change scenarios, and found that maize yields will decrease about 20–40% and 40–60% if a temperature increase of 2 and 4 °C, respectively [4]. According to the employed statistical model heat stress and lack of participation can cause the observed global variability from 50% in 1980–2010. Observed and predicted extreme climate events would bring losses to world maize production (ten years return in the given period), with 1.5 °C global warming levels (the 2020s). The scenario with a 2 °C temperature increase (the late 2030s) shows that maize production will suffer from heat stress and drought with no historical parallel [5].
Machine learning (ML) allows independent learning and improves from experience via iterative training [6]. It has been applied in the agriculture field to increase the quality and productivity of the crops. It has been proved that ML has powerful performance in data mining and agricultural analyses, such as classifying crop types and yield prediction [7,8,9,10]. Crop yield can be predicted based on different historical available data, including weather parameters, soil parameters, and historical crop yield [11], as well as optical, fluorescence, thermal satellite data [12] and nitrogen loss [13]. Recently, different ML models for crop yield prediction have been developed with various input parameters. Mainly, three ML approaches (decision tree, Naïve Bayes Classifier, and K-nearest neighbor) were used to classify the soils and estimate rice yield by Singh et al. [14]. They also proposed the support vector machine and rule-based induction have the potential application to obtain better accuracy. Panda et al. [15] initially constructed predictive models for agriculture crop yield through Back-propagation Neural Network models combined with four vegetation indices. Sharifi [16] established a model for integrating field data, remote sensing data and meteorological data using four machine learning methods to predict barley production in Iran, and found that the gaussian process regression algorithm performed the best results. What’s more, Sharifi [17] reported the use of Sentinel-2 data for predicting maize nitrogen update in three different farms to develop an array of precision agriculture applications. However, Mupangwa et al. [18] found that linear discriminant analysis algorithm was the best tool, and SVM was the worst algorithm in maize yield prediction under conservation agriculture in Eastern and Southern Africa. Abbas et al. [19] employed four ML algorithms, including linear regression (LR), support vector regression (SVR), k-nearest neighbor (k-NN), elastic net (EN), to forecast the yield of potato tuber based on the soil data and crop properties from proximal sensing. Among the ML techniques, extreme learning machine (ELM), a novel type of learning algorithm with exceptional speed and excellent generalization abilities [20], has been increasingly considered by researchers in various fields.
Besides, some researchers also implemented various ML approaches for crop yield forecasting by climate variables in recent years. In 2014, Veenadhari et al. [21] applied a kind of decision tree technique to find out the dominant climate parameter for crop yields, and the incredible accuracy of predictions showed the potential power of the algorithm in forecasting the crop yield. In 2018, the deep neural network was utilized for crop yield prediction underlying the climate data by Crane-Droesch A. [22], and results showed that climate change has considerable negative impacts on corn yield. Hoffman et al. [23] explored the relation between crop yields and scale-compatible climate data for the 1962–2014 period using Random Forest from sub-Saharan Africa. Vogel et al. [24] studied the impacts of climate extremes on yield anomalies of maize, soybeans, rice, and spring wheat at the global scale using sub-national yield data and applying a machine-learning algorithm. Chemura et al. [25] used extreme gradient boosting, a machine learning approach to model the current climatic suitability for maize, sorghum, cassava and groundnut in Ghana using yield data and agronomically important variables. Fan et al. [26] provided an alternative tool for prefecture level users using an aggregate Z-index which uses precipitation as an input in random forest to predict rice and maize yield in Sichuan Province, China.
In the recent decade (2011–2019), the average temperature increased by 0.7 °C, and the average precipitation decreased by 88 mm compared to the last decade (2001–2010) in Czechia. Meanwhile, the maize yield rate slightly decreased from 7.73 t/ha (2001–2010) to 7.67 t/ha (2011–2019). This decrease can be significant when considering the improvement of technological and management of maize production. Therefore, the objectives of this study were (1) to assess the influence of climate factors on maize yield (both grain and silage) by ELM in Czechia; (2) to establish a predictive model for maize prediction using the ELM algorithm considering various climate parameters.

2. Materials and Methods

2.1. Data Collection

We selected nine regions for a detailed study on maize production (both grain and silage) from 2002–2018: Liberec, Moravian-Silesian, South Moravian, Usti nad Labem, Vysočina, Plzen, South Bohemia, Central Bohemia, and Prague. The data of maize yields for maize production (both for grain and silage) of the nine selected regions from 2002 to 2018 were obtained from the Institute of Agricultural Economics and Information (IAEI, http://www.iaei.cz (accessed on 1 July 2021)). The temperatures and rainfall data from 2002 to 2018 come from the Czech Hydrometeorological Institute (CHMI, http://portal.chmi.cz/historicka-data/pocasi/uzemni-srazky?l=en (accessed on 1 July 2021)). The data on daily average, maximum and minimum air temperature, relative humidity, daily total precipitation, and duration of sunshine cover from 2002 to 2018 were collected from the nine selected stations for the nine studied regions. The maize yield from 2002–2018 was collected from the Czech Statistical Office (https://www.czso.cz (accessed on 1 July 2021)) The water deficit data was calculated based on the Czech technical norm (ČSN 750434), which uses standardized temperatures (ST) according to the long-term averages. Detailed calculation of water deficit was provided in Supporting Information 1.

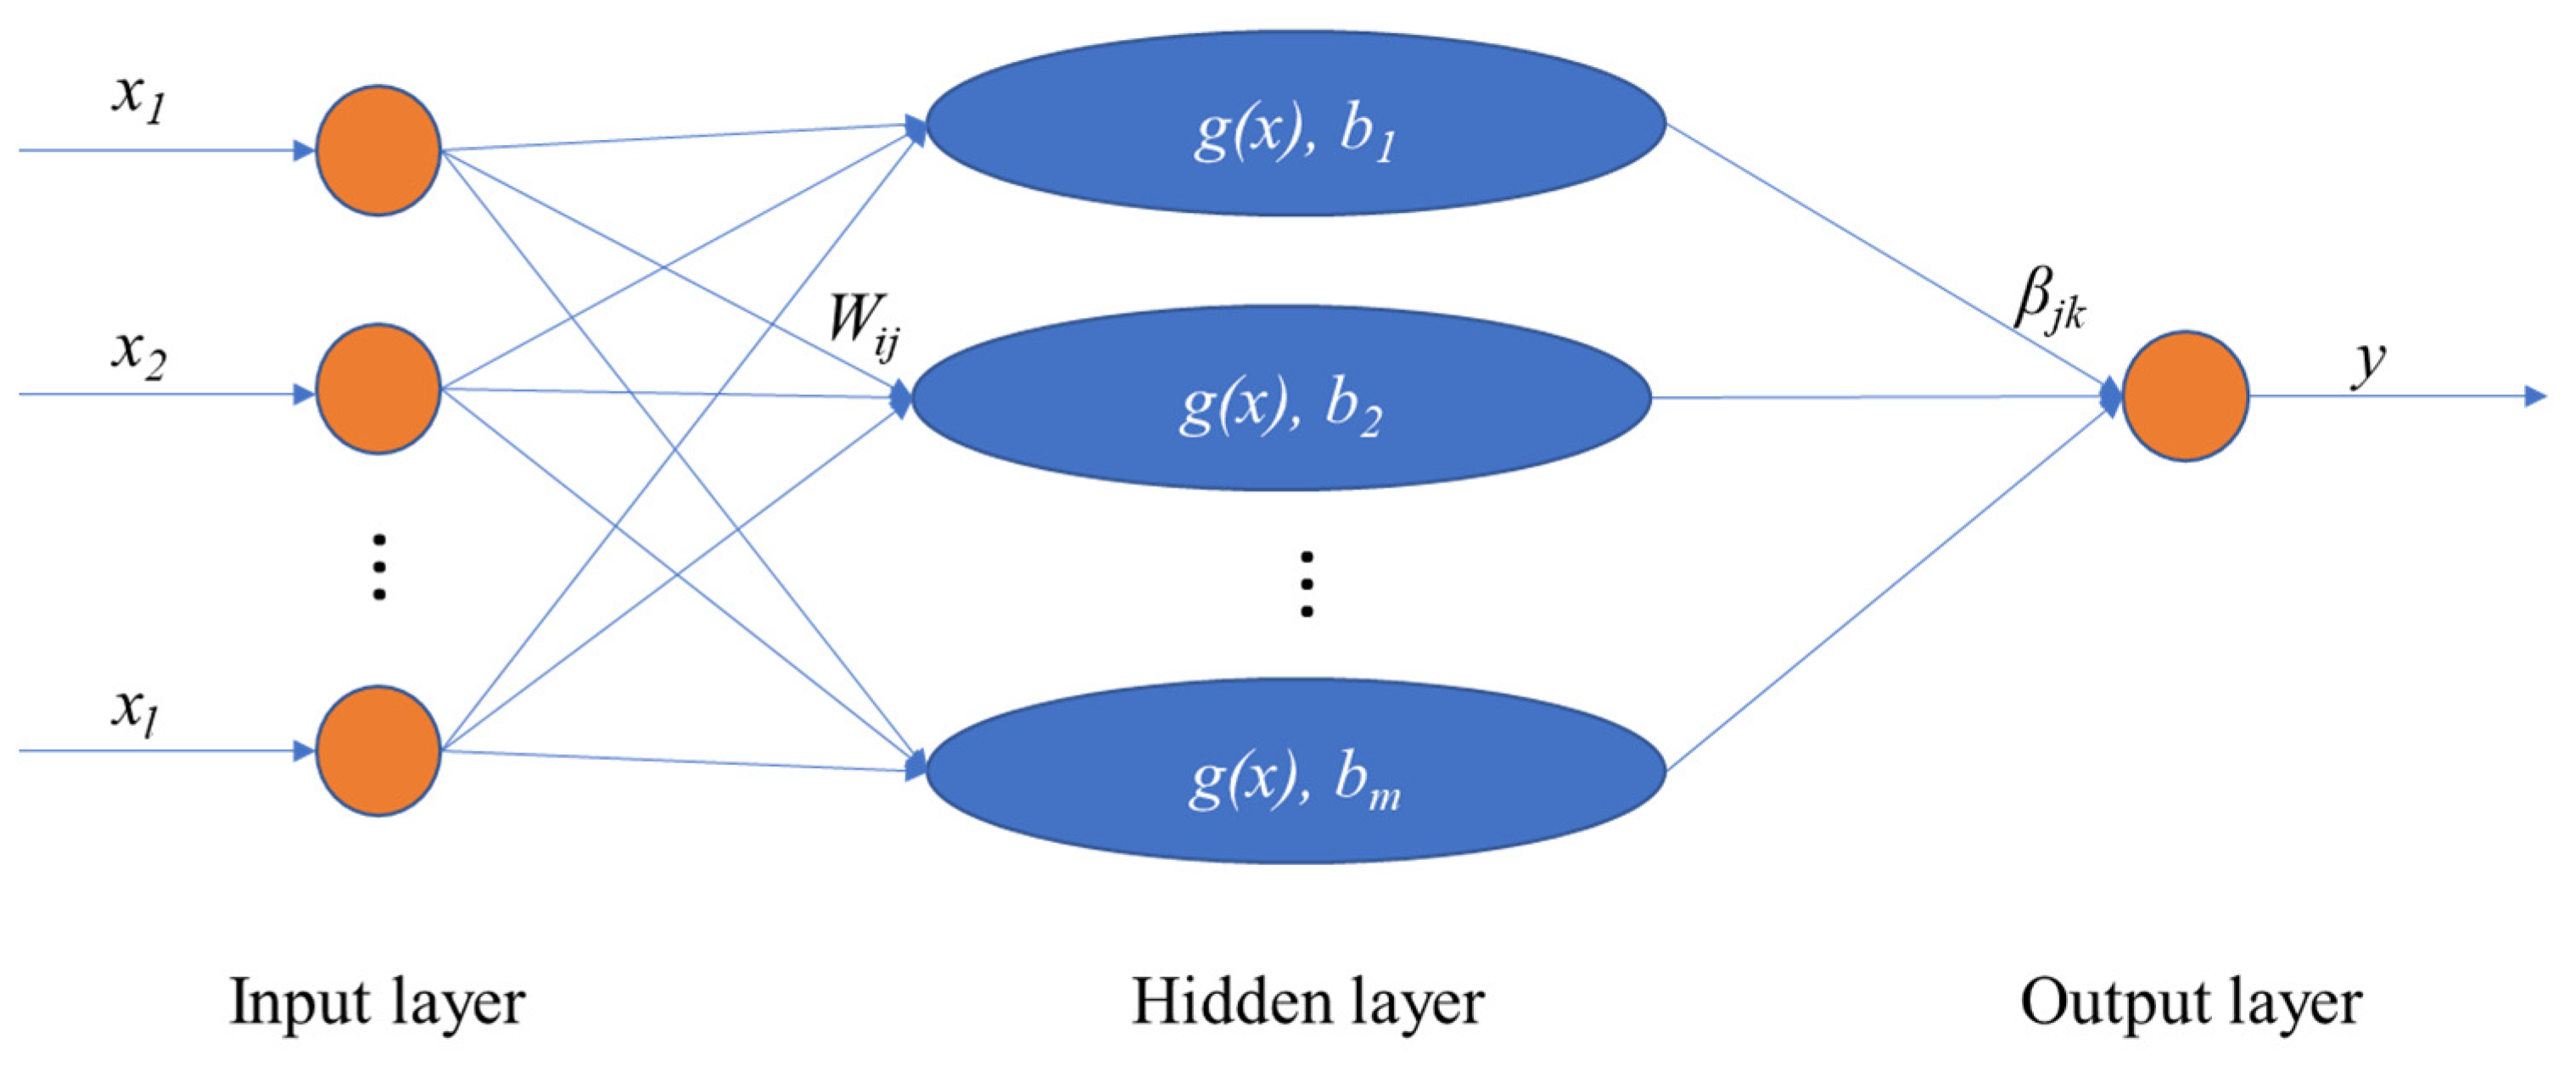
2.2. Theory of Extreme Learning Machine (ELM)

The ELM is a novel evolutionary machine learning technique coined by Huang et al. [27]. It overcomes the shortcomings of traditional neural networks, particularly, slow learning rate and easy to fall into local minima [28]. In the learning procedure, the weights between the input layer and the hidden layer as well as the bias between different hidden layer neurons can be randomly generated without iterative adjustments, and then the optimal global solution can be gained by setting the number of hidden layer neurons [29,30]. Figure 1 described the network structure of ELM, including three layers which are input, hidden, and output layers, respectively. The input layer has l input variables (x1, x2, …, xl,), and m neurons in the hidden layer; the output layer has one desired variable (y). The specific steps of the ELM algorithm are expressed as follows:
Randomly generated the input weights (wij) between the input layer and hidden layer and the bias (bm) between hidden neurons;
Confirm the number of hidden layer neurons and activation function g(x) and calculate the connection weights (βjk) for the hidden and output layer as well as the output matrix of hidden layer H (Equation (1)). The connection weights matrix is β (Equation (2)), and the desired matrix notes y. Then the ELM network with m neurons can be expressed as Equation (3)
H   =   ( w 1 , , w m , x 1 , , x l , b 1 , , b m )   = [ g ( w 1 × x 1 + b 1 ) ,   g ( w 2 × x 1 + b 2 )   g ( w m × x 1 + b m )                                                               g ( w 1 × x l + b 1 ) ,   g ( w 2 × x 1 + b 2 )   g ( w m × x l + b m ) ] l × m
B = [ β 1 T , , β l T ]
Hβ = y
Calculate the output weights matrix ( β ^ ) of output layer: β ^ = H + y ,   where H + is the Moore–Penrose generalized inverse matrix of H.

2.3. Description of Selected Descriptors and Data Analysis

It is known that the silage and grain maize have different growing seasons in the Czech Republic, where the growing season for silage maize contains four months, from May to August, while five months for grain maize between May and September. Therefore, the climate indexes of each month in their growing seasons were employed to build predictive models. The average values of each month were calculated by the collected data of daily average, maximum and minimum air temperature, relative humidity, daily total precipitation, duration of sunshine. As a result, seven types of descriptors, namely water deficit, precipitation, average temperature (Temp. Mean), maximal temperature (Temp. Max), minimal temperature (Temp. Min), humidity, and sunshine of each month during the growing seasons of silage and grain maize were obtained. In summary, the descriptors for modeling the silage and grain maize yields are 28 and 35, respectively.
The specific data information of the climate indexes and maize yields were given in Supporting Information 2. The first dataset (dataset 1, Table S1) for silage maize includes 153 data points. In contrast, there are 152 samples in the second dataset (dataset 2, Table S2) for grain maize as the observed yield data of South Bohemia in 2015 is missing. Besides, six data points about the grain maize yields are less than 2 t/ha, probably unreasonable. Hence, the unreliable values were removed, and the remaining data points in the second dataset were assembled as the third dataset (dataset 3, Table S3) for building models. The datasets were arbitrarily divided into two subsets, containing the training set (80%) for modeling and the test set (20%) for validating, respectively.

2.4. Model Validation

To assess the performance of the predictive models, the metrics of determination coefficient (R2), relative deviation (RD), average absolute relative deviation (AARD), and the root mean square error (RMSE) are employed. The equations of them are presented as follows:
R 2 = i = 1 N p ( y i p r e y ¯ m ) 2 i = 1 N p ( y i p r e y i o b s ) 2 i = 1 N p ( y i p r e y ¯ m ) 2
AARD   ( % ) = 100 × i = 1 N p | y i p r e y i o b s y i o b s | / N p
RD   ( % ) = 100 × y i p r e y i o b s y i e x p
RMSE = i = 1 N p ( y i p r e y i o b s ) 2 N p
where y i p r e means the predicted yield of corn, while y i o b s notes the observed yield of corn; y ¯ m stands for the average data of the training or test dataset, and Np is the sample number of the corresponding dataset.

2.5. Software

The SPSS software performed the significance of climate parameters on silage and grain maize yields based on the multiple linear regression (MLR) input method. The software Matlab 2018a was utilized to build and train ELM models and calculate the application domain of the developed models. The significant level was set as Sig. < 0.05.

3. Results and Discussion

3.1. Impact Analysis of Descriptors

As mentioned in 2.5, the input method of MLR was utilized to analyze the influence of climate factors on silage and grain maize yields. The “t” and “Sig.” values were calculated and listed in Table 1, Table 2 and Table 3. The significance of the climate parameter grows as the increasing absolute values of t and the declining Sig. values. It should be noted that the “-” in front of t values symbolize the corresponding parameters that negatively influence the maize yields and vice versa.
The descriptor of sunshine in June (Sig. = 0.004) is the most important for the silage maize yield in Czechia, and then the sun of May and July and water deficit of July with the Sig. < 0.05 are also of great significance (Table 1). The minimum temperature (Temp. Min) in September and the water deficit in May are the first and second most significant factors for the grain maize yield in Czechia (Table 2 and Table 3), while the following crucial descriptors (Sig. < 0.05) are different since the datasets have a bit different.

3.1.1. Temperature

Temperature is an essential factor influencing maize yield. As shown in Table 1, Temp. Max of May and June and the Temp. Min of July with lower Sig. values and higher absolute t values are more crucial than other temperature descriptors for the silage maize. However, for the grain maize, the enormously influential temperature indexes include Temp. Min of September (Sig. = 0.002), July (Sig. = 0.110), and May (Sig. = 0.110). When it turns to the third dataset, the three most crucial factors for grain maize are the Temp. Min of September (Sig. = 0.001) and Temp. Max of May (Sig. = 0.056) and July (Sig. = 0.057). Overall, the Temp. Max of May is significant for both silage and grain maize, but it is negative for silage and positive for grain maize. The most critical temperature factor is Temp. Min of July for silage maize while that is Temp. Min of September for grain maize. Generally, the maize yields typically decrease with increasing temperature because of the shorter phenological phases [31]. In United State, Hoffman et al. [32] reported that maize yield decrease sharply when maximum temperature exceed 29 °C.

3.1.2. Precipitation

Precipitation is another critical factor influencing the maize yield. According to the t and Sig. values of precipitation parameters from Table 1, Table 2 and Table 3, it has a more significant influence on grain maize than silage maize. It also can be observed that the precipitation of May and September has a positive influence on grain maize, but the precipitation of other months presents a negative impact. Besides, the greatest precipitation month is May (Sig. = 0.040 or 0.077) for grain maize, but that is July (Sig. = 0.444) for silage maize. In principle, the effect of precipitation may be either positive or negative. A positive correlation may happen if precipitation reduces the existing water stress, and a negative correlation maybe because of the intensified nitrogen leaching by the excessive precipitation [31]. Meanwhile, Fan et al. [26] also reported a negative effect of precipitation on maize yield in Mianyang, China.

3.1.3. Water Deficit

Compared with the water deficit of other months, the water deficit of July has the most significant impact on silage maize yield. Still, the water deficit of May is the most influential parameter for the grain maize. Based on the t values of water deficit descriptors, we can deduce that the water deficit in May has a positive influence while June, July, and August show a converse effect. As for grain maize, the water deficit of May and June is positive, while that of July, August, and September is negative. In Peru, Laudien et al. found that a higher water availability of 77 mm in the growing season would have regionally different effects, ranging from an increase of 20% to a decrease of 17% in maize yields [33].

3.1.4. Sunshine

Sunshine hours are significant for crop growth. In our study, the sunshine hours of May with Sig. = 0.004 are highly significant for silage maize yields, and then the sunshine hours of June (Sig. = 0.033) are also quite influential (Table 1, Table 2 and Table 3). In terms of grain maize yields, the sunshine hour of August with Sig.= 0.059 or 0.013 is still a crucial parameter, while others are relatively less important. It has been reported that long hours of sunshine in spring (April to June) increased maize yield in Czechia [34].

3.1.5. Humidity

The humidity of June has the lowest Sig. value for both silage and grain maize among their whole growth seasons (Table 1, Table 2 and Table 3). Thus, the descriptor of June’s humidity has greater importance for them than other months. This is consistent with a previous report on maize yield response to climate using ML (Random Forest) in the US, in which maize yield showed a negative response to low atmospheric humidity during the critical phase that encompasses flowering [32].

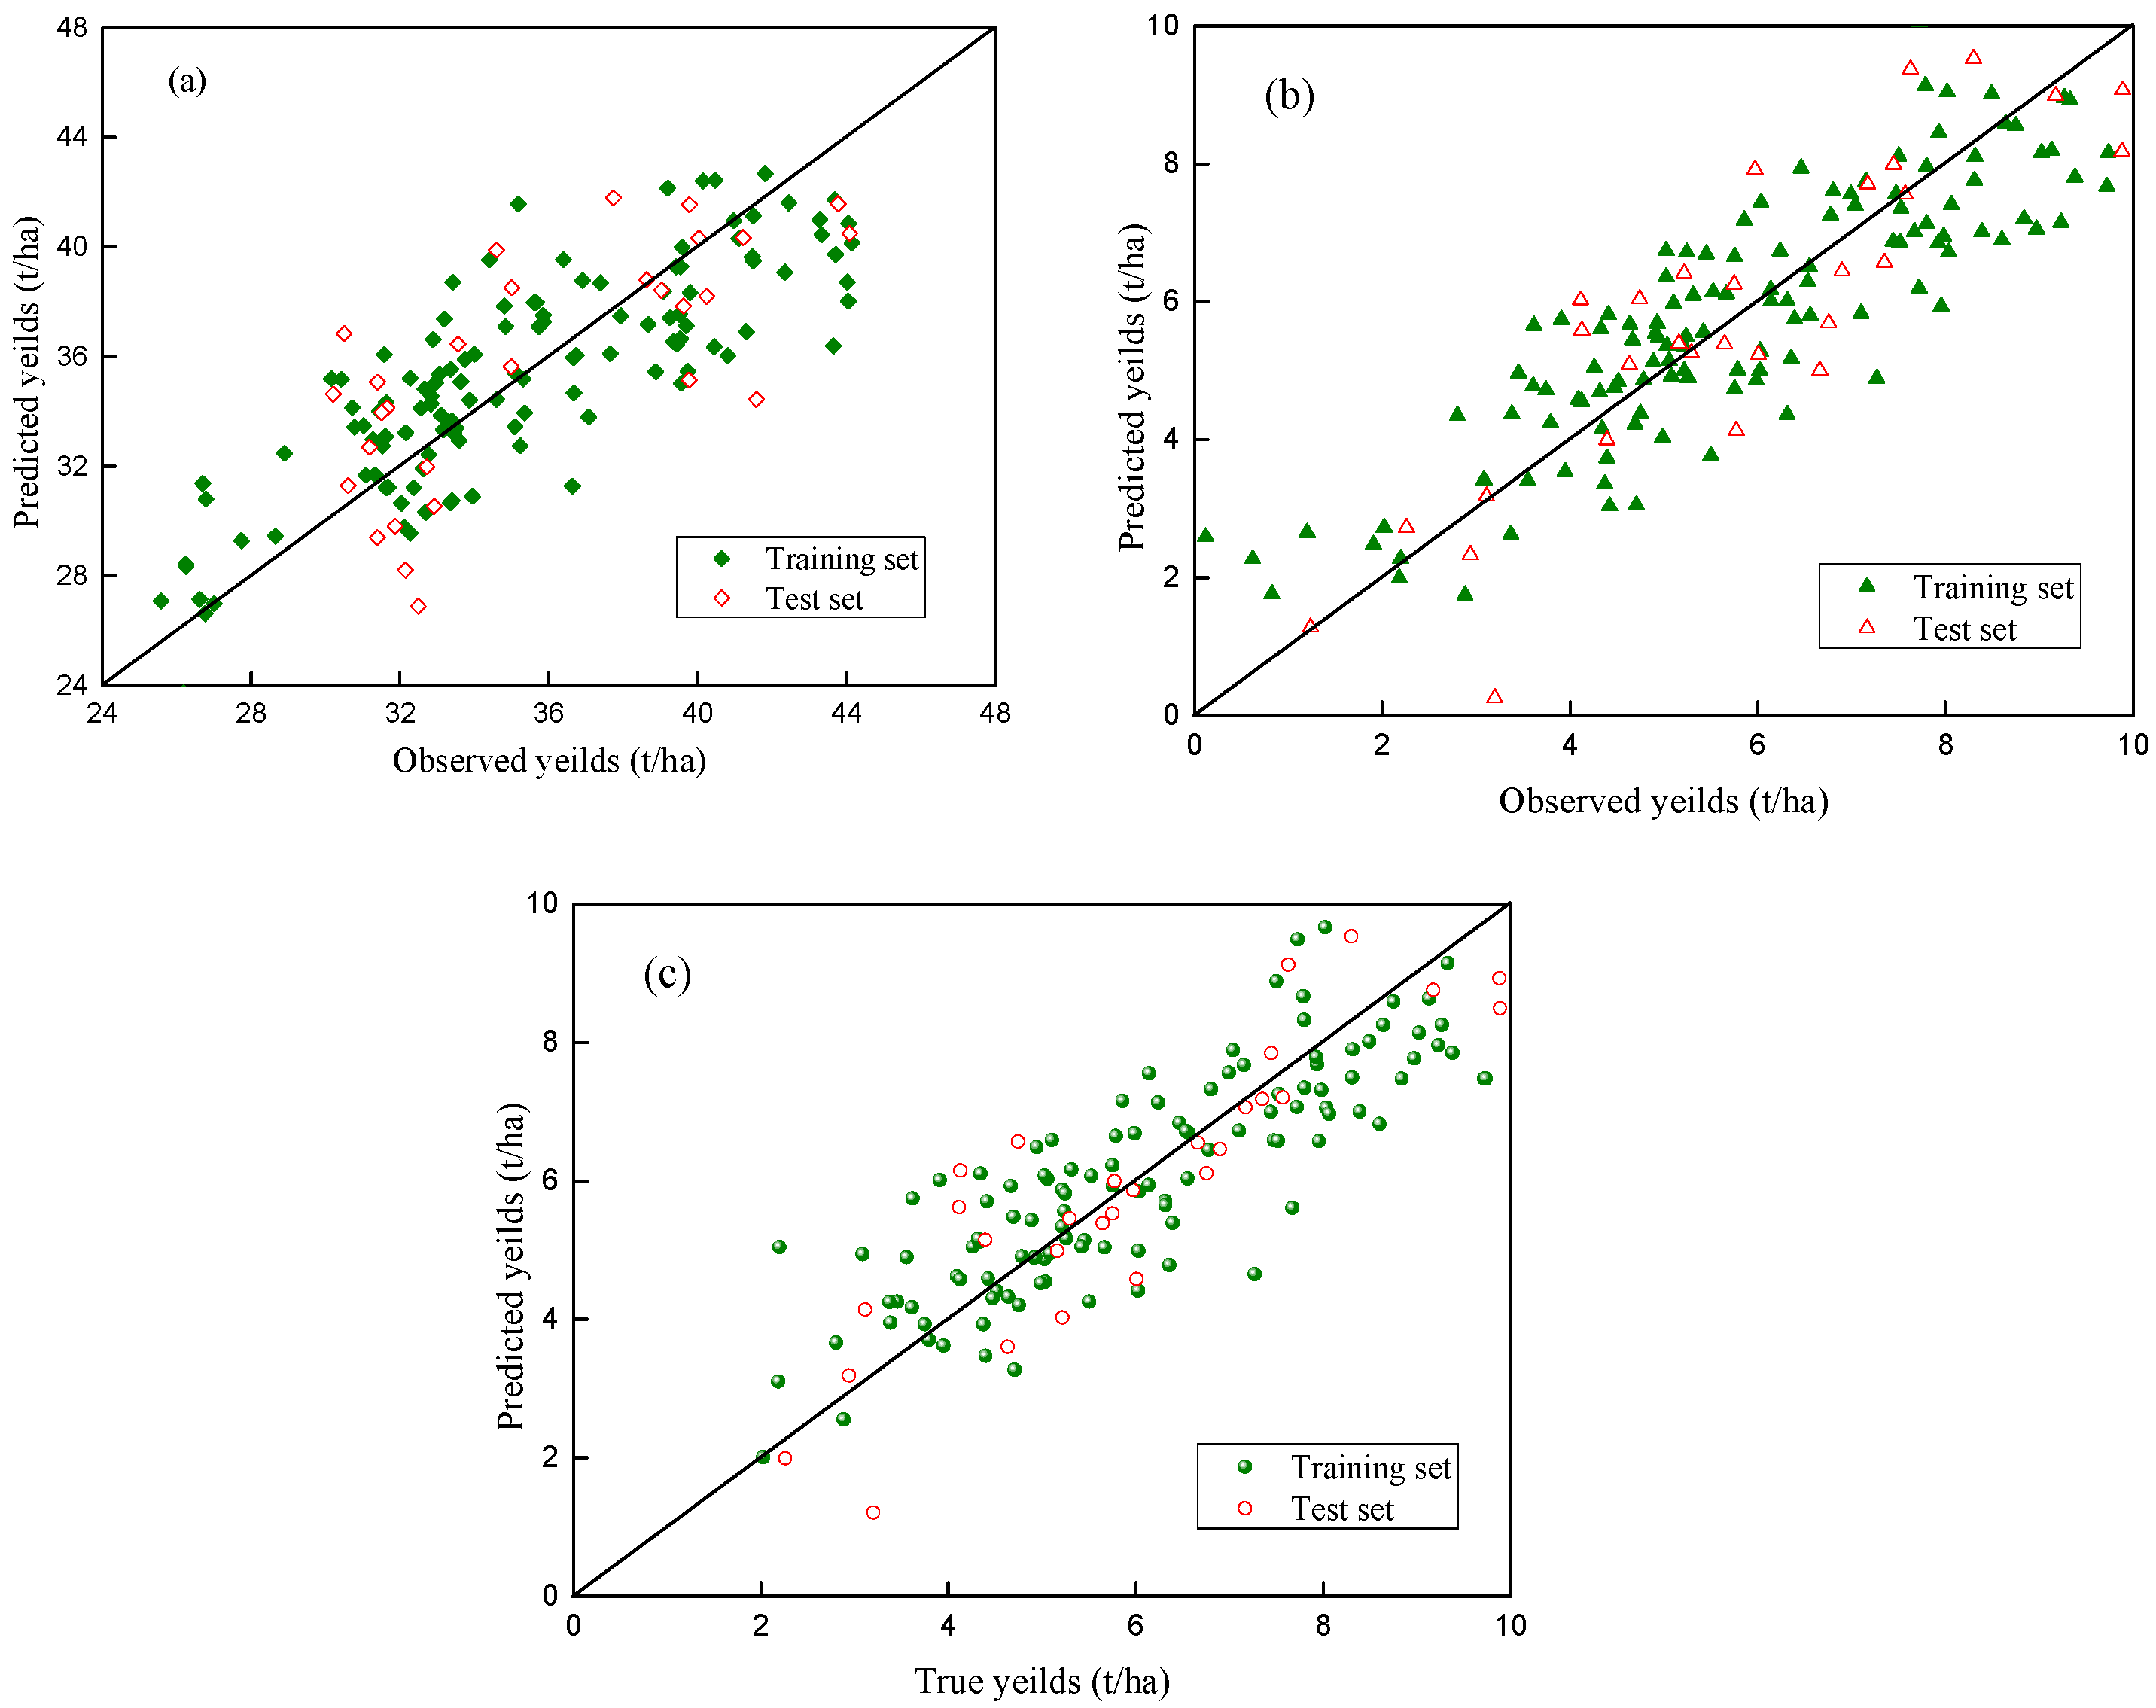
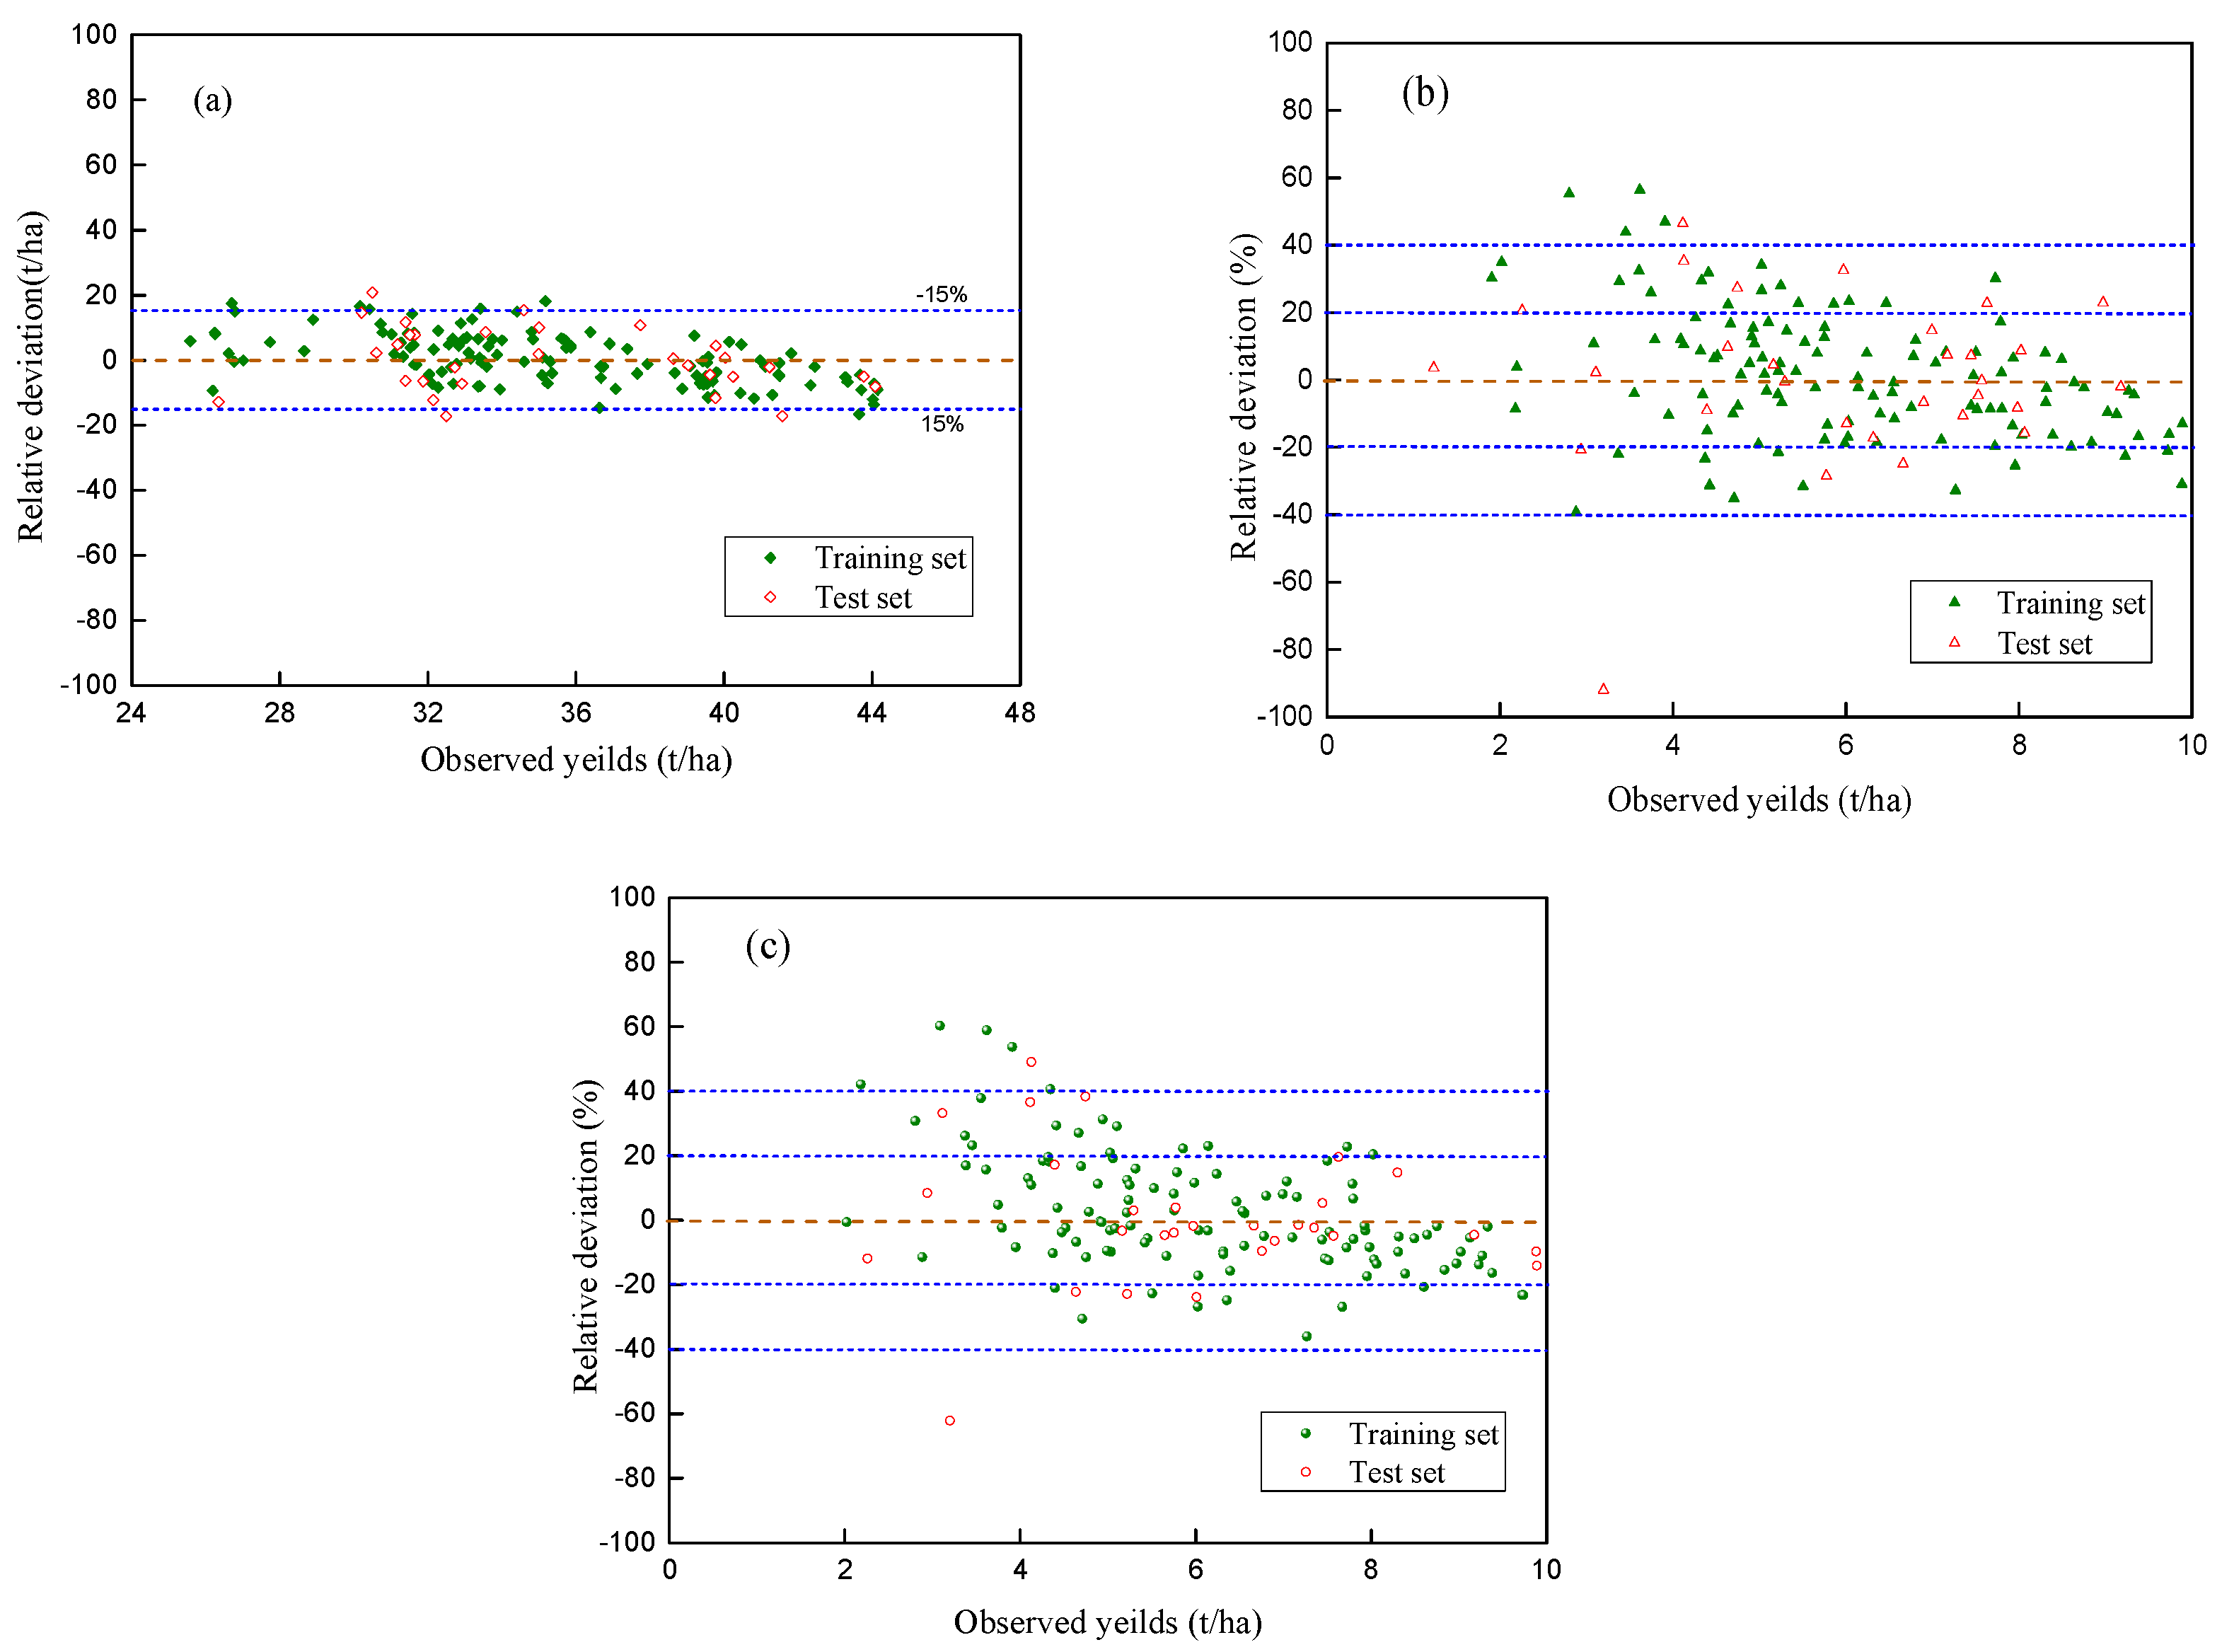
3.2. Extreme Learning Machine (ELM) Model Establishment

To develop effective models in this work, the collected data of climate indices during the growing season of silage and grain maize were used as the input descriptors as previously mentioned in the Section 2.3. The number of hidden neurons m was set as 40, and activation function g(x) was determined as “sigmoid” for all the training datasets. Then three ELM models were constructed to predict silage and grain maize in Czechia, and the test sets were used to verify the properties of the models.
Figure 2a shows the predicted yields compared with observed yields for silage maize. Figure 2b,c show the predicted yields compared with observed yields for grain maize using different datasets. The data points located in the vicinity of the diagonal demonstrate the excellent performance of the proposed models.
Figure 3a shows the RD% of ELM1 for silage maize in different regions of Czechia, with 93.4% of RD% values for the data points in the range of ±15%. Only one predictive data has the RD value of over 20%, which is 20.79% for the maize yield from Moravian-Silesian in 2004. The RD% values of ELM2 and grain maize in different regions of Czechia are presented in Figure 3b,c. As for the ELM2 model, around 69.1% of RD values are between −20% and 20%, and the percent of RD within ±40% is 93.4%. However, there are four RD% exceed 100%, which corresponds to the maize yields from Liberec in 2005 (113.8%), from Vysočina in 2015 (2062.2%), from Plzen in 2015 (267.5%), from South Bohemia in 2013 (121.0%). Nevertheless, after removing the yields below 2 t/ha from the training and test datasets, the percent of RD in the range of ±20% and ±40% are 74.7% and 94.5%, respectively. Additionally, there was only one data from Plzen in 2013 with the RD over 100%, which is 129.8%.
It can be observed that the AARD value of the ELM1 model for the total datasets is 6.565%, illustrating the incredible precision of the model for predicting silage maize yields (Table 4). The AARD% values of the ELM3 model for different datasets are lower than those of the ELM2 model (Table 4). Therefore, the accuracy of the ELM3 model is better than the ELM2 model for grain maize. Our models are comparable regarding accuracy and stability with other ML algorithms applied for maize prediction in the US, in which the best algorithm and inputs improves the prediction accuracy by 5% when compared to a baseline statistical model (Lasso) using only basic climatic and satellite observations [35]. Besides, all the values of RMSE for various models in our study are relatively low (0.981–3.307%), which performs better than other ML algorithms (random forests) used for maize yield prediction with an RMSE of 14% [13]. The determination coefficient (R2) values in our study are above 0.7 (Table 4), this is comparable to the R2 of 0.77 using Bayesian Neural Network for the late-season prediction across the U.S. Corn Belt in testing years 2010–2019 [36], and R2 of 0.78 using boosted regression tree model to predicting life cycle global warming on corn production under four emissions scenarios for years 2022–2100 [37].

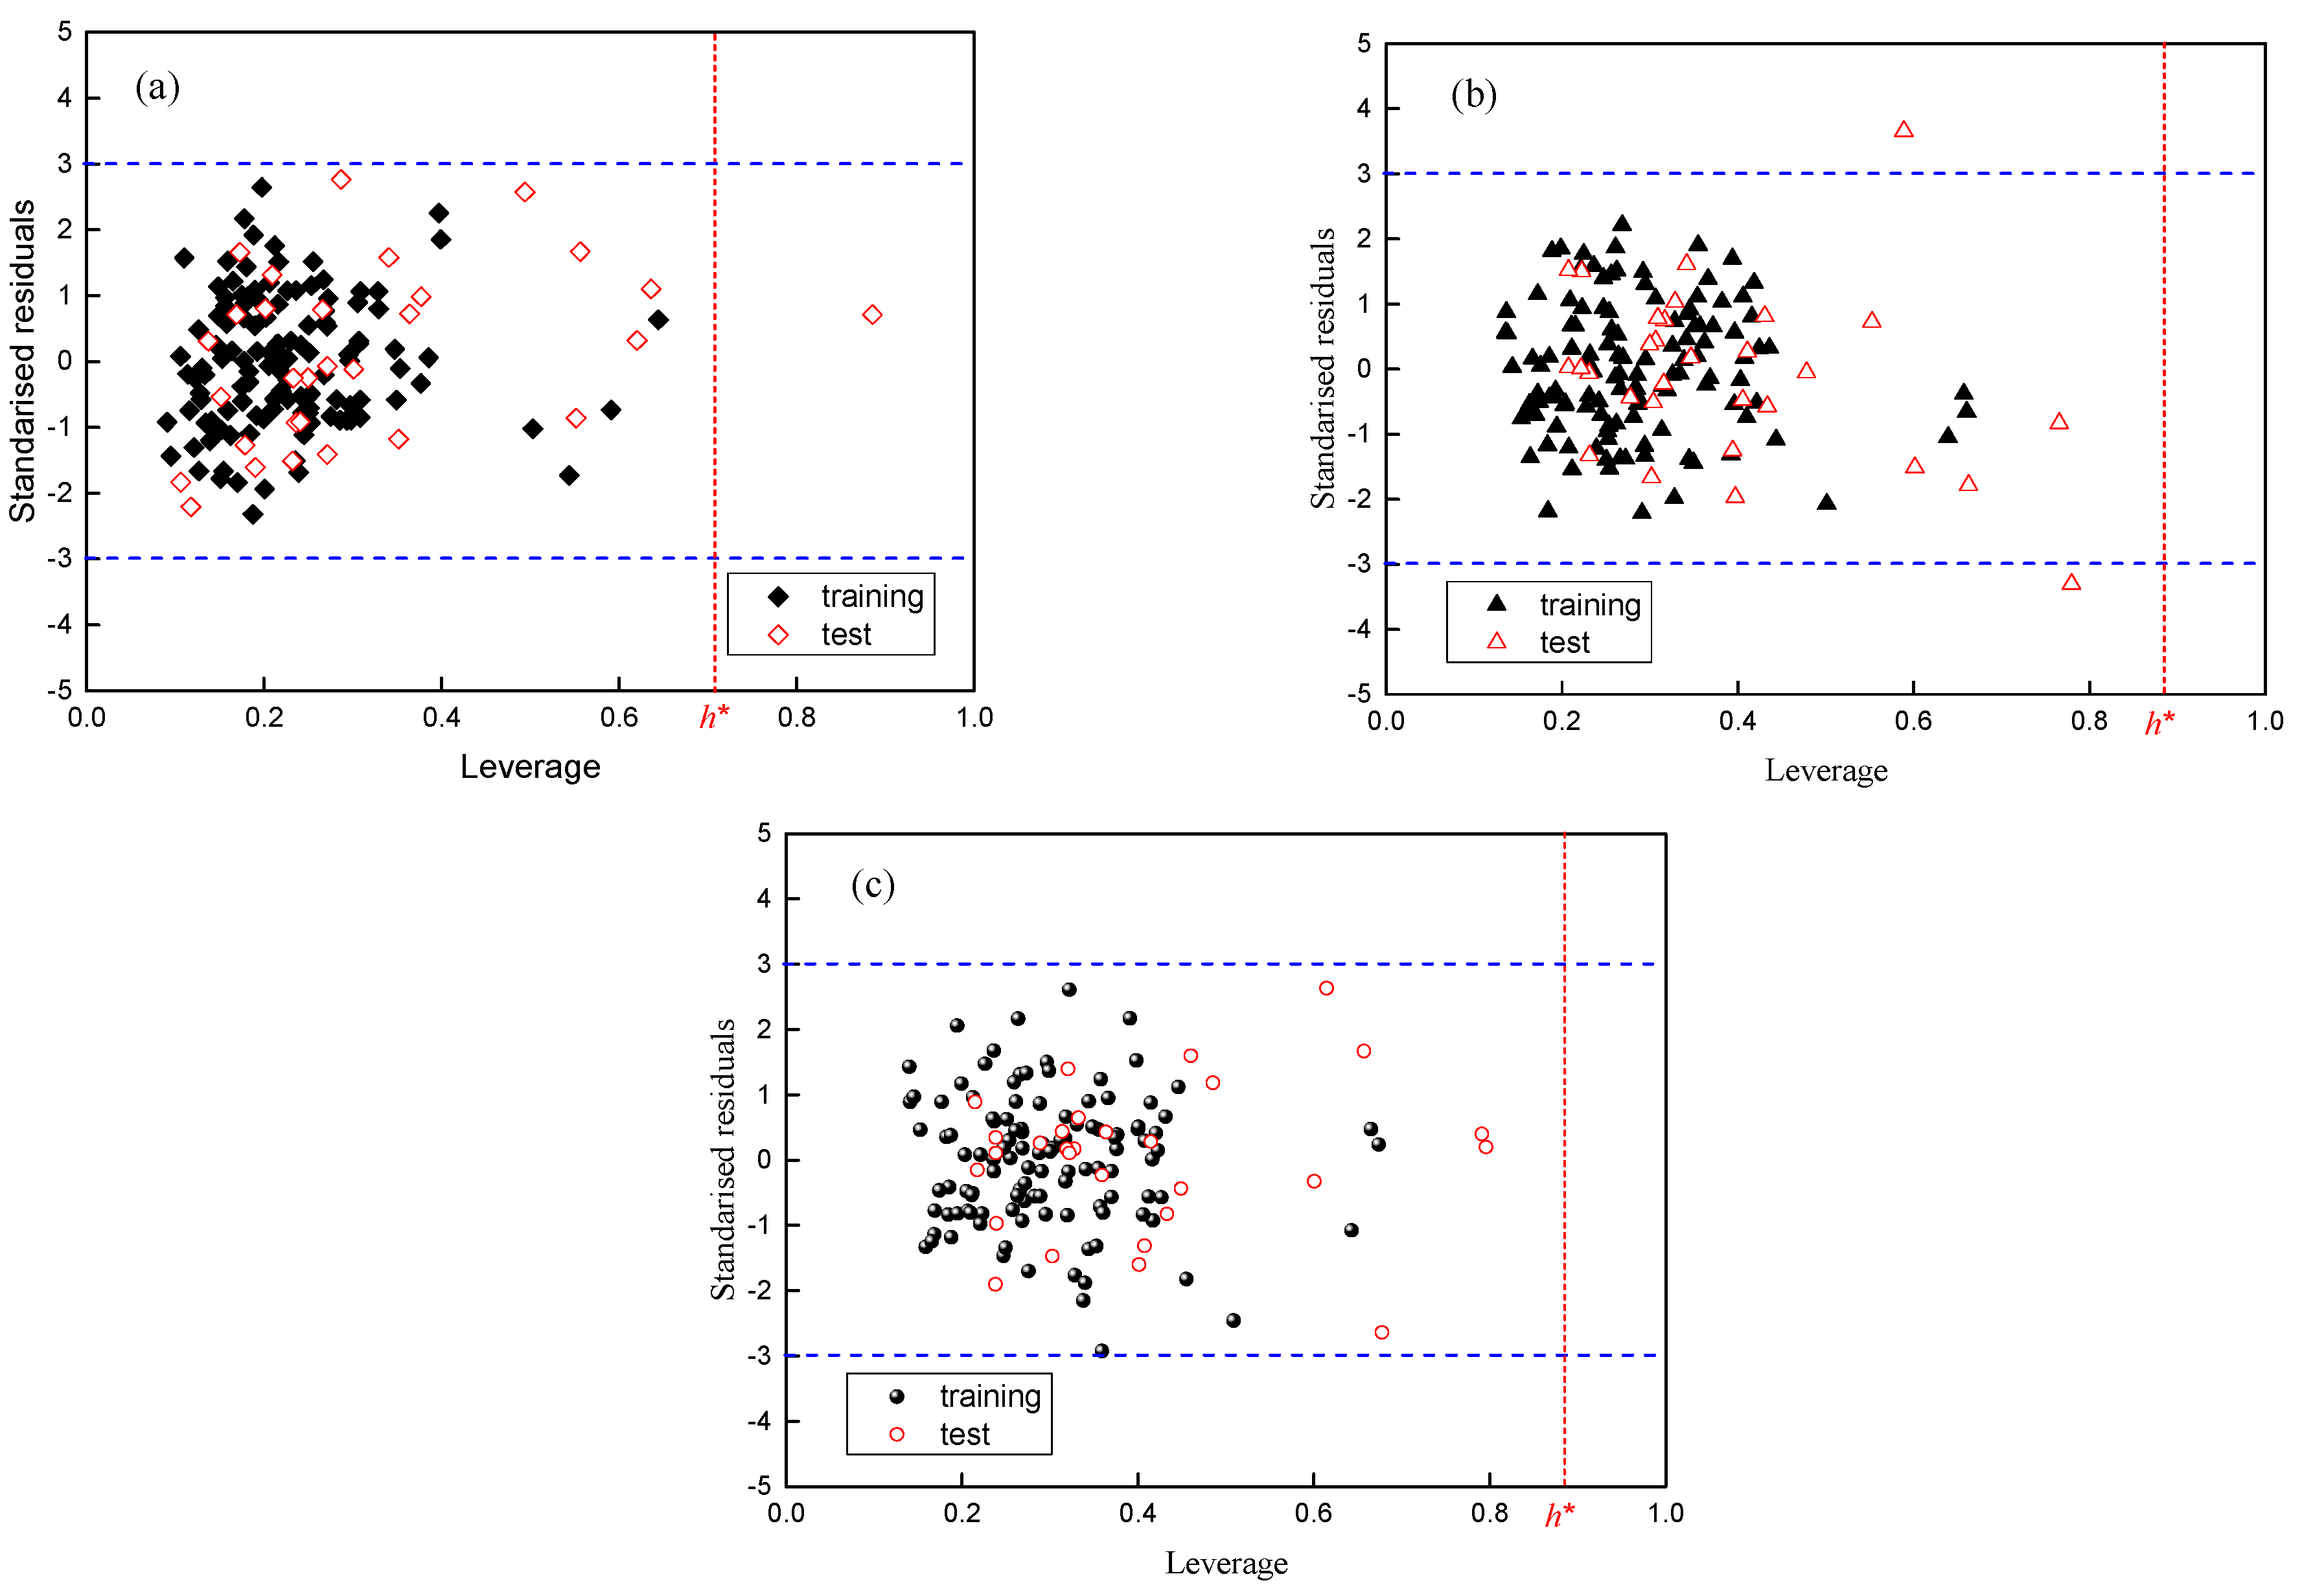
3.3. The Application Domain (AD) of ELM Models

Defining the application domain of a model is essential to verify individual data, which may be far from the majority of data in a dataset [38]. A well-known approach to detect the outlier of a model is the leverage approach presented by William plot, consisting of the standardized residual (σ) as y-axis and leverage value (h) as the x-axis. The leverage values are obtained through Hat matrix (H) expressed as follows (Equation (8)) [39,40,41]:
H = X ( X t X ) 1 X t
where X is the input descriptor matrix of the training set and t means the transpose matrix. The critical leverage value is described as h* = 3 p/n, where p is the number of input variables plus one and n stands for the number of training samples. The points located in the domain of 0 ≤ h ≤ h* and −3 ≤ σ ≤ 3 illustrate that the predictions locate in the application domain. The points located in the range of h* ≤ h and −3 ≤ σ ≤ 3 can be considered the points outside the AD of the implemented model. Nevertheless, the points situated in the domain of 3 ≤ σ and σ≤ −3 are regarded as outliers of the predictive model [42].
Figure 4a shows that all the predictions of the ELM1 model for silage maize yield are reliable data though there is one point in the range of Good High Leverage. As for the ELM2 model (Figure 4b), two outliers are probably attributed to the doubtful data [42,43], but the majority of the data points are still in the AD of the model demonstrating that the model is valid. It can be seen from Figure 4c that all the points are located in the AD of the ELM3 model. Therefore, the ELM3 model for grain maize yields has better performance than the ELM3 model for predicting the grain maize in Czechia.

3.4. Prediction of Maize Yield under Various Climate Factors

By analyzing the climate descriptors in Section 3.3, the temperature and water deficit can be considered the most critical parameters for the silage and grain maize yields. To predict the silage and grain maize using our models, we first calculated the average of different climate parameters from 2002 to 2018; then under the precondition that the average values of other parameters remain the same, the values of temperature and water deficit were adjusted. Specifically, two groups of parameters, one is water deficit (05) and Temp. Max (05) and the other is water deficit (07) and Temp. Min (07) was designed to forecast the maize yields by ELM1 and ELM2 models. Specifically, 11 data points (including the average) were taken within the range of plus or minus one degree of the average temperature, and 11 data points were used within the range of plus or minus 50 of the average water deficit. Finally, 242 new climate data points as input descriptors are used to predict the silage and grain maize yields by the two proposed models separately, and the detailed results were provided in the supplementary information (Tables S4 and S5).
It should be noticed that although the developed models are nonlinear, i.e., the relationships between the grain maize yields and the climate factors are nonlinear, the increased or decreased rate can be obtained. For the forecasted grain maize yields, approximately 0.356 t/ha will be decreased when the water deficit (07) value adds by 10, and around 0.137 t/ha will be dropped when the Temp. Max (05) rises by 0.2 °C, with a growing proportion of −1.002% and −0.389%, respectively. In contrast, when the water deficit (05) value grows by 10 and the Temp. Min (07) by 0.2 °C, the maize yields of the silage will add about 0.510 t/ha and 0.181 t/ha, respectively, and the growth rates are 1.467% and 0.511%, respectively. Regardless of the new grain maize yields predicted by the ELM2 model, every 10 mm increase of water deficit (05) and water deficit (07) will cause a roughly 2.995% (0.194 t/ha) and −0.962% (−0.059 t/ha) increment, respectively. On the other hand, when the Temp. Max (05) and Temp. Min (07) go up by 0.2 °C, the yields increase rate of grain maize will be around 0.527% (0.034 t/ha) and 0.277% (0.018 t/ha). Obviously, water deficit (05) has a greater influence on grain maize yields than silage maize yields, but the Temp. Min (07) is more influential for silage than grain maize yields. In the case of Temp. Max (05) increase 2 °C, silage yield will decrease 1.367 t/ha and is about 3.826% loss, while grain yield will increase 0.337 t/ha and is about 5.394% increase. This means our results on maize yield considering climate change by ELMs is not so pessimistic compared to other models (combined empirical models of maize production with future warming scenarios) that maize yields are foreseen to decline by 20–40% and 40–60% with a temperature increase of 2 and 4 °C, respectively [4]. Furthermore, Crane-Droesch found that negative impacts of climate change on corn yield by semiparametric neural networks (one of ML methods), but less severe than impacts projected using classical statistical methods, especially in warmest regions [22]. Fan et al. found −0.58% to −0.75% maize yield by precipitation [26]. However, Su et al. estimated that under future climate conditions, the performance of conservation agriculture is expected to mostly increase for maize over its tropical areas [44]. In sub-Saharan Africa, technology could steadily increase maize yields by about 1% (13 kg/ha) per year while increasing temperatures decreased yields by 0.8% (10 kg/ha) per °C. That means although we should expect increases in future crop yields due to improving technology, the potential yields could be progressively reduced due to warmer and drier climates [23].

4. Conclusions

The current work collected the climate data of nine regions in Czechia between 2002 and 2018, and the influences of climate indexes on the silage and grain maize yields in Czechia were analyzed. Results show that the most significant two climate parameters are sunshine in June and water deficit in July for the silage maize yield, while those are the Temp. Min of September and the water deficit in May for grain maize yield in Czechia. There ELM models were obtained to predict the silage (ELM1) and grain (ELM2 and ELM3) maize yields in Czechia. The R2 values of the models for the total datasets are 0.641, 0.741, and 0.716, while the AARD values are 6.565%, 32.148%, and 15.139%, respectively, presenting their robustness and accuracy. The application domain was also defined to detect the reliability of the predictions. The majority of predictions are situated in the AD of models showing the reliability of these models. Based on our ELM models, silage yield will decrease by 1.367 t/ha (3.8% loss), and grain yield will increase by 0.337 t/ha (5.4% increase) when the max temperature in May increases by 2 °C. In conclusion, the proposed models show a potential application for predicting maize yield.

Supplementary Materials

The following are available online at https://0-www-mdpi-com.brum.beds.ac.uk/article/10.3390/agronomy11112344/s1, calculation of water deficit; Table S1: The predicted and observed yields of silage maize in different regions of Czechia in 2002–2018, Table S2 The predicted and observed yields of grain maize in different regions of Czechia in 2002–2018, Table S3 The predicted and observed yields of grain maize in different regions of Czechia in 2002–2018, Table S4 The newly predictive yields of silage maize in different regions of Czechia by ELM1 model, Table S5 The newly predictive yeilds of grain maize in different regions of Czechia by ELM2 model.

Author Contributions

Conceptualization, Y.G.; methodology, M.M., K.M. (Karel Malec) and K.M. (Kamil Maitah); software, Y.G.; validation, Z.G. and L.S.; formal analysis, Y.G. and K.M. (Karel Malec); investigation, L.P., K.M. (Kamil Maitah), V.B. and J.M.; resources, M.M. and K.M. (Kamil Maitah); data curation, K.M. (Karel Malec), Z.G., V.B. and K.M. (Kamil Maitah); writing—original draft Y.G., M.M. and K.M. (Karel Malec), writing—review and editing, Y.G., M.M. and K.M. (Karel Malec); supervision, M.M.; project administration, M.M. and K.M. (Karel Malec); funding acquisition, M.M. All authors have read and agreed to the published version of the manuscript.

Funding

This research was funded by the Internal grant agency (IGA) of the Faculty of Economics and Management, Czech University of Life Sciences Prague, grant no. 2019B0011.

Institutional Review Board Statement

Not applicable.

Informed Consent Statement

Not applicable.

Data Availability Statement

Acknowledgments

This work was supported by the Internal grant agency (IGA) of the Faculty of Economics and Management, Czech University of Life Sciences Prague, grant no. 2019B0011 “Economic analysis of water balance of the current agricultural commodities production mix in the Czech Republic” (Ekonomická analýza vodní bilance stávajícího produkčního mixu zemědělských komodit v ČR).

Conflicts of Interest

The authors declare no conflict of interest.

References

  1. NOAA. State of the Climate: Global Climate Report for September 2019. 2019. Available online: https://www.ncdc.noaa.gov/sotc/global/201907 (accessed on 1 November 2021).
  2. Marvel, K.; Bonfils, C. Identifying external influences on global precipitation. Proc. Natl. Acad. Sci. USA 2013, 110, 19301–19306. [Google Scholar] [CrossRef] [PubMed] [Green Version]
  3. Hatfield, J.L.; Dold, C. Climate change impacts on corn phenology and productivity. In Corn-Production and Human Health in Changing Climate; BoD–Books on Demand: Norderstedt, Germany, 2018. [Google Scholar]
  4. Tigchelaar, M.; Battisti, D.S.; Naylor, R.L.; Ray, D.K. Future warming increases probability of globally synchronized maize production shocks. Proc. Natl. Acad. Sci. USA 2018, 115, 6644–6649. [Google Scholar] [CrossRef] [PubMed] [Green Version]
  5. Zampieri, M.; Ceglar, A.; Dentener, F.; Dosio, A.; Naumann, G.; van den Berg, M.; Toreti, A. When will current climate extremes affecting maize production become the norm? Earths Future 2019, 7, 113–122. [Google Scholar] [CrossRef]
  6. Pandith, V.; Kour, H.; Singh, S.; Manhas, J.; Sharma, V. Performance evaluation of machine learning techniques for mustard crop yield prediction from soil analysis. J. Sci. Res. 2020, 64, 394–398. [Google Scholar] [CrossRef]
  7. Witten, I.H.; Frank, E.; Hall, M.A.; Pal, C.J. Data Mining: Practical Machine Learning Tools and Techniques, 3rd ed.; Morgan Kaufmann Publishers: Burlington, MA, USA, 2011; ISBN 9780128042915. [Google Scholar]
  8. Cai, Y.; Guan, K.; Peng, J.; Wang, S.; Seifert, C.; Wardlow, B.; Li, Z. A high-performance and in-season classification system of field-level crop types using time-series Landsat data and a machine learning approach. Remote Sens. Environ. 2018, 210, 35–47. [Google Scholar] [CrossRef]
  9. Cai, Y.; Guan, K.; Lobell, D.; Potgieter, A.B.; Wang, S.; Peng, J.; Xu, T.; Asseng, S.; Zhang, Y.; You, L.; et al. Integrating satellite and climate data to predict wheat yield in Australia using machine learning approaches. Agric. For. Meteorol. 2019, 274, 144–159. [Google Scholar] [CrossRef]
  10. Han, J.; Zhang, Z.; Cao, J.; Luo, Y.; Zhang, L.; Li, Z.; Zhang, J. Prediction of winter wheat yield based on multi-source data and machine learning in China. Remote Sens. 2020, 12, 236. [Google Scholar] [CrossRef] [Green Version]
  11. Priya, P.; Muthaiah, U.; Balamurugan, M. Predicting yield of the crop using machine learning algorithms. Int. J. Eng. Sci. Res. Technol. 2018, 7, 1–7. [Google Scholar]
  12. Zhang, L.; Zhang, Z.; Luo, Y.; Cao, J.; Tao, F. Combining optical, fluorescence, thermal satellite, and environmental data to predict county-level maize yield in China using machine learning approaches. Remote Sens. 2020, 12, 21. [Google Scholar] [CrossRef] [Green Version]
  13. Shahhosseini, M.; Martinez-Feria, R.A.; Hu, G.; Archontoulis, S.V. Maize yield and nitrate loss prediction with machine learning algorithms. Environ. Res. Lett. 2019, 14, 124026. [Google Scholar] [CrossRef] [Green Version]
  14. Singh, V.; Sarwar, A.; Sharma, V. Analysis of soil and prediction of crop yield (Rice) using Machine Learning approach. Int. J. Adv. Res. Comput. Sci. 2017, 8, 1254–1259. [Google Scholar]
  15. Panda, S.S.; Ames, D.P.; Panigrahi, S. Application of vegetation indices for agricultural crop yield prediction using neural network techniques. Remote Sens. 2010, 2, 673–696. [Google Scholar] [CrossRef] [Green Version]
  16. Sharifi, A. Yield prediction with machine learning algorithms and satellite images. J. Sci. Food Agric. 2021, 101, 891–896. [Google Scholar] [CrossRef] [PubMed]
  17. Sharifi, A. Using sentinel-2 data to predict nitrogen uptake in maize crop. IEEE J. Sel. Top. Appl. Earth Obs. Remote Sens. 2020, 13, 2656–2662. [Google Scholar] [CrossRef]
  18. Mupangwa, W.; Chipindu, L.; Nyagumbo, I.; Mkuhlani, S.; Sisito, G. Evaluating machine learning algorithms for predicting maize yield under conservation agriculture in Eastern and Southern Africa. SN Appl. Sci. 2020, 2, 1–14. [Google Scholar] [CrossRef]
  19. Abbas, F.; Afzaal, H.; Farooque, A.A.; Tang, S. Crop Yield prediction through proximal sensing and machine learning algorithms. Agronomy 2020, 10, 1046. [Google Scholar] [CrossRef]
  20. Masri, D.; Woon, W.L.; Aung, Z. Soil property prediction: An extreme learning machine approach. In International Conference on Neural Information Processing; Springer: Cham, Switzerland, 2015; Volume 9490, pp. 18–27. [Google Scholar] [CrossRef]
  21. Veenadhari, S.; Misra, B.; Singh, C.D. Machine learning approach for forecasting crop yield based on climatic parameters. In Proceedings of the 2014 International Conference on Computer Communication and Informatics: Ushering in Technologies of Tomorrow, Today, ICCCI 2014, Coimbatore, India, 3–5 January 2014. [Google Scholar]
  22. Crane-Droesch, A. Machine learning methods for crop yield prediction and climate change impact assessment in agriculture. Environ. Res. Lett. 2018, 13, 114003. [Google Scholar] [CrossRef] [Green Version]
  23. Hoffman, A.L.; Kemanian, A.R.; Forest, C.E. Analysis of climate signals in the crop yield record of sub-Saharan Africa. Glob. Chang. Biol. 2018, 24, 143–157. [Google Scholar] [CrossRef]
  24. Vogel, E.; Donat, M.G.; Alexander, L.V.; Meinshausen, M.; Ray, D.K.; Karoly, D.; Meinshausen, N.; Frieler, K. The effects of climate extremes on global agricultural yields. Environ. Res. Lett. 2019, 14, 054010. [Google Scholar] [CrossRef]
  25. Chemura, A.; Schauberger, B.; Gornott, C. Impacts of climate change on agro-climatic suitability of major food crops in Ghana. PLoS ONE 2020, 15, e0229881. [Google Scholar] [CrossRef]
  26. Fan, J.; Jintrawet, A.; Sangchyoswat, C. The relationships between extreme precipitation and rice and maize yields using machine learning in Sichuan Province, China. Curr. Appl. Sci. Technol. 2020, 20, 453–469. [Google Scholar] [CrossRef]
  27. Huang, G.B.; Zhu, Q.Y.; Siew, C.K. Extreme learning machine: A new learning scheme of feedforward neural networks. In Proceedings of the IEEE International Conference on Neural Networks, Budapest, Hungary, 25–29 July 2004. [Google Scholar]
  28. Huang, G.B.; Zhou, H.; Ding, X.; Zhang, R. Extreme learning machine for regression and multiclass classification. IEEE Trans. Syst. Man Cybern. Part B Cybern. 2012. [Google Scholar] [CrossRef] [Green Version]
  29. Sun, W.; Sun, J. Prediction of carbon dioxide emissions based on principal component analysis with regularized extreme learning machine: The case of China. Environ. Eng. Res. 2017, 22, 302–311. [Google Scholar] [CrossRef] [Green Version]
  30. Li, S.; Goel, L.; Wang, P. An ensemble approach for short-term load forecasting by extreme learning machine. Appl. Energy 2016, 170, 22–29. [Google Scholar] [CrossRef]
  31. Brown, R.A.; Rosenberg, N.J. Sensitivity of crop yield and water use to change in a range of climatic factors and CO2 concentrations: A simulation study applying EPIC to the central United States. Agric. For. Meteorol. 1997, 83, 171–203. [Google Scholar] [CrossRef]
  32. Hoffman, A.L.; Kemanian, A.R.; Forest, E.C. The response of maize, sorghum, and soybean yield to growing-phase climate revealed with machine learning. Environ. Res. Lett. 2020, 15, 094013. [Google Scholar] [CrossRef]
  33. Laudien, R.; Schauberger, B.; Gleixner, S.; Gornott, C. Assessment of weather-yield relations of starchy maize at different scales in Peru to support the NDC implementation. Agric. For. Meteorol. 2020, 295, 108154. [Google Scholar] [CrossRef]
  34. Chloupek, O.; Hrstkova, P.; Schweigert, P. Yield and its stability, crop diversity, adaptability and response to climate change, weather and fertilisation over 75 years in the Czech Republic in comparison to some European countries. Field Crop. Res. 2004, 85, 167–190. [Google Scholar] [CrossRef]
  35. Kang, Y.; Ozdogan, M.; Zhu, X.; Ye, Z.; Hain, C.; Anderson, M. Comparative assessment of environmental variables and machine learning algorithms for maize yield prediction in the US Midwest. Environ. Res. Lett. 2020, 15, 064005. [Google Scholar] [CrossRef]
  36. Ma, Y.; Zhang, Z.; Kang, Y.; Özdoğan, M. Corn yield prediction and uncertainty analysis based on remotely sensed variables using a Bayesian neural network approach. Remote Sens. Environ. 2021, 259, 112408. [Google Scholar] [CrossRef]
  37. Lee, E.K.; Zhang, W.-J.; Zhang, X.; Adler, P.R.; Lin, S.; Feingold, B.J.; Khwaja, H.A.; Romeiko, X.X. Projecting life-cycle environmental impacts of corn production in the U.S. Midwest under future climate scenarios using a machine learning approach. Sci. Total Environ. 2020, 714, 136697. [Google Scholar] [CrossRef] [PubMed]
  38. Seheult, A.H.; Green, P.J.; Rousseeuw, P.J.; Leroy, A.M. Robust regression and outlier detection. J. R. Stat. Soc. Ser. A Stat. Soc. 1989, 152, 133. [Google Scholar] [CrossRef]
  39. Gramatica, P. Principles of QSAR models validation: Internal and external. QSAR Comb. Sci. 2007, 26, 694–701. [Google Scholar] [CrossRef]
  40. Eslamimanesh, A.; Gharagheizi, F.; Mohammadi, A.H.; Richon, D. A statistical method for evaluation of the experimental phase equilibrium data of simple clathrate hydrates. Chem. Eng. Sci. 2012, 80, 402–408. [Google Scholar] [CrossRef]
  41. Mohammadi, A.H.; Eslamimanesh, A.; Gharagheizi, F.; Richon, D. A novel method for evaluation of asphaltene precipitation titration data. Chem. Eng. Sci. 2012, 78, 181–185. [Google Scholar] [CrossRef]
  42. Kamari, A.; Khaksar-Manshad, A.; Gharagheizi, F.; Mohammadi, A.H.; Ashoori, S. Robust model for the determination of wax deposition in oil systems. Ind. Eng. Chem. Res. 2013, 52, 15664–15672. [Google Scholar] [CrossRef]
  43. Gharagheizi, F.; Eslamimanesh, A.; Sattari, M.; Tirandazi, B.; Mohammadi, A.H.; Richon, D. Evaluation of thermal conductivity of gases at atmospheric pressure through a corresponding states method. Ind. Eng. Chem. Res. 2012, 51, 3844–3849. [Google Scholar] [CrossRef]
  44. Su, Y.; Gabrielle, B.; Makowski, D. The impact of climate change on the productivity of conservation agriculture. Nat. Clim. Chang. 2021, 11, 628–633. [Google Scholar] [CrossRef]
Figure 1. The schematic diagram of the ELM network.
Agronomy 11 02344 g001
Figure 2. The predicted and observed yields of (a) silage maize in the 9 regions of Czechia in the ELM1 model; (b) grain maize in the 9 regions of Czechia in the ELM2 model; (c) grain maize in the 9 regions of Czechia in ELM3 model.
Agronomy 11 02344 g002
Figure 3. The RD of predicted and observed yields of (a) silage maize in the 9 regions of Czechia of ELM1 model; (b) grain maize in the 9 regions of Czechia of ELM2 model; (c) grain maize in the 9 regions of Czechia of ELM3 model.
Agronomy 11 02344 g003
Figure 4. The Williams plot of (a) ELM1 model for silage maize in the 9 regions of Czechia; (b) ELM2 model for grain maize in the 9 regions of Czech Republic; (c) ELM3 model for grain maize in the 9 regions of Czech Republic.
Agronomy 11 02344 g004
Table 1. Climate parameters for silage maize yields of the 9 selected regions in Czechia (dataset 1).
No.ParameterstSig.
Climate FactorsMonth
1Water deficit051.2790.203
2Water deficit06−0.3220.748
3Water deficit07−2.1180.036
4Water deficit08−0.4430.658
5Temp. Mean050.7000.485
6Temp. Mean06−0.6590.511
7Temp. Mean070.1100.912
8Temp. Mean081.0200.310
9Temp. Max05−1.7260.087
10Temp. Max061.3560.177
11Temp. Max070.0390.969
12Temp. Max08−0.9630.337
13Temp. Min051.0390.301
14Temp. Min06−0.8680.387
15Temp. Min071.6390.104
16Temp. Min08−1.2610.210
17Humidity051.0070.316
18Humidity06−1.1080.270
19Humidity07−0.4760.635
20Humidity080.2660.791
21Precipitation05−0.1350.893
22Precipitation060.5950.553
23Precipitation07−0.7680.444
24Precipitation080.1860.853
25Sunshine052.1580.033
26Sunshine06−2.9550.004
27Sunshine07−2.1940.030
28Sunshine080.7440.458
29(Constant) 3.2390.002
Table 2. Descriptors of climate for predicting grain yields in the nine selected regions of Czechia (dataset 2).
No.ParameterstSig.
Climate FactorsMonth
1Water deficit052.9710.004
2Water deficit060.8340.406
3Water deficit07−0.9580.340
4Water deficit08−0.3080.759
5Water deficit09−0.3270.744
6Temp. Mean050.6030.548
7Temp. Mean06−0.5050.614
8Temp. Mean070.6540.514
9Temp. Mean081.4050.163
10Temp. Mean091.1850.238
11Temp. Max051.4580.148
12Temp. Max060.3140.754
13Temp. Max07−1.2630.209
14Temp. Max08−0.3550.723
15Temp. Max09−1.6220.108
16Temp. Min05−1.6090.110
17Temp. Min060.1340.894
18Temp. Min071.6100.110
19Temp. Min08−0.7390.462
20Temp. Min093.1340.002
21Humidity051.3340.185
22Humidity061.6410.103
23Humidity071.4560.148
24Humidity08−0.2810.779
25Humidity09−1.0590.292
26Precipitation052.0740.040
27Precipitation06−0.8600.392
28Precipitation07−0.3410.734
29Precipitation080.5780.565
30Precipitation09−0.9730.333
31Sunshine05−1.4330.154
32Sunshine061.5250.130
33Sunshine07−0.6330.528
34Sunshine08−1.9090.059
35Sunshine090.1790.858
36(Constant) −1.5070.134
Table 3. Descriptors of climate for grain maize yields in the nine selected regions of Czechia (dataset 3).
No.ParameterstSig.
Climate FactorsMonth
1Water deficit052.6430.009
2Water deficit060.6860.494
3Water deficit07−0.5090.612
4Water deficit08−0.1530.879
5Water deficit090.4850.628
6Temp. Mean050.0020.999
7Temp. Mean06−0.1860.853
8Temp. Mean071.1070.271
9Temp. Mean081.8040.074
10Temp. Mean090.2930.770
11Temp. Max051.9340.056
12Temp. Max06−0.1260.900
13Temp. Max07−1.9230.057
14Temp. Max08−0.0900.929
15Temp. Max09−1.3930.166
16Temp. Min05−1.3600.177
17Temp. Min06−0.1950.846
18Temp. Min071.7180.089
19Temp. Min08−0.7530.453
20Temp. Min093.4390.001
21Humidity050.3200.749
22Humidity062.0330.044
23Humidity070.6550.514
24Humidity08−0.2730.785
25Humidity09−0.3100.757
26Precipitation051.7840.077
27Precipitation06−1.0950.276
28Precipitation07−0.1730.863
29Precipitation080.5170.606
30Precipitation09−0.8950.373
31Sunshine05−2.2160.029
32Sunshine062.0690.041
33Sunshine07−1.0290.306
34Sunshine08−2.5170.013
35Sunshine090.2340.815
36(Constant) −0.8170.416
Table 4. The statistical parameters of ELM models built in this study.
No.ModelsDatasetsNumber of DatasetsAARD %RMSER2
1ELM1Train1236.2002.6750.674
test308.0623.3070.560
total1536.5652.8100.641
2ELM2Train12235.7911.0520.746
test3017.3351.1450.754
total15232.1481.0710.741
3ELM3Train11715.1261.0130.705
test2915.1930.9810.773
total14615.1391.0060.716
Publisher’s Note: MDPI stays neutral with regard to jurisdictional claims in published maps and institutional affiliations.

