
Effects of NaCl on Hydroponic Cultivation of Reichardia picroides (L.) Roth


1
Department of Agriculture, Food and Environment, University of Pisa, Via del Borghetto 80, 56124 Pisa, Italy
2
Institute of Life Sciences, Scuola Superiore Sant’Anna, Piazza Martiri della Libertà 33, 56127 Pisa, Italy
*
Author to whom correspondence should be addressed.
Agronomy 2021, 11(11), 2352; https://0-doi-org.brum.beds.ac.uk/10.3390/agronomy11112352
Submission received: 2 October 2021
/
Revised: 16 November 2021
/
Accepted: 18 November 2021
/
Published: 20 November 2021
(This article belongs to the Special Issue Medicinal and Aromatic Plants (MAPs): The Connection between Cultivation Practices and Biological Properties)
Abstract
:Wild edible plant species are often more tolerant to salinity than many crop plants. Considering the salinization of irrigation water that is progressively affecting the Mediterranean region and the market demand for new plant foods, the cultivation of wild edible species could represent a valid alternative to conventional vegetable crops. In this study, Reichardia picroides (L.) Roth, a widespread spontaneous herb of ethnobotanical tradition, was grown for four or six weeks under a greenhouse in a floating system for the production of baby leaves. In order to improve the nutraceutical quality of the tissues, the plants were exposed to the following NaCl concentrations in the nutrient solution: 1.7 (control), 25, 50, and 100 mM. The results showed that a 4-week growing period in a floating system with 50 mM NaCl in the nutrient solution increased the content of bioactive molecules without affecting the fresh yield. After six weeks of cultivation, despite a decrease in biomass production as compared with the control, the leaves of salt-treated plants contained higher levels of bioactive molecules along with lower amounts of nitrate ion.
1. Introduction
Progressive salinization of irrigation water is an issue of concern in the Mediterranean region and is becoming a limiting factor for the productivity of vegetable crops, which generally show low tolerance toward continuous application of saline water [1,2]. Wild edible species that are adapted to severe environmental conditions could represent a valid alternative to less tolerant vegetables [3]. On the other hand, it has been reported that wild food plants may contain high nitrate levels [4]. Plant response to saline conditions involves complex mechanisms that differ among species [5,6]; however, a general effect of salinity by NaCl is the competition between chloride and nitrate for root uptake, which decreases nitrate accumulation in leafy vegetables including edible greens [5,7].
At present, the market demand is encouraging the introduction of new horticultural crops and the exploitation of local foods that can meet the consumers’ favour [8]. Wild plant species from the ethnobotanical tradition can satisfy both these requirements and, furthermore, can be regarded as potential functional foods [9], as they often possess a higher content of bioactive molecules than many vegetables [4]. These natural health-promoting phytochemical compounds are the result of plant adaptation to the natural environment and are generally produced as defense molecules against biotic or abiotic stress conditions [10]. Often these substances are antioxidant compounds belonging to the class of polyphenols that, in species with edible leaves, are commonly associated with a bitter taste [11]. Despite a general tendency by the consumers to avoid bitter foods, the connection between dietary intake of healthy antioxidants and bitter taste could positively influence the acceptance of wild edible species [12,13], especially if they are used as ingredients in a vegetable mix. The market demand for baby greens for the production of ready-to-eat mixed salads is in continuous expansion [4] and has promoted the cultivation of several leafy species that were traditionally collected at the spontaneous state (e.g., rocket salad [14]), thus preserving the natural environment, and contributing to the sustainable maintenance of agrobiodiversity [15]. The hydroponic technique, particularly the floating system, is typically used for the production of ready-to-eat baby leaves and could represent a suitable choice also for the cultivation of wild herbs [16]. Unfortunately, domestication often causes a decline in beneficial properties, as cultivated plants are less exposed to stress factors than those in the original environment [17], in particular when plants are grown in hydroponic systems, where root uptake of both water and nutrients is facilitated [18]. On the other hand, the nutraceutical properties of hydroponically grown plants could be modulated in dependence of the composition of the nutrient solution; thus, a proper formulation of the nutrient recipe could help to partially recover the typical properties of the plants at the spontaneous state.
Although the cultivation of wild edible plants is receiving increasing attention, the best growing practices to optimize the production and ensure both high yield and high quality of these crops remain largely unknown. Among relatively unexploited edible species, Reichardia picroides (L.) Roth (in the Asteraceae family), generally called common brighteyes and known in Italy as terracrepolo, is a widespread spontaneous herb in the Mediterranean region traditionally used as a food herb and as a medicinal plant. This species shows a high adaptability to different unfavorable environmental conditions and can grow in different habitats, either inland or in coastal areas subjected to the deposition of marine salts [19]. Moreover, in a recent work hydroponically grown R. picroides plants grown in hydroponic systems exhibited salt tolerance [20]. Based on the above considerations, the aim of the present study was to evaluate the effect of NaCl salinity on crop yield and produce quality of R. picroides plants cultivated in a floating system under greenhouse conditions.
2. Materials and Methods
2.1. Plant Material and Growing Conditions
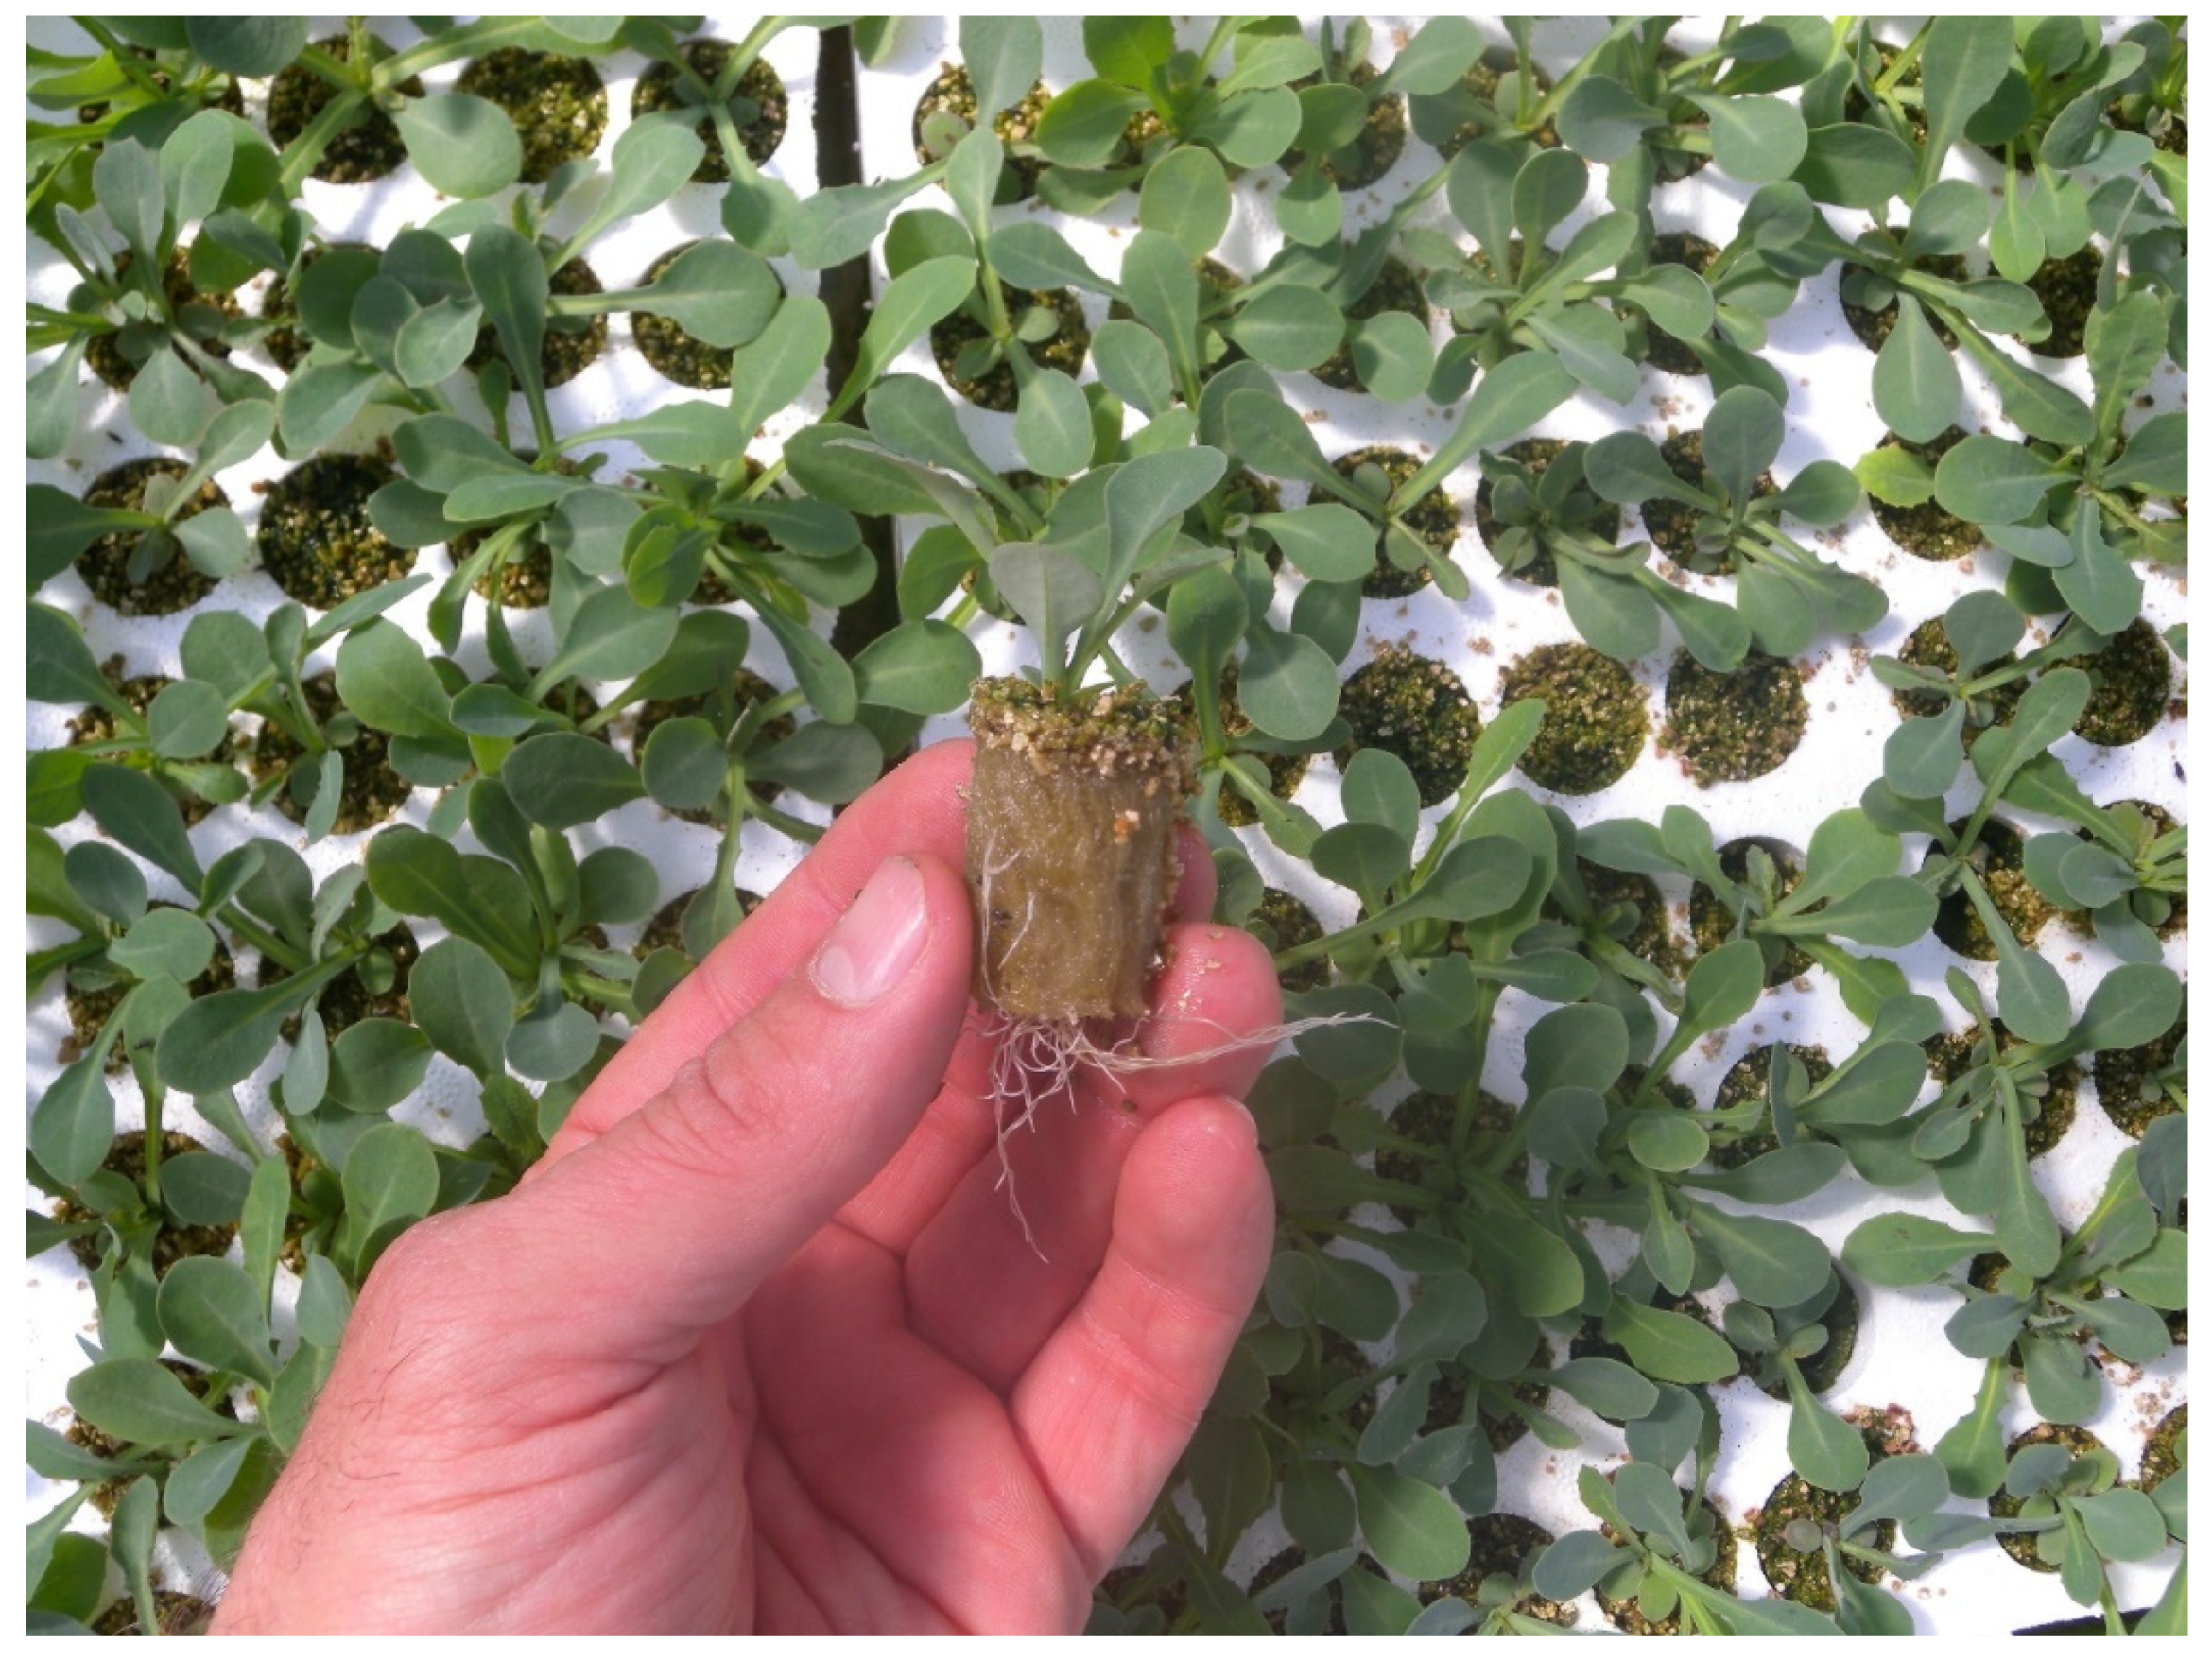
The seeds were obtained from spontaneous plants collected in Tuscany (Agnano, Pisa, Italy; 43°73′ N, 10°48′ E). They were sown on rockwool plugs hosted in alveolar polystyrene containers that were placed in a greenhouse with mist irrigation. Germination (approximately 85%) occurred within 20 days, and the seedlings were transplanted into a floating system 73 days after sowing, when about five-six leaves were completely developed, and the rootlets emerged at the bottom of the rockwool plugs (Figure 1). The experimental setup consisted of polystyrene trays floating on 60-L plastic tanks with aerated nutrient solution. Each tank hosted one tray with six plants and two tanks were arranged for each treatment, with a plant density of 36 plants/m2. During the experiment, which was carried out in spring from 30 March to 10 May 2017, the average values of air temperature, global radiation, and relative humidity inside the greenhouse were 19.6 °C, 8.4 MJ/m2∙day, and 65%, respectively. The nutrient solution was prepared using tap water and the proper amounts of inorganic salts to obtain the following composition (mM): 10.0 N-NO3−, 1.0 P-H2PO4−, 8.0 K, 4.5 Ca, 2.0 Mg, 1.7 Na, 4.0 S-SO42−, 3.0 Cl, 0.040 Fe, 0.025 B, 0.003 Cu, 0.010 Zn, 0.010 Mn, 0.001 Mo. The values of pH and EC were 5.5 and 2.4 dS/m, respectively. Along with the control (1.7 mM NaCl), three saline treatments were applied by NaCl addition to the nutrient solution up to the following concentrations: 25, 50, and 100 mM, which corresponded to EC values of 4.6, 6.9, and 11.7 dS/m, respectively. To avoid osmotic shock to the plants, the final NaCl concentration in the two latter treatments was reached gradually, through a daily increase of 25 mM in NaCl concentration. During the growing cycle, the nutrient solution was checked every 1–2 days for pH and EC; possible variations were compensated by the addition of nitric acid or fresh nutrient solution.
2.2. Growth Analysis
Four plants for each treatment (two plants from each tank) were sampled four and six weeks after transplanting for the determination of the number of leaves and the fresh (FW) and dry (DW) weight of both roots and leaves. For the latter parameter, fresh samples were dried in a ventilated oven at 70 °C until constant weight.
2.3. Leaf Sampling and Extraction
Three leaves were detached from each plant collected for the growth analysis. The leaves were chosen among the first completely developed ones from the inner of the rosette, were cut into pieces, and mixed to obtain one sample of about 1 g fresh weight (FW), which was stored at −80 °C until analysis. Pure methanol was used as the extraction solvent in all the determinations except those of total anthocyanins and flavonol glycosides, which employed 80% methanol containing 1% hydrochloric acid. The leaf samples were extracted twice with 5 mL aliquots of extraction solvent, using mortar and pestle. At each extraction step, the tubes containing the extraction solvent and the pellet were sonicated four times in an ice bath for 15 min, stored overnight at −20 °C, and centrifuged for 5 min at 2700× g. For each sample, the supernatant aliquots were pooled and used for the spectrophotometric determination of the antioxidant capacity and the content of chlorophylls, anthocyanins, flavonol glycosides, and total phenols [19]. A Lambda35 UV-vis spectrophotometer (Perkin Elmer, Waltham, MA, USA) was used for all the absorbance readings, and the results were expressed on a FW basis.
2.4. Chlorophylls and Carotenoids
The extracts were diluted 1:10 with methanol, and the concentrations of the pigments (g/kg FW) were calculated from absorbance readings at 665.2, 652.4, and 470 nm according to Lichtentahler and Buschmann [21].
2.5. Antocyanins and Flavonol Glycosides
The determination was performed according to Hrazdina et al. [22], after dilution of the acidic extract as needed. The content of total anthocyanins was assessed by absorbance readings at 530 nm and expressed as mg cyanidin-3-glucoside/kg FW, using the value 38,000 L/mol∙cm for the molar absorptivity. The content of flavonol glycosides was assessed at 360 nm and expressed as mg quercetin-3-glucoside/kg FW, using 20,000 L/mol∙cm as the value of the molar absorptivity.
2.6. Total Phenols
The absorbance of 1:100 diluted methanol extract was read at 320 nm [23]. The results were expressed as absorbance units of the pure extract per gram leaf tissue, A (320 nm)/g FW. In addition, the Folin-Ciocalteu assay was carried out by mixing 100 μL methanol extract with 2.0 mL distilled water, 300 μL Folin-Ciocalteu phenol reagent, and, after four minutes, 1.6 mL of 7.5% sodium carbonate. The solutions were kept 2 h at room temperature and the absorbance was measured at 765 nm [23]. Gallic acid standard solutions were used for calibration, and the results were expressed as mg gallic acid/kg FW.
2.7. Antioxidant Capacity
Two distinct assays were used to determine the antioxidant capacity both as ferric reducing antioxidant power (FRAP) [24] and as 2,2-diphenyl-1-picrylhydrazyl radical scavenging activity (DPPH) [25]. In the former assay, acetate buffer at pH 3.6 (2.0 mL) was mixed in a spectrophotometric cuvette with 900 μL FRAP reagent containing 2 mM ferric chloride and 1 mM TPTZ (2,4,6-tris(2-pyridyl)-s-triazine), and 100 μL diluted 1:4 methanol extract. The absorbance was read at 593 nm and compared with a calibration curve obtained with standard solutions of ferrous ammonium sulphate. The results were expressed as mmol Fe(II)/kg FW. For the DPPH assay, 30 μL methanol (blank) or methanolic extract (sample) were added to 2.97 mL of 20 mg/L DPPH solution. After 45 min in the dark at room temperature, the absorbance (A) was read at 515 nm, and the percentage inhibition of the DPPH radical per gram fresh tissue was calculated as follows:
% Inhibition/g FW = 100 + [(Ablank−Asample)/Ablank]/g FW
2.8. Nitrates
The spectrophotometric determination of nitrates was performed following Cataldo et al. [26]. The assay was carried out on samples of dried powdered leaf tissue (100 mg) that were extracted with 10 mL deionized water on an orbital shaker at room temperature for two hours. The aqueous extract (70 μL) as mixed with 300 μL of concentrated sulphuric acid containing 5% salicylic acid. After 20 min, 1.5 M NaOH (10 mL) was added, and the solution was allowed to cool at room temperature for 20 min. The absorbance was read at 410 nm, and the nitrate concentration was determined through a standard calibration curve. The results were expressed as mg NO3−/kg FW.
2.9. Statistical Analysis
The data were subjected to two-way ANOVA, with the treatment (NaCl concentration) and the sampling date as the sources of variation, and the Bonferroni post-test was used for means separation. Both the linear regression analysis and the Principal Component Analysis (PCA) were applied to the water content, the nutraceutical parameters, and the nitrate content of the leaves. The Statgraphics Centurion Version 17 software (Statpoint Technologies, Warrenton, VA, USA) was used for the statistical analyses.
3. Results
3.1. Plant Growth and Crop Yield
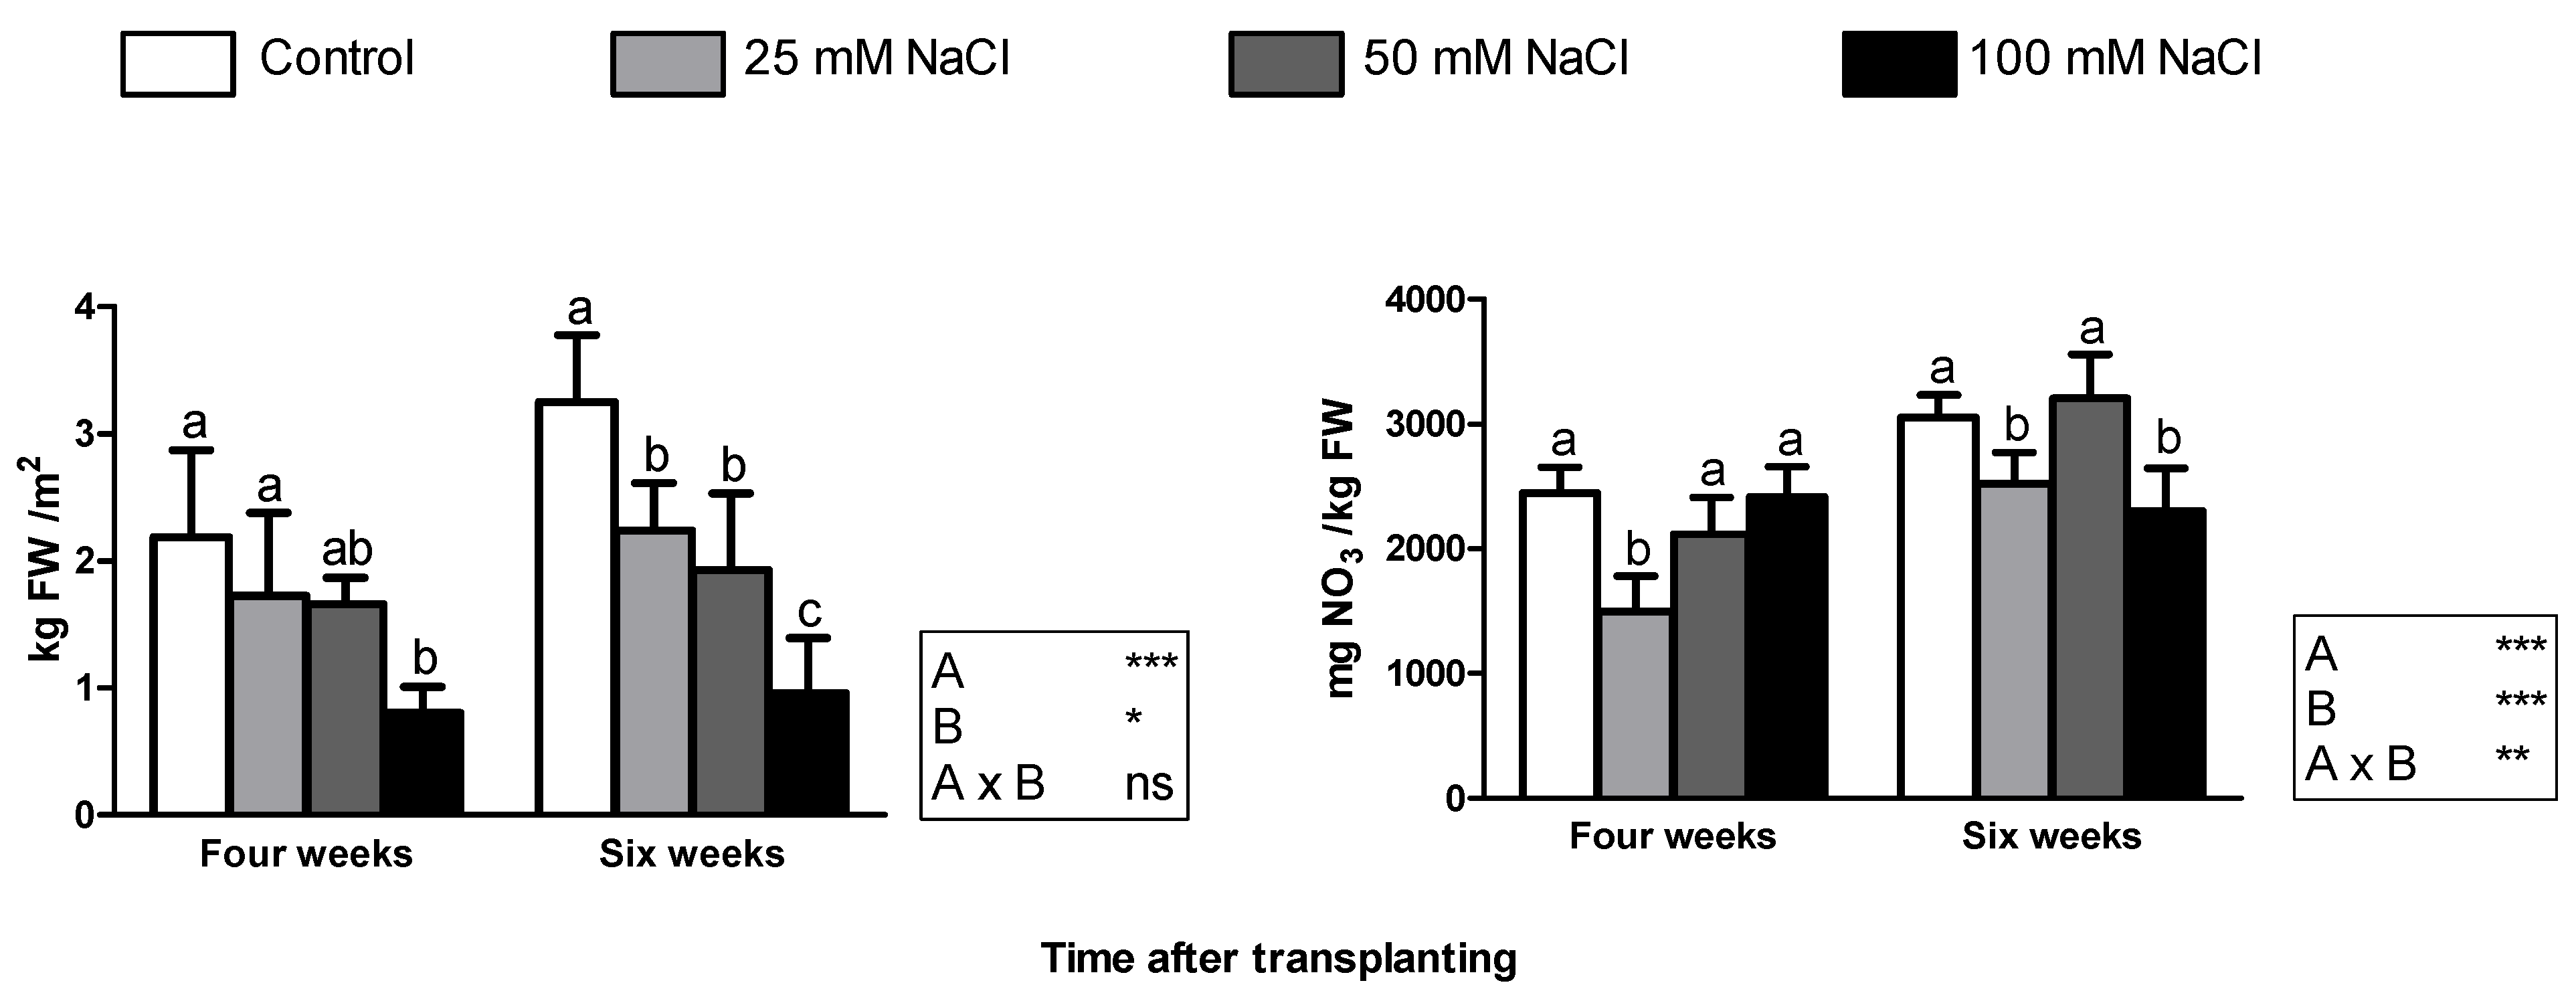
After four weeks from transplanting, the growth parameters decreased significantly only in plants grown at 100 mM NaCl concentration, except the root biomass fresh and dry matter, which remained unchanged (Table 1). In contrast, two weeks later all the salt treatments caused a strong reduction in both leaf area and leaf biomass (Table 1). With 100 mM NaCl, the root biomass was also affected, along with the dry matter content of the leaves (Table 1). For all the growth parameters, the two-way ANOVA showed no significant interaction between NaCl concentration in the nutrient solution and the sampling time (Table 1). Obviously, the latter had a strong effect on biomass production, which was significantly higher in older plants. Nevertheless, plant age did not affect leaf number (Table 1). With NaCl concentrations up to 50 mM, the fresh yield of younger plants did not significantly change and averaged 1.86 kg/m2 (Figure 2, left); in contrast, crop yield was significantly lower (−63% as compared with the control) at 100 mM NaCl concentration. After six weeks from transplanting, the yield of control plants was 3.25 kg/m2 and was significantly lower at all the tested NaCl concentrations (Figure 2, left); the loss of leaf fresh weight was approximately 26%, 37%, and 68% at 25, 50, and 100 mM NaCl, respectively.
3.2. Leaf Nitrate Content
The level of nitrates in the leaves was unaffected by sampling time, despite the significant influence of salinity (Figure 2, right). On the other hand, a strong interaction between the two factors was found for the nitrate content, similarly to the content of carotenoids and unlike all the other parameters determined in this work. Moreover, an extremely low linear correlation coefficient (0.05) was obtained between NaCl concentration and the content of nitrate, which was in the range 1500–3200 mg NO3−/kg FW. Compared with the control, the leaf nitrate content was significantly lower with the 25 mM treatment at both sampling times and with 100 mM NaCl after six weeks of cultivation (Figure 2, right).
3.3. Antioxidant Capacity and Compounds
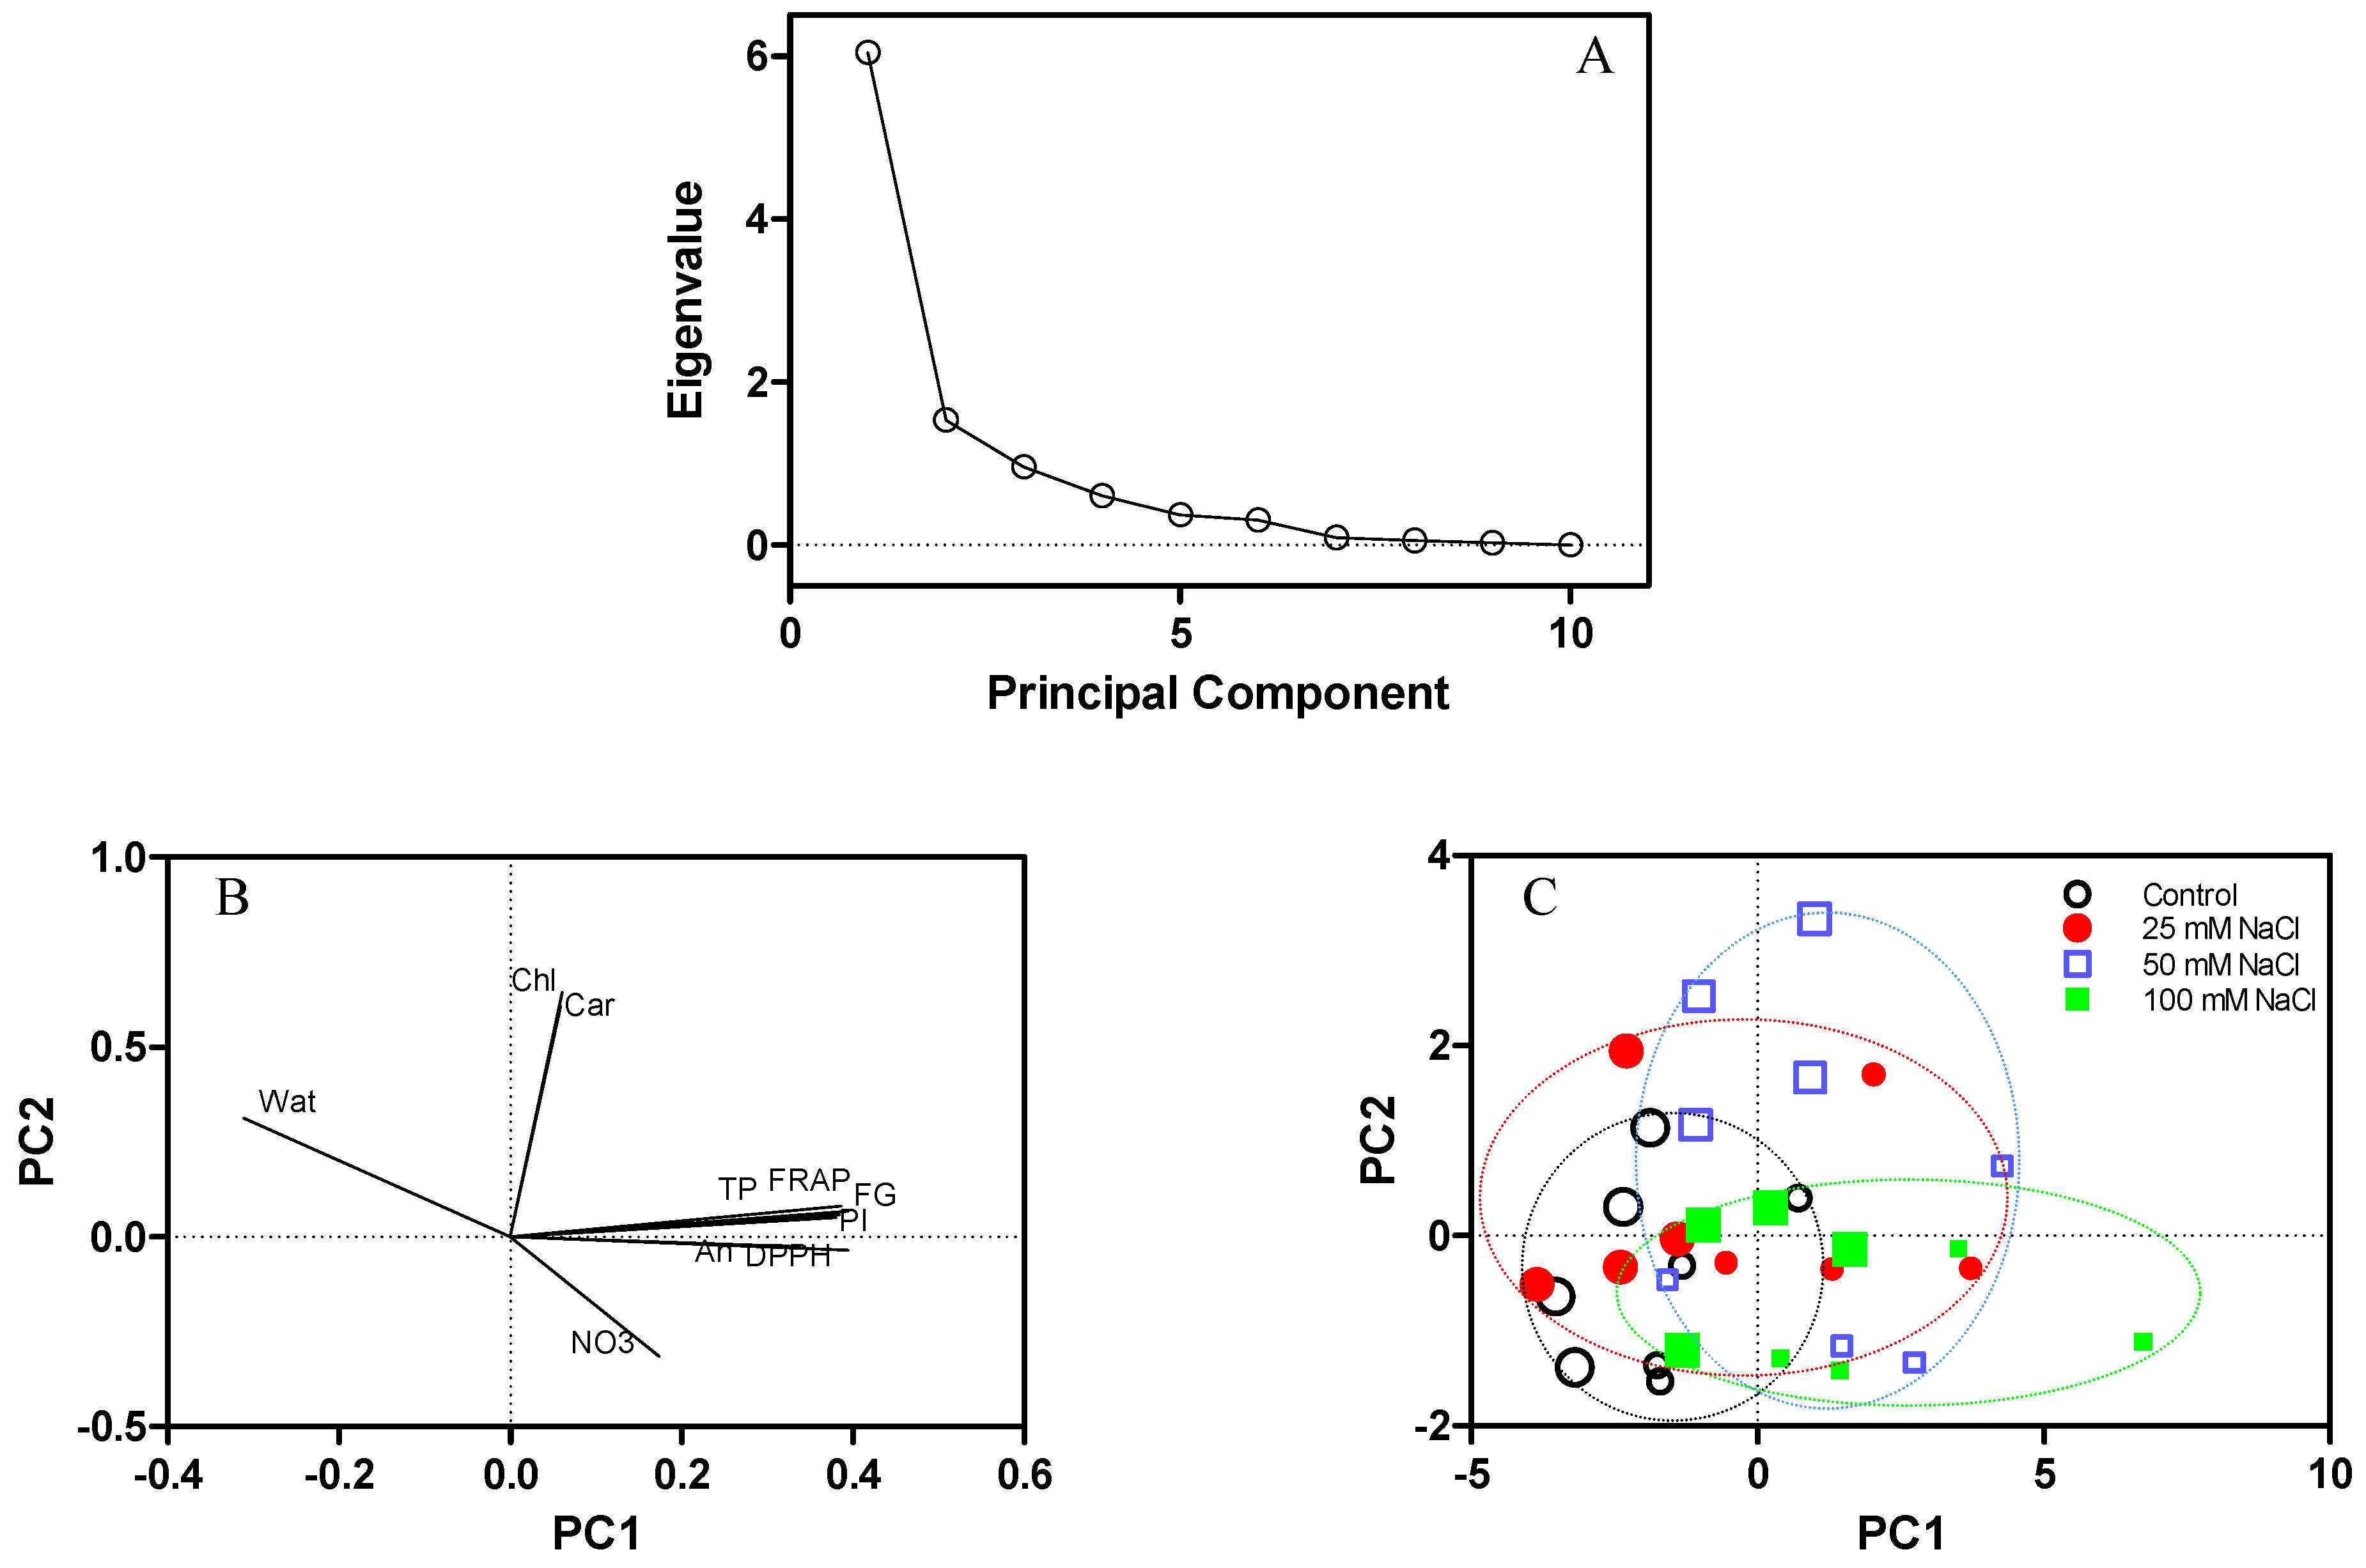
Among all the nutraceutical properties measured in the fresh leaf tissues, a significant interaction between NaCl salinity and harvest time was found only for the content of carotenoids (Table 2). Both NaCl concentration and harvest time did not influence the leaf content of chlorophylls and carotenoids, while the antioxidant capacity and the contents of total phenols, flavonol glycosides, and anthocyanins generally increased with salinity at both sampling times (Table 2). The results for the content of total phenols showed that the differences among the treatments were more pronounced for the Folin-Ciocalteu assay than the phenol index, especially at the first sampling time (Table 2); however, the same trend was observed in both parameters. Likewise, the results of the determination of the antioxidant capacity showed a similar trend, although with the FRAP assay the differences among the treatments were more evident than those observed with the DPPH assay, particularly in younger plants (Table 2). The linear regression analysis showed significant (p < 0.05) Pearson’s coefficients (>0.95) between the results of the FRAP and DPPH assays that were used for the determination of the antioxidant capacity, and between the results of the Folin-Ciocalteu assay and the phenol index that were used for the determination of the content of total phenols (Figure 3). Moreover, both the antioxidant capacity and the content of total phenols were significantly correlated with the content of flavonol glycosides (Pearson’s coefficient > 0.86) and anthocyanins (Pearson’s coefficient > 0.67) (Figure 3). According to the PCA, the principal components (PC1 and PC2) associated with the highest eigenvalues in the scree plot (Figure 4A) explained 60.4% and 15.3% of the total variance, respectively. The plot of component weights (Figure 4B) showed a strong co-variance among total phenols, FRAP, flavonol glycosides, and phenol index, which were correlated also with anthocyanins and DPPH. The six parameters contributed strongly to PC1, while chlorophylls and carotenoids mainly contributed to PC2. Moreover, water content was negatively correlated to PC1, and nitrate content was negatively correlated to PC2. However, the scatterplot (Figure 4C) showed that the clusters that could be identified across data points were not sufficiently separated for an effective characterization among the treatments and sampling times.
4. Discussion
4.1. Plant Growth and Crop Yield
Salt stress can limit the root uptake of both water and nutrients and impair plant water relations and leaf photosynthesis [5]. Plant response to salinity depends on plant genotype, developmental stage, growing conditions, the level of salinity in the root zone, and the duration of the exposure to stress conditions [27,28]. In our study, the detrimental effect of salinity was more severe in the leaves than in the roots, and in six-week-old plants than in younger ones. In fact, after four weeks from transplanting, only 100 mM NaCl caused a significant decrease in the leaf biomass production, whereas root growth was unaffected. In contrast, in older plants, a significant growth reduction was already observed with 25 mM NaCl, and this outcome became more evident at higher salt concentrations; with 100 mM NaCl the root tissues were also affected, suggesting that, in the conditions tested in this work, R. picroides is sensitive to salinity after six weeks treatment. However, the response of this species to salinity may depend on environmental and physiological factors, including growing period and plant age. For example, after nine weeks of hydroponic culture during winter (January-March), Alexopoulos et al. [20] reported for R. picroides a fresh yield of 1.12 kg FW/m2 yield; this value was lower compared with our results (2.19 and 3.25 kg FW/m2 for four- and six-week-old control plants, respectively; Figure 2) and did not change significantly when the plants were grown at moderate salinity (6 dS/m). Even lower yield values (1.01 kg FW/m2) were found by the same authors in control plants of hydroponically grown Taraxacum officinale [20], which is another herb in the Asteraceae with great adaptation to hydroponic cultivation [29,30,31]. The high yield that was obtained in this work for R. picroides (Figure 2) showed that plant growth in the floating system was very fast and demonstrated the suitability of this species for the hydroponic production of baby leaves. Despite a severe biomass reduction at high salinity, the yield obtained with 100 mM NaCl (0.81 and 0.96 kg FW/m2 for four- and six-week-old plants, respectively; Figure 2) was comparable to that of unstressed hydroponically grown T. officinale [20].
4.2. Leaf Nitrate Content
Generally, salinity causes a decrease in the nitrate content of the leaves, which is attributed to impaired root functionality and reduced capacity to absorb water and nutrients and, in the case of salinity by NaCl, also to the antagonistic uptake of chloride and nitrate [32]. In our work, this effect was evidenced under mild salinity conditions (25 mM NaCl) at both sampling times, while at higher salinity a significant decrease of nitrate content was observed only with 100 mM NaCl after six weeks of cultivation (Figure 2). On the other hand, at both sampling times the leaf nitrate content in plants grown with 50 mM NaCl did not significantly differ from the levels found in the control, despite a significant decrease of leaf biomass (Figure 2), indicating that, at this salinity level, the root uptake of nitrate ion was reduced and, at the same time, the mobilization of vacuolar nitrate as a nitrogen source was not effective in sustaining plant growth. In contrast, in T. officinale the decrease of fresh yield caused by salinity was associated with a significant decrease in nitrate content, which was lower than 1000 mg/kg FW in salt-treated plants [20]. This suggests that the ability to absorb nitrate ions could be impaired by salinity to a greater extent in salt-sensitive species than in more tolerant ones. High nitrate content in leafy vegetables is known to represent a risk for human health [33], being associated with gastric cancer [34] and, in order to preserve food safety and public health, the European Union has set limits to the nitrate content of leafy vegetables. For example, the maximum level allowed is 3500 mg NO3/kg FW for fresh spinach, 4000 or 5000 mg NO3/kg FW, depending on the season, for greenhouse lettuce [35]. These limits are much higher than those found in this work for R. picroides; however, the issue of nitrate reduction should be considered as a key factor in the development of suitable growing protocols for edible greens. In that sense, nitrate accumulation in hydroponically grown crops can be decreased by an increase of the NH4+/NO3− ratio in the nutrient solution, or by eliminating nitrates from the nutrient solution a few days prior to harvest [36].
4.3. Antioxidant Capacity and Compounds
Both the antioxidant capacity and the content of phenolic compounds in R. picroides grown in a floating system were lower than in spontaneous or pot-grown plants [19]; particularly, the values of the two parameters reported for wild plants were 34.5 mmol Fe(II)/kg FW and 4320 mg GAE/kg FW, respectively. In addition, the average content of total phenols obtained by Savo et al. [37] for R. picroides was 22.4 mg GAE/g DW against 14.4 mg GAE/g DW found in the control plants in our experiment. However, in this study, the addition of NaCl to the nutrient solution was effective in stimulating the synthesis and accumulation of phenolic compounds with antioxidant activity. In contrast, previous work from our laboratory had evidenced that a significant increase in the content of phenolic compounds could not be obtained in R. picroides by application of a NaCl solution through the foliar spray to simulate marine aerosol [19]. Therefore, the present study shows that the occurrence of chronic stress through the root system, rather than sudden stress through foliar treatment, is necessary to elicit an adequate physiological response in this species. This outcome also shows the suitability of the hydroponic technique for the growth of baby leaves of improved nutraceutical quality, due to the possibility of optimal management of the salinity of the nutrient solution. A different behaviour has been reported for hydroponically grown T. officinale; in this species, a salt-induced growth reduction was not accompanied by an increase in the content of phenolic compounds, which remained below 1000 mg GAE/kg FW [20].
The antioxidant capacity, as assessed through two distinct assays, and the content of total phenols showed a similar increasing trend and were strongly correlated (Figure 3 and Figure 4B) in agreement with previous findings [37]. This suggests a direct involvement of phenolic compounds in the antioxidant response of R. picroides to salinity stress. Moreover, the high correlation of both parameters with the content of flavonol glycosides and, albeit to a lesser extent, anthocyanins (Figure 3), indicated the importance of both classes of bioactive molecules within the pool of phenolic compounds of this species. The synthesis of bioactive molecules such as phenolic compounds is commonly involved in plant adaptation to stress conditions [32]. In R. picroides grown in hydroponics, the leaf content of total phenolics, chlorophylls (a, b, and total), and carotenoids increased when the pH of the nutrient solution was kept at 4.0 instead of 5.5 or 7.0 [38]. In our study, NaCl salinity did not influence the leaf content of photosynthetic pigments (Table 2), and the content of carotenoids was not correlated to NaCl concentration under the conditions tested in this work (Figure 3).
As several quality parameters were investigated in this study, the data were subjected to both regression analysis and PCA (Figure 3 and Figure 4). The results showed that the latter was not effective in the identification of clusters among data points, which were not sufficiently separated to provide adequate discrimination across treatments and sampling times. However, both statistical analyses showed the relationships among the variables, highlighting positive correlations that involved different classes of bioactive molecules
5. Conclusions
The data supported our hypothesis that abiotic stress such as salinity could enhance the nutraceutical qualities of the leaf tissues in R. picroides. However, although with the floating system abiotic stress could be easily applied through a simple modification in the composition of the nutrient solution, the observed effect was only a limited increase in the antioxidant capacity and the level of phenolic compounds. At the same time, a significant decrease in the nitrate content was not observed in all the saline treatments. On the other hand, although the bioactive properties typical of the plants at the spontaneous state were only partially retained in cultivation, the hydroponically grown plants could still ensure satisfactory levels of beneficial compounds, especially in comparison with other medicinal plants in the Asteraceae family, such as T. officinale. In this study, a four-week growing period in a floating system with 50 mM NaCl in the nutrient solution increased the leaf content of bioactive molecules without affecting biomass production, while a severe yield reduction caused by salinity was observed with 100 mM NaCl after six weeks from transplanting. However, in these conditions, the quality of the edible parts was improved in comparison with the control, as the leaf tissues contained higher levels of bioactive molecules along with lower amounts of nitrate ions. Despite further studies are necessary to make the production of spontaneous species sustainable and cost-effective, the findings of this work can open a perspective for short-cycle (four weeks) production of baby leaves for ready-to-eat mixtures, expanding the market offer, favouring agrobiodiversity, and contributing at the same time to the recovery of ethnobotanical traditions.
Supplementary Materials
The following are available online at https://0-www-mdpi-com.brum.beds.ac.uk/article/10.3390/agronomy11112352/s1.
Author Contributions
Conceptualization, S.B., L.I. and A.P.; Data curation, F.L.; Formal analysis, R.M.; Investigation, R.M. and F.L.; Methodology, R.M. and L.I.; Project administration, A.P.; Resources, S.B. and A.P.; Supervision, A.P.; Validation, S.B. and L.I.; Visualization, R.M.; Writing—original draft, R.M.; Writing—review & editing, R.M., S.B., F.L., L.I. and A.P. All authors have read and agreed to the published version of the manuscript.
Funding
This research was co-founded by the ERBAVOLANT project (Rural Development policy 2014–2020-Measure 16.2: Support to the Operational Groups of Agricultural European Innovation Partnership (EIP-AGRI)).
Data Availability Statement
The data presented in this study are available as Supplementary Material.
Conflicts of Interest
The authors declare no conflict of interest.
References
- Saysel, A.K.; Barlas, Y. A dynamic model of salinization on irrigated lands. Ecol. Model. 2001, 139, 177–199. [Google Scholar] [CrossRef]
- Machado, R.M.A.; Serralheiro, R.P. Soil salinity: Effect on vegetable crop growth. Management practices to prevent and mitigate soil salinization. Horticulturae 2017, 3, 30. [Google Scholar] [CrossRef]
- Reis, M.; Coelho, L.; Santos, G.; Kienle, U.; Beltrão, J. Yield response of stevia (Stevia rebaudiana Bertoni) to the salinity of irrigation water. Agric. Water Manag. 2015, 152, 217–221. [Google Scholar] [CrossRef]
- Lenzi, A.; Orlandini, A.; Bulgari, R.; Ferrante, A.; Bruschi, P. Antioxidant and mineral composition of three wild leafy species: A comparison between microgreens and baby greens. Foods 2019, 8, 487. [Google Scholar] [CrossRef] [Green Version]
- Isayenkov, S.V.; Maathuis, F.J.M. Plant salinity stress: Many unanswered questions remain. Front. Plant Sci. 2019, 10, 80. [Google Scholar] [CrossRef] [PubMed] [Green Version]
- Mishra, P.; Mishra, J.; Arora, N.K. Plant growth promoting bacteria for combating salinity stress in plants—recent developments and prospects: A review. Microbiol. Res. 2021, 252, 126861. [Google Scholar] [CrossRef] [PubMed]
- Rouphael, Y.; Kyriacou, M.C. Enhancing quality of fresh vegetables through salinity eustress and biofortification applications facilitated by soilless cultivation. Front. Plant Sci. 2018, 9, 1–6. [Google Scholar] [CrossRef]
- Prohens, J.; Burruezo, A.R.; Nuez, F. New crops: An alternative for the development of horticulture. J. Food Agric. Env. 2003, 1(1), 75–79. [Google Scholar]
- Garcia-Oliveira, P.; Barral, M.; Carpena, M.; Gullón, P.; Fraga-Corral, M.; Otero, P.; Prieto, M.A.; Simal-Gandara, J. Traditional plants from Asteraceae family as potential candidates for functional food industry. Food Funct. 2021, 12, 2850–2873. [Google Scholar] [CrossRef] [PubMed]
- Matsuura, H.N.; Rau, M.R.; Fett-Neto, A.G. Oxidative stress and production of bioactive monoterpene indole alkaloids: Biotechnological implications. Biotechnol. Lett. 2014, 36, 191–200. [Google Scholar] [CrossRef]
- Soares, S.; Kohl, S.; Thalmann, S.; Mateus, N.; Meyerhof, W.; De Freitas, V. Different phenolic compounds activate distinct human bitter taste receptors. J. Agric. Food Chem. 2013, 61, 1525–1533. [Google Scholar] [CrossRef]
- Ghirardini, M.P.; Carli, M.; del Vecchio, N.; Rovati, A.; Cova, O.; Valigi, F.; Agnetti, G.; Macconi, M.; Adamo, D.; Traina, M.; et al. The importance of a taste. A comparative study on wild food plant consumption in twenty-one local communities in Italy. J. Ethnobiol. Ethnomed. 2007, 3, 1–14. [Google Scholar] [CrossRef] [PubMed] [Green Version]
- Vecchio, R.; Cavallo, C.; Cicia, G.; Del Giudice, T. Are (All) Consumers Averse to Bitter Taste? Nutrients 2019, 11, 323. [Google Scholar] [CrossRef] [PubMed] [Green Version]
- Hall, M.; Jobling, J.; Rogers, G. Some perspectives on rocket as a vegetable crop: A review. Veg. Crop. Res. Bull. 2012, 76, 21–41. [Google Scholar] [CrossRef]
- Long, C.L.; Li, H.; Ouyang, Z.; Yang, X.; Li, Q.; Trangmar, B. Strategies for agrobiodiversity conservation and promotion: A case from Yunnan, China. Biodivers. Conserv. 2003, 12, 1145–1156. [Google Scholar] [CrossRef]
- Giménez, A.; Fernández, J.A.; Pascual, J.A.; Ros, M.; López-Serrano, M.; Egea-Gilabert, C. An agroindustrial compost as alternative to peat for production of baby leaf red lettuce in a floating system. Sci. Hortic. 2019, 246, 907–915. [Google Scholar] [CrossRef]
- Ceccanti, C.; Landi, M.; Incrocci, L.; Pardossi, A.; Venturi, F.; Taglieri, I.; Ferroni, G.; Guidi, L. Comparison of three domestications and wild-harvested plants for nutraceutical properties and sensory profiles in five wild edible herbs: Is domestication possible? Foods 2020, 9, 1065. [Google Scholar] [CrossRef]
- Sharma, N.; Acharya, S.; Kumar, K.; Singh, N.; Chaurasia, O.P. Hydroponics as an advanced technique for vegetable production: An overview. J. Soil Water Conserv. 2018, 17, 364. [Google Scholar] [CrossRef]
- Maggini, R.; Benvenuti, S.; Leoni, F.; Pardossi, A. Terracrepolo (Reichardia picroides (L.) Roth.): Wild food or new horticultural crop? Sci. Hortic. 2018, 240, 224–231. [Google Scholar] [CrossRef]
- Alexopoulos, A.A.; Assimakopoulou, A.; Panagopoulos, P.; Bakea, M.; Vidalis, N.; Karapanos, I.C.; Petropoulos, S.A. Impact of salinity on the growth and chemical composition of two underutilized wild edible greens: Taraxacum officinale and Reichardia picroides. Horticulturae 2021, 7, 160. [Google Scholar] [CrossRef]
- Lichtentahler, H.K.; Buschmann, C. Chlorophylls and carotenoids; Measurement and characterization by UV-VIS spectroscopy. Curr. Protoc. Food Anal. Chem. 2001, 1, F4-3. [Google Scholar] [CrossRef]
- Hrazdina, G.; Marx, G.A.; Hoch, H.C. Distribution of secondary plant metabolites and their biosynthetic enzymes in pea (Pisum sativum L.) leaves—anthocyanins and flavonol glycosides. Plant Physiol. 1982, 70, 745–748. [Google Scholar] [CrossRef] [Green Version]
- Kang, H.M.; Saltveit, M.E. Antioxidant capacity of lettuce leaf tissue increases after wounding. J. Agr. Food Chem. 2002, 50, 7536–7541. [Google Scholar] [CrossRef] [PubMed]
- Benzie, I.F.F.; Strain, J.J. The ferric reducing ability of plasma (FRAP) as a measure of “Antioxidant power”: The FRAP assay. Anal. Biochem. 1996, 239, 70–76. [Google Scholar] [CrossRef] [Green Version]
- Dudonné, S.; Vitrac, X.; Coutière, P.; Woillez, M.; Mérillon, J.M. Comparative study of antioxidant properties and total phenolic content of 30 plant extracts of industrial interest using DPPH, ABTS, FRAP, SOD, and ORAC assays. J. Agric. Food Chem. 2009, 57, 1768–1774. [Google Scholar] [CrossRef] [PubMed]
- Cataldo, D.A.; Haroon, M.H.; Schrader, L.E.; Youngs, V.L. Rapid colorimetric determination of nitrate in plant tissue by nitration of salicylic acid. Commun. Soil Sci. Plant Anal. 1975, 6, 71–80. [Google Scholar] [CrossRef]
- Gupta, B.; Huang, B. Mechanism of Salinity Tolerance in Plants: Physiological, Biochemical, and Molecular Characterization. Int. J. Genom. 2014, 2014, 701596. [Google Scholar] [CrossRef] [PubMed]
- Ma, Y.; Dias, M.C.; Freitas, H. Drought and Salinity Stress Responses and Microbe-Induced Tolerance in Plants. Front. Plant Sci. 2020, 11, 1750. [Google Scholar] [CrossRef]
- Letchamo, W.; Gosselin, A. Root and shoot growth and chlorophyll content of Taraxacum officinale provenances as affected by defoliation and debudding under organic and hydroponic cultivation. J. Hortic. Sci. 1995, 70, 279–285. [Google Scholar] [CrossRef]
- Dorais, M.; Papadopoulos, A.P.; Luo, X.; Leonhart, S.; Gosselin, A.; Pedneault, K.; Angers, P.; Gaudreau, L. Soilless greenhouse production of medicinal plants in north Eastern Canada. Acta Hortic. 2001, 554, 297–303. [Google Scholar] [CrossRef]
- Léonhart, S.; Pedneault, K.; Gosselin, A.; Angers, P.; Papadopoulos, A.P.; Dorais, M. Diversification of greenhouse crop production under supplemental lighting by the use of new cultures with high economic potential. Acta Hortic. 2002, 580. [Google Scholar] [CrossRef]
- Rouphael, Y.; Petropoulos, S.A.; Cardarelli, M.; Colla, G. Salinity as eustressor for enhancing quality of vegetables. Sci. Hortic. 2018, 234, 361–369. [Google Scholar] [CrossRef]
- Karwowska, M.; Kononiuk, A. Nitrates/nitrites in food—risk for nitrosative stress and benefits. Antioxidants 2020, 9, 241. [Google Scholar] [CrossRef] [Green Version]
- Ahluwalia, A.; Gladwin, M.; Coleman, G.D.; Hord, N.; Howard, G.; Kim-Shapiro, D.B.; Lajous, M.; Larsen, F.J.; Lefer, D.J.; McClure, L.A.; et al. Dietary Nitrate and the Epidemiology of Cardiovascular Disease: Report from a National Heart, Lung, and Blood Institute Workshop. J. Am. Heart Assoc. 2016, 5, e003402. [Google Scholar] [CrossRef] [PubMed]
- The European Commission. Commission Regulation (EU) No. 1258/2011 amending Regulation (EC) No. 1881/2006 as regards maximum levels for nitrates in food stuffs. O. J. Eur. Union 2011, L320, 15–17. [Google Scholar]
- Santamaria, P.; Gonnella, M.; Elia, A.; Parente, A.; Serio, F. Ways of reducing rocket salad nitrate content. Acta Hortic. 2001, 548, 529–536. [Google Scholar] [CrossRef]
- Savo, V.; Salomone, F.; Mattoni, E.; Tofani, D.; Caneva, G. Traditional Salads and Soups with Wild Plants as a Source of Antioxidants: A Comparative Chemical Analysis of Five Species Growing in Central Italy. Evid.-Based Complementary Altern. Med. 2019, 2019, 1–12. [Google Scholar] [CrossRef] [Green Version]
- Alexopoulos, A.A.; Marandos, E.; Assimakopoulou, A.; Vidalis, N.; Petropoulos, S.A.; Karapanos, I.C. Effect of nutrient solution pH on the growth, yield and quality of Taraxacum officinale and Reichardia picroides in a floating hydroponic system. Agronomy 2021, 11, 1118. [Google Scholar] [CrossRef]
Figure 1.
Seedlings of Reichardia picroides after 10 weeks from sowing, ready for transplanting into floating system.
Figure 1.
Seedlings of Reichardia picroides after 10 weeks from sowing, ready for transplanting into floating system.

Figure 2.
Crop yield (left) and leaf content of nitrates (right) in Reichardia picroides plants grown in floating system with different NaCl concentrations in the nutrient solution and sampled four and six weeks after transplanting. Mean values with standard deviation of four replicates. For each sampling date, different letters indicate significant differences at p < 0.05. The results of two-way ANOVA are reported in the right box: ***, significant at p < 0.001; **, significant at p < 0.01 *, significant at p < 0.05; ns, not significant. FW: fresh weight.

Figure 3.
Pearson’s coefficients for quality parameters of the fresh leaf tissues of Reichardia picroides plants grown in floating system with different NaCl concentrations in the nutrient solution (1.7, control; 25; 50; 100 mM) and sampled four and six weeks after transplanting. Four replicates were collected for each treatment and sampling time. Wat: water content; NO3−: nitrates; Chl: total chlorophylls; Car: carotenoids; An: anthocyanins; FG: flavonol glycosides; TP: total phenols; PI: phenol index; FRAP: ferric reducing antioxidant power; DPPH: 2,2‒diphenyl‒1‒picrylhydrazyl radical scavenging activity. * denotes statistical significance at p < 0.05.

Figure 4.
Principal Component Analysis (PCA) for quality parameters of fresh leaf tissues of Reichardia picroides plants grown in floating system with different NaCl concentrations in the nutrient solution (1.7, control; 25; 50; 100 mM) and sampled four and six weeks after transplanting. (A): scree plot; (B): plot of component weights (water content, Wat; total chlorophylls, Chl; carotenoids, Car; flavonol glycosides, FG; total phenols, TP; phenol index, PI; ferric reducing antioxidant power, FRAP; 2,2‒diphenyl‒1‒picrylhydrazyl radical scavenging activity, DPPH; anthocyanins, An; nitrates, NO3); (C): scatterplot of data obtained after the first (large symbols) and second (small symbols) sampling.


Table 1.
Growth parameters for Reichardia picroides plants grown in floating system with different NaCl concentrations in the nutrient solution and sampled at four and six weeks after transplanting.
Table 1.
Growth parameters for Reichardia picroides plants grown in floating system with different NaCl concentrations in the nutrient solution and sampled at four and six weeks after transplanting.
| Sampling Time | NaCl (mM) | Leaf Number | Leaf Biomass | Root Biomass | ||
|---|---|---|---|---|---|---|
| FW (g) | DW (g) | FW (g) | DW (g) | |||
| Four weeks | 1.7 (Control) | 76 ± 18 a | 60.79 ± 18.99 a | 4.932 ± 0.857 a | 10.84 ± 1.35 a | 0.910 ± 0.113 a |
| 25 | 68 ± 16 a | 47.94 ± 18.12 a | 4.541 ± 0.956 a | 13.13 ± 1.26 a | 1.030 ± 0.229 a | |
| 50 | 77 ± 11 a | 46.14 ± 5.73 ab | 4.164 ± 0.817 a | 10.69 ± 1.89 a | 0.893 ± 0.172 a | |
| 100 | 40 ± 8 b | 22.38 ± 5.75 b | 2.545 ± 0.270 b | 9.10 ± 2.68 a | 0.780 ± 0.262 a | |
| Six weeks | 1.7 (Control) | 85 ± 18 a | 84.43 ± 14.70 a | 8.697 ± 1.549 a | 15.64 ± 2.76 a | 1.560 ± 0.165 a |
| 25 | 79 ± 14 ab | 62.23 ± 10.43 b | 6.590 ± 0.970 ab | 17.06 ± 3.47 a | 1.570 ± 0.300 a | |
| 50 | 71 ± 8 ab | 53.53 ± 16.82 b | 6.355 ± 1.004 b | 19.79 ± 5.63 a | 2.063 ± 0.267 a | |
| 100 | 57 ± 10 b | 26.70 ± 12.02 c | 2.841 ± 0.900 c | 7.94 ± 3.89 b | 0.747 ± 0.278 b | |
| Main effects | ||||||
| Four weeks | 65 a | 44.31 b | 4.046 b | 10.94 b | 0.903 b | |
| Six weeks | 73 a | 56.72 a | 5.977 a | 15.11 a | 1.395 a | |
| 1.7 (Control) | 81 a | 72.61 a | 6.568 a | 13.24 a | 1.235 a | |
| 25 | 74 a | 55.08 a | 5.566 a | 15.10 a | 1.300 a | |
| 50 | 74 a | 49.83 ab | 5.259 a | 15.24 a | 1.299 a | |
| 100 | 49 b | 24.54 b | 2.693 b | 8.52 b | 0.763 b | |
| 2-way ANOVA | ||||||
| NaCl concentration | ** | *** | *** | *** | * | |
| Time | ns | * | *** | *** | ** | |
| Interaction | ns | ns | ns | ns | Ns | |
Mean values ± standard deviation of four replicates. For each parameter and sampling time, different letters among the treatments indicate significant difference at p < 0.05. FW: fresh weight; DW: dry weight. Asterisks denote statistical significance according to 2-way ANOVA: ***, significant at p < 0.001; **, significant at p < 0.01 *, significant at p < 0.05; ns, not significant.
Table 2.
Water content, amounts of total chlorophylls, flavonol glycosides and total phenols, and antioxidant capacity of leaf tissues from Reichardia picroides plants grown in floating system with different NaCl concentrations in the nutrient solution and sampled four and six weeks after transplanting.
| Sampling Time | NaCl (m) | Water Content | Total Chlorophylls (mg/kg FW) | Carotenoids (mg/kg FW) | Anthocyanins (mg Cy-3-glu/kg FW) | Flavonol Glycosides (mg Qu-3-glu/ kg FW) | Total Phenols | Antioxidant Capacity | ||
|---|---|---|---|---|---|---|---|---|---|---|
| Folin-Ciocalteu (mg GAE/ kg FW) | Phenol Index (A320/g FW) | FRAP (mmol Fe(II)/ kg FW) | DPPH (% Inhibition/ g FW) | |||||||
| Four weeks | 1.7 (Control) | 0.922 ± 0.010 a | 390 ± 130 a | 86.8 ± 26.6 b | 21.69 ± 2.46 a | 698 ± 81 b | 1167 ± 0.301 b | 7.22 ± 1.29 a | 7.28 ± 1.93 c | 24.57 ± 3.48 a |
| 25 | 0.916 ± 0.012 a | 383 ± 102 a | 92.6 ± 34.7 b | 22.28 ± 4.42 a | 703 ± 185 b | 1314 ± 0.174 ab | 7.28 ± 1.50 a | 9.14 ± 1.49 bc | 25.22 ± 2.48 a | |
| 50 | 0.922 ± 0.007 a | 427 ± 39 a | 139.7 ± 83.6 a | 27.01 ± 3.64 a | 1240 ± 248 a | 1823 ± 0.308 a | 12.04 ± 1.50 a | 12.75 ± 1.79 ab | 33.56 ± 8.00 a | |
| 100 | 0.914 ± 0.012 a | 325 ± 70 a | 103.6 ± 14.0 ab | 23.78 ± 2.91 a | 1182 ± 230 a | 1836 ± 0.329 a | 10.27 ± 1.92 a | 13.50 ± 2.70 a | 35.84 ± 6.55 a | |
| Six weeks | 1.7 (Control) | 0.897 ± 0.003 a | 394 ± 91 a | 109.2 ± 22.3 ab | 24.71 ± 5.21 b | 870 ± 208 a | 1419 ± 213 b | 8.53 ± 1.87 b | 10.38 ± 1.82 b | 30.06 ± 4.82 b |
| 25 | 0.894 ± 0.004 a | 346 ± 36 a | 127.4 ± 34.3 a | 40.15 ± 8.42 a | 1342 ± 277 a | 1995 ± 420 ab | 12.66 ± 3.53 ab | 14.68 ± 3.22 a | 42.58 ± 8.12 ab | |
| 50 | 0.891 ± 0.019 a | 395 ± 111 a | 98.0 ± 22.8 ab | 39.67 ± 6.75 a | 1275 ± 615 a | 1959 ± 685 ab | 12.88 ± 4.56 ab | 14.45 ± 3.93 a | 42.80 ± 11.58 a | |
| 100 | 0.873 ± 0.015 a | 367 ± 77 a | 78.7 ± 6.3 b | 38.84 ± 5.83 a | 1664 ± 633 a | 2296 ± 664 a | 15.28 ± 5.10 a | 16.25 ± 3.94 a | 47.82 ± 10.08 a | |
| Main effects | ||||||||||
| Four weeks | 0.919 a | 381 a | 23.69 b | 956 b | 1535 b | 9.20 b | 10.67 b | 29.80 b | ||
| Six weeks | 0.889 b | 376 a | 35.84 a | 1288 a | 1917 a | 12.34 a | 13.94 a | 40.82 a | ||
| 1.7 (Control) | 0.909 a | 392 a | 23.20 b | 784 b | 1293 b | 7.87 b | 8.83 b | 27.32 b | ||
| 25 | 0.905 a | 365 a | 31.21 ab | 1022 ab | 1655 ab | 9.97 ab | 11.91 ab | 33.90 ab | ||
| 50 | 0.907 a | 411 a | 33.34 ab | 1258 ab | 1891 ab | 12.46 ab | 13.60 a | 38.18 ab | ||
| 100 | 0.894 a | 346 a | 31.31 a | 1423 a | 2066 a | 12.78 a | 14.87 a | 41.83 a | ||
| 2-way ANOVA | ||||||||||
| NaCl concentration | ns | ns | ns | ** | * | ** | * | ** | ** | |
| Time | *** | ns | ns | *** | * | * | ** | ** | *** | |
| Interaction | ns | ns | * | ns | Ns | ns | ns | ns | ns | |
Mean values ± standard deviation of four replicates. For each parameter and sampling time, different letters among the treatments indicate significant difference at p < 0.05. Cy-3-glu: cyanidine-3-gucoside; Qu-3-glu: quercetin-3-glucoside; GAE: gallic acid equivalents; FW: fresh weight. Asterisks denote statistical significance according to 2-way ANOVA: ***, significant at p < 0.001; **, significant at p < 0.01 *, significant at p < 0.05; ns, not significant.
Publisher’s Note: MDPI stays neutral with regard to jurisdictional claims in published maps and institutional affiliations. |
© 2021 by the authors. Licensee MDPI, Basel, Switzerland. This article is an open access article distributed under the terms and conditions of the Creative Commons Attribution (CC BY) license (https://creativecommons.org/licenses/by/4.0/).
Share and Cite
MDPI and ACS Style
Maggini, R.; Benvenuti, S.; Leoni, F.; Incrocci, L.; Pardossi, A. Effects of NaCl on Hydroponic Cultivation of Reichardia picroides (L.) Roth. Agronomy 2021, 11, 2352. https://0-doi-org.brum.beds.ac.uk/10.3390/agronomy11112352
AMA Style
Maggini R, Benvenuti S, Leoni F, Incrocci L, Pardossi A. Effects of NaCl on Hydroponic Cultivation of Reichardia picroides (L.) Roth. Agronomy. 2021; 11(11):2352. https://0-doi-org.brum.beds.ac.uk/10.3390/agronomy11112352
Chicago/Turabian StyleMaggini, Rita, Stefano Benvenuti, Federico Leoni, Luca Incrocci, and Alberto Pardossi. 2021. "Effects of NaCl on Hydroponic Cultivation of Reichardia picroides (L.) Roth" Agronomy 11, no. 11: 2352. https://0-doi-org.brum.beds.ac.uk/10.3390/agronomy11112352
Note that from the first issue of 2016, this journal uses article numbers instead of page numbers. See further details here.