Article

Association Study of Symbiotic Genes in Pea (Pisum sativum L.) Cultivars Grown in Symbiotic Conditions

by
Vladimir A. Zhukov
1,2,3,*,
Aleksandr I. Zhernakov
1,2,
Anton S. Sulima
1,
Olga A. Kulaeva
1,2,
Marina S. Kliukova
1,
Alexey M. Afonin
1,3,
Oksana Y. Shtark
1,2 and
Igor A. Tikhonovich
1,2
1
All-Russia Research Institute for Agricultural Microbiology (ARRIAM), 196608 St. Petersburg, Russia
2
Department of Genetics and Biotechnology, Saint Petersburg State University, 199034 St. Petersburg, Russia
3
Sirius University of Science and Technology, 354340 Sochi, Russia
*
Author to whom correspondence should be addressed.
Submission received: 27 September 2021 / Revised: 8 November 2021 / Accepted: 18 November 2021 / Published: 22 November 2021
(This article belongs to the Special Issue Rhizobial Symbiosis in Crop Legumes: Molecular and Cellular Aspects)

Abstract

:
In garden pea (Pisum sativum L.), several symbiotic genes are known to control the development of mutualistic symbioses with nodule bacteria (NB) and arbuscular mycorrhizal fungi (AMF). Here, we studied whether the allelic state of the symbiotic genes was associated with the growth parameters of pea plants under single inoculation with NB and under double inoculation with NB + AMF. Using different statistical methods, we analyzed the dataset obtained from a pot experiment that involved 99 pea cultivars, 10 of which were characterized as having shortened internodes due to the presence of the natural mutation p.A229T in the developmental gene Le. The plant’s habitus strongly influenced most of the studied growth and yield parameters and the effectiveness of the symbiotic interactions under NB and NB + AMF inoculation. Double inoculation had different effects on Le+ (normal) and le (dwarf) plants with regard to nitrogen and phosphorus content in seeds. Regardless of the Le-status of plants, allelic states of the symbiotic gene LykX encoding the putative receptor of Nod factors (bacterial signal molecules) were shown to be associated with seed number, thousand-seed weight, and pod number at the level of FDR < 0.001, whereas associations of allelic states of the other studied symbiotic genes were less significant.

1. Introduction

The legumes (family Fabaceae) form a peculiar group among plants because they are able to actively interact with a wide range of beneficial soil microorganisms (BSMs), developing three mutually beneficial symbioses: (i) arbuscular mycorrhiza (AM) with fungi of phylum Glomeromycota, (ii) nitrogen-fixing root nodules with rhizobia, so-called legume–rhizobial (LR) symbiosis, and (iii) symbiosis with plant growth-promoting bacteria (PGPB). These symbioses are beneficial for both the host plant and its environment; therefore, legumes are well-suited for cultivation according to the modern concept of sustainable agriculture [1,2]. For successful implementation of this idea, new varieties of legumes that are adapted for effective interaction with microorganisms need to be bred [3,4]. One approach for achieving this goal is the mobilization of plant genetic resources, i.e., searching for valuable alleles of genes that can improve the symbiotic properties and plant growth parameters when introduced in the genotype.
In several species of legumes, numerous symbiotic (Sym) genes were described as necessary for symbioses’ formation and functioning. Using approaches of forward and reverse genetics, over 50 genes were characterized with respect to their role in LR symbiosis and AM development in model legumes Medicago truncatula Gaertn. and Lotus japonicus (Regel.) K. Larsen [5] and crop cultures such as pea (Pisum sativum L.) [6], soybean (Glycine max (L.) Merr.), and common bean (Phaseolus vulgaris L.) [5]. Sym genes are possible candidates for determining the agriculturally important traits in plants grown in symbiotic conditions; indeed, the genomic positions of some Sym genes are similar to the locations of quantitative trait loci (QTLs) related to fruit, root, or nodule traits in M. truncatula [7], Ph. vulgaris L. [8], and L. japonicus [9]. Colocalization with QTLs of seed yield and seed protein content was also demonstrated for some developmental genes of pea, which featured natural mutations that influenced the plant’s habitus (le, causing shortened internodes, and af, causing conversion of leaves into tendrils) [10,11,12,13]. However, no direct role of the genes Le or Af in the development and functioning of either LR symbiosis or AM has been recorded to date.
At present, legume plant breeding is mainly focused on improving the performance of LR symbiosis [3,14,15,16]. The beneficial effect on AM colonization on legumes has also been documented, although it was hardly distinguished from the effect of LR symbiosis [17]; therefore, breeding for improving the effects of AM itself is problematic. For this reason, and because in field conditions plants interact with the indigenous soil microbial community, it was proposed to breed legume crops considering the integral trait called “effectiveness of interactions with beneficial soil microorganisms” (EIBSM) [3,4]. EIBSM is a measure of increase in seed biomass (and/or other agronomically important parameters such as plant biomass, seed protein content, etc.) of plants inoculated with beneficial microorganisms (in pot or field experiments) as compared to uninoculated control [4]. The EIBSM trait was analyzed in 3-year field trials in garden pea, and a total of 26 genotypes were rated according to their ability to increase biomass and yield under complex inoculation with rhizobia (Rh) and AM fungi; thus, high- and low-EIBSM genotypes were identified [3,18]. The molecular mechanisms underlying the manifestation of the EIBSM trait in pea, as well as in other legumes, remain generally undiscovered; however, in our recent studies, we found that high-EIBSM genotypes (also referred to as highly responsive to inoculation with BSM), in contrast to low-EIBSM ones (low responsive), tended to prolong the seed-filling stage under double inoculation with Rh and AM and demonstrated stricter control over microorganisms in roots [19,20].
Over 20 years ago, a pot experiment was conducted at ARRIAM (St. Petersburg, Russia) [21] in which several growth parameters of 99 pea cultivars were evaluated in conditions of (i) single inoculation with rhizobia and (ii) double inoculation with Rh + AM. However, a thorough analysis of the obtained dataset was not performed; thus, we aimed to conduct a deeper analysis of the earlier data with the use of appropriate statistical methods. Also, in our new experiment, we tested whether the allelic state of known Sym genes influenced the growth parameters of pea plants under single and double inoculation and whether the particular allelic variants were associated with increases in any of the investigated parameters under double inoculation as compared to a single inoculation. We found an impact of plant habitus (related to the allelic state of the Le gene) on values of most parameters, including AM-treatment-caused increments. Further, we identified nonsynonymous SNVs (single nucleotide variants) is some Sym genes with statistically significant association with several parameters and with the AM-treatment-caused increment in the thousand-seed weight (TSW).

2. Materials and Methods

2.1. Plant Material

Pea (Pisum sativum L.) cultivars were obtained from the Pea World Germplasm Collection of the N.I. Vavilov All-Russian Institute of Plant Genetic Resources (VIR, St. Petersburg, Russia). The list of accessions with their morphological characteristics is presented in Supplementary Table S1. The low (stem length about 30 cm) determinate pea (P. sativum) cv. Finale (Cebeco, Rotterdam, The Netherlands), having stable yields and wide adaptation [22], was used as a reference genotype for AM development.

2.2. Microorganisms

The fungal isolate Rhizophagus irregularis BEG144 (Syn. Glomus intraradices strain 8) used in the study was previously characterized as forming highly effective AM symbioses with many agricultural crops [23]. The isolate was initially provided by the International Bank for the Glomeromycota (Dijon, France) and was maintained in alternating Plecthrantus australis and Sorghum spp. pot cultures.
The nodule bacteria strain Rhizobium leguminosarum bv. viciae RCAM 1026 [24], characterized by high efficiency and competitiveness, was used for inoculation in the vegetation experiment.

2.3. Vegetation Experiment for Assesment of the Symbiotic Effectiveness of 99 Pea Cultivars

The experiment conducted by Yakobi et al. [21] was carried out in a greenhouse at ARRIAM (Pushkin, St. Petersburg, Russia) in a randomized complete block design in three replicates (five plants per pot for each treatment variant (Rh or Rh + AM)). Humus horizon of sod podzolic light-loamy fallow soil as growth substrate: pH (KCl) = 4.9, organic matter 3%, available phosphorus 1.26 mg/100 g of soil (extraction with 0.2 N HCl). Air-dried soil was sterilized by autoclaving (1 h, 2 atm), supplemented with CaCO3 (pur. ≥ 98.5%, Lenreactiv, St. Petersburg, Russia) (1.65 g per 1 kg of soil), and mixed with sterile quarry quartz sand (Fraction 0–0.63 mm, SiO2 ≥ 80%, Russia) (1:1 v/v). No fertilizers were added to the substrate.
The isolate BEG144 of Rhizophagus irregularis was propagated on the roots of Sorghum vulgare Pers. Root–soil mixture after vegetation of S. vulgare with or without AM (15 g per each pea plant) was used for inoculation as AM+ and AM− variants. All plants were also inoculated with the R. leguminosarum strain RCAM 1026 in amounts of 107 CFU (colony-forming units) per plant.
Plants were grown in pots with 4.2 kg of the substrate in three replicates for each treatment. The pots were arranged in three blocks such that each treatment was replicated once in each block and the cultivars were randomly located within a block. Pots in which some plants prematurely died were excluded from the analysis, so that no fewer than 10 plants per variant of treatment were analyzed.
Plants were harvested for the analysis of growth parameters at the stage of complete seed maturation (approximately 3 months post inoculation). Nitrogen content in seeds was determined using the Kjeldahl method, and phosphorus content in seeds was determined photocolorimetrically [21].

2.4. SNVs Detection and Cultivar Screening

For SNP analysis in our new experiment, the genomic DNA was extracted from one-week old pea seedlings (3–5 seeds of each cultivar). Fresh plant tissue was disrupted between glass beads using FastPrep-24 grinder (MP Biomedicals, Irvine, CA, USA). This was followed by lysis and DNA extraction with in-house made CTAB buffer: CTAB 2% (w/v) (pur., Sisco Research Laboratories, Mumbai, India), NaCl 1.4 M (puriss., Lenreactiv), Tris Cl (pH 8.0) 0.1 M (pur., Acros Organics, Geel, Belgium), EDTA 20 mM (puriss. spec., Lenreactiv). The supernatant was twice purified with chloroform (pur., Lenreactiv), and DNA was precipitated with fresh, distilled, ice-cold ethanol (MedChimProm, Balashikha, Russia) and dissolved in Milli-Q water.
In order to test whether the allelic state of symbiotic genes affected the properties of pea plants grown in symbiotic conditions, the set of eight genes that act during the development of root nodules and AM was selected (see Table 1).
Using the extracted total DNA, for cultivars k-925, k-1693, k-3064, k-3358, k-7128, and k-8274, the fragments of the genes of interest were PCR amplified using a T100 PCR Thermal Cycler (Bio-Rad Laboratories, San Francisco, CA, USA) for subsequent sequencing. The primers for amplification were designed based on transcript sequences presented in available pea transcriptome assemblies and sequence databases in accordance with the putative exon–intron structures of the genes constructed based on the structures of homologous genes of M. truncatula (see Supplementary Materials Gene structure schemes). For amplification, we used a Tersus polymerase PCR kit (Evrogen, Moscow, Russia). The optimal annealing temperature for each primer pair was determined empirically in test amplifications. The sequences of primers and the used primer pairs and gene structures are presented in Supplementary Materials Gene structure schemes. The obtained amplicons were sequenced on an ABI Prism 3500XL (Thermo Fisher Scientific, Waltham, MA, USA) with the usage of the original sequencing kit supplied by the manufacturer of the sequencer.
The genomic sequences were assembled into contigs and truncated to CDSs (see Supplementary Sequences). From CDSs translated into peptides, the nonsynonymous SNVs were identified. For the detection of the missense variants in cultivars, we developed CAPS and dCAPS (cleaved amplified polymorphic sequence/derived CAPS [25]) markers suitable for DNA genotyping (Supplementary Table S2).
The target DNA fragments were PCR amplified on the matrix of total DNA using Taq-polymerase-based ScreenMix (Evrogen) individually for each cultivar and digested by corresponding restriction endonucleases in the conditions recommended by the manufacturer. The analysis of the restriction patterns was performed either by agarose gel electrophoresis (the mode was selected individually for each marker) or with use of the MultiNA microchip electrophoresis system (Shimadzu, Kyoto, Japan) using the original DNA-500 or DNA-1000 kits (Shimadzu).
In total, 93 cultivars were screened using the created markers, and the allelic state of each marker was determined. Along with Sym-genes, the gene Le, which encodes gibberellin 3-beta-dioxygenase 1 and defines the stem length in pea [26], was included in the study. Earlier sequencing data of the first exons of LysM-RLK (LysM-containing receptor-like kinase) genes Sym37, K1, and LykX on the same set of 93 pea genotypes [27] were also added to the dataset.
Table 1. The Sym genes selected for association analysis.
Gene IdentifierAccessionDescription
IGN1 [28]KR047192Ankyrin-repeat protein with transmembrane regions
GICP01056763 1
SEN1 [29]KY888171Control of rhizobial differentiation
GDTM01047803 2
SST1 [28]KC008603Symbiotic sulphate transporter
GDTM01043951 2
Sym29AJ495759CLAVATA1-like receptor
GICP01072631 1
STR1GICP01133083 1ABC transporter G family member STR, required for arbuscule development
STR2GICP01179536 1ABC transporter G family member STR, required for arbuscule development
AMT2;3PsCam053936 3Ammonium transporter
AMT2;5GICP01050721 1Ammonium transporter
1—accession from NCBI Nucleotide Database from pea transcriptome shotgun assembly GICP00000000 [30]; 2—accession from NCBI Nucleotide Database from pea transcriptome shotgun assembly GDTM00000000 [31]; 3—accession from “Pisum sativum Gene Atlas” [32].

2.5. Statistical Analysis

Statistical analysis included correlation analysis, t-tests, F-tests, ANOVA, and regression analysis. For multiple comparisons, FDR correction was applied. In regression analysis, the LRT (likelihood ratio test) was used for variable significance testing. All statistical analyses were performed using R Statistical Software (version 3.5.3).

2.6. Analysis of AM Development

In order to analyze AM development, a new experiment was carried out in nurse pots. Nurse pots of chives (Allium schoenoprasum L.) with established AM were prepared (see [33] for details), which provided an efficient inoculation procedure for P. sativum plants, including synchronization of root colonization by R. irregularis.
Pea seeds were surface disinfected as follows: 1 min in 96% ethanol (MedChimProm), a rinse with sterile water, 8 min in a 5% NaClO aqueous solution (“Belizna”, Kaustik, Volgograd, Russia), and a thorough rinse with sterile water. Disinfected pea seeds were germinated on sterile humid vermiculite in Petri dishes for 3 days at 27 °C in the dark. Three seedlings of equal size were planted into each nurse pot around a 12-week-old mycorrhizal chive plant (3 pots per genotype). Three hundred milliliter ceramic flowerpots, with silica-rich marl mineral substrate (“Barsik”, NPO Novye Tehnologii Ltd., Krasnodar, Russia) and supplemented with 1 g/L calcium orthophosphate (pur., Lenreactiv) were used. Pots with substrate were sterilized by autoclaving for 60 min at 134 °C and 0.22 MPa. Plants were grown in a growth chamber (model VB 1514, Vötsch Industrietechnik GmbH, Balingen-Frommern, Germany) under the following conditions: day/night, 16/8 h; temperature, 24/22 °C; relative humidity, 75%. Plants were supplemented once a week with ½-strength Hoagland’s solution [34] without phosphate (50 mL per pot) and watered as needed. The experiment was carried out in two replicates.
Pea plants were harvested at 21 days of cocultivation with A. schoenoprasum in the nurse pots. Root systems were washed in cold tap water, and several randomly selected lateral roots with total lengths of approximately 50–100 cm were collected individually from each system. Root samples were cleared with 10% KOH and stained with black ink (Sheaffer Manufacturing Co., LLC, Ft. Madison, IA, USA) according to Vierheilig et al. [35]. After staining, the roots were washed once with distilled water and covered in glycerol (pur., Lenreactiv); 30 cm of root fragments for each plant was laid out on a glass slide, covered with a second slide, and squashed. AM development was examined using a light microscope (Axiovert 35, Zeiss, Jena, Germany). AM development was quantitatively assessed according to Trouvelot et al. [36]: F% = frequency of mycorrhizal colonization (which reflects the proportion of mycorrhized root fragments among all those analyzed), M% = intensity of mycorrhizal colonization (which reflects the proportion of the root length colonized by the fungus), a% = arbuscule abundance in mycorrhizal root fragments (which characterizes the functional state of the fungus), and A% = saturation of the root system with arbuscules (A% = M × a/100). For statistical analysis, the parameters were subjected to arcsine transformation to normalize data.

3. Results

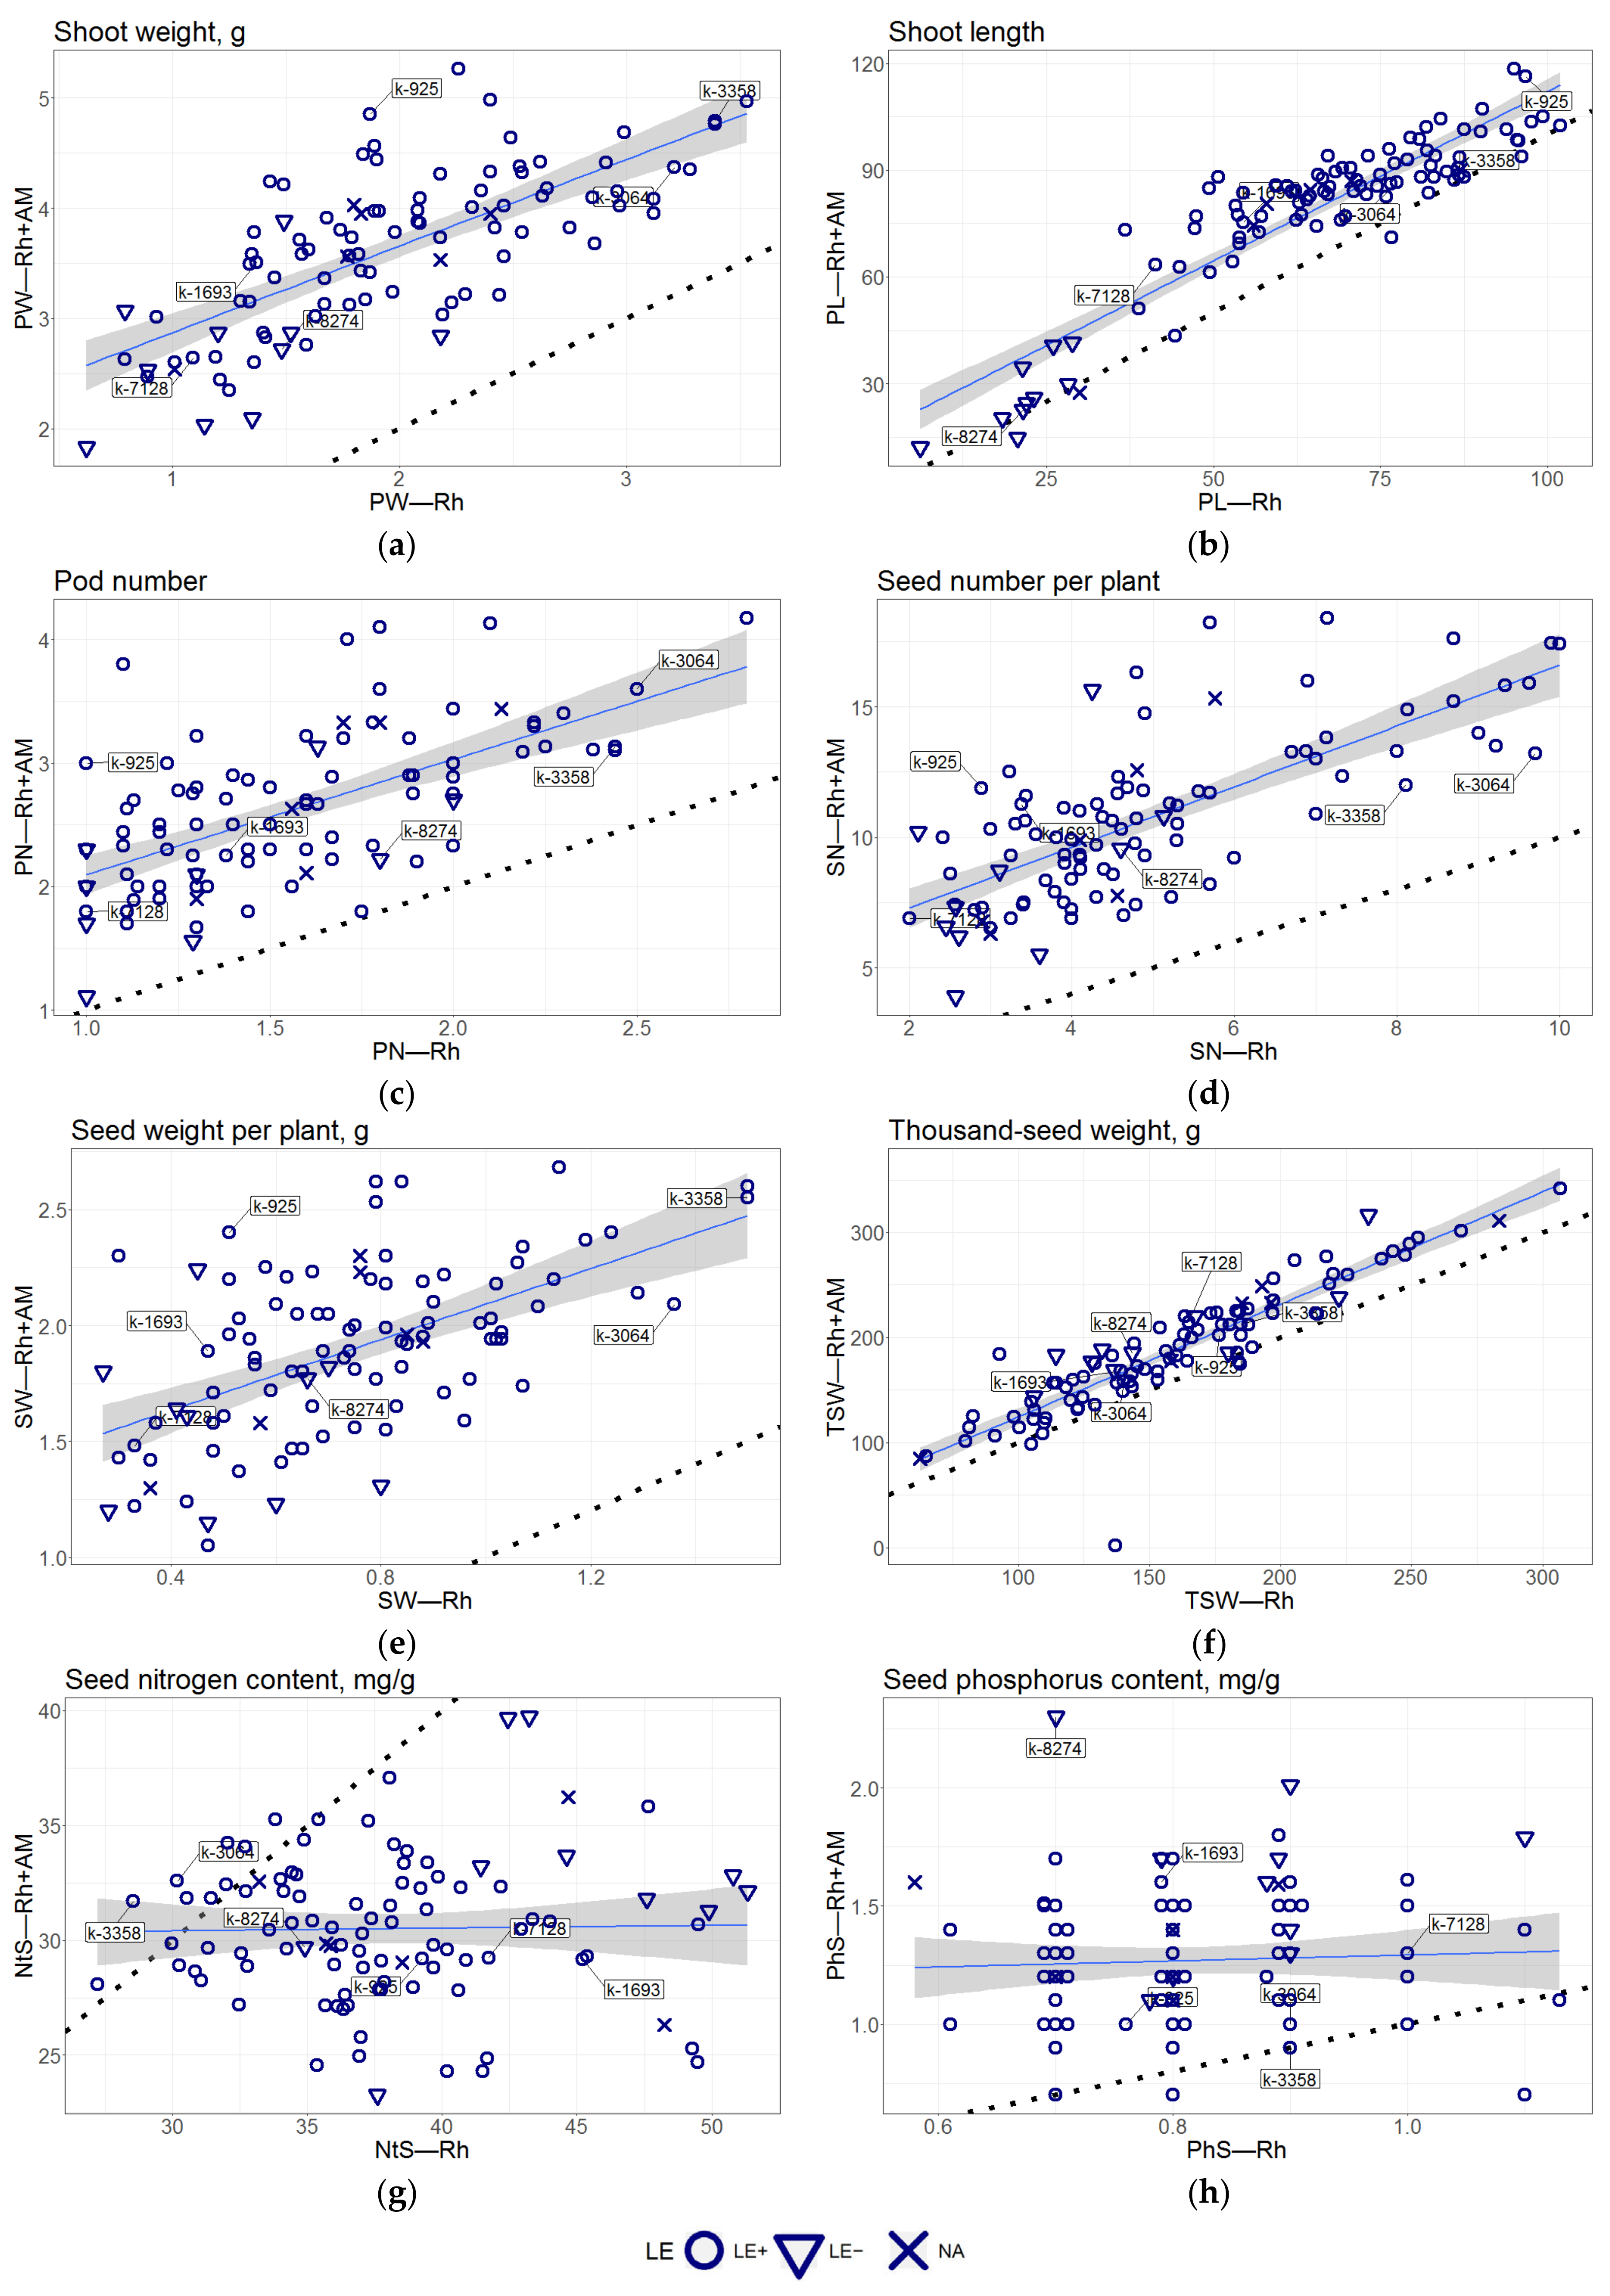
3.1. General Description of the Dataset

The dataset contains the mean values of eight traits measured for 99 cultivars (see Supplementary Table S1) grown in pots with presterilized soil under two conditions: inoculation with rhizobia (hereinafter Rh) and inoculation with rhizobia and arbuscular mycorrhizal fungi (hereinafter Rh + AM).
The effect of mycorrhization on the analyzed parameters was well pronounced (Figure 1; Table 2); the paired samples t-test persuasively (p-value < 1.17 × 10⁻²¹) showed differences for all parameters (see Table 3). The increments were positive for all parameters except NtS. The relative increase due to mycorrhization varied from 20% for TSW to 183% for SW, and for NtS, a relative decrease of −18% was observed (Table 2).

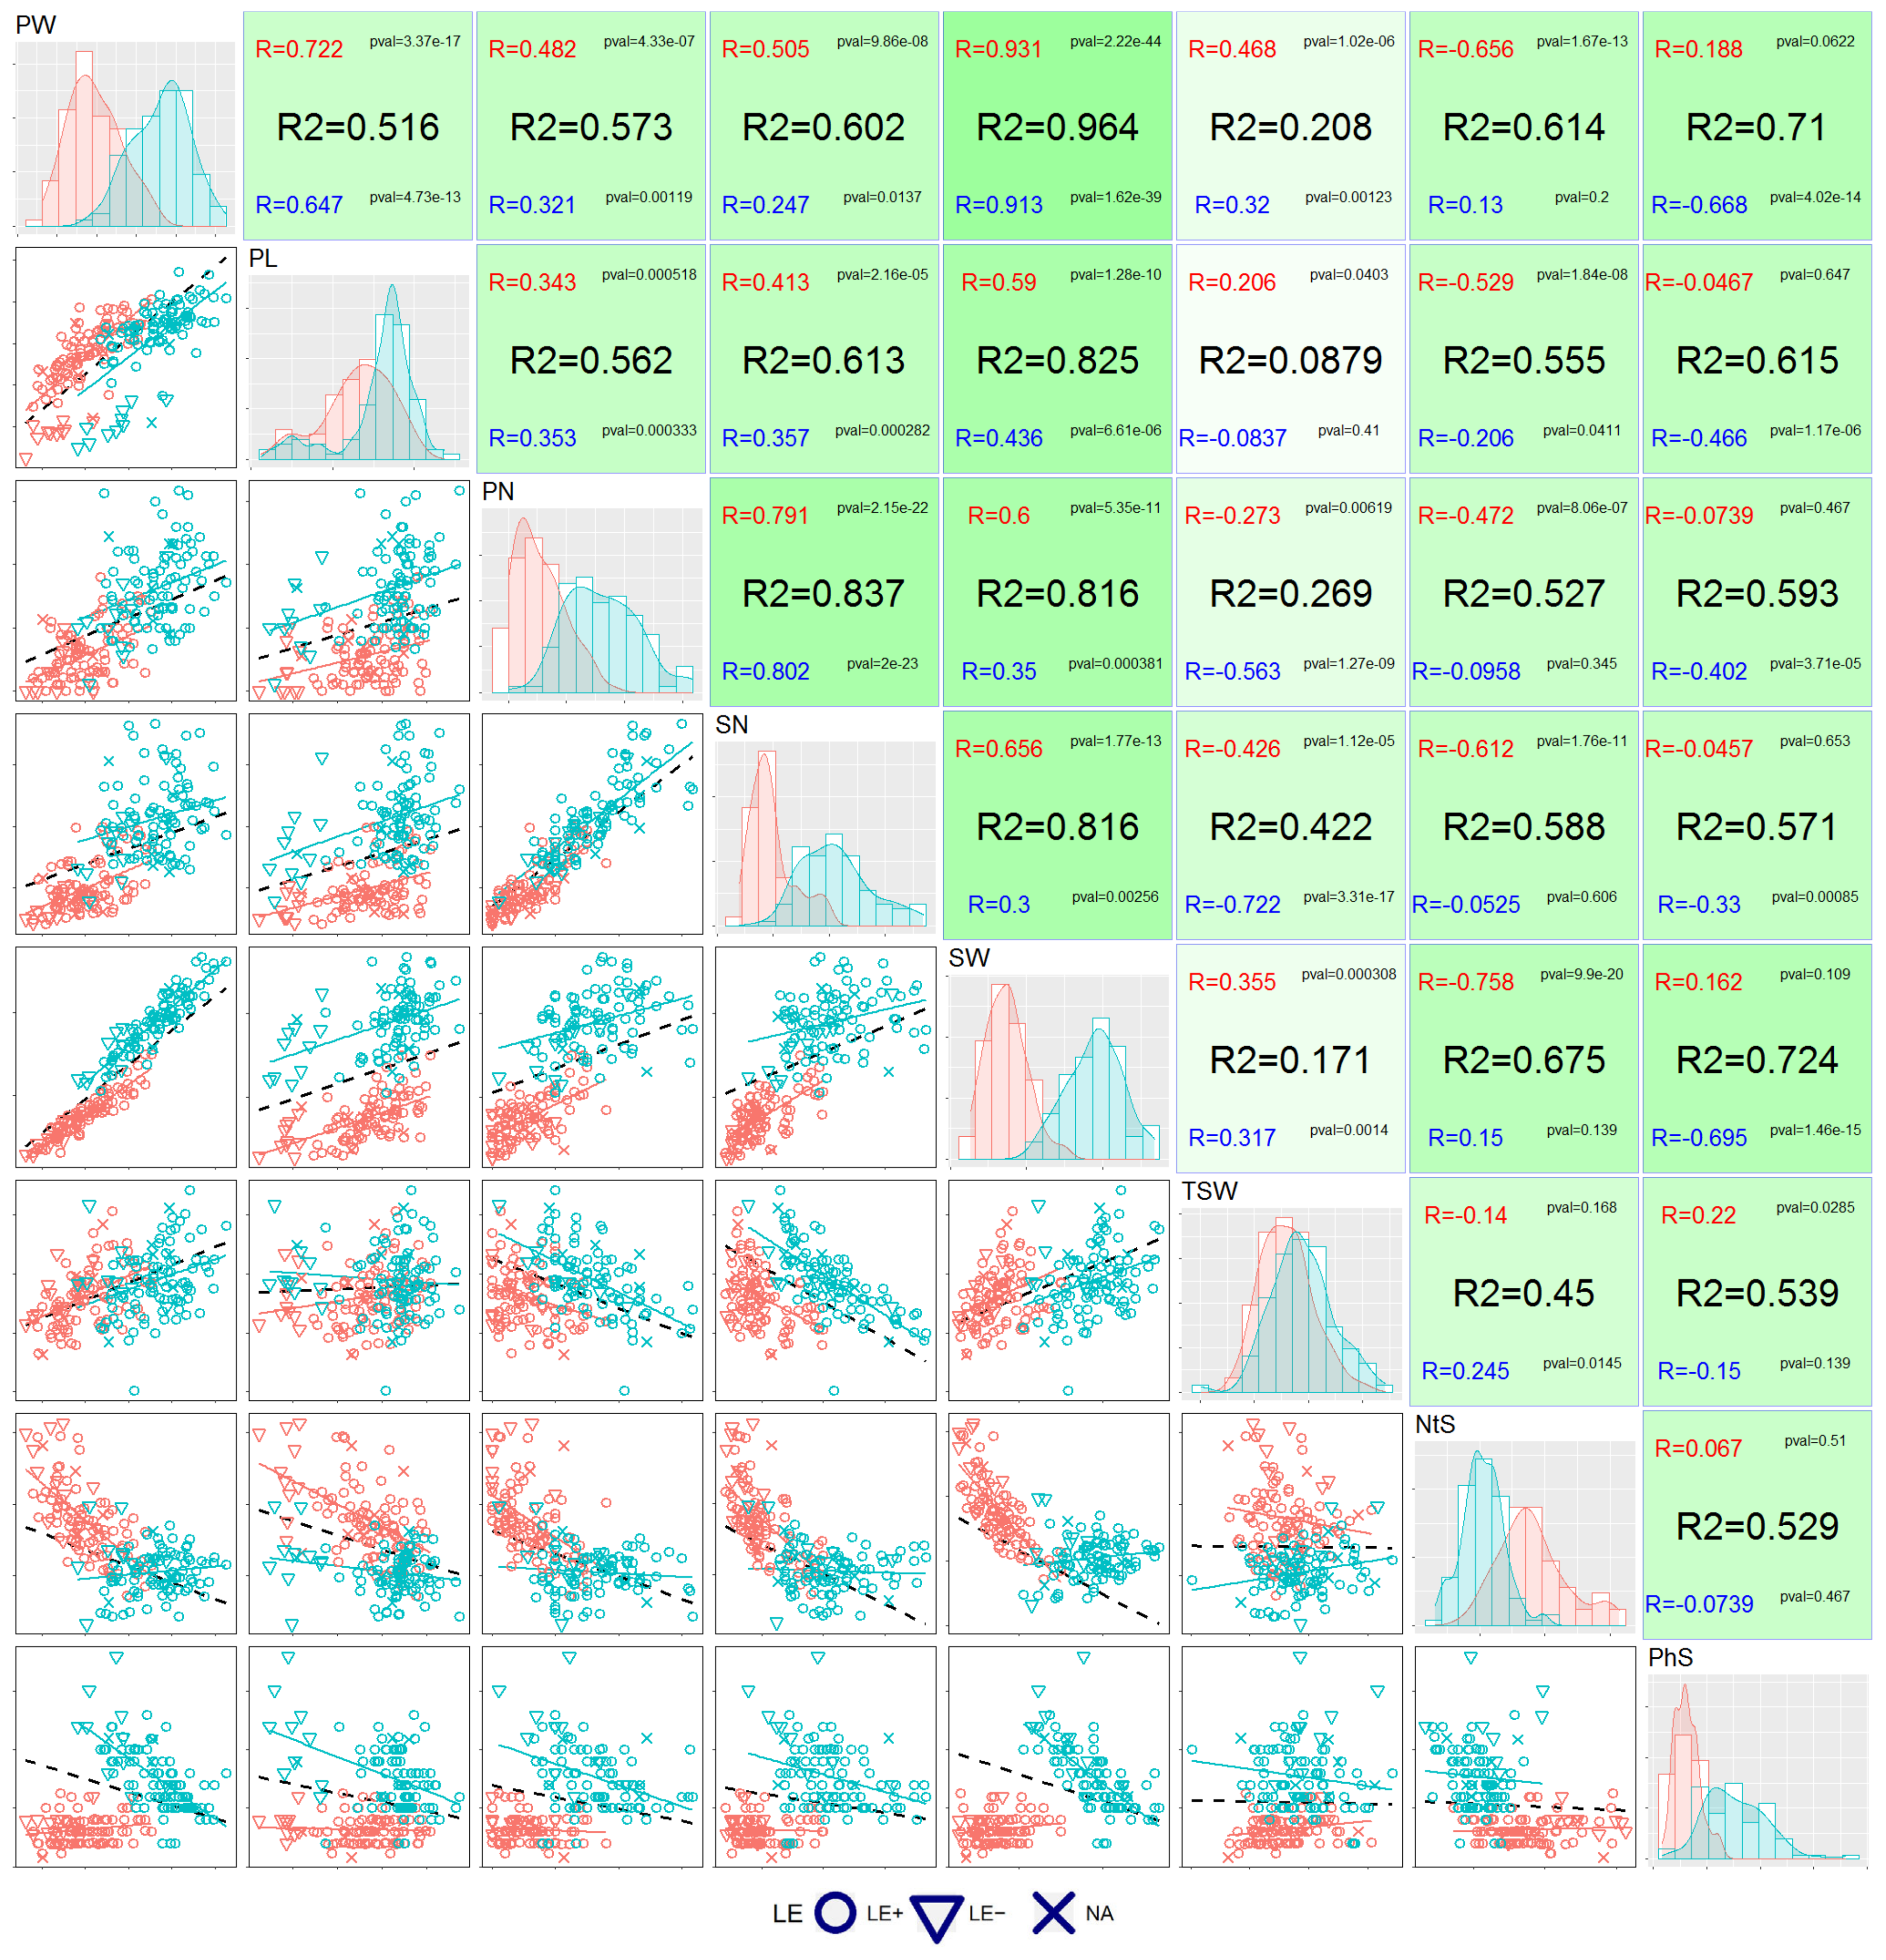
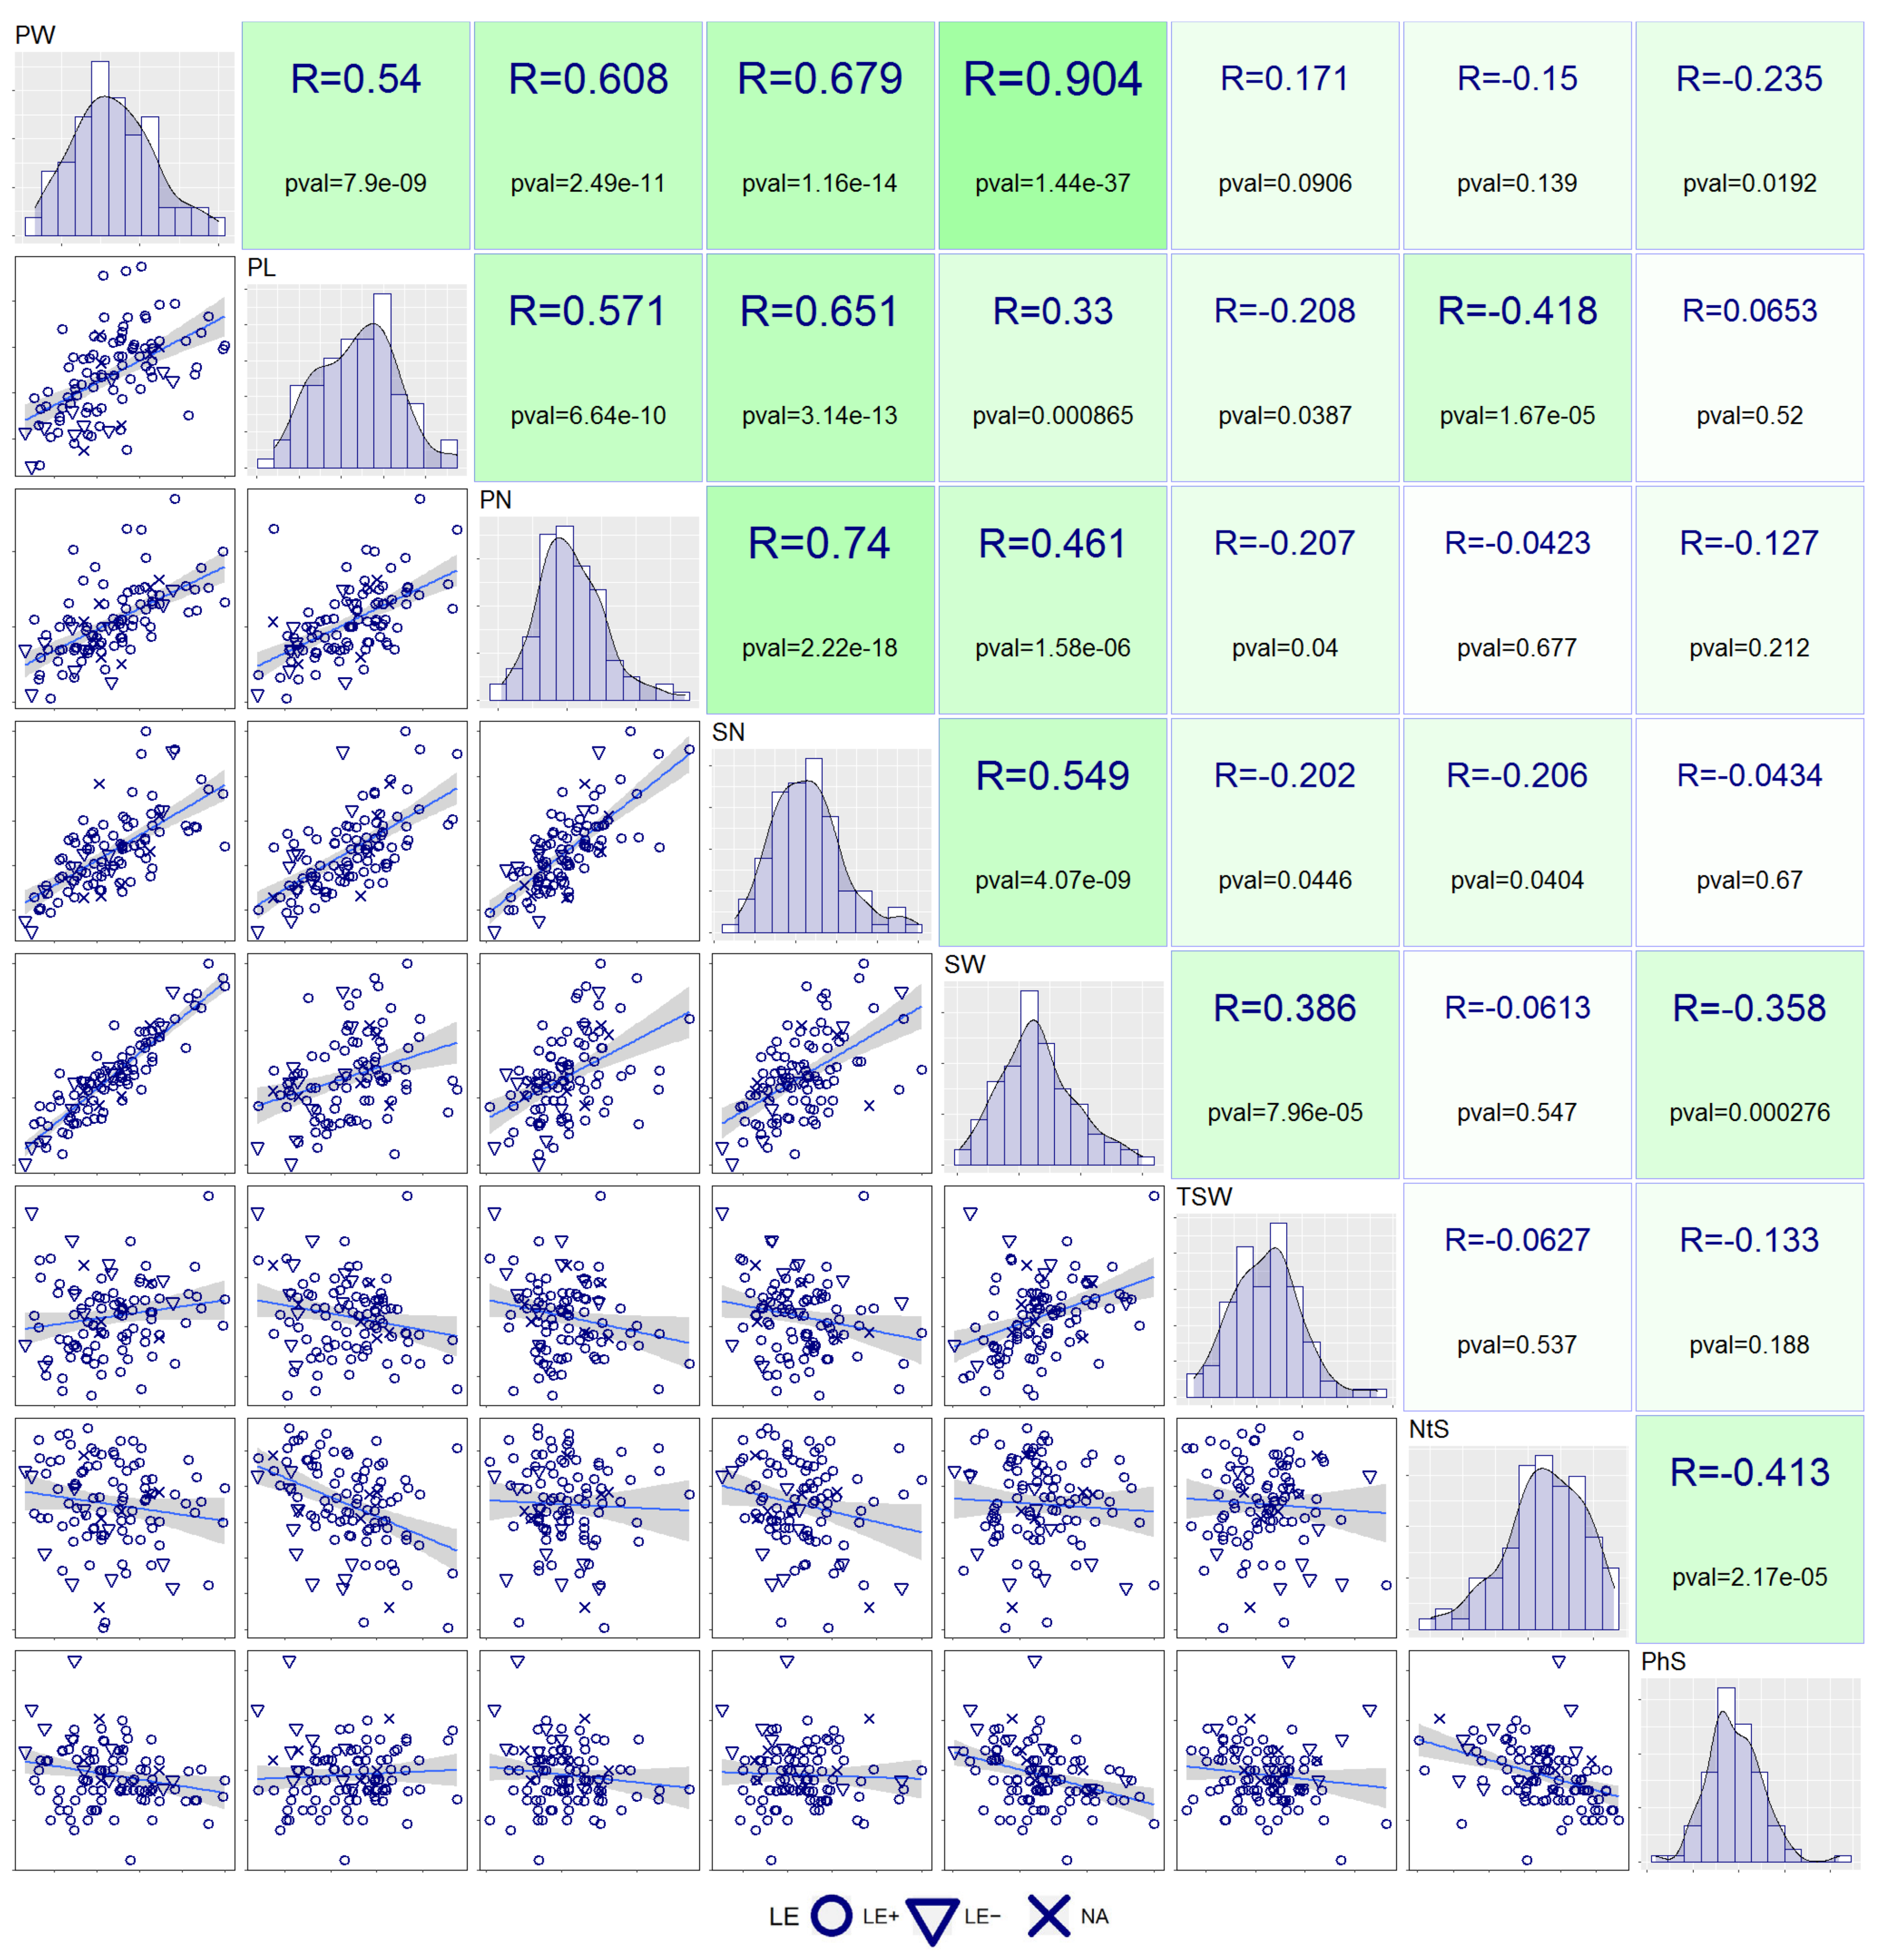
3.2. Correlation Analysis

As was previously seen [21], a significant correlation between values in Rh and Rh + AM treatments was found for most traits (see Table 3) except for NtS (R = 0.019, p-value = 0.85) and PhS (R = 0.052, p-value = 0.611). According to the F-test, for the plant growth traits PW and PL and for the TSW, the sample variance was similar between Rh and Rh + AM treatments (Table 3), which indicates that the addition of AM evenly influenced these traits in all cultivars (i.e., mycorrhization shifted only the mean values while the variance remained the same) (Figure 1). In the case of the traits PN, SN, and SW, mycorrhization significantly affected the variance (Table 3), indicating that the variability of the tested pea cultivars by these parameters was high and could be a subject of breeding work.
Similarly, the coefficient of determination (R2), which reflects the proportion of the variance that can be explained by the individual genetic features of the cultivars (regardless of the treatment), was shown to be high for the parameters PL and TSW (82.6% and 88.5%, respectively). Indeed, AM treatment increased the values of the parameters by approximately 20% only (Table 2). For the traits PN, SN, and SW, the coefficient of determination was much lower (Table 3), indicating that the AM treatment influenced these parameters differently in different cultivars.
To evaluate the correlations between traits within experimental treatments, we performed (1) Pearson correlation analysis under both experimental conditions (Rh and Rh + AM inoculation) and (2) regression analysis with a model combining both conditions as a factor. The scatter plots, correlation coefficients (R), and coefficients of determination (R2) are presented in Figure 2. The values of PW, PL, PN, SN, and SW were significantly correlated with one another under both experimental conditions. The SW trait demonstrated the strongest correlation with other mentioned traits, PW, PL, PN and SN, with a level of determination reaching 96% for PW. Further, this group of parameters showed an interesting pattern of relationship with nitrogen content (NtS) and phosphorus content (PhS) in seeds: a negative correlation with NtS and no correlation with PhS under Rh inoculation (Figure 2), and, oppositely, no significant correlation with NtS (except weak negative correlation for PL) and negative correlation with PhS under double inoculation with Rh + AM. The TSW trait had the least relation with other parameters, which is in line with the observation that seed size is highly genetically determined and is faintly affected by mycorrhizal fungi. However, the values of TSW positively correlated with PL and PW and negatively correlated with PN and SN (Figure 2).
Alongside correlation between traits, we estimated correlations between absolute AM-caused trait increments (ΔT = TRh.AM − TRh) for all traits (see Figure 3). The increments were significantly positively correlated in the group of ΔPW–ΔPL–ΔPN–ΔSN–ΔSW, indicating that the values of these parameters increased together upon AM inoculation. Also, weak positive correlation was found for ΔSW–ΔTSW, and negative correlations were obtained for ΔSW–ΔPhS, ΔNtS–ΔPhS, and ΔNtS–ΔPL.
Some AM-caused trait increments (Δ) also correlated with values of corresponding traits in Rh conditions (Figure 4), and this relationship became clearer when the relative increments (α = ΔT/TRh) were considered (Supplementary Figure S1). The latter relations were not linear and fit the exponential approximation (except NtS, for which the best approximation was linear). Generally, the plants with lesser values of traits in the absence of AM were characterized by higher relative increments of these traits due to mycorrhization.
In the αPL–PL-Rh plot, we noticed a separation of dots into two clusters corresponding to short and tall plants, and the shorter plants were characterized by wider spread of αPL. In pea, one of the genes that determine the stem length is Le, which encodes gibberellin 3-beta-dioxygenase [26]. The natural mutation le (p.A229T) causes shortening of the internodes, while an intact copy of the gene determines the normal length of internodes and a whole plant. We genotyped cultivars by Le allele (Supplementary Table S3, see below) and used its allelic state as a factor in regression models connecting traits’ absolute and relative increments with trait values. The results showed that the Le/le allele status affected absolute increments of SW, PL, TSW, NtS, and PhS (p-value < 0.05) and relative increments of PW, PL, PN, TSW, NtS, and PhS (p-value < 0.05) (Supplementary Figure S1), which implies that plant length might influence pea responsivity to AM inoculation. However, it is worth noting that le cultivars accounted for only approximately 10% of the analyzed pea genotypes. Therefore, further analysis of a set of pea cultivars with equal ratio of Le+le plants is needed to support the present result.

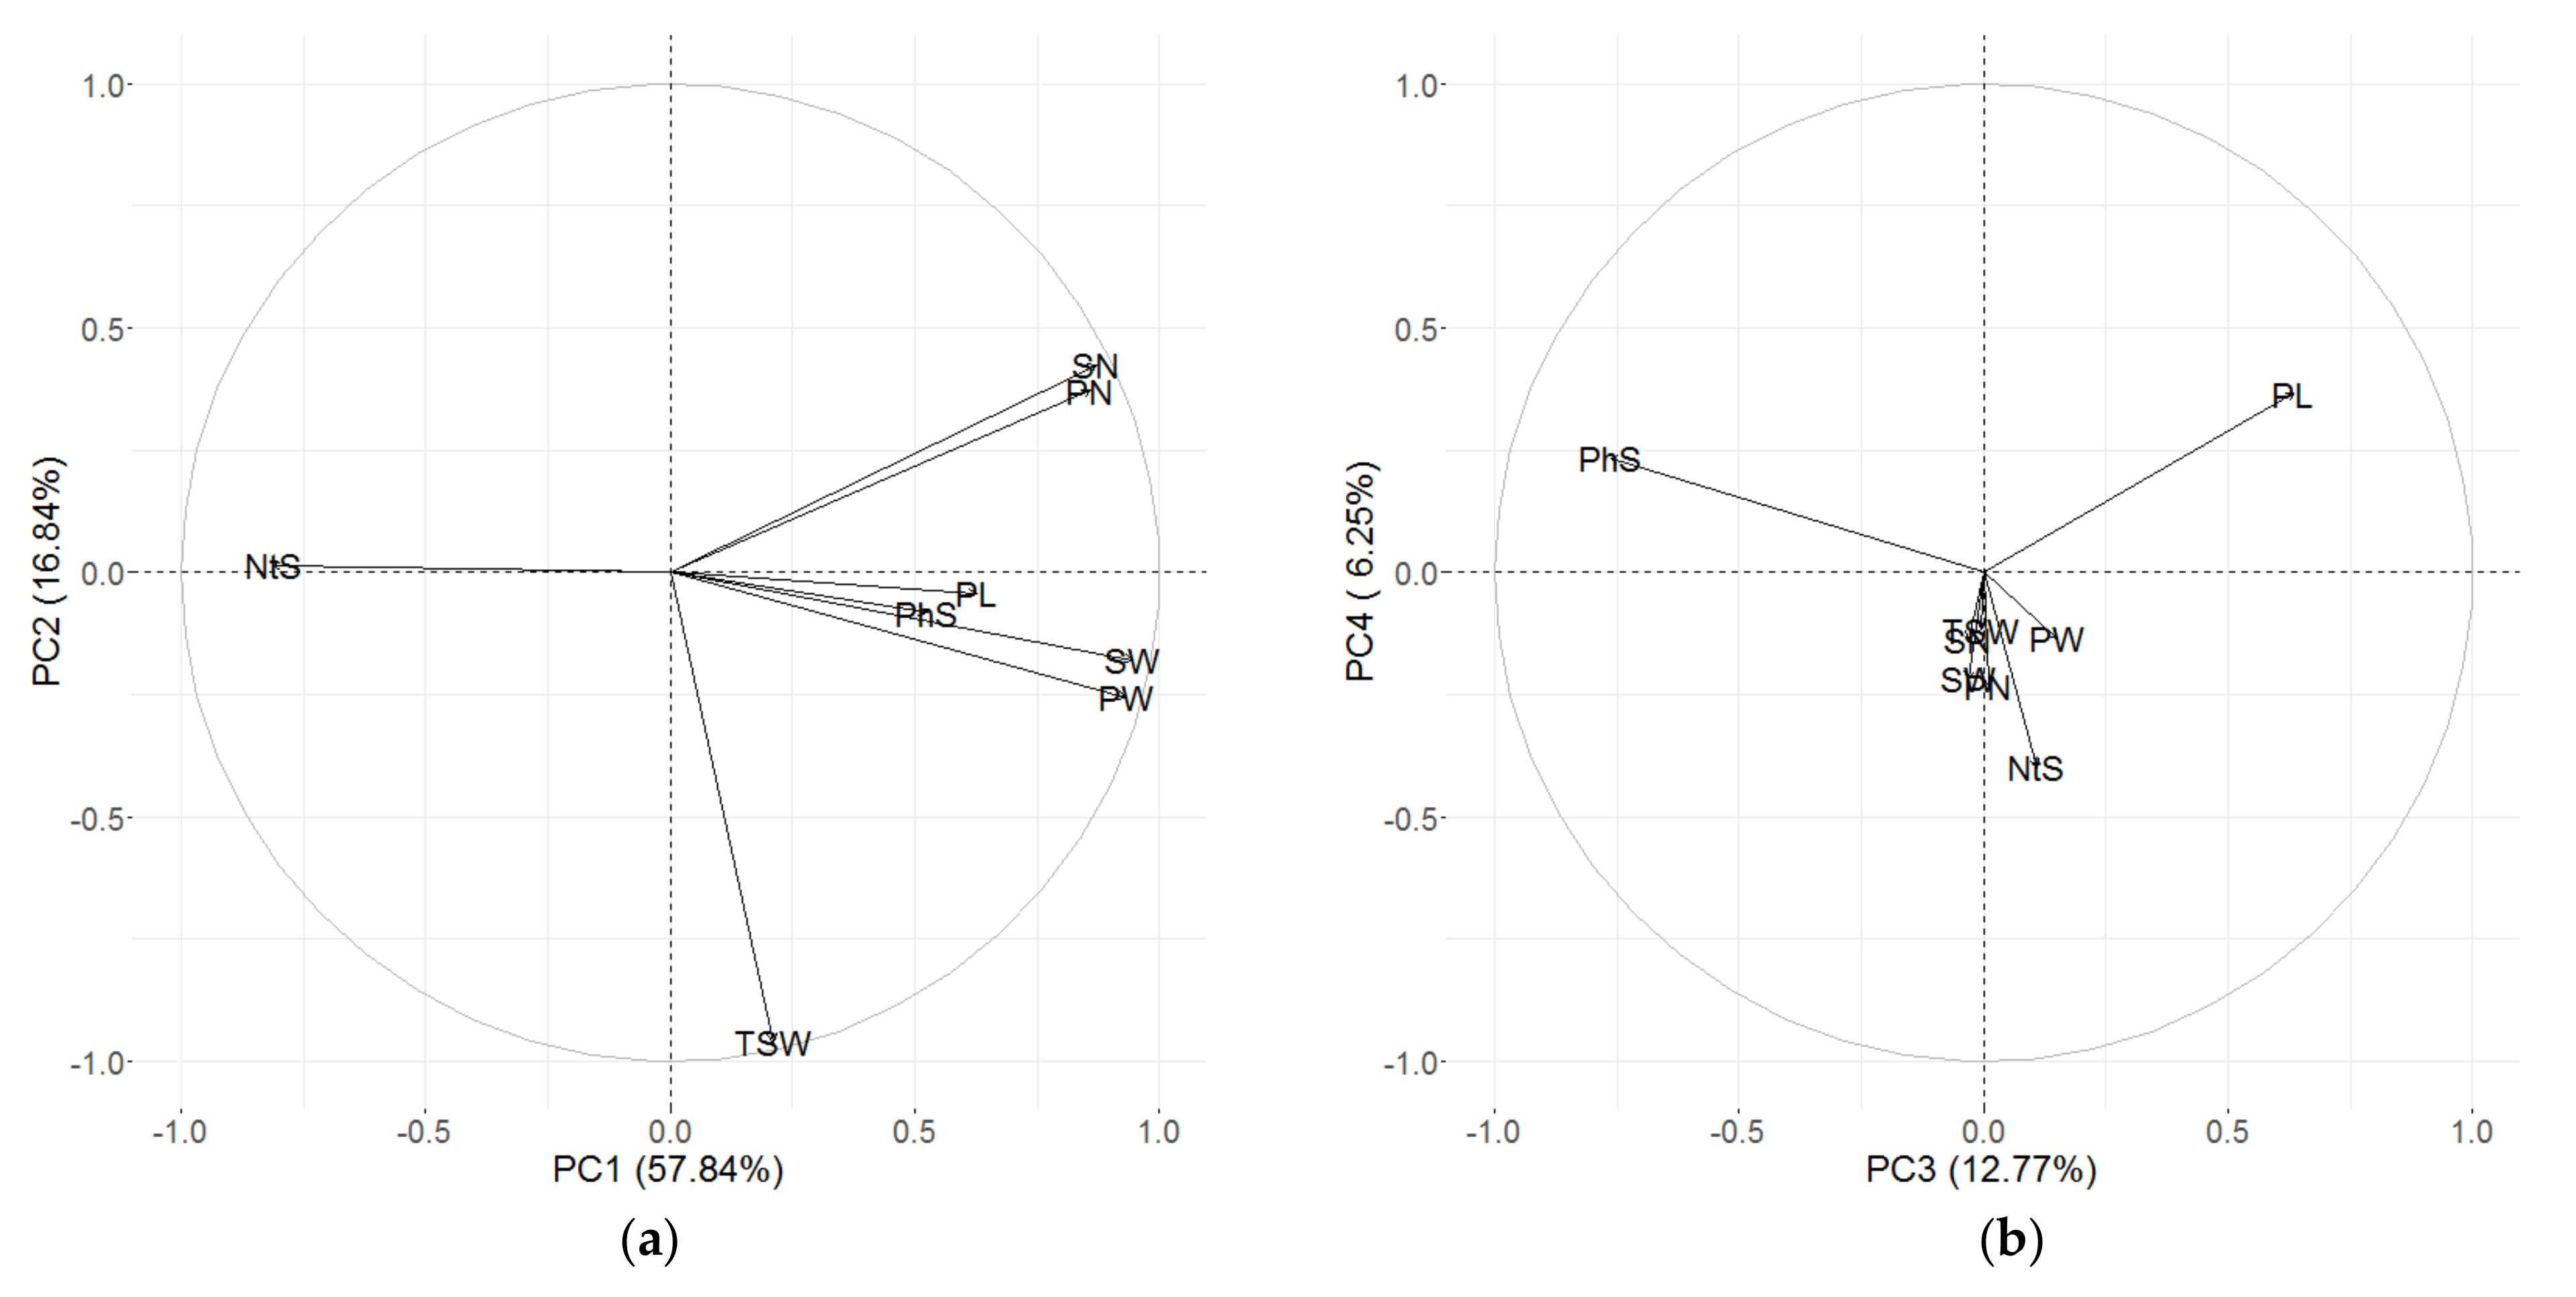
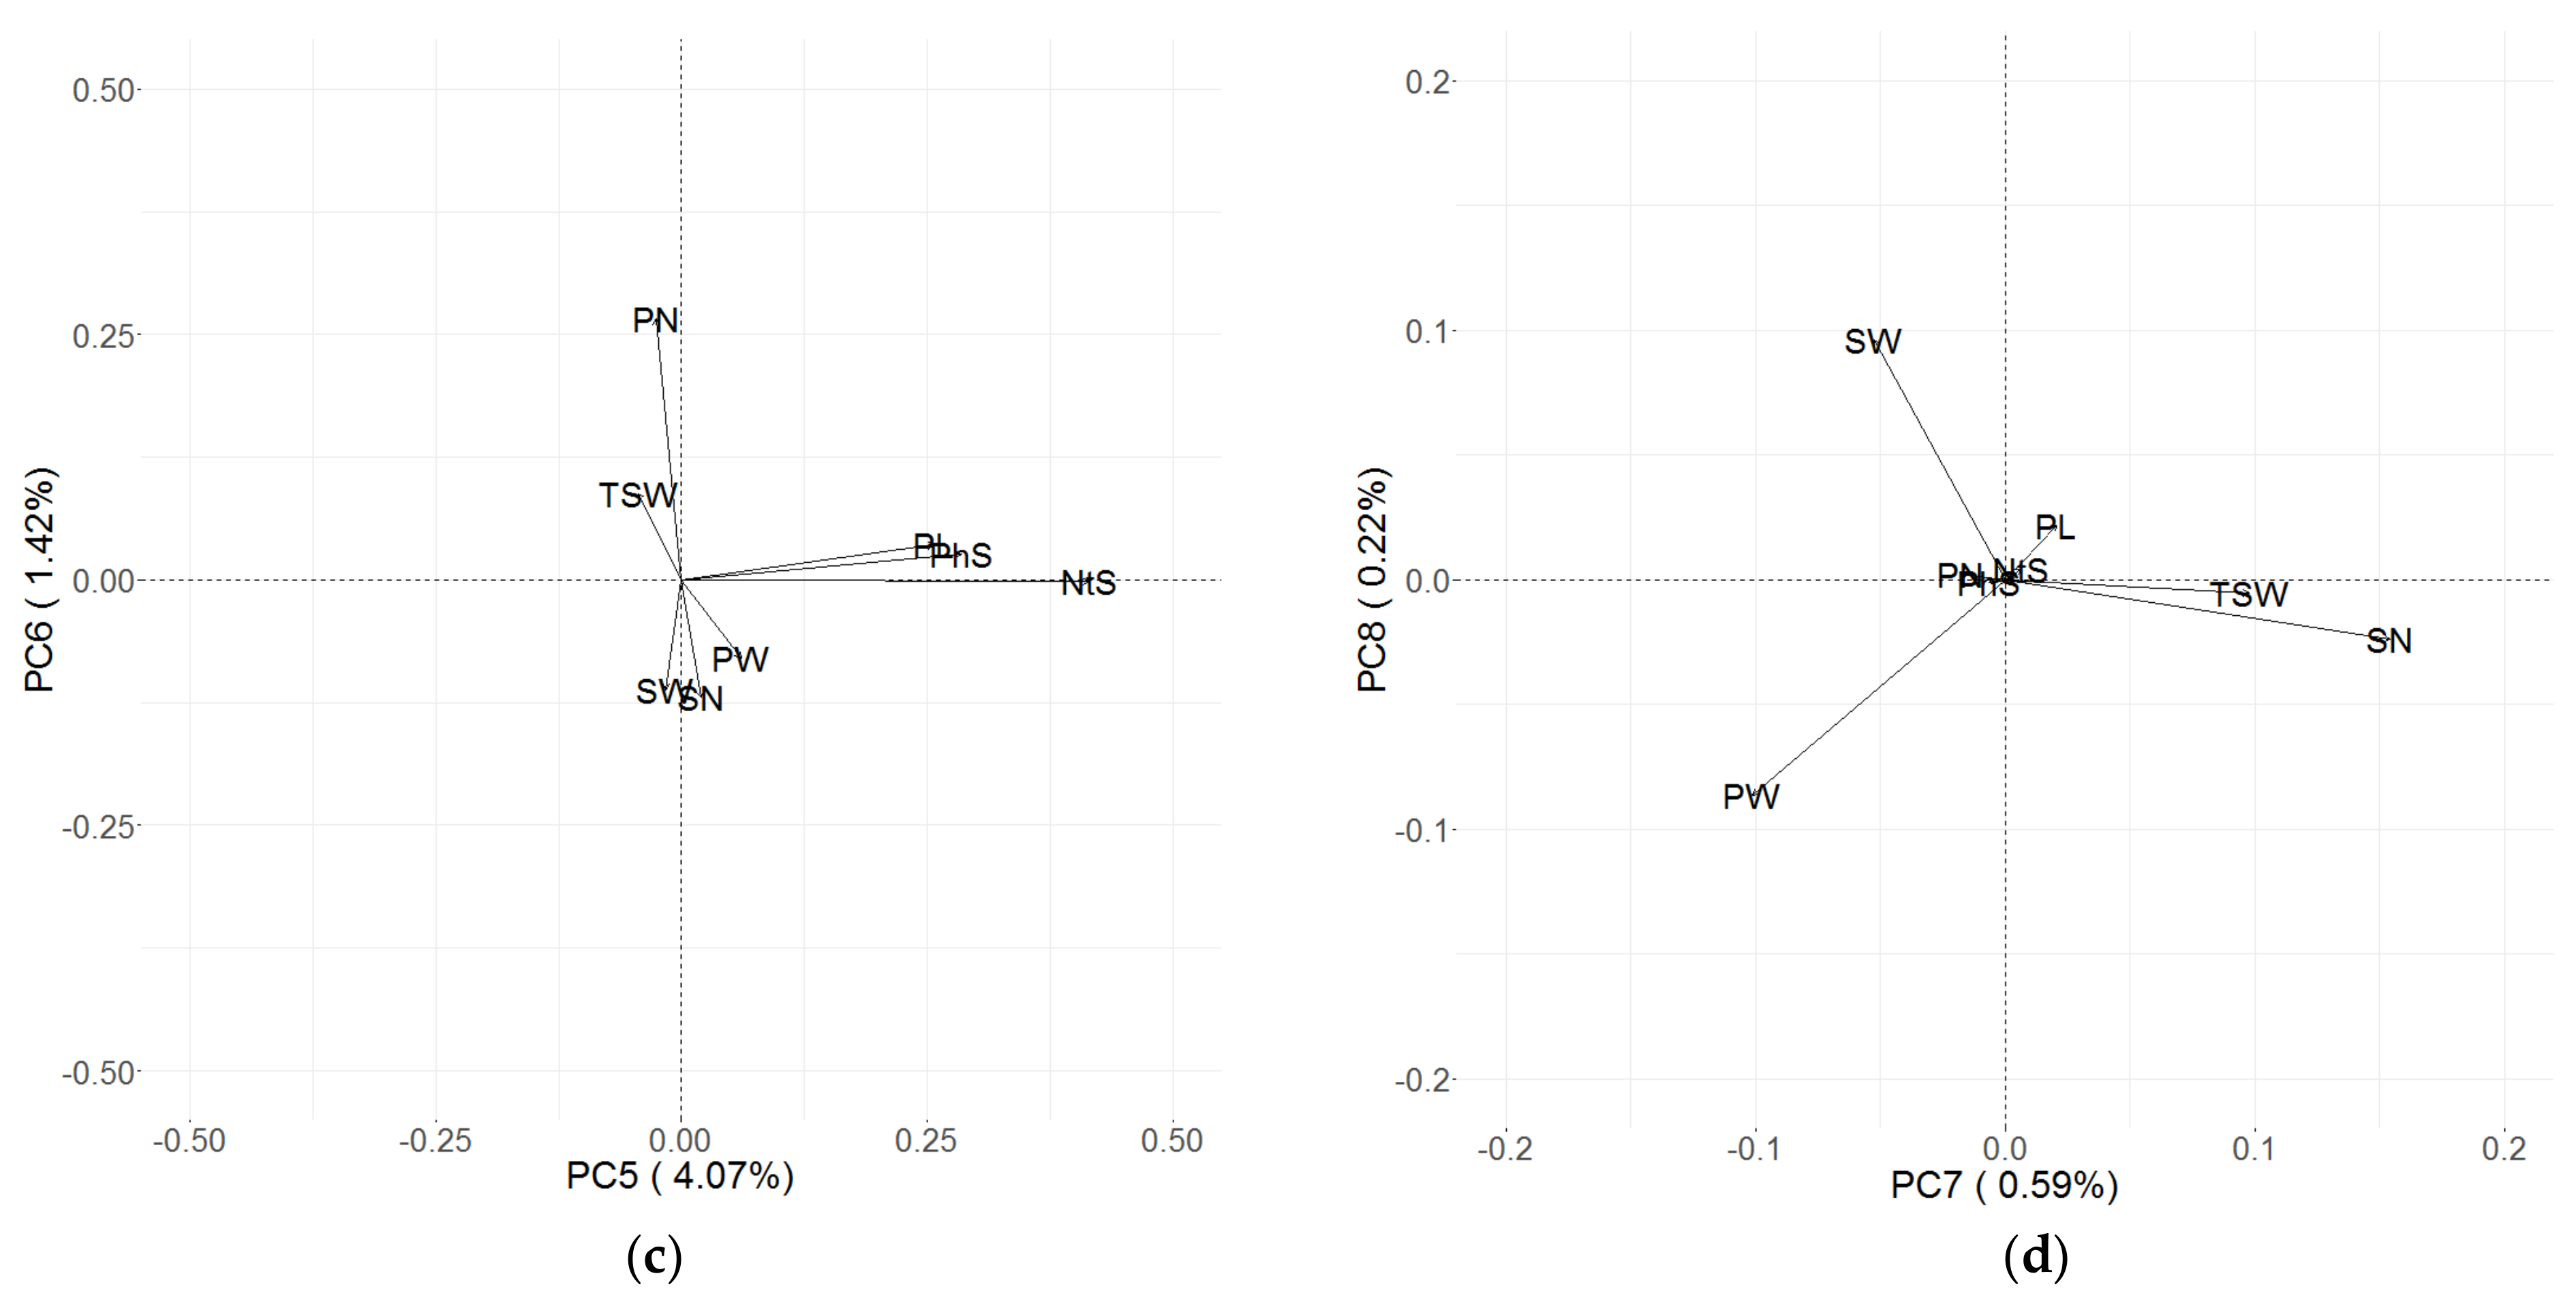
3.3. Principal Component (PC) Decomposition

Because of essential relations and correlations between traits, to study symbiotic responsivity, it seems rational to consider not a trait but a characteristic encompassing various measurable parameters and reflecting the interrelationship among these parameters. Here, we used linear principal component (PC) decomposition. The PCs were calculated based on centered, SD-normalized values of all eight traits from both Rh and Rh + AM conditions. The trait vectors in PC coordinates are presented in Figure 5. The first four PCs explained 94.1% of total variance. As expected, the correlation analysis among the PCs showed no significant relationship (Supplementary Figure S2), but correlation between Rh and Rh + AM condition persisted for all PCs (Supplementary Figure S3). The increments in PC coordinates depended on the corresponding PC values of the Rh condition (Supplementary Figure S4) for all PCs except PC3.

3.4. Genotyping of Cultivars

In order to test whether the allelic state of symbiotic genes affected the properties of pea plants grown in symbiotic conditions, we sequenced a set of eight genes in six pea cultivars (k-925, k-1693, k-3064, k-3358, k-7128 and k-8274) and identified the missense SNVs (Table 4). We screened the 93 pea cultivars for these allelic variants using created CAPS/dCAPS markers (Supplementary Table S2); the complete genotyping results are presented in Supplementary Table S3.

3.5. Association Analysis between the Allelic State of Sym-Genes and Traits

After filtering out the rare variants (present in less than ten cultivars), 52 nonsynonymic SNVs (single nucleotide variants) were analyzed (Supplementary Table S3).
To estimate the possible influence of the allelic states of selected genes on plant traits, we performed a series of two-way ANOVA tests with inoculation (Rh or Rh + AM) as the first factor and the allelic state of an SNV as the second factor. The full results are presented in Supplementary Table S4. The tests confirmed the effect of AM inoculation on all parameters; potential association of some allelic variants with some traits was also found (Table 5). All traits except TSW showed a relationship with Le.A229T SNV, which defines the mutant short internode phenotypes. For the traits NtS and PhS, the interaction between the factors LE and inoculation was noticed, the result implying that inoculation may have had different effects on element content in seeds of plants differing in Le:A229T. In addition to Le.A229T, allelic states of LykX, IGN1, K1, Sym37, AMT2;3, and SEN1 were shown to be associated with different SN, TSW, PL, PN, and PW traits (FDR < 0.05, Table 5).
The effect of Le.A229T was also clearly visible in PC coordinates, where it appeared to be associated with PC1, PC3, and PC4 (Table 6 and Supplementary Table S5). SNVs in symbiotic genes LykX, Sym37, K1, and IGN1 were associated with PC2, and LykX.13LV was associated with with PC1 (FDR < 0.05). Obviously, the PC2 axis described the variation in the TSW trait (see Figure 5a), and in accordance with this, most of these SNVs were also found to be associated with the TSW trait.

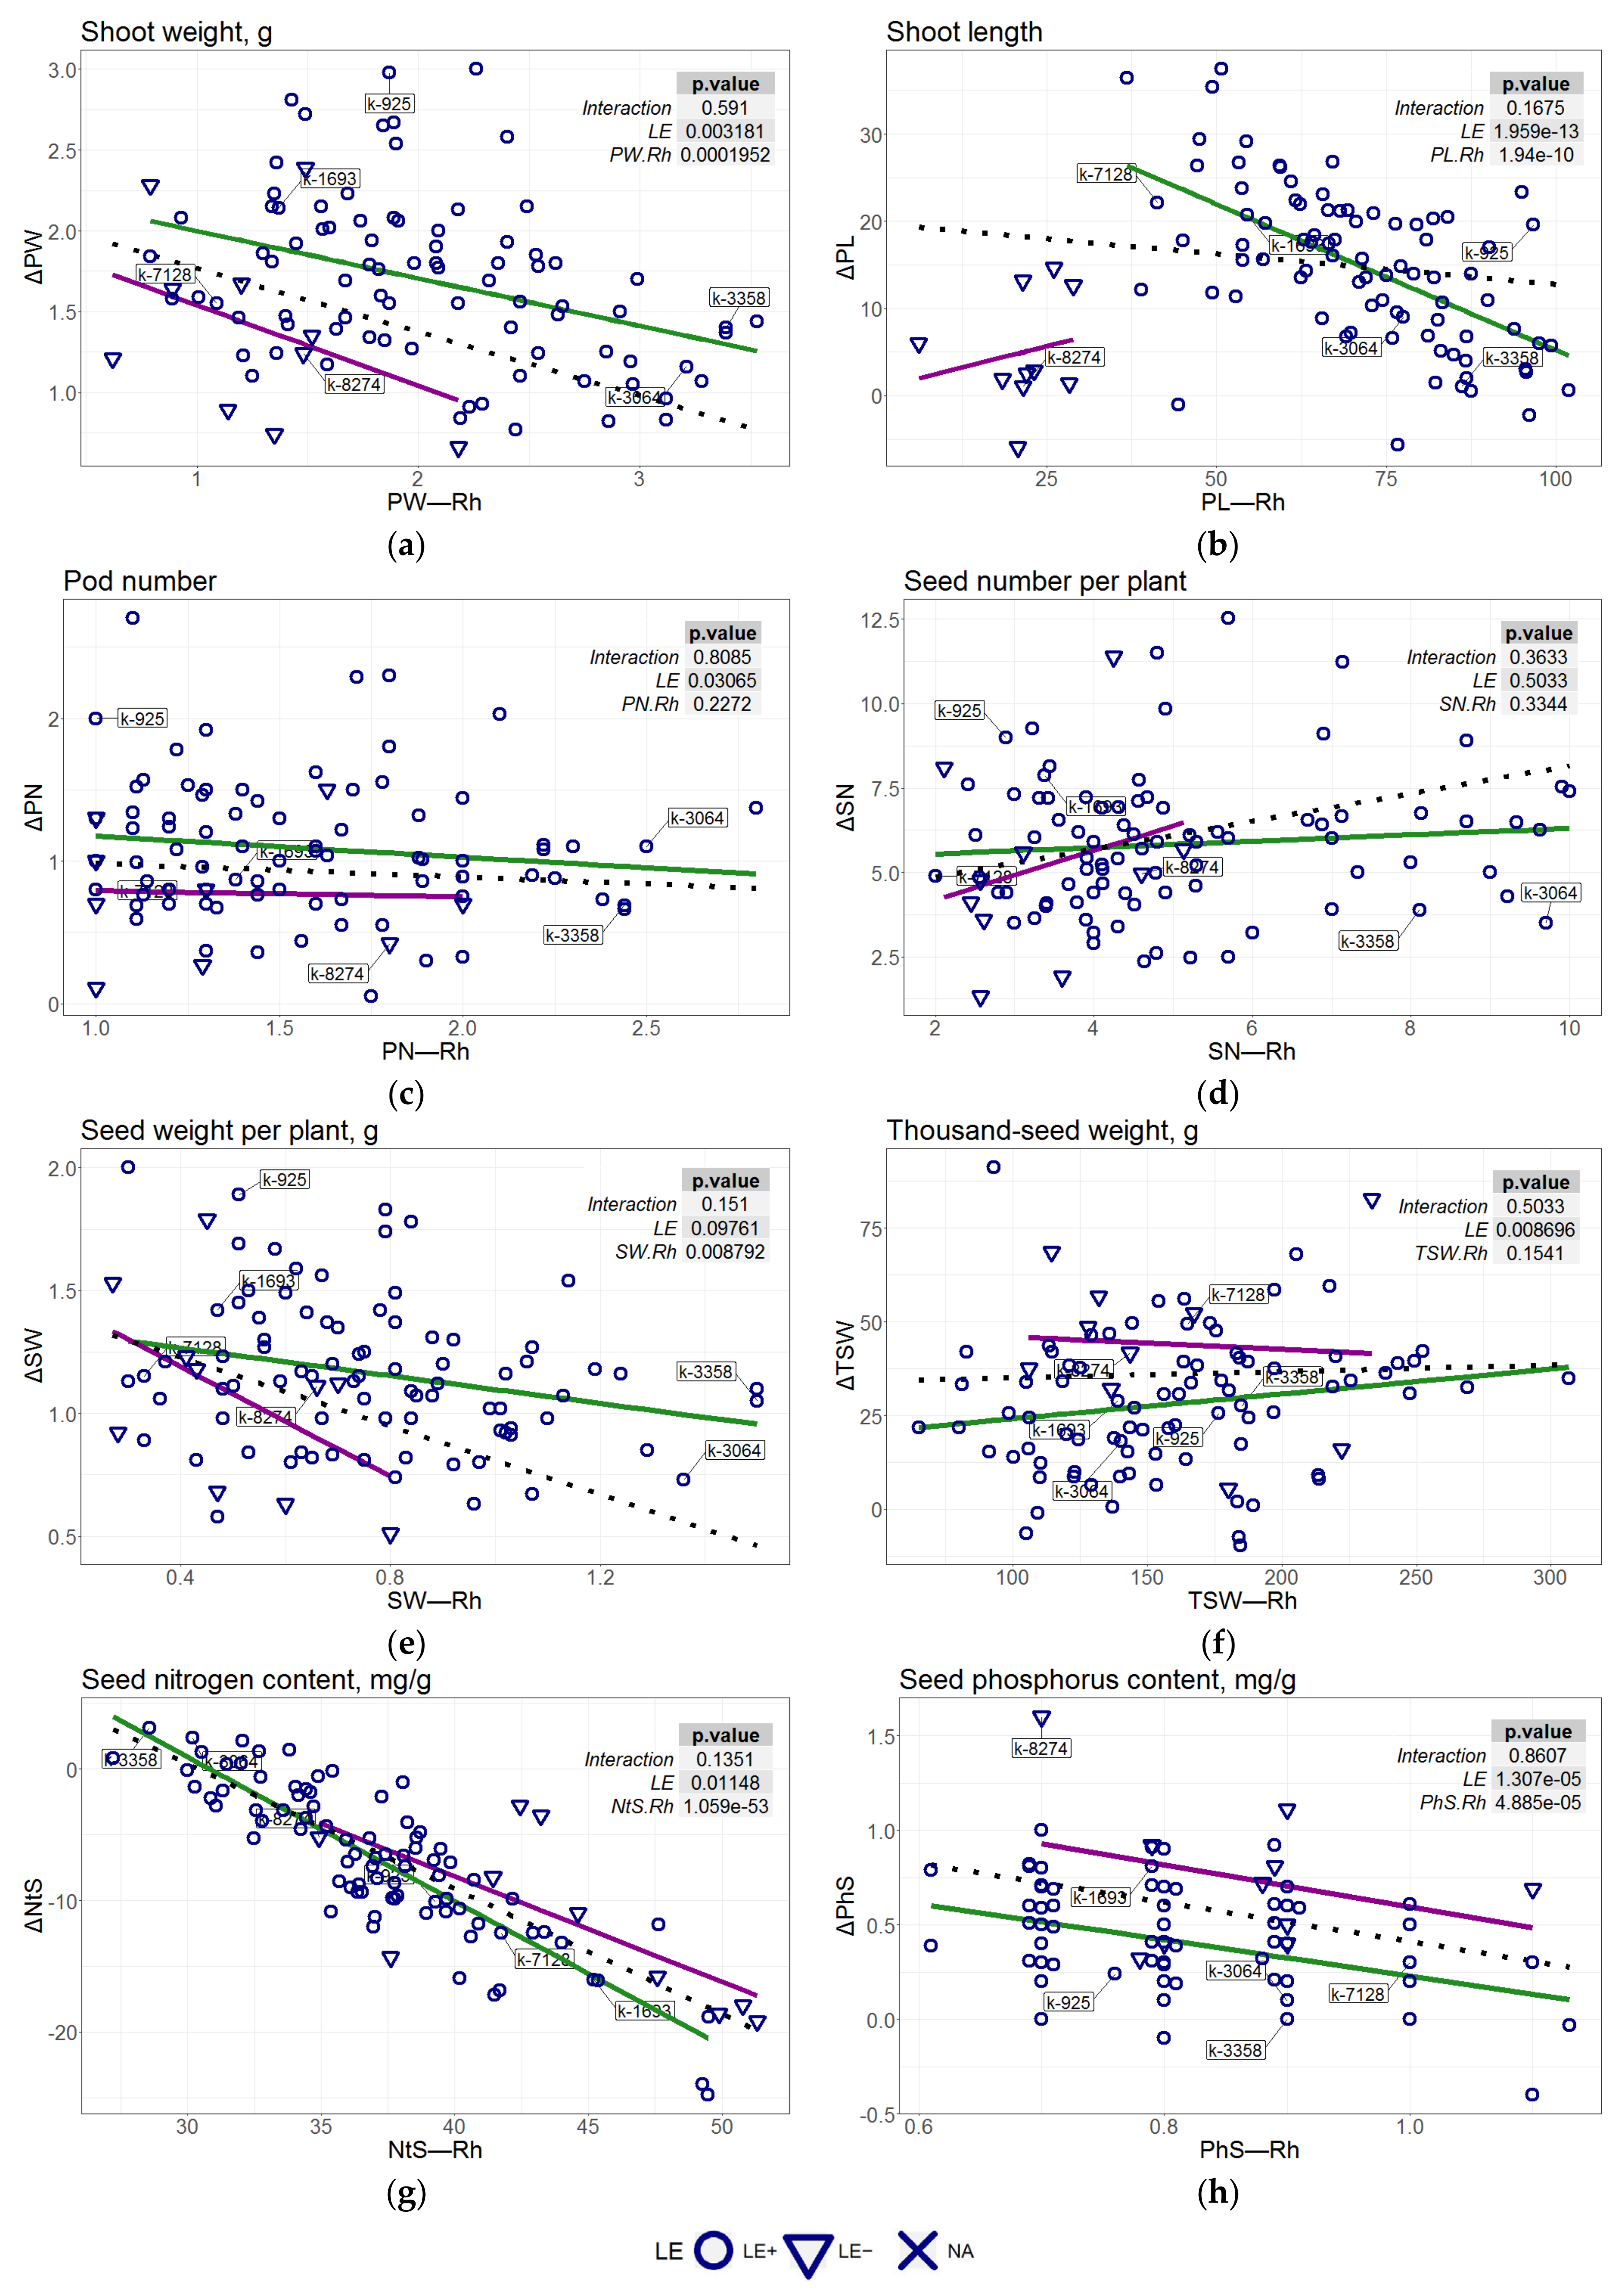
3.6. Regression Analysis of the Association of the AM-Caused Increments with SNVs

As was shown above, the AM-caused increments were heavily dependent on the absolute values of the corresponding parameters in Rh conditions, which was true both for the traits (see Figure 4 and Supplementary Figure S1) and for the PCs calculated based on these traits (Supplementary Figure S4). The AM-caused increments of PL, PN, TSW, NtS, and PhS were also found to be dependent on the Le/le allelic state (Figure 4) (however, this effect was not visible in PC coordinates). Based on these observations, for the analysis of the possible impact of SNVs on AM-caused increments, we used generalized linear regression models, which optionally included Rh-value and the Le allele as covariates (Table 7). For trait increments, the covariates included in the models were defined based on likelihood ratio tests (LRTs). The final chosen models are presented in Table 7. For PCs, only Rh value was included in the model as a covariate (dPCi~PCiRh). These models were used to test the significance of SNV impact on traits and PCs.
No strong associations were found for any of the SNVs with the studied traits; however, weak associations of SNVs in genes AMT2;3, K1, and LykX with AM-caused increments of TSW were identified (Table 8). The SNVs AMT2;3.215NI, LykX.16VF, and SST1.545SY were associated with dPC2 and/or dPC1 (Table 9). Thus, in addition to Le, the genes AMT2;3, K1, LykX, and SST1 can be considered candidate genes that contribute to the determination of the responsivity of pea plants to AM + Rh inoculation as compared to single Rh inoculation.

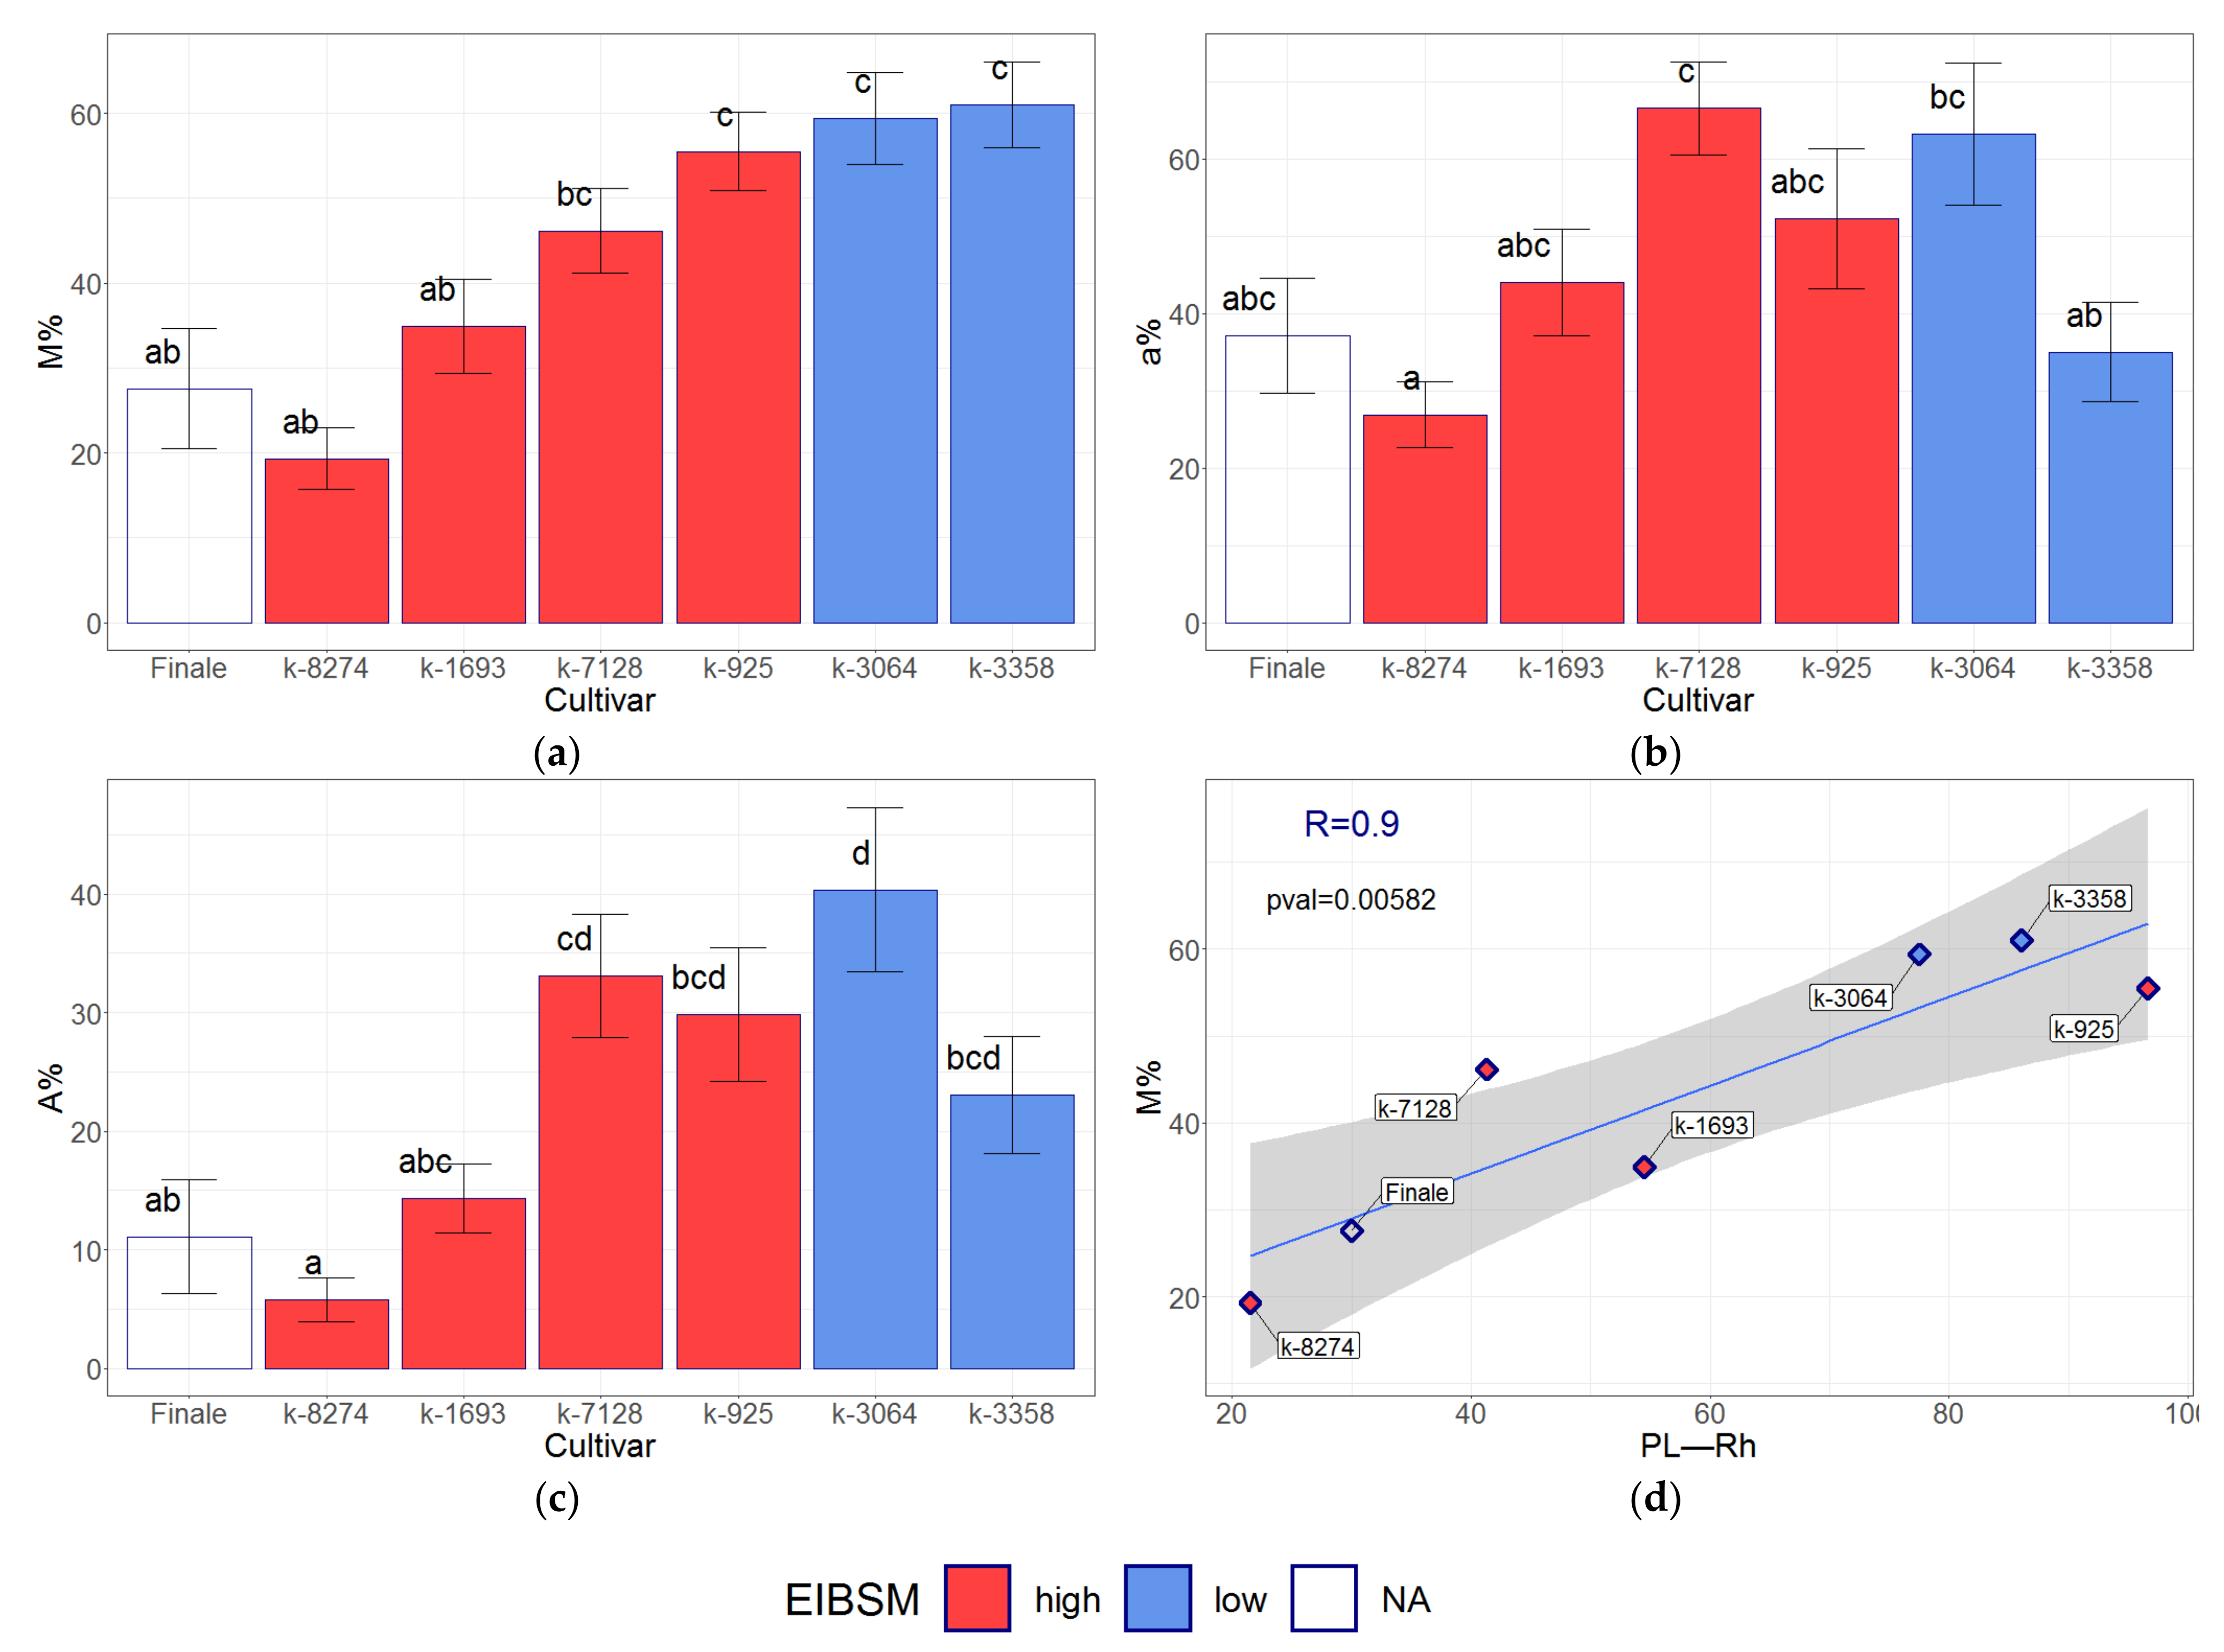
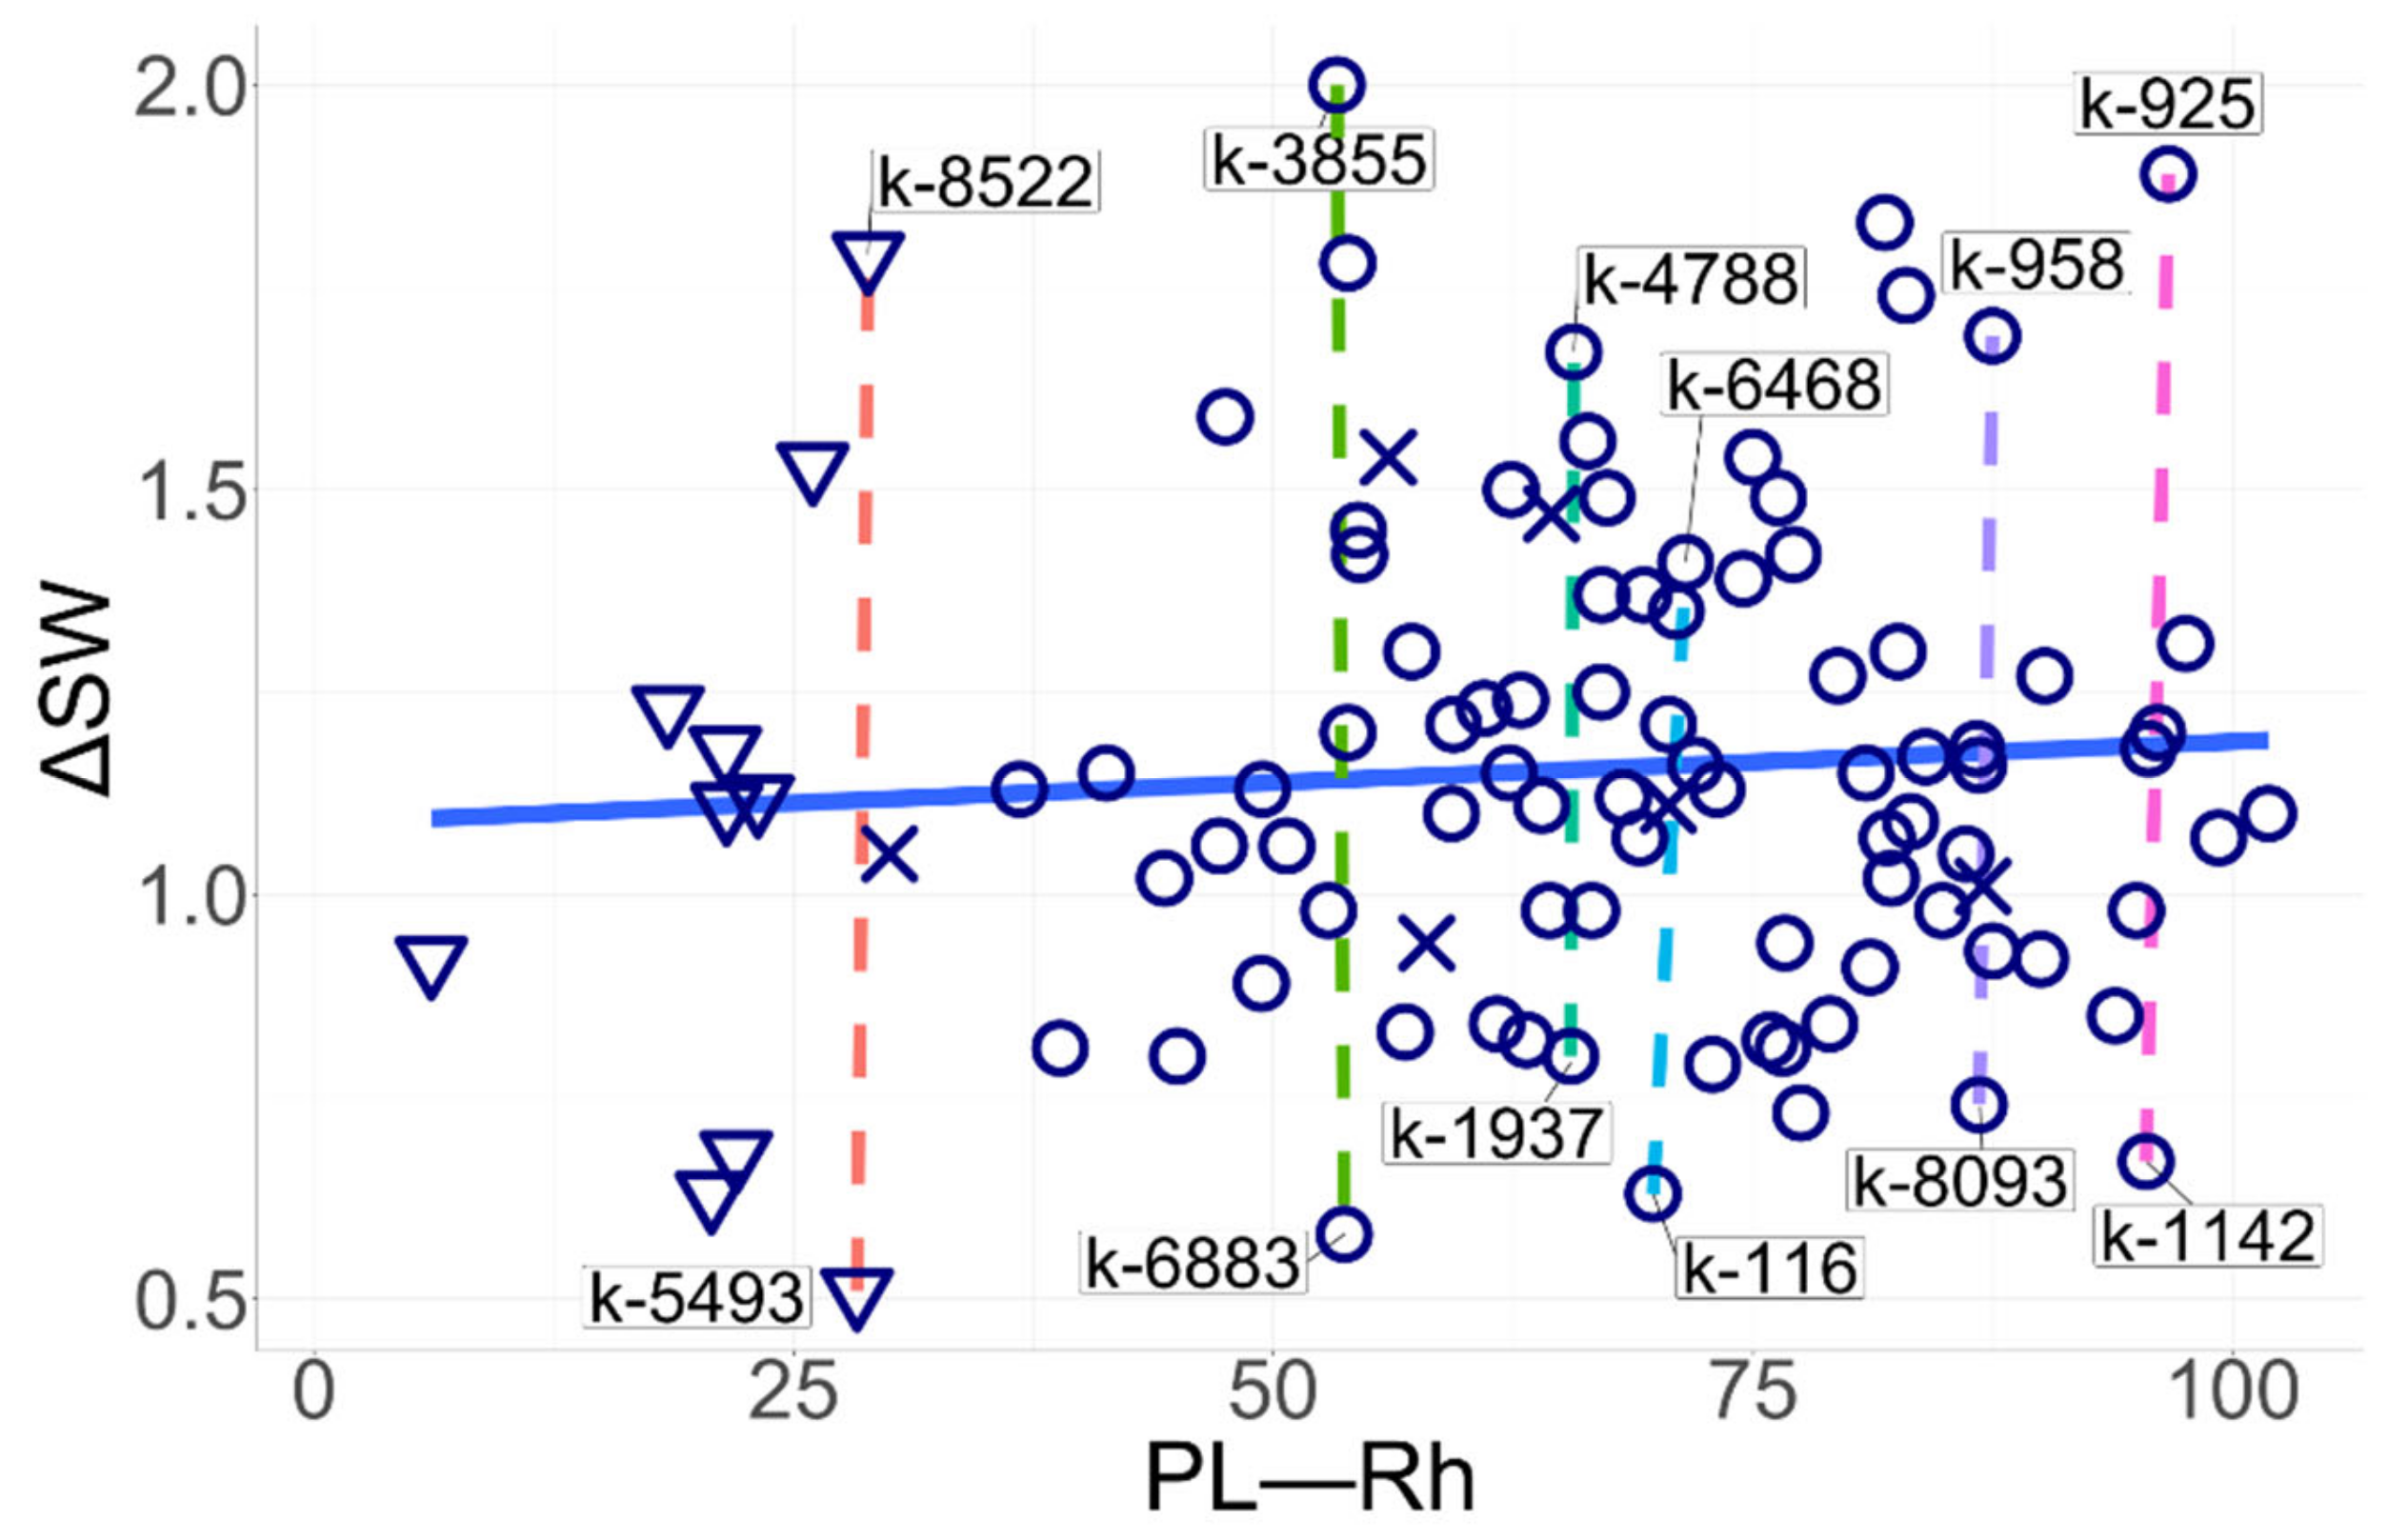
3.7. Association of the Root Mycorrhization Level and the Stem Length in Pea Cultivars

Since we found that the stem length of pea plants (determined by the Le allele) was strongly associated with the mycorrhiza-derived increments of most of the growth parameters, and because previous studies did not focus on the development of AM [21], we tested whether the stem length was associated with the mycorrhization parameters. To do so, we determined the level of root colonization in six cultivars from the analyzed set (for which the sequencing of the symbiotic genes was performed), along with the cv. Finale, for which the AM development was earlier characterized in detail [33,37,38].
Four parameters of AM development were analyzed: the frequency of mycorrhizal colonization (F%), the intensity of mycorrhizal colonization (M%), the abundance of arbuscules in the mycorrhizal part of the root (a%), and the saturation of the root system with arbuscules (A%). The F% values did not differ in the studied genotypes and were at a very high level (about 95–100%, data not shown), which indicates that the infection load was quite high. The data for M%, a%, and A% are presented in Figure 6. The data on mycorrhization of cv. Finale are consistent with the results of previous studies conducted in similar conditions [33]. The M% values in cultivars k-1693, k-8274, and Finale were significantly lower than those in k-925, k-3064, and k-3358. In the k-8274 cultivar, M% was also significantly lower than in the k-7128 cultivar. Moreover, in k-8274 (earlier characterized as highly symbiotically effective, or high-EIBSM), the value of this parameter was more than three times lower than that in the low-EIBSM cultivars k-3358 and k-3064. Thus, both analyzed low-EIBSM cultivars had a high level of mycorrhizal colonization M%, while the high-EIBSM ones differed in this parameter. The values of the parameters characterizing the development of arbuscules (a% and A%), in general, did not depend on the symbiotic efficiency of the studied cultivars. Thus, the cultivars previously described as high-EIBSM, k-8274, k-1693, and k-925, had a% at the level of that of the low-effective k-3358. Moreover, in the k-3358 cultivar, a% was lower than in the k-7128 cultivar. In cv. k-8274, a% was significantly lower than in cultivars k-7128 and k-3064. The value of the A% parameter in k-8274 was significantly lower than in all other cultivars except for Finale and k-1693. In the cv. Finale, A% was lower than in the k-7128 and k-3064 cultivars, while in cv. k-1693, it was lower than in cv. k-3064. Thus, both analyzed low-EIBSM cultivars had a high level of mycorrhizal colonization, M%, while the high-EIBSM ones differed in this parameter. At the same time, the values of the parameters characterizing arbuscule development (a% and A%), in general, were not related to the symbiotic efficiency of the studied cultivars.
The pea cultivars analyzed for AM development significantly differed in stem length and had different allelic states of the Le gene: le for k-8274 and cv. Finale and Le for the others. As already noted, the Le/le allele status affected relative increments of the values of a number of traits (Figure 4), which implies that plant length might influence pea responsivity to AM-inoculation. We therefore determined the level of Pearson’s correlation between the values of the parameter M% and the values of the stem length (PL) in the studied plants. The level of root mycorrhization had a strong positive correlation with the stem length of the studied pea plants: r = 0.9; p-value < 0.05 (Figure 6d).

4. Discussion

In the present study, we aimed at better understanding the genetic bases of symbiotic responsivity in garden pea (Pisum sativum L.). It is known that plant species and especially varieties within a species differ in their capacities to respond to beneficial soil microorganisms (BSM); this implies the existence of genetic factors determining this responsivity [39]. However, the nature of these factors, as well as mechanisms that underlie the successful interaction of plants with BSM, are currently unclear, mainly because of the complexity of plant–microbial symbiotic systems and difficulties in the assessment of their performance (because the benefits may appear in different forms depending on circumstances and plant properties). Some plant traits can be considered important for plants’ symbiotic effectiveness.
First, host–symbiont specificity plays a key role at least at the very early stage of symbiosis formation-partner recognition. In nitrogen-fixing legume–rhizobia symbiosis, plants can limit the set of bacteria able to penetrate their roots, which may become a substantial strategy in some environments. This is the case for some specimens of pea originating from several Middle Eastern countries, which are able to form nodules only with bacteria producing their signal molecule, which is called nodulation (Nod) factor, with a specific modification [40]. We recently showed that amino acid changes in LysM receptor-like kinase LykX corresponded well with the specificity of interaction with rhizobia strains [41]. The results of mathematical modeling of ligand–receptor interactions of Nod factor and the heterodimeric receptor complex LykX–Sym10 also bespoke the importance of LykX sequence in determination the specificity of interactions of pea with rhizobia [42]. Genes encoding other LysM receptor-like kinases (LysM-RLKs), Sym37 and K1, are located in a cluster together with LykX [27] and also play a role in recognition of Nod factor structure [43,44,45]. The structural variations in LysM domains of the proteins Sym37 and LykX are associated with the specificity of Nod factor recognition and, therefore, have a direct effect on LR symbiosis development [27,41,46].
Arbuscular mycorrhiza generally has no plant host specificity, although some works have reported that specificity of AM fungi might be a key factor in garnering the benefits thereof. Therefore, fungal communities in the roots of medic (M. truncatula) and leek (Allium porrum L.) were usually dominated by one AM species when inoculated by multispecies mixtures, although the composition of the communities depended on both the plant and the time of harvest [47]. AM fungi excrete signal molecules, mycorrhization (Myc) factors, that have a structure similar to that of Nod factors [48] and are presumably recognized in plants by homologs of Nod factor receptors [49]. However, it is unknown whether the structures of any of plant receptors influence the effectiveness of AM symbiosis.
In our work, we found that single nucleotide variants (SNVs) of the genes of Nod factor receptors LykX and K1 possibly influenced symbiotic responsivity to combined inoculation with the rhizobial strain RCAM 1026 and the AM isolate BEG144. The cultivars carrying specific alleles of these genes demonstrated statistically significant increases in the thousand-seed weight (TSW) parameter under Rh + AM inoculation as compared to single Rh inoculation. This result was surprising for us, since this increase was obviously due to mycorrhization, not nodulation. However, phosphorus deficiency in soil (and absence of mycorrhiza in Rh treatment in our experiment) suppresses nitrogenase activity in nodules and, consequently, the nitrogen supply of plants [50], whereas normalization of phosphorus supply (by addition of AM fungi) allows the manifestation of different facets of efficiency of nitrogen-fixing symbiosis. This can explain the observed association of alleles of genes controlling features of legume–rhizobial symbiosis with values of growth parameters under double inoculation (Rh+AM).
In line with our observations, in two independent QTL studies performed in field conditions (i.e., where symbioses with BSM could naturally form), the locus determining the TSW in pea was positioned at the upper part of linkage group (LG) I, which exactly matched the location of a cluster of LysM-RLK genes [13,51]. It seems feasible to analyze the sequences of parental genotypes used in the mentioned QTL studies in the future in order to check whether they differ in the same SNVs that were identified in our work.
Second, the systems of symbiosis regulation by the host must be critical for the symbiosis’s efficiency. Any symbiotic relationship is a risky and complicated trading process in which for each partner it is more expedient to get more than to give. A plant might invest in symbioses and not benefit from them because of a partner’s cheating or objective resource limits [52]. Excessive nodulation has been found to have a negative impact on plant growth, since nitrogen fixation is energy-intensive [53,54]. Legume plants have evolved mechanisms involving long-distance root–shoot signaling that can correct the number of forming nodules, so-called autoregulation of nodulation (AON). The same regulatory elements were shown to be involved in the autoregulation of mycorrhizae (AOM) as well [55,56]. In our study, we did not identify any association between the sequence variations of an important AON gene, Sym29 (CLAVATA1), which controls both nodulation and mycorrhization intensity, and symbiotic responsivity of pea genotypes. Probably, the study of genes encoding CLE peptides, acting as ligands of CLAVATA1 receptor [57,58], could shed light on the involvement of the AON system in the manifestation of symbiotic responsivity in pea.
A plant’s control over the symbiotic process is closely linked with its shoot and root architecture (habitus), which also appears to influence the plant’s responsivity to BSM. As the AON/AOM system’s control assumes the exchange of signal molecules between shoots and roots [55,58], short plants can be expected to react to environmental challenges more efficiently because of a shorter “signal line” and quicker communication between shoot and root. Thus, proper control over AM colonization could be the key to symbiotic efficiency and responsivity. Our data favored this assumption: the mycorrhization level of taller plants was higher than that of shorter plants.
Another example of plant habitus’s impact on symbiotic responsivity is related to the semideterminate stem growth of le plants. Such plants usually cannot form more than five flowering nodes, unlike Le+ plants, the virtually indeterminate growth of which results in the development of many flowering nodes (usually more than ten nodes under optimal mineral nutrition). Recently we suggested that one of the features of the successful interactions of plants with BSM might be the prolongation of the seed-filling period in the so-called highly responsive genotypes [19].
Indeed, previously we demonstrated that double inoculation with Rh + AM increased the TSW of the responsive genotype k-8274, as opposed to that of the nonresponsive genotype k-3358 [59]. The analysis of the dataset obtained from 99 genotypes allowed us to show that shorter plants (le) (this group includes k-8274) demonstrated significantly higher AM-derived increments (both absolute and relative) of TSW and PhS as compared to Le+ (this group includes k-3358); these increments were also higher than the average increment calculated for the whole dataset.
Thus, the limited pod number of le plants determines the strategy of increasing the filling of the already formed limited number of seeds under optimal conditions of mineral supply (in our case, because of the formation of symbioses). Therefore, le plants are basically predisposed to manifest high responsivity to inoculation in terms of prolongation of the seed filling period and increase in TSW. It is important to note, however, that the le mutation negatively impacts other characteristics of plants, resulting in lesser increases in total biomass (PW), pod number (PN), and shoot length (PL) under Rh + AM inoculation in le plants than in Le+ plants, and to the average mean calculated for the whole dataset. Also, the fact that the Le gene colocalized with many QTLs in studies involving field trials [10,13] shows that in natural conditions, the symbiotic responsivity mediated by better nitrogen and phosphorus supply of plants may also be manifested.
The last factor we presume to influence symbiotic responsivity is the performance of proteins involved in building the symbiotic compartments and in nutrient exchange. In our work, we discovered that the allele AMT2;3.215N, which encodes a nitrogen transporter, presumably led to more effective acquisition of nutrients when plants were inoculated with AM. Because of complex connectivity between all traits, this enhancement significantly manifested only for the TSW trait. Allelic states of other genes encoding SST1 (symbiotic sulphate transporter 1), IGN1 (ineffective greenish nodules 1, a structural protein that probably anchors other proteins on membranes), STR1 and STR2 (half-size ABC transporters indispensable for arbuscule formation), and SEN1 (stationary endosymbiont nodule 1, an integral membrane protein that possibly transports iron) did not show significant association with the traits’ increments. In L. japonicus, SEN1 allelic states were reported to be responsible for the manifestation of QTLs for nitrogen fixation activity (acetylene reduction activity, ARA) and seed weight [60]. The line Gifu B129 of L. japonicus has a deletion of three nucleotides in comparison with that of L. japonicus Miyakojima MG20, which leads to an absence of an amino acid and, apparently, to lower nitrogen fixation activity and poor seed weight accumulation. In our tested pea cultivars, no amino acid deletions or insertions were found in the putative proteins encoded by the analyzed genes, which probably points to the importance of these genes for proper functioning of symbioses. Notably, in the sequence of the AMT2;5 gene, we were unable to detect any variations (data not shown), which is a possible signal of recent selection pressure that displaced other alleles as not adaptive. Deeper analysis of wild pea varieties may result in the discovery of other alleles of nonvariable symbiotic genes, which should be tested in the future for their influence on the properties of beneficial symbioses formed by pea.
Finally, we suppose that the influence of alleles of symbiotic genes on plant growth parameters was hardly detectable because different varieties in our dataset may have employed different means to increase productivity in symbiotic conditions. Therefore, the particular mechanisms and genes involved in these plants can be elucidated in genetic analysis of progenies of crosses between different genotypes, contrasting in their symbiotic responsivity. We can recommend the crosses of genotypes with similar habitus but contrasting in AM-derived increments by traits of interest, for example, seed biomass (see Figure 7). Also, it is possible that the influence of allelic states of particular symbiotic genes on growth parameters manifested differently at the Le+ and le backgrounds. As our set of lines included only 10 le genotypes, which seems to be too few for correct testing of this idea, we plan to extend the number of le genotypes for further studies of symbiotic responsivity in pea. Lastly, since in our recent work we described transcriptome signatures characteristic for symbiotically effective pea cultivars and identified a set of expression markers [20], it seems promising to analyze the promoter regions of the differentially expressed genes on the same set of 99 pea cultivars to identify DNA markers of symbiotic responsivity in pea.

5. Conclusions

The usage of microbial inoculants instead of, or together with, mineral fertilizers is now becoming more and more common. Consequently, the need for new cultivars responsive to inoculation with microbial preparation is increasing, and the responsivity of plants to inoculation with beneficial microorganisms has become an important trait for modern breeding [4]. The employment of state-of-the-art strategies of molecular breeding aimed at creation of highly symbiotically responsive cultivars will be possible after the molecular genetic bases of this trait have been elucidated. In this study, we showed that in pea, the natural mutation in the gibberellin 3-beta-dioxygenase (Le) gene increases the responsivity to inoculation with nodule bacteria and AM fungi so that the increase in individual seed weight under inoculation with Rh + AM is more pronounced in le than in Le+ plants. This fact favors the usage of complex microbial inoculants for modern cultivars of pea, since most such cultivars have short internodes due to a natural Le.A229T mutation and, therefore, should benefit from symbioses with rhizobia and AM fungi. At the same time, the identification of other genes that positively influence symbiotic responsivity and introduction of their “effective” alleles into genomes of new cultivars will be the task of future studies.

Supplementary Materials

The following are available online at https://0-www-mdpi-com.brum.beds.ac.uk/article/10.3390/agronomy11112368/s1, Figure S1: Scatterplots of relative AM-caused trait increments (αT, y-axis) against trait values of plants grown under single inoculation with rhizobia (TRh, x-axis); Figure S2: Correlation matrix plot showing the results of pairwise correlation analysis of principal component (PC) values of pea cultivar traits; Figure S3: Scatterplots of principal component (PC) values after PC decomposition for Rh condition (x-axis) and Rh + AM condition (y-axis); Figure S4: Scatterplots of AM-caused increments of principal components (PC) (∆PC, y-axis) against PC values of Rh inoculation variant (PC-Rh, x-axis); Table S1: Mean values of traits; Table S2: CAPS markers; Table S3: Results of genotyping of the pea cultivars; Table S4: Summary table of two-way ANOVA (Inoculation × SNV)—traits; Table S5: Summary table of two-way ANOVA (Inoculation × SNV)—PC coordinates; Supplementary sequences: CDS of analyzed genes; Supplementary Gene structure schemes: Exon–intron structures of the analyzed genes with marked primer binding sites and primer sequences.

Author Contributions

Conceptualization, V.A.Z., O.Y.S. and I.A.T.; methodology, V.A.Z., A.I.Z. and O.Y.S.; software, A.I.Z.; validation, A.I.Z., O.A.K., M.S.K. and V.A.Z.; formal analysis, V.A.Z., A.I.Z., A.S.S., O.A.K., A.M.A., O.Y.S. and I.A.T.; investigation, V.A.Z., A.I.Z., A.S.S., O.A.K., M.S.K., A.M.A. and O.Y.S.; resources, V.A.Z., O.Y.S. and I.A.T.; data curation, A.S.S., A.M.A. and A.I.Z.; writing—original draft preparation, V.A.Z., A.I.Z. and O.Y.S.; writing—review and editing, V.A.Z., A.S.S., A.M.A. and I.A.T.; visualization, A.I.Z.; supervision, I.A.T.; project administration, V.A.Z.; funding acquisition, V.A.Z., O.Y.S. and I.A.T. All authors have read and agreed to the published version of the manuscript.

Funding

This work was supported by the grant from Saint Petersburg State University ID 73450407 for V.A.Z., A.I.Z., O.A.K., and O.Y.S. (mathematical modeling, study of associations), the Russian Foundation for Basic Research grant #19-316-51014 for V.A.Z. and A.M.A. (analysis of gene sequences), and the Russian Science Foundation grant #20-16-00107 for A.M.A., O.A.K., and O.Y.S. (study of arbuscular mycorrhiza development).

Institutional Review Board Statement

Not applicable.

Informed Consent Statement

Not applicable.

Data Availability Statement

The authors confirm that the data supporting the findings of this study are available within the article and its Supplementary Materials.

Acknowledgments

We thank Alexey Borisov for inspiring and fruitful discussions, Alexey Doroshkov for his help with principal component analysis, Jaroslava Fedorina for her help in amplification of the pea Sym gene sequences, Anastasia Inozemtseva and Galina Avdeeva for help with microscopic analysis of arbuscular mycorrhiza, and Ludmila Dvoryaninova for her excellent technical assistance. The research was partly (microchip electrophoresis, Sanger sequencing, microscopy) performed using equipment of the Core Center “Genomic Technologies, Proteomics, and Cell Biology” in the All-Russia Research Institute for Agricultural Microbiology (St. Petersburg, Russia).

Conflicts of Interest

The funders had no role in the design of the study; in the collection, analyses, or interpretation of data; in the writing of the manuscript; or in the decision to publish the results.

References

  1. Lüscher, A.; Mueller-Harvey, I.; Soussana, J.-F.; Rees, R.M.; Peyraud, J.-L. Potential of legume-based grassland–livestock systems in Europe: A review. Grass Forage Sci. 2014, 69, 206–228. [Google Scholar] [CrossRef]
  2. Oldroyd, G.E.D.; Dixon, R. Biotechnological solutions to the nitrogen problem. Curr. Opin. Biotechnol. 2014, 26, 19–24. [Google Scholar] [CrossRef] [Green Version]
  3. Zhukov, V.A.; Shtark, O.Y.; Borisov, A.Y.; Tikhonovich, I.A. Breeding to Improve Symbiotic Effectiveness of Legumes. In Plant Breeding from Laboratories to Fields; InTech: Rijeka, Croatia, 2013; pp. 167–207. [Google Scholar]
  4. Shtark, O.Y.; Borisov, A.Y.; Zhukov, V.A.; Tikhonovich, I.A. Mutually beneficial legume symbioses with soil microbes and their potential for plant production. Symbiosis 2012, 58, 51–62. [Google Scholar] [CrossRef]
  5. Roy, S.; Liu, W.; Nandety, R.S.; Crook, A.; Mysore, K.S.; Pislariu, C.I.; Frugoli, J.; Dickstein, R.; Udvardi, M.K. Celebrating 20 years of genetic discoveries in legume nodulation and symbiotic nitrogen fixation. Plant Cell 2020, 32, 15–41. [Google Scholar] [CrossRef] [PubMed] [Green Version]
  6. Tsyganov, V.E.; Tsyganova, A. V Symbiotic Regulatory Genes Controlling Nodule Development in Pisum sativum L. Plants 2020, 9, 1741. [Google Scholar] [CrossRef]
  7. Gorton, A.J.; Heath, K.D.; Pilet-Nayel, M.-L.; Baranger, A.; Stinchcombe, J.R. Mapping the genetic basis of symbiotic variation in legume-rhizobium interactions in Medicago truncatula. G3 Genes Genomes Genet. 2012, 2, 1291–1303. [Google Scholar] [CrossRef] [PubMed] [Green Version]
  8. Ramaekers, L.; Galeano, C.H.; Garzón, N.; Vanderleyden, J.; Blair, M.W. Identifying quantitative trait loci for symbiotic nitrogen fixation capacity and related traits in common bean. Mol. Breed. 2013, 31, 163–180. [Google Scholar] [CrossRef]
  9. Tominaga, A.; Gondo, T.; Akashi, R.; Zheng, S.; Arima, S.; Suzuki, A. Quantitative trait locus analysis of symbiotic nitrogen fixation activity in the model legume Lotus japonicus. J. Plant Res. 2012, 125, 395–406. [Google Scholar] [CrossRef] [PubMed]
  10. Smýkal, P.; Aubert, G.; Burstin, J.; Coyne, C.J.; Ellis, N.T.H.; Flavell, A.J.; Ford, R.; Hýbl, M.; Macas, J.; Neumann, P.; et al. Pea (Pisum sativum L.) in the Genomic Era. Agronomy 2012, 2, 74–115. [Google Scholar] [CrossRef]
  11. Bourgeois, M.; Jacquin, F.; Savois, V.; Sommerer, N.; Labas, V.; Henry, C.; Burstin, J. Dissecting the proteome of pea mature seeds reveals the phenotypic plasticity of seed protein composition. Proteomics 2009, 9, 254–271. [Google Scholar] [CrossRef]
  12. Deulvot, C.; Charrel, H.; Marty, A.; Jacquin, F.; Donnadieu, C.; Lejeune-Hénaut, I.; Burstin, J.; Aubert, G. Highly-multiplexed SNP genotyping for genetic mapping and germplasm diversity studies in pea. BMC Genom. 2010, 11, 468. [Google Scholar] [CrossRef] [PubMed] [Green Version]
  13. Bourion, V.; Rizvi, S.M.H.; Fournier, S.; de Larambergue, H.; Galmiche, F.; Marget, P.; Duc, G.; Burstin, J. Genetic dissection of nitrogen nutrition in pea through a QTL approach of root, nodule, and shoot variability. Theor. Appl. Genet. 2010, 121, 71–86. [Google Scholar] [CrossRef] [PubMed]
  14. Herridge, D.; Rose, I. Breeding for enhanced nitrogen fixation in crop legumes. Field Crop. Res. 2000, 65, 229–248. [Google Scholar] [CrossRef]
  15. Rengel, Z. Breeding for better symbiosis. In Food Security in Nutrient-Stressed Environments: Exploiting Plants’ Genetic Capabilities; Adu-Gyamfi, J.J., Ed.; Springer: Berlin/Heidelberg, Germany, 2002; pp. 245–260. [Google Scholar] [CrossRef]
  16. Aliyu, O.M.; Makinde, B.O. Phenotypic analysis of seed yield and yield components in cowpea (Vigna unguiculata L., Walp). Plant Breed. Biotechnol. 2016, 4, 252–261. [Google Scholar] [CrossRef] [Green Version]
  17. Chalk, P.M.; Souza, R.d.F.; Urquiaga, S.; Alves, B.J.R.; Boddey, R.M. The role of arbuscular mycorrhiza in legume symbiotic performance. Soil Biol. Biochem. 2006, 38, 2944–2951. [Google Scholar] [CrossRef]
  18. Shtark, O.Y.; Danilova, T.N.; Naumkina, T.S.; Vasilchikov, A.G.; Chebotar, V.K.; Kazakov, A.E.; Zhernakov, A.I.; Nemankin, T.A.; Prilepskaya, N.A.; Borisov, A.Y. Analysis of pea (Pisum sativum L.) source material for breeding of cultivars with high symbiotic potential and choice of criteria for its evaluation. Ecol. Genet. 2006, 4, 22–28. [Google Scholar] [CrossRef] [Green Version]
  19. Mamontova, T.; Afonin, A.M.; Ihling, C.; Soboleva, A.; Lukasheva, E.; Sulima, A.S.; Shtark, O.Y.; Akhtemova, G.A.; Povydysh, M.N.; Sinz, A. Profiling of seed proteome in pea (Pisum sativum L.) lines characterized with high and low responsivity to combined inoculation with nodule bacteria and arbuscular mycorrhizal fungi. Molecules 2019, 24, 1603. [Google Scholar] [CrossRef] [Green Version]
  20. Afonin, A.M.; Gribchenko, E.S.; Zorin, E.A.; Sulima, A.S.; Romanyuk, D.A.; Zhernakov, A.I.; Shtark, O.Y.; Akhtemova, G.A.; Zhukov, V.A. Unique transcriptome features of pea (Pisum sativum L.) lines with differing responses to beneficial soil microorganisms. Ecol. Genet. 2021, 19, 131–141. [Google Scholar] [CrossRef]
  21. Yakobi, L.M.; Kukalev, A.S.; Ushakov, K.V.; Tsyganov, V.E.; Naumkina, T.S.; Provorov, N.A.; Borisov, A.Y.; Tikhonovich, I.A. Polymorphism of garden pea forms by the effectiveness of symbiosis with the Endomycorrhizal fungus Glomus sp. under conditions of inoculation with rhizobia. Agric. Biol. Sel’skokhozyaistvennaya Biol. 2000, 2000, 94–102. [Google Scholar]
  22. Engvild, K.C. Nodulation and nitrogen fixation mutants of pea, Pisum sativum. Theor. Appl. Genet. 1987, 74, 711–713. [Google Scholar] [CrossRef]
  23. Muromtsev, G.S.; Marshunova, G.A.; Jacobi, L.M. USSR Inventor’s Certificate no. 1501509. Moscow USSR State Regist. Invent. 1989. [Google Scholar]
  24. Afonin, A.; Sulima, A.; Zhernakov, A.; Zhukov, V. Draft genome of the strain RCAM1026 Rhizobium leguminosarum bv. viciae. Genomics Data 2017, 11, 85–86. [Google Scholar] [CrossRef] [PubMed]
  25. Konieczny, A.; Ausubel, F.M. A procedure for mapping Arabidopsis mutations using co-dominant ecotype-specific PCR-based markers. Plant J. 1993, 4, 403–410. [Google Scholar] [CrossRef] [PubMed]
  26. Martin, D.N.; Proebsting, W.M.; Hedden, P. Mendel’s dwarfing gene: cDNAs from the Le alleles and function of the expressed proteins. Proc. Natl. Acad. Sci. USA 1997, 94, 8907–8911. [Google Scholar] [CrossRef] [Green Version]
  27. Sulima, A.S.; Zhukov, V.A.; Afonin, A.A.; Zhernakov, A.I.; Tikhonovich, I.A.; Lutova, L.A. Selection signatures in the first exon of paralogous receptor kinase genes from the sym2 region of the Pisum sativum L. Genome. Front. Plant Sci. 2017, 8, 1957. [Google Scholar] [CrossRef] [Green Version]
  28. Zhukov, V.A.; Rychagova, T.S.; Fedorina, J.V.; Pinaev, A.G.; Andronov, E.E.; Borisov, A.Y.; Tikhonovich, I.A. Features of expression of the PsSst1 and PsIgn1 genes in nodules of pea (Pisum sativum L.) symbiotic mutants. Russ. J. Genet. 2016, 52, 362–369. [Google Scholar] [CrossRef]
  29. Kulaeva, O.A.; Zhernakov, A.I.; Afonin, A.M.; Boikov, S.S.; Sulima, A.S.; Tikhonovich, I.A.; Zhukov, V.A. Pea Marker Database (PMD)–A new online database combining known pea (Pisum sativum L.) gene-based markers. PLoS ONE 2017, 12, e0186713. [Google Scholar] [CrossRef] [Green Version]
  30. Afonin, A.M.; Leppyanen, I.V.; Kulaeva, O.A.; Shtark, O.Y.; Tikhonovich, I.A.; Dolgikh, E.A.; Zhukov, V.A. A high coverage reference transcriptome assembly of pea (Pisum sativum L.) mycorrhizal roots. Vavilov J. Genet. Breed. 2020, 24, 331–339. [Google Scholar] [CrossRef]
  31. Zhukov, V.A.; Zhernakov, A.I.; Kulaeva, O.A.; Ershov, N.I.; Borisov, A.Y.; Tikhonovich, I.A. De Novo Assembly of the Pea (Pisum sativum L.) Nodule Transcriptome. Int. J. Genom. 2015, 2015, 695947. [Google Scholar] [CrossRef] [Green Version]
  32. Alves-Carvalho, S.; Aubert, G.; Carrère, S.; Cruaud, C.; Brochot, A.L.; Jacquin, F.; Klein, A.; Martin, C.; Boucherot, K.; Kreplak, J.; et al. Full-length de novo assembly of RNA-seq data in pea (Pisum sativum L.) provides a gene expression atlas and gives insights into root nodulation in this species. Plant J. 2015, 84, 1–19. [Google Scholar] [CrossRef]
  33. Shtark, O.Y.; Sulima, A.S.; Zhernakov, A.I.; Kliukova, M.S.; Fedorina, J.V.; Pinaev, A.G.; Kryukov, A.A.; Akhtemova, G.A.; Tikhonovich, I.A.; Zhukov, V.A. Arbuscular mycorrhiza development in pea (Pisum sativum L.) mutants impaired in five early nodulation genes including putative orthologs of NSP1 and NSP2. Symbiosis 2016, 68, 129–144. [Google Scholar] [CrossRef]
  34. Hoagland, D.R.; Arnon, D.I. The Water-Culture Method for Growing Plants without Soil; Arnon, D.I., Ed.; California Agricultural Experiment Station, The College of Agriculture, University of California: Berkeley, CA, USA, 1950. [Google Scholar]
  35. Vierheilig, H.; Coughlan, A.P.; Wyss, U.; Piché, Y. Ink and Vinegar, a Simple Staining Technique for Arbuscular-Mycorrhizal Fungi. Appl. Environ. Microbiol. 1998, 64, 5004–5007. [Google Scholar] [CrossRef] [PubMed] [Green Version]
  36. Trouvelot, A.; Kough, J.L.; Gianinazzi-Pearson, V. Estimation of vesicular arbuscular mycorrhizal infection levels. Research for methods having a functional significance. In Proceedings of the Physiological and Genetical Aspects of Mycorrhizae=Aspects Physiologiques et Genetiques des Mycorhizes: Proceedings of the 1st European Symposium on Mycorrhizae, Dijon, 1–5 July 1985; Institut National de le Recherche Agronomique: Paris, France, 1986. [Google Scholar]
  37. Shtark, O.Y.; Puzanskiy, R.K.; Avdeeva, G.S.; Yurkov, A.P.; Smolikova, G.N.; Yemelyanov, V.V.; Kliukova, M.S.; Shavarda, A.L.; Kirpichnikova, A.A.; Zhernakov, A.I.; et al. Metabolic alterations in pea leaves during arbuscular mycorrhiza development. PeerJ 2019, 2019, e7495. [Google Scholar] [CrossRef] [Green Version]
  38. Shtark, O.; Puzanskiy, R.; Avdeeva, G.; Yemelyanov, V.; Shavarda, A.; Romanyuk, D.; Kliukova, M.; Kirpichnikova, A.; Tikhonovich, I.; Zhukov, V. Metabolic Alterations in Pisum sativum Roots during Plant Growth and Arbuscular Mycorrhiza Development. Plants 2021, 10, 1033. [Google Scholar] [CrossRef]
  39. Kaeppler, S.M.; Parke, J.L.; Mueller, S.M.; Senior, L.; Stuber, C.; Tracy, W.F. Variation among maize inbred lines and detection of quantitative trait loci for growth at low phosphorus and responsiveness to arbuscular mycorrhizal fungi. Crop Sci. 2000, 40, 358–364. [Google Scholar] [CrossRef]
  40. Davis, E.O.; Evans, I.J.; Johnston, A.W.B. Identification of nodX, a gene that allows Rhizobium leguminosarum biovar viciae strain TOM to nodulate Afghanistan peas. Mol. Gen. Genet. MGG 1988, 212, 531–535. [Google Scholar] [CrossRef] [PubMed]
  41. Sulima, A.S.; Zhukov, V.A.; Kulaeva, O.A.; Vasileva, E.N.; Borisov, A.Y.; Tikhonovich, I.A. New sources of Sym2A allele in the pea (Pisum sativum L.) carry the unique variant of candidate LysM-RLK gene LykX. PeerJ 2019, 7, e8070. [Google Scholar] [CrossRef] [Green Version]
  42. Solovev, Y.V.; Igolkina, A.A.; Kuliaev, P.O.; Sulima, A.S.; Zhukov, V.A.; Porozov, Y.B.; Pidko, E.A.; Andronov, E.E. Towards understanding Afghanistan pea symbiotic phenotype through the molecular modeling of the interaction between LykX-Sym10 receptor heterodimer and Nod factors. Front. Plant Sci. 2021, 12, 824. [Google Scholar] [CrossRef]
  43. Zhukov, V.; Radutoiu, S.; Madsen, L.H.; Rychagova, T.; Ovchinnikova, E.; Borisov, A.; Tikhonovich, I.; Stougaard, J. The Pea Sym37 Receptor Kinase Gene Controls Infection-Thread Initiation and Nodule Development. Mol. Plant-Microbe Interact. 2008, 21, 1600–1608. [Google Scholar] [CrossRef] [Green Version]
  44. Kirienko, A.N.; Porozov, Y.B.; Malkov, N.V.; Akhtemova, G.A.; Le Signor, C.; Thompson, R.; Saffray, C.; Dalmais, M.; Bendahmane, A.; Tikhonovich, I.A. Role of a receptor-like kinase K1 in pea Rhizobium symbiosis development. Planta 2018, 248, 1101–1120. [Google Scholar] [CrossRef]
  45. Kirienko, A.N.; Vishnevskaya, N.A.; Kitaeva, A.B.; Shtark, O.Y.; Kozyulina, P.Y.; Thompson, R.; Dalmais, M.; Bendahmane, A.; Tikhonovich, I.A.; Dolgikh, E.A. Structural variations in LysM domains of LysM-RLK psK1 may result in a different effect on Pea–Rhizobial symbiosis development. Int. J. Mol. Sci. 2019, 20, 1624. [Google Scholar] [CrossRef] [Green Version]
  46. Li, R.; Knox, M.R.; Edwards, A.; Hogg, B.; Ellis, T.H.N.; Wei, G.; Downie, J.A. Natural variation in host-specific nodulation of pea is associated with a haplotype of the SYM37 LysM-type receptor-like kinase. Mol. Plant-Microbe Interact. 2011, 24, 1396–1403. [Google Scholar] [CrossRef] [PubMed] [Green Version]
  47. Jansa, J.; Smith, F.A.; Smith, S.E. Are there benefits of simultaneous root colonization by different arbuscular mycorrhizal fungi? New Phytol. 2008, 177, 779–789. [Google Scholar] [CrossRef] [PubMed]
  48. Maillet, F.; Poinsot, V.; André, O.; Puech-Pagès, V.; Haouy, A.; Gueunier, M.; Cromer, L.; Giraudet, D.; Formey, D.; Niebel, A.; et al. Fungal lipochitooligosaccharide symbiotic signals in arbuscular mycorrhiza. Nature 2011, 469, 58–63. [Google Scholar] [CrossRef]
  49. Streng, A.; op den Camp, R.; Bisseling, T.; Geurts, R. Evolutionary origin of rhizobium Nod factor signaling. Plant Signal. Behav. 2011, 6, 1510–1514. [Google Scholar] [CrossRef] [PubMed]
  50. Ma, Y.; Chen, R. Nitrogen and Phosphorus Signaling and Transport during Legume–Rhizobium Symbiosis. Front. Plant Sci. 2021, 12, 683601. [Google Scholar] [CrossRef] [PubMed]
  51. Irzykowska, L.; Wolko, B. Interval mapping of QTLs controlling yield-related traits and seed protein content in Pisum sativum. J. Appl. Genet. 2004, 45, 297–306. [Google Scholar] [PubMed]
  52. Sachs, J.L.; Quides, K.W.; Wendlandt, C.E. Legumes versus rhizobia: A model for ongoing conflict in symbiosis. New Phytol. 2018, 219, 1199–1206. [Google Scholar] [CrossRef] [Green Version]
  53. Bourion, V.; Laguerre, G.; Depret, G.; Voisin, A.-S.; Salon, C.; Duc, G. Genetic Variability in Nodulation and Root Growth Affects Nitrogen Fixation and Accumulation in Pea. Ann. Bot. 2007, 100, 589–598. [Google Scholar] [CrossRef]
  54. Novák, K.; Biedermannová, E.; Vondrys, J. Symbiotic and Growth Performance of Supernodulating Forage Pea Lines. Crop Sci. 2009, 49, 1227–1234. [Google Scholar] [CrossRef]
  55. Wang, C.; Reid, J.B.; Foo, E. The Art of Self-Control–Autoregulation of Plant–Microbe Symbioses. Front. Plant Sci. 2018, 9, 988. [Google Scholar] [CrossRef] [PubMed] [Green Version]
  56. Karlo, M.; Boschiero, C.; Landerslev, K.G.; Blanco, G.S.; Wen, J.; Mysore, K.S.; Dai, X.; Zhao, P.X.; de Bang, T.C. The CLE53–SUNN genetic pathway negatively regulates arbuscular mycorrhiza root colonization in Medicago truncatula. J. Exp. Bot. 2020, 71, 4972–4984. [Google Scholar] [CrossRef]
  57. Mortier, V.; Den Herder, G.; Whitford, R.; Van de Velde, W.; Rombauts, S.; D’haeseleer, K.; Holsters, M.; Goormachtig, S. CLE peptides control Medicago truncatula nodulation locally and systemically. Plant Physiol. 2010, 153, 222–237. [Google Scholar] [CrossRef] [PubMed] [Green Version]
  58. Müller, L.M.; Flokova, K.; Schnabel, E.; Sun, X.; Fei, Z.; Frugoli, J.; Bouwmeester, H.J.; Harrison, M.J. A CLE–SUNN module regulates strigolactone content and fungal colonization in arbuscular mycorrhiza. Nat. Plants 2019, 5, 933–939. [Google Scholar] [CrossRef]
  59. Zhukov, V.A.; Akhtemova, G.A.; Zhernakov, A.I.; Sulima, A.S.; Shtark, O.Y.; Tikhonovich, I.A. Evaluation of the symbiotic effectiveness of Pea (Pisum Sativum L.) Genotypes in pot experiment. Sel’skokhozyaistvennaya Biol. 2017, 52, 607–614. [Google Scholar] [CrossRef] [Green Version]
  60. Nishida, Y.; Hiraoka, R.; Kawano, S.; Suganuma, N.; Sato, S.; Watanabe, S.; Anai, T.; Arima, S.; Tominaga, A.; Suzuki, A. SEN1 gene from Lotus japonicus MG20 improves nitrogen fixation and plant growth. Soil Sci. Plant Nutr. 2020, 66, 864–869. [Google Scholar] [CrossRef]
Figure 1. Scatterplots of traits as measured for analyzed pea cultivars grown under single inoculation with rhizobia (x-axis, Rh) and double inoculation with rhizobia and AM fungi (y-axis, Rh + AM). The blue line is the linear regression graph; the dotted line is the y = x graph, representing the hypothetical absence of difference between inoculations. The following traits are presented: (a) PW—shoot weight, g; (b) PL—shoot length, cm; (c) PN—pod number; (d) SN—seed number per plant; (e) SW—seed weight per plant, g; (f) TSW—thousand-seed weight, g; (g) NtS—seed nitrogen content, mg/g; (h) PhS—seed phosphorus content, mg/g.
Agronomy 11 02368 g001
Figure 2. Correlation matrix plot showing the results of pairwise correlation analysis of pea cultivar traits. The lower triangular matrix is composed of scatter plots in which the blue markers represent single inoculation with rhizobia (Rh), while the red markers represent double inoculation with rhizobia and mycorrhizal fungi (Rh + AM); the solid lines are corresponding linear regression graphs; and the dotted line is the mean regression graph of the joined (Rh and Rh + AM) linear regression model. The upper triangular matrix shows the Pearson correlation coefficients with p-values for the Rh (red) and Rh + AM (blue) samples as well as the coefficients of determination for the joined (Rh and Rh + AM) linear regression model. The matrix diagonal comprises the distribution plots (histogram + density) of the traits of both inoculations, Rh (red) and Rh + AM (blue). The following traits are presented: PW—shoot weight, g; PL—shoot length, cm; PN—pod number; SN—seed number per plant; SW—seed weight per plant, g; TSW—thousand-seed weight, g; NtS—seed nitrogen content, mg/g; PhS—seed phosphorus content, mg/g.
Agronomy 11 02368 g002
Figure 3. Correlation matrix plot showing the results of pairwise correlation analysis of AM-caused increments of the analyzed traits. The lower triangular matrix is composed of scatter plots. The upper triangular matrix shows the Pearson correlation coefficients with p-values. The matrix diagonal comprises the distribution plots (histogram + density) of the traits. The following traits are presented: PW—shoot weight, g; PL—shoot length, cm; PN—pod number; SN—seed number per plant; SW—seed weight per plant, g; TSW—thousand-seed weight, g; NtS—seed nitrogen content, mg/g; PhS—seed phosphorus content, mg/g.
Agronomy 11 02368 g003
Figure 4. Scatterplots of AM-caused trait increments (∆T, y-axis) against trait values of plants grown under single inoculation with rhizobia (TRh, x-axis). The lines represent the approximation of the two-variable regression model with variable interaction (∆T~TRh * LE); the green line is for LE+ cultivars, the purple line is for LE- cultivars, and the dotted line represents ∆T~TRh dependency excluding LE factor. In the tables, the results of statistical tests for significance of two factors, TRh and LE, and their interaction are presented. The following traits are shown: (a) PW—shoot weight, g; (b) PL—shoot length, cm; (c) PN—pod number; (d) SN—seed number per plant; (e) SW—seed weight per plant, g; (f) TSW—thousand-seed weight, g; (g) NtS—seed nitrogen content, mg/g; (h) PhS—seed phosphorus content, mg/g.
Agronomy 11 02368 g004
Figure 5. Variable factor maps demonstrating the relations between traits in PC coordinates (a) PC1 and PC2, (b) PC3 and PC4, (c) PC5 and PC6, (d) PC7 and PC8.
Agronomy 11 02368 g005aAgronomy 11 02368 g005b
Figure 6. Characteristics of arbuscular mycorrhiza (AM) development by R. irregularis in the pea roots. (a) M% is the intensity of mycorrhizal colonization; (b) a% is the arbuscule abundance in mycorrhizal root fragments; (c) A% is the saturation of the root system with arbuscules; (d) relationship between the values of the pea stem length under conditions of monoinoculation with rhizobia (PL-Rh) and the values of intensity of mycorrhizal colonization (M%). The values for each parameter, which are not significantly different from each other (p ≤ 0.05), are marked with the same letter. Error bars represent standard errors. Markers of the rows of the diagram for high-EIBSM genotypes are highlighted in red, while those for low-EIBSM genotypes are highlighted in green.
Agronomy 11 02368 g006
Figure 7. Scatter plot displaying the AM-derived increments for cultivars of different shoot lengths. Dashed lines suggest pairs that could be crossed for genetic analysis of genetic factors determining symbiotic responsivity.
Agronomy 11 02368 g007
Table 2. The traits analyzed for pea plants grown in Rh and Rh + AM conditions.
Measured TraitMean Value, RhMean Value,
Rh + AM
Mean Increase (abs) 1Mean Increase (rel), %
Shoot weight, g1.96, SD = 0.6683.62, SD = 0.7251.67 ± 0.198.90%
Shoot length, cm65.5, SD = 21.379.3, SD = 22.313.8 ± 1.924.00%
Pod number1.56, SD = 0.432.61, SD = 0.6221.05 ± 0.09773.10%
Seed number per plant4.87, SD = 1.9710.6, SD = 3.135.75 ± 0.43133.40%
Seed weight per plant, g0.74, SD = 0.2671.89, SD = 0.3641.15 ± 0.061183.30%
Thousand-seed weight, g160, SD = 49.0190, SD = 55.030.2 ± 3.720.30%
Seed nitrogen content, mg/g38, SD = 5.2530.5, SD = 3.17−7.54 ± 1.2−18.40%
Seed phosphorus content, mg/g0.816, SD = 0.1161.27, SD = 0.2830.453 ± 0.0658.30%
1 value after ± denotes spread of 95% confidence interval.
Table 3. Comparisons between the traits values in Rh and Rh + AM conditions.
Measured TraitPaired t-Test 1
t-Statistic, p-Value
F-Test 2
F-Statistic, p-Value
Pearson Correlation Coefficient (R)Coefficient of
Determination, Adjusted (R2adj)
PW31.64,
p-value = 3.07 × 10−53
1.18,
p-value = 0.425
0.720,
p-value = 4.55 × 10⁻¹⁷
0.513
PL14.71,
p-value = 1.53 × 10⁻²⁶
1.09,
p-value = 0.659
0.910,
p-value = 8.37 × 10−39
0.826
PN21.49,
p-value = 7.21 × 10−39
2.09,
p-value = 3.29 × 10⁻⁴
0.625,
p-value = 4.93 × 10⁻¹²
0.384
SN26.47,
p-value = 1.95 × 10−46
2.53,
p-value = 6.53 × 10⁻⁶
0.731,
p-value = 8.73 × 10⁻¹⁸
0.53
SW37.32,
p-value = 9.76 × 10−60
1.86,
p-value = 2.45 × 10⁻³
0.560,
p-value = 1.62 × 10⁻⁹
0.307
TSW16.03,
p-value = 3.89 × 10⁻²⁹
1.26,
p--value = 0.253
0.941,
p-value = 1.40 × 10−47
0.885
NtS−12.34,
p-value = 1.17 × 10⁻²¹
0.37,
p-value = 1.13 × 10⁻⁶
0.019,
p-value = 0.85
−0.01
PhS15.05,
p-value = 3.23 × 10⁻²⁷
5.96,
p-value < 2.2 × 10⁻¹⁶
0.052,
p-value = 0.611
−0.008
1 Two-tailed paired samples t-test with unequal variances, df = 98; 2 two-tailed F-test of equality of variances, df = 98/98. PW—plant shoot weight; PL—plant shoot length; PN—pod number; SN—seed number per plant; SW—seed weight per plant; TSW—thousand-seed weight; NtS—seed nitrogen content; PhS—seed phosphorus content.
Table 4. The selected Sym genes and detected missense variations in putative protein sequences.
Gene IdentifierProtein Substitutions
IGN1D108E
SEN1P22A
SST1S545Y
Sym29F16S
P43H
A53G
I171F
S618P
T623I
STR1E109K
P397S
A401P
H475Y
STR2T676I
AMT2;3A21P *
N215I
Y385N
AMT2;5
*—not included in analysis as a rare variant.
Table 5. Associations between SNVs and traits.
SNVTraitp-ValueFDRSNVTraitp-ValueFDR
Le.A229TPL4.00 × 10−383.20 × 10−37SEN1.P22APL1.24 × 10−39.92 × 10⁻³
Le.A229TPW9.54 × 10−93.81 × 10⁻⁸LykX.L42KTSW1.53 × 10−38.65 × 10⁻³
Le.A229TNtS7.82 × 10−72.08 × 10⁻⁶K1.E90DTSW1.86 × 10−30.0149
LykX.L13VSN4.43 × 10−63.55 × 10⁻⁵LykX.L42KSN2.16 × 10−38.60 × 10⁻³
Le.A229TPhS8.36 × 10−61.67 × 10⁻⁵Sym37.L56VSN2.21 × 10−38.80 × 10⁻³
LykX.L9FTSW1.20 × 10−59.57 × 10⁻⁵IGN1.D108EPN2.36 × 10−39.20 × 10⁻³
LykX.A142ITSW2.35 × 10−51.88 × 10⁻⁴IGN1.D108EPL3.47 × 10−39.20 × 10⁻³
Le.A229TSW3.37 × 10−55.39 × 10⁻⁵LykX.A142ISN3.58 × 10−30.0143
LykX.L9FSN4.96 × 10−51.98 × 10⁻⁴LykX.S134GSW5.82 × 10−30.0466
LykX.L13VPN1.30 × 10−45.19 × 10⁻⁴AMT2;3.N215ISW6.46 × 10−30.0204
LykX.V86ISN1.97 × 10−41.02 × 10⁻³AMT2;3.N215IPL7.63 × 10−30.0204
LykX.F184SSN1.97 × 10−41.02 × 10⁻³IGN1.D108ETSW7.68 × 10−30.0154
IGN1.D108ESN2.09 × 10−41.67 × 10⁻³Sym37.L56VPN8.71 × 10−30.0232
Sym37.S45LTSW2.30 × 10−41.84 × 10⁻³K1.E90DSN0.01030.0411
LykX.V86ITSW2.54 × 10−41.02 × 10⁻³AMT2;3.N215ITSW0.01090.0218
LykX.F184STSW2.54 × 10−41.02 × 10⁻³LykX.L9FPN0.01190.0316
Le.A229TSN4.29 × 10−45.72 × 10⁻³LykX.L13VPL0.01360.0273
Sym37.L56VTSW5.40 × 10−44.32 × 10⁻³Sym37.S45LPN0.01680.0480
Le.A229TPN6.08 × 10−46.95 × 10⁻⁴Sym37.S45LSN0.01800.0480
LykX.L13VTSW7.74 × 10−42.06 × 10⁻³LykX.L13VSW0.02960.0461
AMT2;3.N215IPW1.17 × 10−39.36 × 10⁻³LykX.L13VNtS0.03460.0461
Table 6. Associations between SNVs and PCs.
SNVPCp-ValueFDRSNVPCp-ValueFDR
Le.A229TPC31.23 × 10−254.93 × 10⁻²⁵LykX.L42KPC22.40 × 10−39.61 × 10⁻³
Le.A229TPC12.04 × 10−134.08 × 10⁻¹³IGN1.D108EPC23.66 × 10−30.0130
Le.A229TPC41.66 × 10−82.22 × 10⁻⁸K1.E90DPC24.98 × 10−30.0199
LykX.L9FPC21.13 × 10−54.51 × 10⁻⁵AMT2;3.N215IPC15.13 × 10−30.0205
Sym37.S45LPC29.71 × 10−53.88 × 10⁻⁴IGN1.D108EPC16.51 × 10−30.0130
LykX.A142IPC22.02 × 10−48.06 × 10⁻⁴STR2.T676IPC27.70 × 10−30.0308
LykX.L13VPC22.21 × 10−48.85 × 10⁻⁴LykX.S134GPC10.01120.0450
Sym37.L56VPC22.48 × 10−49.90 × 10⁻⁴SEN1.P22APC40.01450.0484
LykX.F184SPC22.85 × 10−41.14 × 10⁻³K1.E90DPC40.02190.0437
LykX.V86IPC22.85 × 10−41.14 × 10⁻³SEN1.P22APC30.02420.0484
LykX.L13VPC14.43 × 10−48.87 × 10⁻⁴LykX.L13VPC30.03530.0471
Table 7. The models chosen for regression analysis of AM-caused increments in traits.
TraitThe Formula Used in the Model
PWdPW~PW.Rh + LE
PLdPL~PL.Rh + LE
PNdPN~LE
SNdSN~1
SWdSW~SW.Rh
TSWdTSW~LE
NtSdNtS~NtS.Rh + LE
PhSdPhS~PhS.Rh + LE
Table 8. Selected associations with trait increments.
SNVTraitp-ValueFDR
AMT2;3.215NIdTSW0.00500.0402
K1.31LIdTSW0.00470.0379
LykX.16VFdTSW0.00380.0301
LykX.184FSdTSW0.00560.0447
Table 9. Selected associations with PC increments.
SNVPCp-ValueFDR
AMT2;3.215NIdPC20.00610.0243
LykX.16VFdPC20.00930.0371
SST1.545SYdPC10.02150.0430
SST1.545SYdPC20.01640.0430
Publisher’s Note: MDPI stays neutral with regard to jurisdictional claims in published maps and institutional affiliations.

