Article

Determination of the Variability of Bioactive Compounds and Minerals in Olive Leaf along an Agronomic Cycle

by
María Esther Martínez-Navarro
,
Cristina Cebrián-Tarancón
,
Gonzalo L. Alonso
and
María Rosario Salinas
*
Catedra de Química Agrícola, Universidad de Castilla-La Mancha, E.T.S.I. Agrónomos y Montes, Avda. de España s/n, 02071 Albacete, Spain
*
Author to whom correspondence should be addressed.
Agronomy 2021, 11(12), 2447; https://doi.org/10.3390/agronomy11122447
Submission received: 14 October 2021 / Revised: 15 November 2021 / Accepted: 26 November 2021 / Published: 30 November 2021

Abstract

:
Olive leaves are still considered waste in the oil industry; however, the leaves have a content of oleuropein and other bioactive compounds that gives them great potential to be transformed into by-products. The most appropriate moment along an agronomic cycle (November 2019 to October 2020) has been evaluated to take advantage of this potential of the olive leaves varieties of Picual, Cornicabra and Manzanilla. In addition, factors that affect the content of phenolic compounds such as absolute maximum and minimum temperatures, relative humidity, sunshine hours, rainfall, differential of temperatures and mineral nutrition have been studied. The results show that the pruning season was the best time to take advantage of the olive leaf due to its high oleuropein content, especially in Picual and Manzanilla. The variety was the factor that most affected all the phenolic compounds studied, while the absolute minimum temperature factor notably affected verbascoside. Particular mineral nutrients, such as Mg and Fe, turned out to be most useful for differentiating locations. The content of verbascoside and hydroxytyrosol was also affected by agronomic conditions (location/conventional or ecological).

1. Introduction

Olive-growing (Olea europaea L.) to produce olives and olive oils generates high amounts of by-products, such as olive stone, and waste. The most abundant kind of waste are olive leaves generated during maintenance work in olive groves and from olive oil production in oil mills. During the pruning season 1.5–3 annual tons per ha can be reached, while the weight of olive leaf in an oil mill ranges between approximately 0.075 and 0.15 annual tons per ha [1,2]. At present, olive leaves are burned or used for animal feed, though this kind of waste is the most susceptible to being transformed into a by-product due to its composition, being rich in phenolic compounds such as secoroids. This group is represented mainly by oleuropein, which is the majority compound of olive leaf; simple phenolic alcohols, such as hydroxytyrosol and tyrosol; flavonoids, such as apigenin 7-O-glucoside and diosmetin-7-O-glucoside; hydroxycinnamic acid derivatives, such as verbascoside. Oleuropein has been identified as the most suitable precursor of hydroxytyrosol, which has a wide range of biotical and pharmacological uses, as a potential therapeutic, antithrombotic, cardioprotective, antitumor, microbicidal or anti-inflammatory agent [3,4,5], for example. There is a great potential to obtain aqueous extracts rich in bioactive compounds from olive leaves due to the water-solubility of these compounds, making this waste very interesting for its transformation in the oil mills themselves [6].
However, phenolic compound content in olive leaf is variable during the agronomic cycle of the olive tree due to various factors such as temperature, humidity, light, rainfall, altitude, variety, the age of leaves and human influences. [7]. Although there are also other factors, such as enzyme activities [8], which can be modulated largely by the above factors.
In addition, there is evidence that plant tolerance or resistance to extreme factors can be affected by nutritional status, but it is generally assumed that an adequate nutritional condition for optimal plant growth is also optimal for plant tolerance to these stresses [9].
The aim of this study was to discover the moment in the agronomic cycle when the content of oleuropein and other phenolic compounds is highest in the leaves of different olive varieties. For this purpose, olive leaves from Picual and Cornicabra varieties in an ecological system and Manzanilla in a conventional system, both in intensive plantation frameworks, were sampled monthly. In addition, the absolute maximum and minimum temperatures, relative humidity, sunshine hours, rainfall and temperature differential were also taken into account, as well as leaf mineral composition.

2. Materials and Methods

2.1. Raw Material and Agronomic Conditions

Olive leaves (Olea europaea L.) from Picual, Cornicabra and Manzanilla varieties (Table 1) were collected monthly from November 2019 to October 2020 along an agronomic cycle from two different plots in the Castilla–La Mancha region (southwest Spain, altitude of 865 m, 39°38′16″ N latitude and 2°53′21″ W longitude).
Leaves from the Picual and Cornicabra varieties were collected in a homogeneous ecological plot located in the south (38°37′29.8200″ N; 2°35′7.2960″ W), whose agronomic practices consisted of tillage to prevent soil degradation and crop management without chemical pest control and with naturally derived minerals such as copper applied at the end of winter. The plot was located in a geological zone at a valley bottom (edges, gravel, block, sand and silt) whose soil texture is silty clay-loam. On the other hand, the Manzanilla variety leaves were collected in the southeast of this region (39°24′18.7920″ N; 2°8′33.3960″ W) in a homogeneous plot with traditional crop management in terms of soil tillage practices and chemical intervention to fight pests and provide plant nutrition. Copper and dimethoate were used in May, while in September it was fertilized with rabbit droppings and straw. The plot belonged to a geological zone of gravels and sands in an alluvial system, whose soil texture is sandy loam.

2.2. Weather Parameters

The climate data were obtained from meteorological stations near the plots: station 1 (38°41′ 49.5276″ N, 2°52′53.2647″ W) for the Picual and Cornicabra varieties; station 2 (39°27′17.2152″ N, 2°5′29.6578 W) for the Manzanilla variety (SIAR, 2020). The weather parameters used for the study were the absolute maximum temperature (TM), defined as the highest air temperature reached in a day; absolute minimum temperature (tm), defined as the lowest air temperature reached in a day; mean relative humidity (RH), defined as the ratio of the partial pressure of water vapor to the equilibrium vapor pressure of water at a given temperature; sunshine hours (SH), as the maximum duration of sunshine; rainfall (RF) daily maximum, such as total daily precipitation; differential temperature (ΔT), as the difference between the absolute minimum and maximum temperature in a day. For each parameter, the average of the two weeks before sampling was used, except for RF, for which the sum of the previous five days was used.

2.3. Sample Preparation

Five trees per variety were used for sampling. In order to minimize any potential influence related to age and space orientation on phenolic analyses, shoots of each olive tree were divided into three parts: age 0 (new leaves at the end of the shoot, light green color, small size), age 1 (olive leaves developed in the central part of the shoot, darker green color than age 0, medium size) and age 2 (olive leaves developed in the part furthest from the tip of the shoot, the darkest green color, larger size). Ten leaves of each age were collected at a height of 1.80 m at the 4 cardinal points. Leaf samples of age 0, 1 and 2 positioned at North, South, East and West have been pool together for each tree reaching 120 leaves, which were dried in the dark for seven days and stored at freezing temperatures (−20 °C) until use. The frozen and dried leaves were ground in a knife mill (ARES FML-2000, Barcelona, Spain), sieved (500 mesh) and subjected to microwave extraction using water as an extractant according to the methodology described by Martínez-Navarro et al. (2021) [6]. All extractions were performed in triplicate.

2.4. Determination of Oleuropein and Other Phenolic Compounds

The analysis was carried out according to the method in Martínez-Navarro et al. (2021) [6]. Aqueous extracts, pre-filtered by nylon syringe filter 0.22 μm (Labbox, Barcelona, Spain), were injected into an Agilent 1200 high-performance liquid chromatograph (Palo Alto, CA, USA) equipped with a diode-array detector (Agilent G1315D) coupled to a ChemStation, version B.03.01 (Agilent, Palo Alto, CA, USA) data-processing station. Separation was performed on a reverse-phase C18 column, Brisa LC2 (250 mm × 4.6 mm, 5 μm particle size), purchased from Teknokroma (Barcelona, Spain), at 30 °C. The phenolic compounds studied were oleuropein, verbascoside, hydroxytyrosol and flavonoids (mainly apigenin-7-glucoside and diosmetin-7-glucoside). These compounds were monitored at a wavelength of 280 nm, except for diosmetin-7-glucoside, which was measured at 360 nm. All analyses were performed in triplicate and expressed as milligrams of compound per gram of olive leaf.

2.5. Mineral Composition

Macro- (P, K, Mg, Ca, S) and micronutrients (Fe, Mn, Zn, B and Cu) in olive leaves were analyzed by inductively coupled plasma optical emission spectroscopy (ICP-OES) using a Thermo ICAP 6500 Duo (Thermo Fisher Scientific, Waltham, MA, USA) at harvest (November) and pruning (March) time [8] due to the promise that these two periods show for the easy use of the olive leaf.

2.6. Statistical Analysis

Data processing (mean and deviation standard) was performed using Excel (Microsoft Corp., Redmond, WA, USA). SPSS version 24.0 (IBM Corp., Armonk, NY, USA) was used for statistical analysis via one-way analysis of variance (ANOVA) for comparisons and two-way ANOVA with variety and location/agronomic system as factors. Tukey and F test with a 95% confidence interval to determine significant differences. Pearson correlation analysis was used to evaluate the relationship between different compounds and the effect of weather parameters on phenolic content.

3. Results

The location of the plots (L1 and L2) corresponds to a Mediterranean basin climate. However, the plots had different weather during the time that the study lasted, as shown in Figure 1.
The TM in L2 developed gradually and smoothly with higher temperatures in winter (15.1 °C), spring (19.8 °C) and summer (33.0 °C) compared with L1 (13.3, 18.2 and 31.9 °C, respectively), while the latter showed more abrupt changes and the warmest autumn (17.0 °C compared to 13.4 °C in L2). The coldest tm was collected in L2, where the winter was colder, with an average temperature below zero (−2.6 °C). RH was higher in spring at L1 (66.9% compared to 59.8% in L2), while at L2 the summer and autumn showed higher RH (46.0 and 78.9% in contrast with 36.5 and 77.3% in L1, respectively). The latter was also related to RF; autumn in L2 was rainier (20.8 mm) than in L1 (9 mm), and the situation was reversed in spring, with 21 mm at L1 compared to 0.8 mm at L2. As for SH, it ranged between 5.45 and 9.56 h in autumn and winter, and 8.69 and 13.06 h in the summer and spring.

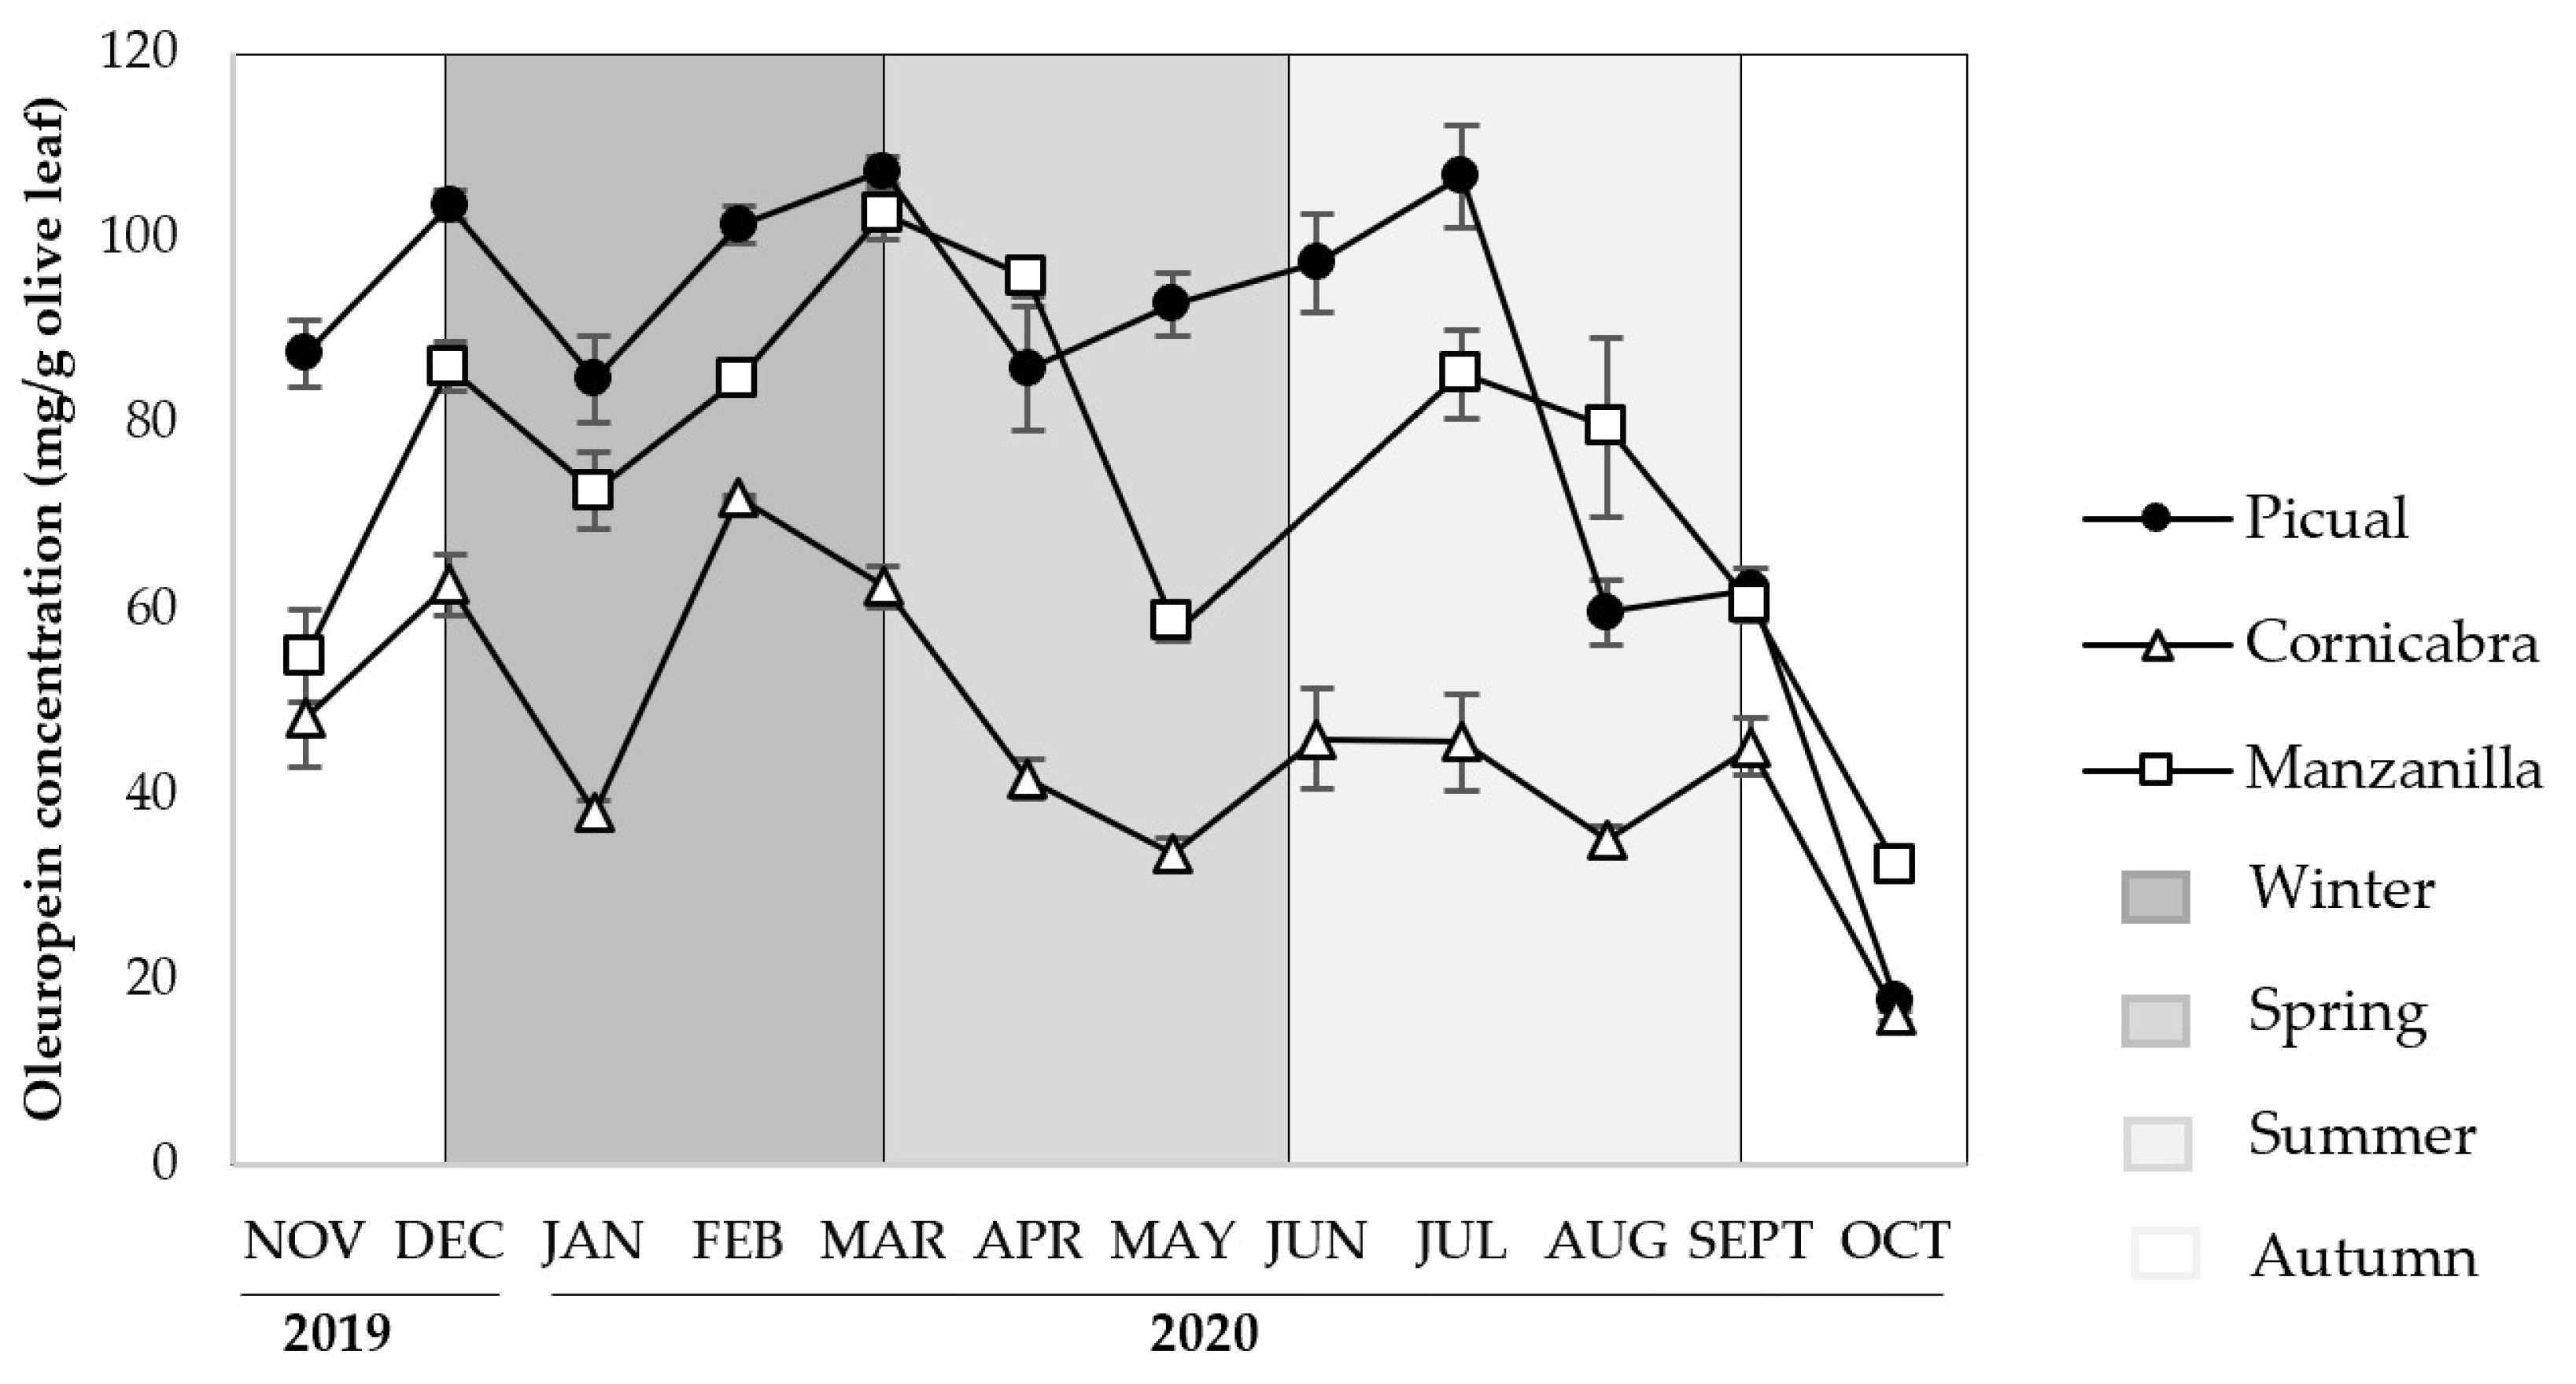
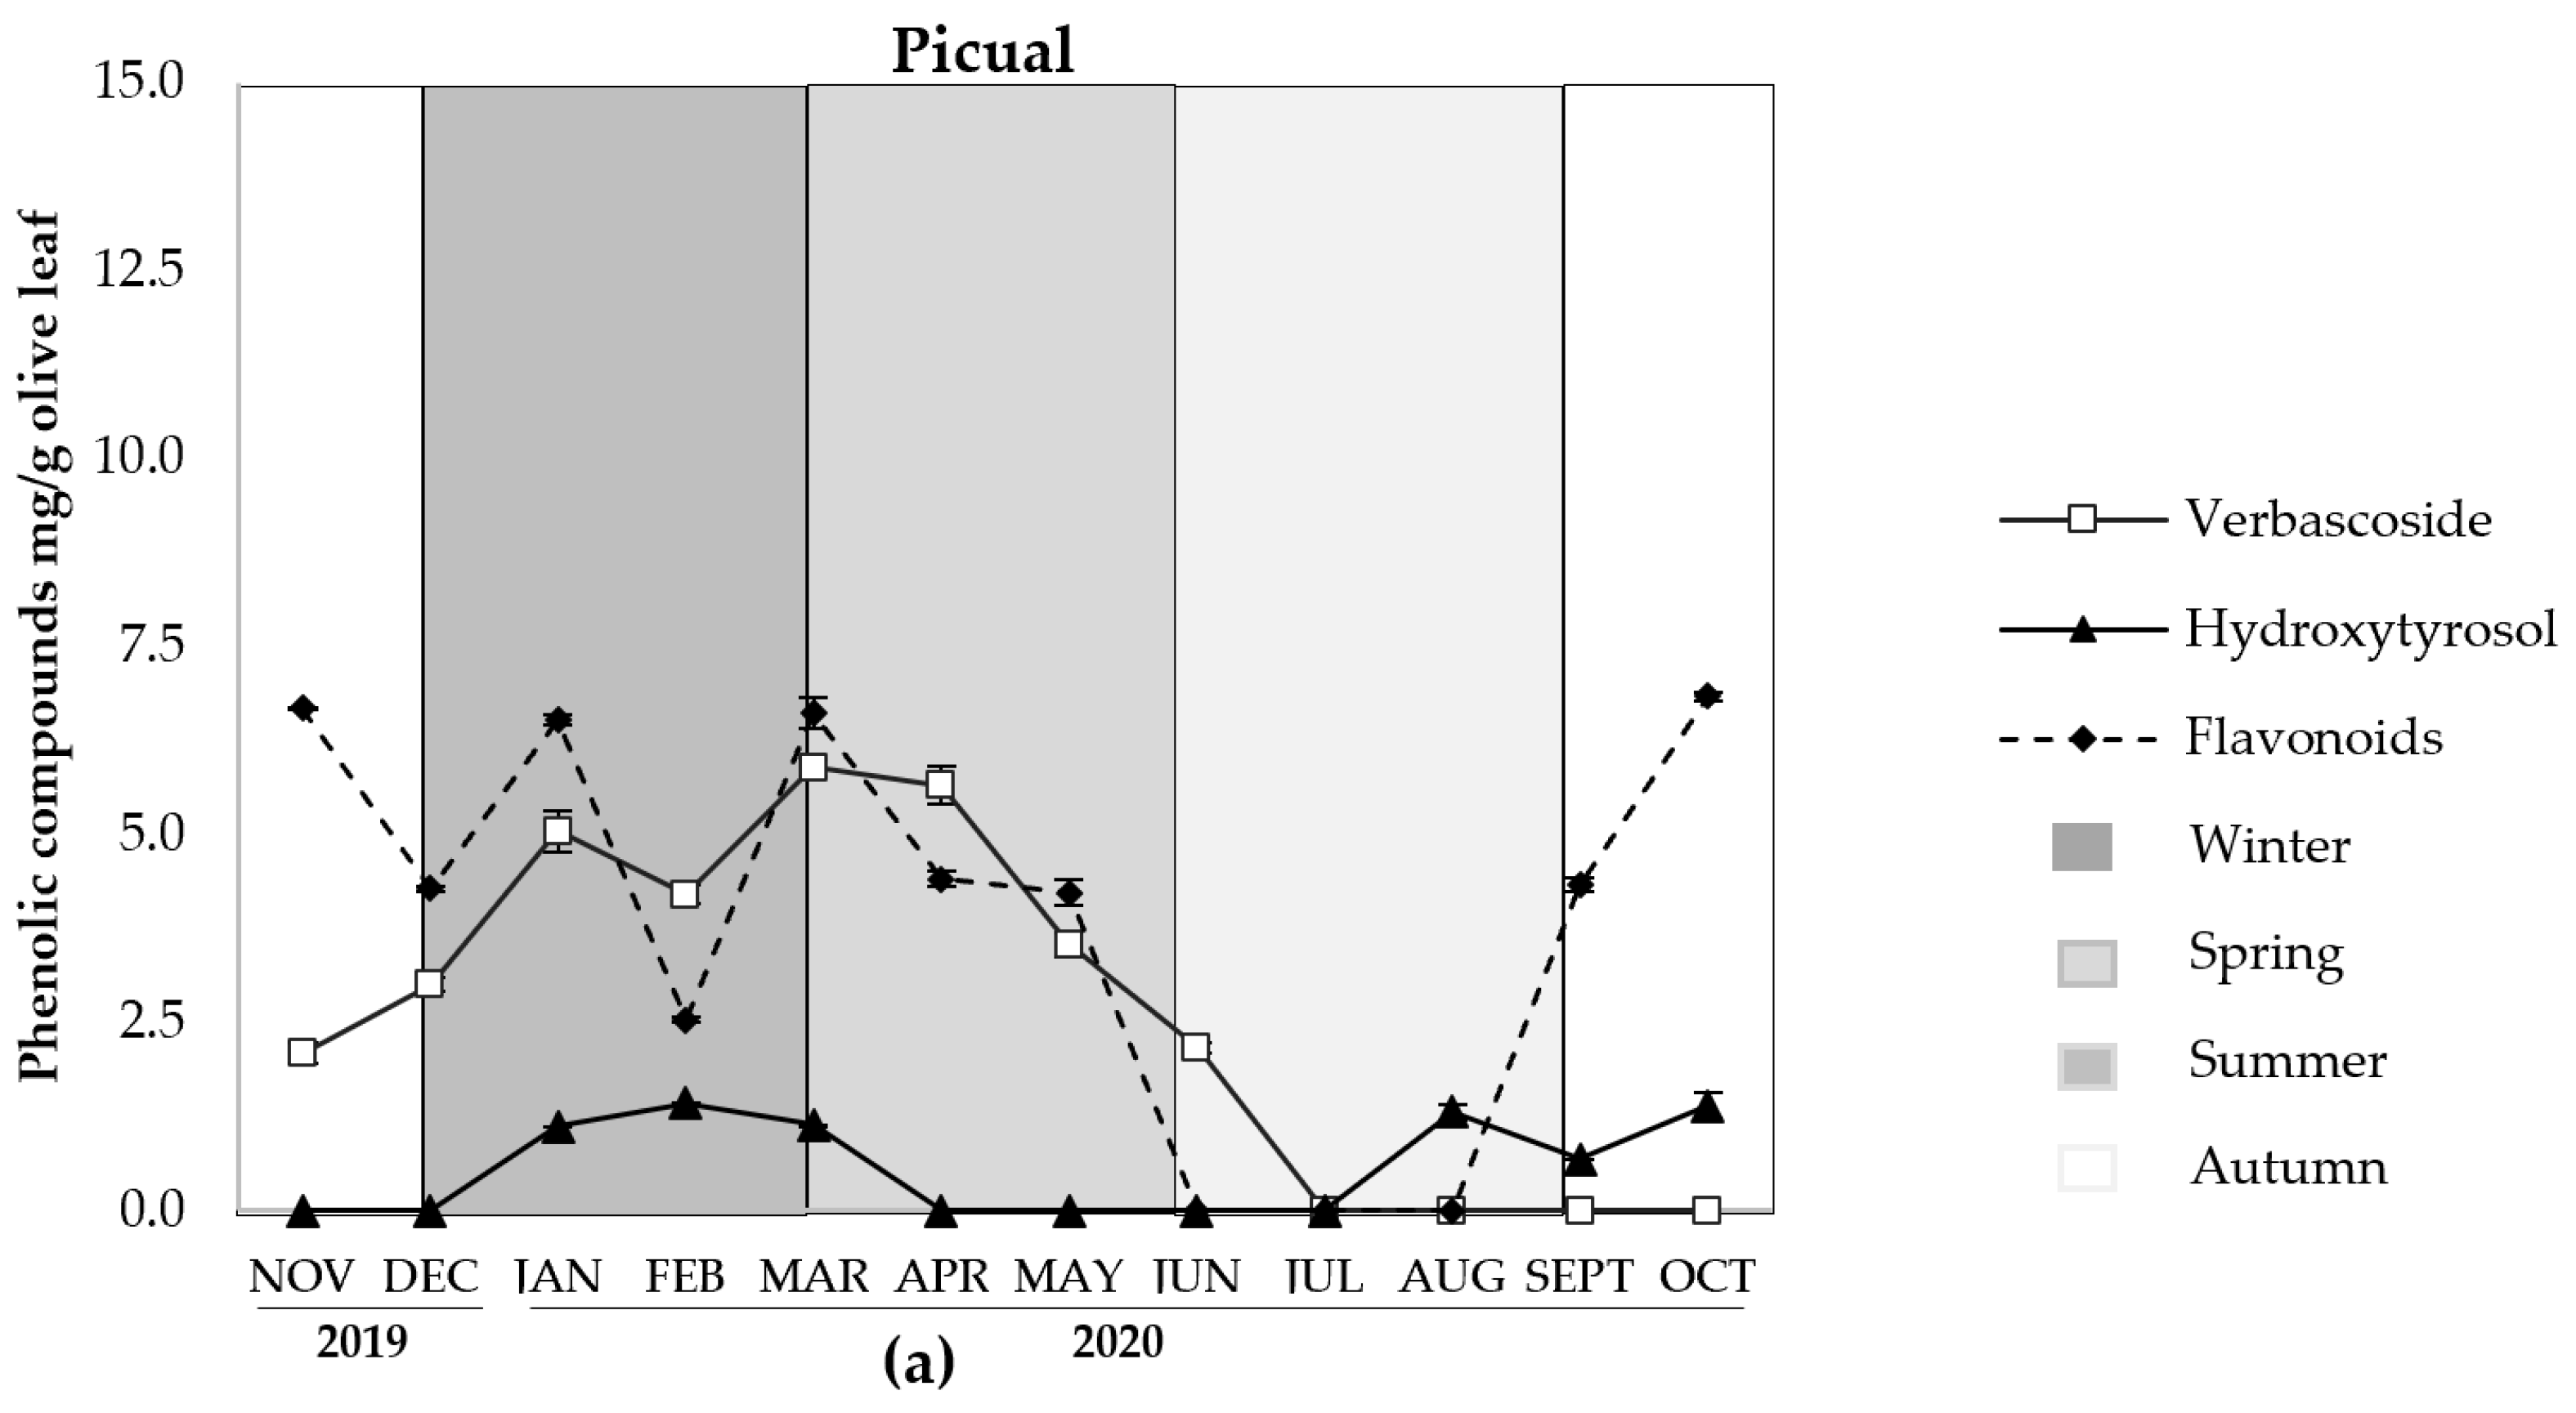
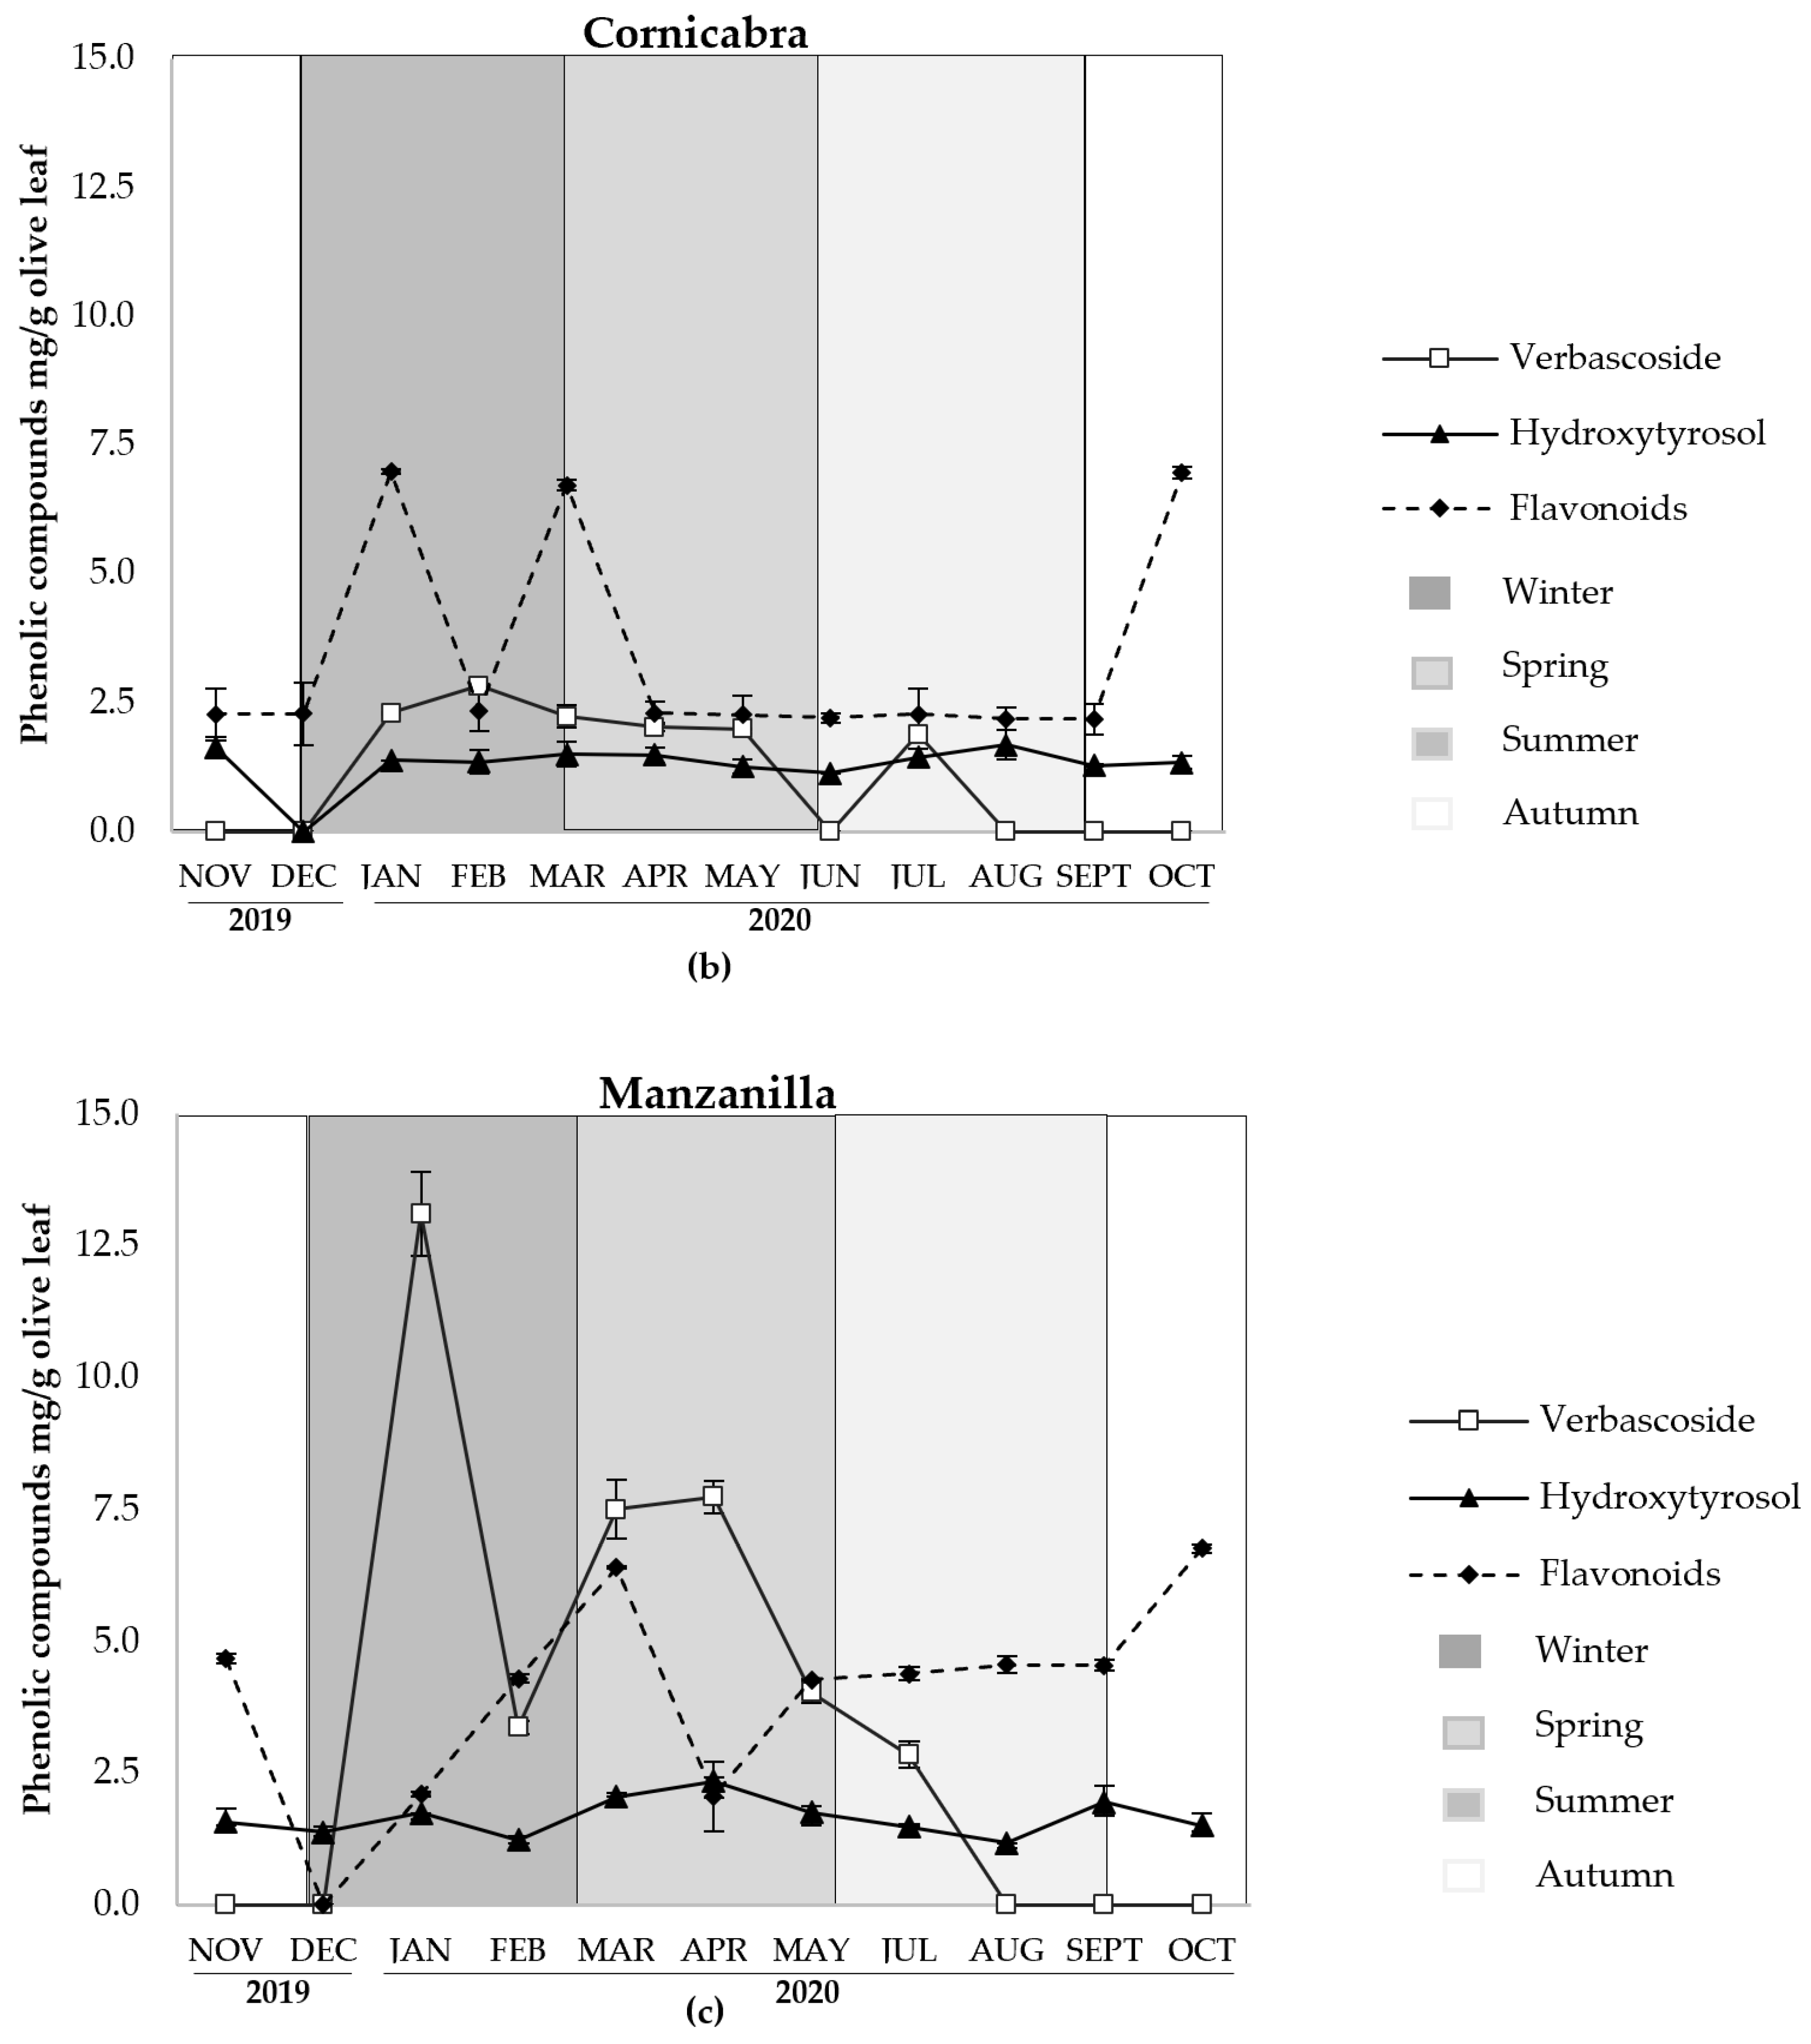
3.1. Comparison between Different Varieties

The effect of olive varieties studied according to the phenolic compound content in their leaves is shown in Table 2.
The variety’s agronomic factor affected the oleuropein (p < 0.001), hydroxytyrosol (p < 0.01), verbascoside (p < 0.001) and flavonoid (p < 0.05) content. Throughout the cycle there were variations in the behavior of the content of all phenolic compounds. Oleuropein (Figure 2) had similar trends but variations between different months in the content of Picual, Cornicabra and Manzanilla varieties.
The variety with the highest oleuropein content was Picual, followed closely by Manzanilla and, in last place, Cornicabra. For Picual and Manzanilla, both peaks were obtained in March (107.17 and 102.49 mg/g, respectively), while for Cornicabra it was in February (71.95 mg/g). In this work, Picual and Cornicabra were harvested in November and pruned in December, during the winter season. At the latter stage an increase in oleuropein content was observed, reaching levels of 103.42 and 62.61 mg/g for the two varieties, respectively. Manzanilla was harvested in November, but these olive trees were not pruned, though an increase in oleuropein content of up to 86.07 mg/g was also observed. Subsequently, a decline in January was observed in Picual (from 87.49 to 84.76 mg/g) and Cornicabra (from 48.33 to 37.98 mg/g), but this was not observed in Manzanilla. Subsequently, from January to the end of winter (Figure 2), oleuropein levels increased to 107.16 mg/g in Picual, 102.50 mg/g in Manzanilla and 62.38 mg/g in Cornicabra. In the spring season, oleuropein concentration decreased in all varieties, reaching its lowest level in May in Cornicabra (33.64 mg/g) and Manzanilla (58.52 mg/g), while in Picual this was reached in April (85.85 mg/g). At the beginning of the summer season, the content increased again in the varieties Picual (106.59 mg/g) and Manzanilla (85.26 mg/g) in July, while in Cornicabra, the content remained stable at around 46 mg/g. The lowest contents were obtained in the autumn season (October) in all varieties, with levels of 17.70 mg/g in Picual, 16.11 mg/g in Cornicabra and 32.36 mg/g in Manzanilla (Figure 2). Regarding to the mean concentration for each climatic season (Table 2), Picual showed the highest oleuropein levels in all cases, followed by Manzanilla and Cornicabra. In addition, it is important to note that oleuropein was significantly different between all varieties except in autumn, which did not show significant differences (p > 0.05).
Concerning the other phenolic compounds studied (Figure 3a–c), the highest verbascoside content was found in Manzanilla in January (13.11 mg/g), followed by Picual (5.89 mg/g) in March and Cornicabra (2.82 mg/g) in February.
Verbascoside was not detected during mid or late summer in any plots, nor in autumn in Cornicabra and Manzanilla. Hydroxytyrosol showed more stable behavior in the three varieties, with the maximum content being found in Manzanilla (2.35 mg/g) in April, followed by Cornicabra (1.69 mg/g) in August and Picual (1.43 mg/g) in February. In addition, the significant differences (p < 0.001) between the hydroxytyrosol contents of the different varieties found in spring should be noted (Table 2). As for the flavonoids, composed mainly of apigenin-7-glucoside and diosmetin-7-glucoside, they showed the maximum content range of all the varieties of between 6.76 and 6.98 mg/g. Three maximum peaks were observed in Picual and Cornicabra leaves, coinciding with the months of January (Picual: 6.52 mg/g; Cornicabra: 6.98 mg/g), March (Picual: 6.62 mg/g; 6.72 mg/g) and October (Picual: 6.84 mg/g; Cornicabra: 6.96 mg/g). However, in Manzanilla leaves, two of the highest peaks were also obtained in March (6.41 mg/g) and October (6.76 mg/g), but the third was registered in November (4.68 mg/g). Regarding to the average concentration for each climatic season, significant differences between the flavonoid contents in the studied varieties were observed only in summer (p < 0.001) (Table 2).
On the other hand, in order to know the possible interaction between the studied phenolic compounds, a statistical correlation study was carried out (Table 3).
Oleuropein was positively correlated with verbascoside (p < 0.05, r = 0.4769), and negatively with hydroxytyrosol (p < 0.05, r = −0.3488). This latter negative correlation was expected, since hydroxytyrosol is a by-product from oleuropein hydrolysis.
On the other hand, in an attempt to compare agronomic conditions between the compounds tested, it was observed that the average oleuropein content throughout the agronomic cycle in the ecological (Picual and Cornicabra) and conventional (Manzanilla) plots is shown in Table 2. Manzanilla, the only variety growing in a conventional system, showed a mean oleuropein content of 73.87 mg/g, while in an ecological system this was 64.68 mg/g. However, the oleuropein content was not significant different between the varieties (p > 0.05; Table 2), because the varieties belonging to the ecological system showed the highest and lowest content of this compound. Hydroxytyrosol and verbascoside were the only compounds studied influenced (p < 0.01 and p < 0.001, respectively) by the agronomic conditions (location: conventional or ecological). In addition, hydroxytyrosol and verbascoside were found in higher amounts when the conventional system was used. Therefore, the variety had a greater influence on oleuropein, hydroxytyrosol, verbascoside and flavonoid content than the location (Table 2).

3.2. Influence of Weather Parameters

Correlations between the studied compounds and weather parameters are shown in Table 4.
All the weather parameters studied influenced to a greater or lesser extent the content of the compounds. The weather parameter that showed the most correlation was the absolute minimum temperature (tm), which was correlated with the verbascoside content in all varieties (p < 0.001, r = −0.5600) and the flavonoid content in Cornicabra (p < 0.05; r = −0.3359). In all cases, this correlation showed negative values. The second weather parameter that showed correlation was the absolute maximum temperature (TM), especially on Picual’s content of verbascoside (p < 0.05, r = −0.6442) and flavonoids (p < 0.01, r = −0.7683). Nevertheless, the differential temperature (ΔT) did not show a great impact on the compound content, except for the flavonoids of the Picual (p < 0.05, r = 0.6739). Regarding relative humidity (RH) and hours of sunshine (SH), both showed correlations for flavonoid content in Picual. RH was positively correlated with flavonoid content (p < 0.01, r = 0.8116) and to a lesser extent with all varieties, while SH did negatively (p < 0.05, r = −0.6996). Finally, the climate factor that showed the least correlation was rain (RF); only in the oleuropein content of Manzanilla was a negative correlation (p < 0.05, r = −0.6584) observed. However, in this study, a negative correlation with oleuropein content was only seen in Manzanilla.

3.3. Mineral Composition

The nutritional composition in November (the usual harvest period) and March (the usual pruning period) are shown in Table 5.
In general, the varieties located in the same plot (Picual and Cornicabra) showed similar macro- and micro-nutrient values compared to Manzanilla from another plot. This could be due to the different edaphoclimatic characteristics and the agronomic techniques used in each location. The P at harvest time in Picual and Cornicabra was 1.14 and 1.08 g/kg respectively, while Manzanilla showed better levels (1.52 g/kg). In the pruning season, the three varieties presented 0.90 g/kg of this element.
The K content was higher in Manzanilla (9.84 and 7.62 g/kg) than in Cornicabra (6.57 and 6.97 g/kg) and Picual (6.57 and 6.71 g/kg) both at harvest and pruning, respectively. The Mg concentration in leaves showed significant differences (p < 0.05) in the two periods for the three varieties. In all varieties, the trend was a decrease in concentration between 34% and 14%. Manzanilla had the lowest concentrations at the harvest (1.05 g/kg) and pruning season (0.69 g/kg). Ca concentration in Cornicabra and Picual showed the highest values in a range between 23.20 and 27.00 g/kg, while Manzanilla showed the lowest values (17.30 g/kg) in both periods. The Fe content showed a range of 76.38–116.55 mg/kg, being influenced by variety (p < 0.05). The lowest concentrations of this element were shown by the Manzanilla variety (76.38 and 80.45 mg/kg). The Mn content remained stable in Picual and Cornicabra, but a slight decrease in the concentration was observed at pruning time in Manzanilla, reaching 36.27 mg/kg. The Zn concentration did not show any correlation with the varieties (p > 0.05). Slightly lower values were shown from harvest (≈17.32 mg/kg) to pruning (≈14.27 mg/kg) time. The content of B ranged between 11.98 and 9.72 mg/kg both at harvest and pruning. The Cu leaf content was the most variable of all the studied elements (24.29–110.63 mg/g) and the most significant for each variety (p < 0.001) in both periods.

4. Discussion

The varieties that showed the highest oleuropein content in the olive leaf coincide with the study carried out by Lorini et al. (2021) [10] of Arbequina, Manzanilla and Picual cultivars, where the highest oleuropein content in olive leaf throughout the four seasons (winter, spring, summer and autumn) was observed in the Picual variety, followed very closely by Manzanilla. Similar trends to other studies were also observed during the different seasons, in winter a decrease in oleuropein content of Picual and Cornicabra was observed, which was similar to that observed by Romero et al. (2017) [11] in olive leaves from Picual trees in the south of Spain during the 2012/2013 season, where the oleuropein content decreased from 72.12 mg/g in November to 54.02 mg/g in January. During the spring season, the oleuropein content of the three varieties decreased, however the content obtained in Picual was above that studied by Romero at al. (2017) [11] for the same month (47.47 mg/g). As for the summer season, Jiménez-Herrera et al. (2019) [12] obtained in olive leaves oleuropein contents of 49.20 mg/g in water-stressed Picual trees and 62.00 mg/g in irrigation; a similar value of 62.07 mg/g was obtained in this study for the same month and variety but under water-stressed conditions. In the autumn the lowest contents were obtained in all varieties, this behavior could be associated with the lower production of young leaves in this season in combination with the degradation of oleuropein due to the decrease in the enzymatic activity of L-phenylalanine ammonia-lyase, which is involved in the metabolism of phenolic compounds in olive trees [13,14,15]. In contrast, Lorini et al. (2021) [10] obtained the highest oleuropein concentration in Picual (1.1 × 10⁻⁴ mg/g) and Manzanilla (0.9 × 10⁻⁴ mg/g) in the autumn season in Brazil, which is equivalent to the end of December in this study, coinciding with high contents of 103.42 in Picual and 86.07 mg/g in Manzanilla. Additionally, Olmo-García et al. (2018) [16] reported olive leaf contents in Picual of 1.79 mg/g and Manzanilla of 8.21 mg/g in December. On the other hand, the possible positive correlation observed between oleuropein and verbascoside content and the negative correlation with hydroxytirosol does not coincide with the studies of some authors [17,18], who have observed an inverse relationship between oleuropein and verbascoside.
In conventional and ecological systems, but specially in the latter, it is common that the presence of extreme factors (very high or low temperatures, high light exposition, hydric deficiency, high altitude or low relative humidity) during the growth of the olive trees have an important influence on the phenolic compound content in olive leaves, especially for oleuropein [7]. Therefore, it is not surprising that generally leaves from ecological olive trees can have higher contents of phenolic compounds due to the more adverse conditions (rainfed, limited active use of substances and high altitude, among others) in which they are usually cultivated compared to conventional crops. However, the results of this work show a different trend, since Manzanilla leaves showed mostly higher phenolic compound concentrations than ecological Cornicabra leaves. The design of the present study did not allow comparison of the influence of variety on oleuropein, hydroxytyrosol, verbascoside and flavonoid content with that of the agronomic system. Despite the latter, a study carried out by Lukíc et al. (2020) [19] showed that the variety significantly influenced the content of phenolic compounds in Croatian olive leaf.
The weather parameters also affected the content of phenolic compounds, the tm was negatively correlated with the content of verbascoside, oleuropein and flavonoids. Ortega-García and Peragón (2009) [14] reported a large increase in oleuropein content in leaves after olive exposure to cold stress, which, together with the positive correlation seen in this study between oleuropein content and verbascoside (Table 3), could explain this increase in verbascoside with lower temperatures. The correlation between TM and the content of verbascoside, hydroxytyrosol and flavonoids could be explained by the study carried out by Dias et al. (2019) [20], who exposed Olea europaea L. plants to a temperature of 40 °C for 2 h for two consecutive days and observed that high temperature decreases some phenolic compounds. However, plants that had recovered from heat stress showed an increase in some compounds, suggesting a protective role, mainly secoiridoids (oleuropein), flavonoids and monoterpenes. Dias et al. (2019) [20] suggested that verbascoside is mostly unaffected by heat and may not be relevant in protecting olive trees against heat stress, in contrast to what was suggested by Pfündel et al. (2007) [21]. The impact of ΔT on the flavonoid content was also observed in grape flavonoids, which increased when the temperature differential between day and night increased [22]. The SH affected the flavonoid content, which coincides with that studied by Talhaoui et al. (2015) [7], who observed that light was one of the main factors affecting the phenolic compounds of olive leaves, especially flavonoids. Olive is known to be a drought-tolerant tree and, under such environmental conditions, phenolic compounds produced in leaves increase [7], which was reflected by the negative correlation with RF.
Regarding the mineral composition, the P at harvest time shown in Picual and Cornicabra varieties limits close to deficiency (1.0 g/kg), while in the pruning season the three varieties presented a deficiency (0.90 g/kg) of this element [21]. For K content, Toplu et al. (2009) [23] obtained concentrations in olive leaves from Manzanilla in conventional system between 9.90 and 8.90 g/kg, which is very similar to those obtained in this study. While it is true that a lack of irrigation inhibits K absorption and reduces its availability in soils, which could be the case in these rainfed plots, all the leaves analyzed were above the deficiency threshold of 4 g/kg [9,24]. In addition, this draws attention to the highest value of Manzanilla collected in harvest season, which could be related to the greater amount of rainfall compared to the pruning season (Figure 1b). Mg from Manzanilla had the lowest concentrations at the harvest and pruning season, being on the threshold of deficiency (1.00 g/kg) [21]. All varieties showed Ca concentration of olive leaves well above the deficiency threshold (10 g/kg) [23]. In general, olive varieties grown in the Mediterranean region have a high Ca content in their leaves. This can be attributed to the adaptation of these local varieties to calcareous soils. The minimum Ca concentration was determined for Manzanilla variety, which agrees with the concentrations obtained by Toplu et al. (2009) [23] in the period 2003–2004 (17.20 and 18.30 g/kg, respectively). The Mn concentration, in all cases, was above the deficiency level (20 mg/kg). B content can be considered deficient according to Beutel et al. (1978) [25], who considered B deficient when the concentration is under 14 mg/kg, while Fernández-Escobar et al. (1999) [24] proposed 33 mg/kg as a limit. Although in our study B concentrations in olive leaves were lower than 14 mg/kg, not a single visible B deficiency symptom, such as apical chlorosis or rosette-arranged new leaves [24], was observed. For this reason, all the B concentrations determined in this study could be characterized as low, but not necessarily deficient. For Cu, it is normal for it to be above the deficiency threshold (4 mg/kg) as it is used extensively as a fungicide added in both conventional and ecological olive groves. In summary, mineral composition seems to depend, for the most part, on edaphic characteristics and crop-growing techniques, while there are particular mineral nutrients, such as Mg and Fe, that could be useful for differentiating locations.

5. Conclusions

The results obtained showed that oleuropein was the majority compound throughout the agronomic cycle. The variety with the highest content was Picual, followed by Manzanilla and Cornicabra, where the maximum contents were found around March (the usual pruning season). In addition, the variety was one of the most influential factors for the oleuropein, hydroxytyrosol, verbascoside and flavonoid contents. To a lesser extent, location also influenced in the content of hydroxytyrosol and verbascoside. Weather parameters also affected the phenolic compound levels, with respect to the tm and the verbascoside content and the TM, tm, RH, SH and ΔT and the flavonoid content. Oleuropein content was positively correlated with verbascoside and negatively correlated with hydroxytyrosol. Regarding the mineral composition of olive leaves, it seems that this depended more on edaphic characteristics and crop-growing techniques, while particular mineral nutrients, such as Mg and Fe, turned out to be most useful for differentiating locations.

Author Contributions

Conceptualization, all authors; methodology, all authors; software, M.E.M.-N. and C.C.-T.; validation, M.E.M.-N. and C.C.-T.; formal analysis, M.E.M.-N. and C.C.-T.; investigation, M.E.M.-N.; resources, all authors; data curation, M.E.M.-N. and C.C.-T.; writing—original draft preparation, all authors; writing—review and editing, all authors.; visualization, all authors; supervision, G.L.A. and M.R.S.; project administration, G.L.A. and M.R.S.; funding acquisition, G.L.A. and M.R.S. All authors have read and agreed to the published version of the manuscript.

Funding

This research received no external funding.

Institutional Review Board Statement

Not applicable.

Informed Consent Statement

Not applicable.

Data Availability Statement

Not applicable.

Acknowledgments

M.E.M.-N. wishes to thank the Universidad de Castilla-La Mancha for the predoctoral contract 2019—PREDUCLM. We thank the Government of Castilla-La Mancha (Spain) in collaboration with FEDER for financing the project SBPLY/17/180501/000191 and the owners of the plots for their collaboration.

Conflicts of Interest

The authors declare no conflict of interest.

References

  1. Lama-Muñoz, A.; Contreras, M.d.M.; Espínola, F.; Moya, M.; Romero, I.; Castro, E. Content of phenolic compounds and mannitol in olive leaves extracts from six Spanish cultivars: Extraction with the Soxhlet method and pressurized liquids. Food Chem. 2020, 320, 126626. [Google Scholar] [CrossRef]
  2. Ruiz, E.; Romero-García, J.M.; Romero, I.; Manzanares, P.; Negro, M.J.; Castro, E. Olive-derived biomass as a source of energy and chemicals. Biofuels Bioprod. Biorefin. 2017, 11, 1077–1094. [Google Scholar] [CrossRef]
  3. Medina, E.; Romero, C.; Garcia, P.; Brenes, M. Characterization of bioactive compounds in commercial olive leaf extracts, and olive leaves and their infusions. Food Funct. 2019, 10, 4716–4724. [Google Scholar] [CrossRef] [PubMed] [Green Version]
  4. Khan, H.; Ahmad, W.; Hussain, I.; Imran, M.; Afridi, M.S.; Ullah, S. Phytochemical composition, antioxidant and antimicrobial activities of leaves of Olea europaea wild variety. J. Food Meas. Charact. 2020, 14, 640–648. [Google Scholar] [CrossRef]
  5. Cavaca, L.A.S.; López-Coca, I.M.; Silvero, G.; Afonso, C.A.M. Chapter 5-The olive-tree leaves as a source of high-added value molecules: Oleuropein. In Studies in Natural Products Chemistry; Atta Ur, R., Ed.; Elsevier: Amsterdam, The Netherlands, 2020; Volume 64, pp. 131–180. [Google Scholar]
  6. Martínez-Navarro, E.M.; Cebrián-Tarancón, C.; Moratalla-López, N.; Lorenzo, C.; Alonso, G.L.; Salinas, R.M. Development and validation of an HPLC-DAD method for determination of oleuropein and other bioactive compounds in olive leaf by-products. J. Sci. Food Agric. 2021, 101, 1447–1453. [Google Scholar] [CrossRef] [PubMed]
  7. Talhaoui, N.; Taamalli, A.; Gómez-Caravaca, A.M.; Fernández-Gutiérrez, A.; Segura-Carretero, A. Phenolic compounds in olive leaves: Analytical determination, biotic and abiotic influence, and health benefits. Int. Food Res. 2015, 77, 92–108. [Google Scholar] [CrossRef]
  8. Koudounas, K.; Thomopoulou, M.; Rigakou, A.; Angeli, E.; Melliou, E.; Magiatis, P.; Hatzopoulos, P. Silencing of Oleuropein β-Glucosidase Abolishes the Biosynthetic Capacity of Secoiridoids in Olives. Front. Plant Sci. 2021, 12, 671487. [Google Scholar] [CrossRef]
  9. Fernández-Escobar, R. Olive Nutritional Status and Tolerance to Biotic and Abiotic Stresses. Front. Plant Sci. 2019, 10, 1151. [Google Scholar] [CrossRef]
  10. Lorini, A.; Aranha, B.C.; Antunes, B.d.F.; Otero, D.M.; Jacques, A.C.; Zambiazi, R.C. Metabolic profile of olive leaves of different cultivars and collection times. Food Chem. 2021, 345, 128758. [Google Scholar] [CrossRef]
  11. Romero, C.; Medina, E.; Mateo, M.A.; Brenes, M. Quantification of bioactive compounds in Picual and Arbequina olive leaves and fruit. J. Sci. Food Agric. 2017, 97, 1725–1732. [Google Scholar] [CrossRef] [Green Version]
  12. Jiménez-Herrera, R.; Pacheco-López, B.; Peragón, J. Water Stress, Irrigation and Concentrations of Pentacyclic Triterpenes and Phenols in Olea europaea L. cv. Picual Olive Trees. Antioxidants 2019, 8, 294. [Google Scholar] [CrossRef] [Green Version]
  13. Ranalli, A.; Contento, S.; Lucera, L.; Di Febo, M.; Marchegiani, D.; Di Fonzo, V. Factors Affecting the Contents of Iridoid Oleuropein in Olive Leaves (Olea europaea L.). J. Sci. Food Agric. 2006, 54, 434–440. [Google Scholar] [CrossRef]
  14. Ortega-García, F.; Peragón, J. The response of phenylalanine ammonia-lyase, polyphenol oxidase and phenols to cold stress in the olive tree (Olea europaea L. cv. Picual). J. Sci. Food Agric. 2009, 89, 1565–1573. [Google Scholar] [CrossRef]
  15. Ortega-García, F.; Peragón, J. HPLC analysis of oleuropein, hydroxytyrosol, and tyrosol in stems and roots of Olea europaea L. cv. Picual during ripening. J. Sci. Food Agric 2010, 90, 2295–2300. [Google Scholar] [CrossRef] [PubMed]
  16. Olmo-García, L.; Bajoub, A.; Benlamaalam, S.; Hurtado-Fernández, E.; Bagur-González, M.G.; Chigr, M.; Mbarki, M.; Fernández-Gutiérrez, A.; Carrasco-Pancorbo, A. Establishing the Phenolic Composition of Olea europaea L. Leaves from Cultivars Grown in Morocco as a Crucial Step Towards Their Subsequent Exploitation. Molecules 2018, 23, 2524. [Google Scholar] [CrossRef] [PubMed] [Green Version]
  17. Amiot, M.J.; Fleuriet, A.; Macheix, J.J. Importance and evolution of phenolic compounds in olive during growth and maturation. J. Agric. Food Chem. 1986, 34, 823–826. [Google Scholar] [CrossRef]
  18. Funes, L.; Fernández-Arroyo, S.; Laporta, O.; Pons, A.; Roche, E.; Segura-Carretero, A.; Fernández-Gutiérrez, A.; Micol, V. Correlation between plasma antioxidant capacity and verbascoside levels in rats after oral administration of lemon verbena extract. Food Chem. 2009, 117, 589–598. [Google Scholar] [CrossRef]
  19. Lukić, I.; Pasković, I.; Žurga, P.; Majetić Germek, V.; Brkljača, M.; Marcelić, Š.; Ban, D.; Grozić, K.; Lukić, M.; Užila, Z.; et al. Determination of the Variability of Biophenols and Mineral Nutrients in Olive Leaves with Respect to Cultivar, Collection Period and Geographical Location for Their Targeted and Well-Timed Exploitation. Plants 2020, 9, 1667. [Google Scholar] [CrossRef] [PubMed]
  20. Dias, M.C.; Figueiredo, C.; Pinto, D.C.G.A.; Freitas, H.; Santos, C.; Silva, A.M.S. Heat shock and UV-B episodes modulate olive leaves lipophilic and phenolic metabolite profiles. Ind. Crops Prod. 2019, 133, 269–275. [Google Scholar] [CrossRef]
  21. Pfündel, E.E.; Agati, G.; Cerovic, Z.G. Optical Properties of Plant Surfaces. In Annual Plant Reviews Volume 23: Biology of the Plant Cuticle; Blackwell Publishing Ltd.: Hoboken, NJ, USA, 2006; pp. 216–249. [Google Scholar] [CrossRef]
  22. Campayo, A.; Serrano de la Hoz, K.; García-Martínez, M.M.; Salinas, M.R.; Alonso, G.L. Spraying Ozonated Water on Bobal Grapevines: Effect on Wine Quality. Biomolecules 2020, 10, 213. [Google Scholar] [CrossRef] [Green Version]
  23. Toplu, C.; Uygur, V.; Yildiz, E. Leaf Mineral Composition of Olive Varieties and Their Relation to Yield and Adaptation Ability. J. Plant Nutr. 2009, 32, 1560–1573. [Google Scholar] [CrossRef]
  24. Fernández-Escobar, R.; Moreno, R.; García-Creus, M. Seasonal changes of mineral nutrients in olive leaves during the alternate-bearing cycle. Sci. Hortic. 1999, 82, 25–45. [Google Scholar] [CrossRef]
  25. Beutel, J.; Uriu, K.; Lilleland, O. Leaf Analysis for California Deciduous Fruits: Soil and Plant Tissue Testing in California; Reisenauer, H.M., Ed.; University of California: Los Angeles, CA, USA, 1978; pp. 11–14. [Google Scholar]
Figure 1. Weather parameters from November (2019) to October (2020). (a): Location 1; (b): Location 2. Main axis: absolute maximum temperature (TM; °C) and absolute minimum temperature (tm; °C). Secondary axis: rainfall (RF; mm), relative humidity (RH; %) and sunshine hours (SH; h).
Agronomy 11 02447 g001
Figure 2. Evolution of oleuropein (mg/g) of olive leaves cv. Picual, Cornicabra and Manzanilla during an agronomic cycle (November 2019 to October 2020).
Agronomy 11 02447 g002
Figure 3. Evolution of several phenolic compounds (mg/g) of olive leaves during an agronomic cycle (November 2019 to October 2020). (a) Picual; (b) Cornicabra; (c) Manzanilla.
Agronomy 11 02447 g003aAgronomy 11 02447 g003b
Table 1. Summary of the different plots and agronomic conditions subject of study.
VarietyLocationCrop ManagementHarvestPruningObservations
PicualL1EcologicalNovemberNovemberCopper applied at the end of winter
Cornicabra
ManzanillaL2ConventionalNovember-Copper and dimethoate were used in May, while in September it was fertilized from rabbit droppings and straw
L1: South of Castilla-La Mancha; L2: Southeast of Castilla-La Mancha.
Table 2. Average content (mg/g) of oleuropein, hydroxytyrosol, verbascoside and flavonoids in olive leaves cv. Picual, Cornicabra and Manzanilla during an agronomic cycle (November 2019 to October 2020).
FactorAgronomic Phases
in Olive Tree
CultivarOleuropeinHydroxytyrosolVerbascosideFlavonoids
αSeasons
Winter
(21 December–21 March)
Winter rest periodPicual99.18 ± 2.58 a1.22 ± 0.25 a4.54 ± 0.15 a5.97 ± 0.07 a
Cornicabra58.73 ± 1.78 b1.42 ± 0.14 a1.64 ± 0.12 a4.58 ± 0.07 ab
Manzanilla78.68 ± 2.29 c1.36 ± 0.13 a8.24 ± 0.91 b3.20 ± 0.06 b
p-value*n.s.*n.s.
F-value11.460.533.420.44
Spring
(20 March–21 June)
Inflorescence growth, Flowering and fruit settingPicual 89.33 ± 5.07 an.d.4.60 ± 0.21 a4.32 ± 0.11 a
Cornicabra 37.66 ± 1.87 b1.43 ± 0.20 a2.01 ± 0.04 a2.29 ± 0.05 b
Manzanilla 85.57 ± 2.19 a2.01 ± 0.08 b6.43 ± 0.71 a4.23 ± 0.03 a
p-value******n.s.
F-value5.9650.294.331.19
Summer
(21 June–21 September)
Hardening of the olive stonePicual87.83 ± 4.76 a1.32 ± 0.04 a2.17 ± 0.02 an.d.
Cornicabra43.79 ± 5.33 b1.50 ± 0.17 a1.89 ± 0.04 a2.22 ± 0.09 a
Manzanilla75.08 ± 5.98 a1.56 ± 0.16 a2.85 ± 0.17 b4.50 ± 0.13 b
p-value***n.s.****
F-value6.044.010.044139.06
Autumn
(21 September–21 December)
Fruit growth, change color and ripeningPicual55.75 ± 2.06 a1.40 ± 0.06 a2.09 ± 0.145.95 ± 0.01 a
Cornicabra36.50 ± 3.03 a1.50 ± 0.20 an.d.3.81 ± 0.12 a
Manzanilla57.75 ± 3.14 a1.49 ± 0.20 an.d.5.72 ± 0.06 a
p-valuen.s.n.s.n.s.n.s.
F-value0.543.241.000.64
βAgronomic cycle average (November 2019October 2020)
Variety Picual83.84 ± 26.05 a1.3 ± 0.15 a3.95 ± 1.43 a5.6 ± 1.22 a
Cornicabra45.92 ± 14.96 b1.47 ± 0.23 ab2.17 ± 0.25 a3.42 ± 2.09 ab
Manzanilla73.87 ± 20.21 a1.62 ± 0.37 b 6.44 ± 3.67 b4.41 ± 1.51 b
p-value************
F-value32.384.5214.243.90
Location L164.88 ± 28.431.38 ± 0.233.06 ± 1.434.51 ± 1.94
L273.87 ± 20.561.62 ± 0.376.44 ± 3.674.41 ± 1.95
p-valuen.s.*******n.s.
F-value2.706.8521.371.18
α For each compound, different small letters indicate significant differences among cultivars according to one-way ANOVA and Tukey’s test.; β For each compound, different small letters indicate significant differences among cultivars according to two-way ANOVA and Tukey´s test. Significant correlation values are indicated according to: * p value < 0.1; ** p value < 0.05; *** p value < 0.01; **** p value < 0.001; n.s.: not significant.
Table 3. Correlation between studied phenolic compounds of olive leaves.
PlotsOleuropeinVerbascosideHydroxytyrosol
VerbascosideP0.5424 *
C0.3282
M0.4210
P, C, M0.4769 ***
HydroxytyrosolP−0.4693−0.0178
C−0.31940.2581
M0.21350.5170
P, C, M0.3488 **0.1766
FlavonoidsP−0.24380.40200.1907
C−0.27650.21650.1596
M−0.3694−0.2226−0.0261
P, C, M−0.15160.10180.1024
P: Ecological Picual; C: Ecological Cornicabra; M: Conventional Manzanilla. Significant correlation values are typed in bold according to: * p value < 0.1; ** p value < 0.05; *** p value < 0.01.
Table 4. Correlation between the different weather parameters and compounds of olive leaves.
VarietyOleuropeinVerbascosideHydroxytyrosolFlavonoids
TMP−0.05160.6242 **−0.16390.7683 ***
C−0.2819−0.27720.0986−0.3213
M0.0159−0.2960−0.14580.3650
P, C, M−0.0560.3137 *−0.02460.3059 *
tmP−0.17120.7744 ***−0.24120.7180 ***
C−0.3563−0.41800.1069−0.4358
M−0.13640.6059 **−0.14620.2609
P, C, M−0.16710.5600 ****−0.12220.3359 **
RHP−0.20310.37000.16250.8116 ***
C0.09530.0348−0.10730.2407
M−0.20360.02240.0685−0.4630
P, C, M−0.0960.09180.03230.3117 *
SHP0.0983−0.2476−0.20140.6996 **
C−0.24620.07620.3398−0.3046
M0.74110.01850.01170.4540
P, C, M0.015−0.05530.0259−0.2714
RFP0.03320.4446−0.32020.2665
C−0.09600.19590.2433−0.0977
M0.6584 **−0.3792−0.11210.3669
P, C, M−0.1370.0066−0.1122−0.1917
ΔTP0.1855−0.1890−0.02140.6739 **
C−0.07320.05490.0590−0.0274
M0.27180.41900.05870.3301
P, C, M0.16020.24450.1560−0.1291
TM: absolute maximum temperature; tm: absolute minimum temperature; RH: relative humidity; SH: sunshine hour; RF: rainfall; ΔT: differential temperature; P: Ecological Picual; C: Ecological Cornicabra; M: Conventional Manzanilla. Significant correlation values are typed in bold according to: * p value < 0.1; ** p value < 0.05; *** p value < 0.01; **** p value < 0.001.
Table 5. Content of macro (g/kg) and micronutrients (mg/kg) in olive leaves cv. Picual, Cornicabra and Manzanilla in harvest (November) and usual pruning (March).
VarietyMacronutrients (g/kg)Micronutrients (mg/kg)
PKMgCaSFeMnZnBCu
NovemberPicual1.14 ± 0.00 a6.57 ± 0.00 a1.69 ± 0.00 a26.41 ± 0.01 a1.57 ± 0.00 a95.77 ± 0.96 a64.10 ± 0.43 a16.38 ± 1.80 a11.98 ± 0.18 a32.36 ± 2.73 a
Cornicabra1.08 ± 0.00 a6.57 ± 0.01 a1.75 ± 0.00 a27.00 ± 0.10 a1.57 ± 0.00 a102.89 ± 3.25 a59.65 ± 0.14 ab18.85 ± 0.25 a11.59 ± 0.10 a73.42 ± 3.74 b
Manzanilla1.52 ± 0.01 b9.84 ± 0.04 b1.05 ± 0.00 b17.30 ± 0.08 b1.77 ± 0.01 a76.38 ± 1.70 b54.09 ± 2.89 b16.74 ± 0.14 a11.34 ± 0.38 a110.63 ± 4.71 c
p-value********************n.s.n.s.****
F-Value36.50165.0491.50114.799.0078.4217.613.193.25211.09
MarchPicual0.90 ± 0.00 a6.71 ± 0.08 a1.35 ± 0.00 a23.20 ± 0.07 a1.43 ± 0.01 a101.94 ± 2.82 ab56.65 ± 0.45 a13.97 ± 0.33 a11.60 ± 0.41 a72.59 ± 1.50 a
Cornicabra0.90 ± 0.01 a6.97 ± 0.11 a 1.49 ± 0.02 a24.04 ± 0.34 a1.47 ± 0.02 a116.55 ± 8.22 a53.56 ± 8.14 a13.98 ± 1.53 a11.33 ± 1.68 a72.17 ± 2.44 a
Manzanilla0.90 ± 0.01 a7.62 ± 0.08 a0.69 ± 0.01 b17.30 ± 0.16 a1.32 ± 0.01 a80.45 ± 11.15 c36.27 ± 3.81 a14.88 ± 0.80 a9.72 ± 0.69 a24.29 ± 0.16 b
p-valuen.s.n.s.***n.s.***n.s.n.s.****
F-value0.000.6720.735.270.649.918.940.531.80325.31
For each compound, different small letters indicate significant differences among cultivars according to one-way ANOVA and Tukey’s test. Significant correlation values are defined according to: * p value < 0.1; ** p value < 0.05; *** p value < 0.01; **** p value < 0.001; n.s.: not significant.
Publisher’s Note: MDPI stays neutral with regard to jurisdictional claims in published maps and institutional affiliations.

