
Conceptual Design of a Comprehensive Farm Nitrogen Management System


1
Department of Bioengineering Sciences, Weihenstephan-Triesdorf University of Applied Sciences, Am Hofgarten 10, 85354 Freising, Germany
2
Organic Agriculture and Agronomy, TUM School of Life Sciences, Technical University of Munich, Liesel-Beckmann-Straße 2, 85354 Freising, Germany
*
Author to whom correspondence should be addressed.
Agronomy 2021, 11(12), 2501; https://0-doi-org.brum.beds.ac.uk/10.3390/agronomy11122501
Submission received: 12 November 2021
/
Revised: 3 December 2021
/
Accepted: 5 December 2021
/
Published: 9 December 2021
(This article belongs to the Topic Soil Fertility and Plant Nutrition for Sustainable Agriculture)
Abstract
:Data that are required for nutrient management are becoming increasingly available in digital format, leading to a high innovation potential for digital nitrogen (N) management applications. However, it is currently difficult for farmers to analyze, assess, and optimize N flows in their farms using the existing software. To improve digital N management, this study identified, evaluated, and systematized the requirements of stakeholders. Furthermore, digital farm N management tools with varying objectives in terms of system boundaries, data requirements, used methods and algorithms, performance, and practicality were appraised and categorized. According to the identified needs, the concept of a farm N management system (FNMS) software is presented which includes the following modules: (1) management of site and farm data, (2) determination of fertilizer requirements, (3) N balancing and cycles, (4) N turnover and losses, and (5) decision support. The aim of FNMS is to support farmers in their farming practices for increasing N efficiency and reducing environmentally harmful N surpluses. In this study, the conceptual requirements from the agricultural and computer science perspectives were determined as a basis for developing a consistent, scientifically sound, and user-friendly FNMS, especially applicable in European countries. This FNMS enables farmers and their advisors to make knowledge-based decisions based on comprehensive and integrated data.
1. Introduction
1.1. Scientific Challenges
Rapidly developing sensing technology and data processing techniques have opened up new opportunities for realizing the knowledge-based control, regulation, and optimization of agricultural production processes [1,2,3]. Digital agriculture includes the innovation and application of digital nitrogen (N) management [4,5,6,7,8,9,10]. Recently, various digital tools have been developed for N management in agricultural production. However, these tools are predominantly tailored to certain needs, for example, sensor- and satellite-based systems for site-specific fertilization in crop production [11,12]. Some of the available tools can effectively help balance nutrient flows throughout the soil–plant–animal–environmental system [13,14,15,16]. In addition, soil process models can quantify N turnover in soil and N emissions into the environment [17,18].
Like other Western European countries, there is an urgent need for action towards N management optimization in Germany due to high N surpluses and low N efficiencies [19,20,21,22]. N surplus is frequently caused by insufficient spatial distribution and the inefficient use of organic fertilizers, particularly liquid manure and digestate [23,24]. Another reason is the inappropriate use of mineral fertilizers when the plant-specific N fertilization requirements are not taken into consideration [25]. In German agriculture, the N balance is 80 kg ha−1 referring to total agricultural land [26] to 70 kg ha−1 when solely considering the crop production [27]. The N use efficiency (NUE) in agriculture (including livestock production) is only 50%, whereas the NUE for crop production is 65%, which can still be further optimized [27]. Challenges for N management include the excessive use of fertilizers in conventional agriculture (high-input systems) and extreme spatial differences in the N balance due to specialization, such as the regional concentration of livestock farming, biogas plants, and intensive vegetable production [28]. Moreover, in organic farming (low-input systems), the N supply is often a critical factor limiting plant yield [29,30,31].
For digital N management, it is challenging to connect different software applications for exchanging data and productive interoperation. Currently, it is difficult for farmers to link data from different nutrient management tools using a reasonable amount of effort. Therefore, important information is unconsidered and thus, often remains unused in decision-making processes. The total available data volume is also increasing rapidly as more process data are being obtained through modern agricultural technology [32]. This reinforces the need for external technological support to farmers to solve problems associated with data integration which result from the lack of system interoperability and inconsistent data quality and availability.
Successful N management can optimize crop yields and increase profitability while minimizing N losses to the environment and, thereby, the negative effects on biodiversity and human health [33]. Using digital systems has enormous potential to reduce N emissions and increase N efficiency to a desirable level [24,34,35]. In this study, we analyzed the possibilities and limits of connecting the functionality of existing digital systems and derived requirements in developing a farm N management system (FNMS) that is comprehensive as considered from the perspective of potential users, agricultural scientists, and software engineers.
1.2. Need for Research and Development
In agriculture, the NUE depends on many interrelated factors, such as the genetic potential of crops and animals, environmental conditions (soil, climate, weather, and yield potential), N fertilization (type and amount of fertilizer, application time, and technology), livestock production (stable system, pasture grazing, performance, feeding intensity, and slurry management), farm structure (animal stocking density, and crop rotation), and production method (conventional or organic, irrigation) [36,37,38,39]. The associated data are becoming increasingly digitally available. The challenges faced by the concept of digital FNMS is to accurately depict and analyze the abovementioned complex relationships and develop applicable models for nutrient management. The data acquisition and linking required for this can be achieved with appropriate software that considers and documents the N flows at the farm level. The developed software should include powerful and scientifically sound algorithms. Aiming to simplify the complexity of information flows, the developed software should include practicable agri-environmental indicators, such as NUE or N balance, and must be configurable to individual user needs. Such management systems should be easily applicable by operational farm management.
1.3. Purpose and Objective
For optimizing N management on a farm level, a systemic and integrative approach is required. Our goal is an FNMS that enables farmers and advisors to make decisions based on comprehensive and integrated data. Such a system is intended to identify and address the causes of N surplus. Therefore, the purposes and objectives of this study were:
- -
- To describe, analyze, systemize, and evaluate the existing digital tools for N management (in crop and livestock production and on the farm level as a whole) and its various components related to system boundaries, relevant N flows and N pools, methods, and algorithms;
- -
- To assess the practicality of these systems regarding data requirements, availability, connectivity, performance, and informative value as well as the feasibility of recommendations in management processes; and
- -
- To evaluate the potential for integrating existing digital tools and their data into an FNMS (such as existing interfaces, linking components, and ensuring consistent calculations using the same primary data).
Conceptual requirements for developing an FNMS were derived based on the investigation results that were inspired by German requirements with attention to the adaptability to countries with similar agroecosystems, mainly in Central and Western Europe.
In this paper, we propose a software architecture that considers the necessary components, performance parameters, and feasibility of interoperability.
2. Materials and Methods
The digital tools and their connection to the digital FNMS were analyzed in the following subsequent steps:
- (a)
- Systematization of digital models and components relevant for an FNMS due to the following aspects:
- They are required by law;
- They are widely used in operational farm management; and
- They are new conceptual approaches and innovative digital methods, such as sensor- and satellite-based N fertilization.
- (b)
- Analysis of data requirements for an FNMS and the assessment of data availability based on the following steps:
- Assessments and evaluations from the literature (self-assessment by system developers, practical tests, user reviews, scientific analyses, and comparative evaluations of digital tools);
- Experience in developing FNMS components;
- Expert workshops with farmers, consultants, and scientists; and
- (c)
- Analysis and evaluation of digital tools and their components, focusing on investigations of N fertilizer requirements and balancing.
- (d)
- Definition of an integrated FNMS with its required components and their interrelationships, as well as the goals and areas of application for a comprehensive FNMS.
The requirements for FNMS components were established in accordance with the research results and conceptual work. These results provide insight into the problems and challenges that need to be solved from both agricultural and computer science perspectives to develop a consistent, user-friendly system based on scientific principles.
In this study, we primarily considered the conditions and systems used in Germany. However, conceptual approaches presented in this study can be applied to other regions, particularly to Central and Western European countries with similar site and management conditions.
3. Results and Discussion
3.1. Overview, Categorization, and Evaluation of Existing Digital Tools for N Management
N flows in agricultural farms may be managed using different systems, methods, and models regarding the N requirement calculation, N balancing and N cycle modeling, and soil process modeling and N loss calculation.
The detailed functionalities depend on the farm system and management ability. The N fluxes and interactions between the diverse production systems on a farm require the consideration of crop, livestock, and biogas production, beyond frequently used indicator goals [14,20,43,44,45,46,47]. A digital tool needs to consider all of these factors in the design of an integrated management system. Therefore, our system approach focuses on the optimization of the entire farm.
3.1.1. N Requirement Calculation
Digital tools and systems for determining N fertilizer requirements of crops can be categorized into two categories: (1) uniform fertilizer application on the field level and (2) site-specific fertilizer application (Table 1).
- Methods for uniform fertilizer application on field level
Basic software systems for determining N fertilizer requirements [48] help farmers comply with legal requirements. Globally, a widespread and simple principle for determining N requirement is fertilization depending on crop N uptake, i.e., target yield of the crop multiplied by the N content of the harvested product. Site conditions are only indirectly considered via the target yield. More differentiated systems consider additional parameters, such as previous crops, organic fertilization of the previous crops, soil humus content, or soil mineral N (SMN) content at the beginning of a vegetation period [50]. Moreover, some systems aiming at specified determination of fertilizer requirements include the current development of a crop stand (biomass and N content) [49,61]. Therefore, farmers must conduct plant analyses (such as nitrate test [62] and N-Tester [59]); such methods are mainly used for uniform fertilizer application at the field level. Most farmers know the approximate yield potential of their fields and can determine appropriate fertilizer amounts as well as modify them, if necessary, by simply manually controlling the fertilizer application process. However, this process involves subjective assessments and requires a substantial amount of extra work (as well as knowledge, time, and effort).
- Methods for site-specific fertilization
Mapping and real-time sensor systems have specific advantages, particularly in heterogeneous sites and high-input systems [63]. These systems contribute to (a) increase the N efficiency, (b) precise fertilizer application according to crop N requirements, and thus (c) achieve lower N balance. N overfertilization and losses can be avoided in low-yield zones, whereas the yield and quality potential can be realized without depleting the N content in the soil in high-yield zones. Site-specific fertilization systems can be divided into mapping, sensor, and combined systems (map-overlay) [64].
In the mapping approach, N application maps are generated according to digital soil data (for example, soil maps, georeferenced soil texture, electrical conductivity, and nutrient content [65]) and/or historical yield data (for example, annual or multiyear yield records) [66]. If available, via satellite or drone images, derived data about the nutrient supply of the crop stand can be used to create supplemental maps [67,68,69]. In addition, service providers offer fertilization algorithms, yield potential, and N application maps specifying N fertilization recommendations in the vegetation period based on current or predicted weather and other factors [70].
Further sensor-supported real-time systems are already available in the market [71]. Most tractor-carried sensor systems (for example, Yara N-Sensor [52] and Crop Sensor ISARIA [53]) rely on vegetation indices for recording the N uptake of the crop stand in real time, thus estimating fertilizer requirements for certain areas [72,73]. In some systems, measuring the crop biomass or the N content of biomass at a representative area in the field (spot calibration) is crucial for defining the N application rate before transferring to the entire field [54,59]. Alternative systems, such as Crop Sensor ISARIA [56,74], use algorithms to determine the site-specific N fertilization requirement in defined developmental stages according to the crops’ N uptake.
The map-overlay system combines the mapping and sensor approach. By considering high-quality data of the spatial variability in yield potential and current plant development, a high degree of precision can be achieved [75].
3.1.2. N Balancing and N Cycle
The N balances are calculated at different system levels of crop production system (with various degrees of spatial resolution), the livestock system and the biogas production system, and the entire farming system [76,77]. N surplus, which describes the N loss potential, is the difference between the N input and N output of a certain system [78,79]. Notably, there is no standard method for the N balancing. Therefore, N balance results can only be interpreted correctly if the balancing model is considered [80,81]. According to Goodlass et al. [13], Halberg et al. [14], and Küstermann et al. [76], the N balance models differ in terms of:
- -
- System level and system boundary, namely the entire farm (farm-gate balance), crop production (field balance), and livestock production (barn balance);
- -
- N flows considered, such as N inputs, N outputs, and N flows within the system;
- -
- N pools considered, such as soil organic N (SON) and soil mineral N (SMN);
- -
- N balance parameters used, for example, the N contents of products and NH3 emission factors;
- -
- Algorithms used, for example, for calculating the N2-fixation;
- -
- Data basis, namely the measurement data, model data, and statistical data.
In crop production, N balances quantify the N inputs and N outputs for a relevant area (subfield, field, crop rotation, farm). The N surplus indicates the N loss potential in the soil–plant–environment system. N loss pathways, such as NH3 volatilization and NO3 leaching to groundwater, and N forms, including NH3, N2O, N2, and NO3−, are not specified. In the context of N fertilization, the area-related N balance is the most useful balance method (Table 2). Soil N turnover is typically not considered in N balances [82]; however, some models estimate N immobilization and mineralization for accurate N loss calculation [76,83].
In livestock production (barn balance), N inputs (feed and purchased animals) and N outputs (animal products) are compared to determine the N loss potential. In more complex N balances, the amount of N in manure is quantified in addition to the NH3 losses of the animal-housing system and the manure storage system [76,86].
The farm-gate balance, used for overall operational analysis, is relatively simple to calculate using the N inputs and N outputs across the farm. It provides reliable and verifiable results related to the overall N loss potential of a farm; therefore, it serves as a control method for legal requirements. However, a notable disadvantage is that it is impossible to verify the causes of N balance because internal N flows are not mapped [43]. In practice, N balances are widely employed but typically as simple balancing approaches, for instance, the N balance of crop production (according to the fertilizer ordinance [48]) and farm-gate (according to the nutrient flow balance ordinance [87]). Owing to the black box approach of the farm-gate balance and isolated consideration of partial balances, the interconnected N flows, dependencies, and interrelationships, including between crop and livestock production, are often concealed.
To reveal the causes of N losses and to determine the potential for improved efficiency in the N cycle, internal N flows must be modeled by linking different balance results. Essentially, the N outputs from one subsystem are the N inputs for another subsystem and, thus, the N flows are continuously modeled. There are only a few N balance models, such as the REPRO model [85,88], that integrate these partial N balances into a coherent overall system. Figure 1 shows the interdependencies of the N balances on the farm level realized through the interconnected subsystem’s N balances.
Figure 1.
On-farm N cycle of a mixed farming system with crop and livestock production showing N inputs, N flows, and the N outputs of the farm-gate, the soil surface, and the barn balance as modeled using REPRO [76].
Figure 1.
On-farm N cycle of a mixed farming system with crop and livestock production showing N inputs, N flows, and the N outputs of the farm-gate, the soil surface, and the barn balance as modeled using REPRO [76].

3.1.3. Soil C/N Turnover, N Uptake, and N Losses
The N turnover in the soil (mineralization and immobilization) can be determined using soil process modeling or direct measurement. It is a prerequisite for quantifying N losses (NH3, N2O, and NO3−). However, a large amount of input data are required for soil process modeling. Relevant models require detailed measured soil parameter values (often for several soil layers) as well as detailed management and weather data, which must be collected daily. Using a model without adaptation to the specific soil–climate area is usually impossible or produces inaccurate results. In addition, these models are often coupled with plant growth models, but they can only analyse limited crop types. Therefore, the application of soil process modeling is still limited. Nonetheless, the simulation of soil-N dynamics may provide practical information, including the SMN content at the beginning of a vegetation period [89,90].
Model approaches to ascertain the N turnover in the soil and potential N losses based on existing data are available [91,92,93,94]. As N and C turnovers are linked, the N turnover tool of the REPRO model [76,84,88] divides soil N into three interacting N pools: SMN, SON, and humus N pools [85]. Depending on the composition of the applied fertilizers (NH4+ and NO3− contents, organically bound N, and C:N ratio), soil properties (soil texture), and weather-dependent parameters, the N mineralization is calculated using the effective mineralization time [95]. Further information regarding the soil-N turnover tool can be found in Abraham [84] and Küstermann et al. [76]. A useful application of the N turnover tool is the simulation of potential NO3− leaching in drinking water protection areas [61,85].
3.2. Concept of a Farm N Management System
Several digital tools available for N management are used for different purposes and produce different data. Linking these data is an essential basis component for N management decisions. Therefore, a major challenge for developing comprehensive software is to design it to provide functionality that can be scaled according to the different expert levels of users (from basic functionality to power users and scientists). Furthermore, the designed software should integrate different data sources into one system and offer additional interfaces for interoperability with other systems.
3.2.1. Stakeholder Requirements and Application Areas
The main target user groups of an FNMS are farmers and crop advisory services. The requirements of business partners, legal authorities, certifiers, insurance, and laboratories should also be considered, as they need to interact with the system if mandated by the farmer. In addition, the system could be used by scientists and farmer associations. All user groups have slightly different requirements for an FNMS. Notwithstanding, the requirements of farmers allow covering the essential aspects of the system, thus specifying the basics for developing an FNMS (Table 3).
A fundamental challenge facing any FNMS is to determine the system’s capability and then achieve acceptance for the application [97]. It is crucial that users are not overwhelmed by the technology, for example, due to excessive data requirements. Complex relationships derived from the data must be presented simply, and calculations must be transparent and comprehensible. Failure to consider these factors can result in users losing confidence in the generated results [98]. A clear program structure, self-explanatory user interface, graphic processing, and visualization of the results (for example, Figure 1) are factors essential for ensuring the potential success of the application and durability of an FNMS [99,100]. In addition, a farm-centered FNMS could be part of an integrated N management strategy that covers the entire value chain, works with an integrated assessment modeling tool, includes cost–benefit analyses, and works together with all stakeholders [33].
The farmers group, however, is heterogeneous. There are minimalistic users who only want to meet the legal requirements, and power users who require a high-performance system. Power users desire a holistic system approach integrating all production systems (crop, livestock, and biogas) with high resolution, such as site-specific calculations of N requirements and N balances. Therefore, it is crucial that users can easily access the basic functionality of an FNMS and then gradually expand their expertise level for solving increasingly complex tasks. Concerning the development of software, a modular architecture using a shared database is required to provide the possibility of individual customizations. Another reason for the need for a high degree of individuality is the potentially differing legislations within a country; therefore, various versions of data and algorithms are required.
In addition to user-friendliness and configurability, the interoperability with other internal (for example, machine process, operation record, and resource input data) and external (for example, weather, soil, and remote sensing data) farm data through interfaces is crucial for connecting data of divergent formats, structures, and meaning [101]. Moreover, the stakeholders require different analysis levels at various spatial (such as farm, field, and subfield) and temporal (such as annual and crop rotation) scales, which is beneficial for strategic and operational planning. For example, the site-specific applied fertilizer should be easily aggregated to the mean N input of a field for N balancing on the farm level. However, the evaluation of single crops or crop rotations at a specific spatial scale (subfield or field) and temporal period should be possible. Following this, different data are required for digital N management depending on the application area and functionalities. For simple applications, such as the basic determination of fertilizer requirements, the need for data is low. However, for more demanding modules, such as soil process modeling, measurement data with high spatial and temporal resolutions are required.
Because an FNMS is complex, the data links between the modules and calculations need to have a high level of transparency and traceability to gain user trust in the system. Farmers demand clear management decision support beyond the balances and calculation values. The support needs to be personalized and may contain a scenario simulation with different probabilities, for example, covering the nutrition need of crops, input availability, and allocation management. A modern FNMS should be designed as a web application according to the current state of application programming; it must contain at least one mobile application to easily record operations in the field. Additionally, appealing visualization and a user-friendly interface are required.
3.2.2. Basic Functionalities and Data Requirements
All applications concerning N management require site and farm data. Depending on the functionality, data are allocated according to site conditions (climate, weather, and soil) and production system (crop, livestock, and biogas) (Table 4). Almost all data required for an FNMS are available for farms through continuous recording and documentation, or can be obtained through free or paid services. As such, a noticeable problem is that the data origins and system levels that indicate the reference scale (for example, farm or field level) differ. In addition, different data mining methods can be employed, which results in different levels of data accuracy (such as automatically measured vs. digitized manual records). Notably, relevant data are often recorded using different methods, including unincorporated and/or incompatible data portals and agricultural software (Table 4).
An example of diverse data origins is the acquisition of site conditions (1) in Table 4. In Germany, high-quality and consistent climate and weather data (1.1) in Table 4 are available nationwide and have been updated daily for several years [102]. Weather data for individual areas can be mapped through heuristic searches of nearby weather stations or interpolation [103,104]. For instance, digital on-farm weather stations could further improve spatial resolution and data reliability.
Depending on the desired functions, different soil data (1.2) in Table 4 of different spatial resolutions are required. Soil-related information (for example, soil type) available in analog form is increasingly being transferred to primarily open-sourced digital formats, such as digital soil maps [105]. Soil nutrient contents (for example, SMN content) are still commonly determined via soil samples and laboratory analysis. Mobile soil sensors and systems that continuously make measurements with a high spatial and temporal information density are increasingly being used to determine soil nutrient contents, especially those with mobile sensors in different spectra (such as infrared (IR), visible-near-infrared (vis-NIR), mid-infrared (MIR), and X-ray fluorescence spectrometers (XRF)) [106,107,108,109,110].
The database for describing crop production (2) is information about the field and cropping structure (2.1) in Table 4, including field size, field contour, and cultivated crop, which is already recorded across the EU according to the Integrated Administration and Control System (IACS) [111]. Additional relevant geographic information (for example, water protection areas and nature reserves with restricted land use) is provided by agricultural and environmental authorities. Nevertheless, only limited data exchange between these systems and field records, as well as other frequently used stand-alone software solutions from various providers [112,113], is possible due to individual data structures and classifications lacking in compatibility [41,114,115,116].
Further crop production data are generated through the crop production system (2.2) in Table 4. The associated data pool can contain process data generated by a machine via an ISOBUS interface, biomass maps generated using satellite images representing crop N requirements, applied fertilizer maps, quality parameters generated through product analysis, and electronic field record data which provide information about the crop variety. The data collection and documentation in crop production may also be performed using a farm management information system (FMIS), which supports the field-related recording of production data (field operation, date, and resource inputs) [117]. These systems typically have interface functions for other machine and process data, such as the seed rate map, the application map for fertilizer spreaders, or yield mapping of the combine [118]. NIR spectroscopy sensors providing further process data when applying organic fertilizer or harvesting forage (for example, dry matter and protein content) are still being developed [119,120].
In livestock production (3) in Table 4, N efficiency and emissions depend on the animal species, animal performance, feed regime, and husbandry system, among other factors [36,121]. Data collection and documentation are performed in various digital systems, such as livestock management systems, systems for determining feeding requirements, and systems for calculating the quantity and storage capacity for manure. The increasing digitalization of livestock farming (for example, animal sensors and milking robots) necessitates high-resolution data management at various object levels: the entire livestock, a group of animals, or individual animals. In addition, the storage system of substrate and manure influence N emissions.
3.2.3. Definition of a Farm N Management System
An FNMS integrates all of the functionalities relevant for farmers to make decisions related to optimizing N flows at the farm and field levels. In essence, with an FNMS, N flows in agricultural enterprises can be administered, analyzed, evaluated, and controlled (optimized) by integrating different models and software into one system. Crucial software components (modules) of an FNMS include (1) digital systems for managing site and farm data, (2) digital tools for determining fertilizer requirements, (3) models for N balancing, (4) models for analyzing N turnover and potential N losses, and (5) decision support systems (Figure 2). Each module has its data model, data structures, and algorithms, which use a shared database. An FNMS should be expandable and adaptable to new site and management conditions [122].
Figure 2.
Modular concept of a farm nitrogen management system (FNMS).

An FNMS integrates everything related to crop and livestock production systems, as well as the entire farm-level N flows and pools and their influencing factors (soil, climate, weather, technology used, yield performance, etc.). By comprehensively linking the components of the diverse production systems, it would be possible to understand interactions at the farm level and gain new insights that could be useful in N management, for example, in N cycle optimization to increase N efficiency and reduce environmentally significant N emissions.
- Decision support in FNMS
As this study shows, numerous software and systems exist for supporting farmers in N management. However, most of these systems are geared toward relatively simple decision-making, such as determining the N fertilizer requirement. In the future, it will be necessary to assist and motivate decision-makers with complex issues, for example, to support farm N cycle optimization. Therefore, an integrated decision support system is required.
- Decision support system requirements
A decision support system should include:
- (a)
- Comprehensive access to data from individual programs or modules to combine and evaluate information in a context-related manner.
- (b)
- Evaluation methods and benchmarks (target values) to analyze results and identify optimization requirements.
- (c)
- Decision-making rules and algorithms to determine farm-specific recommendations for management and evaluate the field operations carried out by the farmers. The required algorithms and decision pathways can be modeled according to techniques from the field of decision support systems, for example best practices, decision trees, rules, or fuzzy logic. According to Fernandez-Mena et al. [123], a promising approach to optimize nutrient cycles is to combine nutrient flow models with agent-based modeling and analyze the environmental impacts. Notably, the quality of the recommendations depends heavily on the technical content (expert knowledge) or the quality of the knowledge base, the applied algorithms or their implied modeling (rule base), and the comprehensibility of the dialog component for the user.
- (d)
- A dialog component that allows users to interact with the FNMS and allows decision-relevant parameters to be given values.
In general, decision support systems in agriculture should have the following characteristics: good performance, easy handling, and clear benefits from application [124].
3.3. Software Design for a Farm N Management System
Owing to agriculture digitalization, data from agricultural equipment and technology operated in the field or the stable are being continuously recorded [114,125,126]. The ever-increasing automation of agriculture is accelerating this trend [127,128,129]. Efforts to establish data integration platforms (for instance, DEMETER [130] or IAIS [131] at the EU level) are attempting to harmonize and improve data exchange between systems from different agricultural technology manufacturers and may ease data connectivity in the future. For the successful integration and implementation of an FNMS, a robust data management system is essential to process data from different storage locations, formats, and structures (thematic, spatial, and temporal) in a way that allows them to be used for a specific purpose in operational N management.
3.3.1. Representation of Farm Structure and System Implementation
Optimizing the nutrient supply of an agricultural production system presupposes the digital representation of an entire farm. Therefore, the production processes must be systemically mapped, for which information about the structural design of farm systems is required along with consideration of the required system levels (spatial and temporal scales). The processes in crop production are recorded through the digital description of the individual work processes, dates, use of machines, and inputs (for example, fertilizer type, quality, and quantity), which correspond to the structure of record-keeping software. By contrast, the structures, production methods, and the use of operating resources of all production systems are described. Figure 3 provides an overview of a cross-system consideration of crop, livestock, and (if existing) biogas production. In detail, crop production is represented through a domain-specific entity relationship model. The annual, perennial, or permanent crop production cycles can be described by a time interval, for example, individual crop years or multiyear crop periods. For livestock production, equivalent fattening periods or average stocks can be assigned depending on the documentation objective and balancing approaches. Each crop year is related to the fields managed by farms. Field information contains the corresponding meta-information, such as name, indication, or field status (arable/pasture land). For spatial localization, vector or raster data are assigned to each field, with the raster size (for example, 10 m × 10 m) representing the minimum normalization unit. Subsequently, geospatial data (such as soil sensor or yield data) are interpolated to raster size, even in the case of high-resolution data granularity (using geostatistical methods, e.g., Kriging method). In the future, the idea of spot farming could be a driving force in this field [132]. For small-scale management, plots are subdivided into subfields or “management units” due to the heterogeneous site conditions (such as soil type or yield potential). These units are treated as one field and assigned to one parent field. Consequently, field operations and user inputs can be recorded for each field with a grid reference which is usually manually performed at the subfield or field level with a lower degree of resolution. However, digital data acquisition with execution date and corresponding information (for example, for seed variety, quality, and density) enable subsequent spatial and temporal evaluations. It is also possible to conduct selection and analysis according to the recorded attributes (for example, field operation, or cultivated crop type). This mapping includes the catch crops, second crops, and main crops.
Figure 3.
Entity relationship model of a farm with cardinalities throughout the crop production system. * Optional a cropping year, calendar year, crop rotation or a growing/fattening period depending on the management goal (e.g., documentation, planning, analysis). ** A Field or Subfield is defined as a coherent area that has one or more common properties (e.g., soil type, yield level, field operation, cultivar) in the respective time interval. The defining property maybe a field operation (e.g., different sowing dates, site-specific fertilization) or may also be an aggregation of vector/raster data for the strategic farm management (e.g., analysis of selected crops, humus balancing). *** Smallest unit with available attributive data. A point as the smallest possible unit is defined by a single x–y-coordinate. Lines and areas are composed of points.

A schematic use case is depicted in Figure 4, which shows which the spatially variable data that are required to be mapped by the data model. To develop fertilizer application maps, yield potential and N uptake maps are necessary; such components are developed using different methods (for example, volume flow measurement on combines, digital soil maps, sensor measurements, and satellite data). If the N application and N uptake of the harvested products are georeferenced, the GIS maps of the N surplus and nitrate leaching can be modeled accordingly. Notably, the quality of the input data largely determines the accuracy of the results. Initial studies on heterogeneous fields showed that site-specific N balance based on sensor measurements is strongly correlated with nitrate leaching [133]. It is reasonable to consider additional information from satellite data or georeferenced soil data. Figure 4 shows the integrative use of georeferenced data required for site-specific N fertilization, N balancing, and N turnover modeling, which means that the data structures of the software core system must be selected appropriately to map and manage the shown complexity of reality. In this way, such a system can offer the possibility of optimizing N management.
Figure 4.
Integrative use of georeferenced data required for site-specific N fertilization and N balancing.
Figure 4.
Integrative use of georeferenced data required for site-specific N fertilization and N balancing.

3.3.2. Software Design and Modularity
The requirements for software development are determined by the need for a systematic representation of a farm and the diverse functional requirements of the stakeholders (Table 4); different user groups place different demands on the software. Furthermore, the system must be adaptable to changing functionalities or state requirements. Therefore, a modular architecture is required for the software which is based on a common database to realize user-specific configurability and, thus, an individual module selection of varying complexity. For the software design, we employ the layer pattern which is a common software architecture pattern [134]. The programming code is split into layers where each layer has a certain responsibility and provides services for higher layers. Each logical component is based on the layer pattern which leads to a vertical structure of modules. Figure 5 shows the software modular structure. We used the classical three-tier model comprising of a presentation layer, business concept layer/application logic, and a data management layer (which comprises two sublayers: a persistence layer and database or data interface). In the vertical view, we distinguish the core system (something similar to a microkernel) and various specialized modules. Each module has its own set of algorithms and accesses the shared database. We use standardized interfaces to connect modules and the core system.
Figure 5.
Modular architecture of the FNMS. * Intern data (e.g., calulation values) and extern data (e.g., weather) is stored in the core system. ** Purpose-specific provision of data required for module functionality by the core system.
Figure 5.
Modular architecture of the FNMS. * Intern data (e.g., calulation values) and extern data (e.g., weather) is stored in the core system. ** Purpose-specific provision of data required for module functionality by the core system.

The core system comprises of the following components:
- -
- Master data component—contains data structures and functionality for managing and using master data, for example, climate data or generally applicable crop-specific data;
- -
- Site and farm data component—contains data structures and functionality for administering and using individual farm data;
- -
- Administration component—contains data structures and functionality for administering user data, user roles, and access rights.
These core components are organized according to the layer pattern. Layers are hierarchically organized which means requests move top down from layer to layer. For example, if a user selects to edit some specific farm data, the graphical user interface (GUI) (the presentation layer) creates an appropriate request that is sent to the respective parts of the service layer. The service function probably needs access to data and sends a request to the data model. The persistence layer enables data storage and serves as an interface for data access (input/output).
The core system is required for every application built from this system. Further modules may be added, such as N requirement calculation, which provides a high degree of configurability of possible applications. A module can only be fully executed if the required data are completely available. The user interacts with the system via an integrative GUI which includes textual and graphical representations of farm data and calculation results, including geographic maps. Implementation as a web system facilitates installation and support. Data interfaces enable both internal and external data exchange.
The core system contains data relevant for all of the modules and for understanding the domain system. As an example, an applied fertilizer input can be used for calculating not only the N cycle but also the N balance. The structure of two modules, N requirement calculation and N Cycle in Figure 5, is exemplary and is divided into several subcomponents:
- -
- Algorithms and calculations—completely independent of the overall system, they can be reused in further systems, and they define the necessary data requirements independent of the master data or core data model.
- -
- Model—the data model of a module for data transformation from data storage to algorithm-specific data structures. Both operational and site data, master data, and module-specific master data are processed and prepared for use in algorithms.
- -
- Data access—to access module-specific master data, for example, the database.
The N requirement calculation module comprises of submodules with different levels of difficulty (Figure 2): a basic variant for fulfilling legal obligations, the extended variant, and methods of site-specific fertilization.
Owing to its modular structure, the system can be expanded upon with new features. New components, for example, a decision support system on the farm level, can be integrated into the core system with little adaptation effort. The corresponding data interfaces are implemented via the core system or with direct module access (Figure 6). In the specific case of the N requirement calculation according to the mapping system, the required data, i.e., updated satellite data and area-related soil sample investigations, are imported to generate an application map for fertilization.
Figure 6.
Data input and output of the FNMS. * Depending on the dynamic of the data changes seldom or frequently used. ** Data from the Integrated Administration and Control Systems (IACS) of the member states of the European Union. Mostly containing field contour data, the main crop and information about statutory restrictions of the area.

4. Conclusions
Our conceptual design of an FNMS system follows a specific data network approach for the purpose of N management. The proposed system uses external ecosystem-related data (for example, soil information and weather data), internal operating data (for example, field measure documentation), and personal information (for example, the individualized farmer strategy). By exchanging data within the overall system, the data requirements of the subsystems and modules can be restricted thus reducing the need for multiple entries. The proposed domain model, modular architecture, and software design support the crucial technical requirements. By merging the available information, previously unrecognized relationships become visible, allowing management decisions to be easily determined by farmers based on factual information.
Our proposed FNMS can be useful in various application areas. Owing to its modular structure, getting started with the system is relatively easy, for example, using simple tools to determine fertilizer requirements. Additional components can gradually be integrated, albeit adding a few complexities to the user. It is just as likely that this system will be used by farmers and by highly specialized consultants who, for example, use model components, such as N turnover modeling and their influence on nitrate dynamics, to establish recommendations for the protection of drinking water. A decisive advantage with the FNMS here is the possibility for conclusive and consistent calculations through access to the consistent site and operational data from a common basis.
Our conceived FNMS aims to provide a systematic approach for N management. Perhaps more crucial than the final accuracy of the detailed data is the integration of the results into a comprehensive operational context, as system optimization goes beyond the achievements of indicator goals. With respect to the scientific aspect of the approach, the analysis, evaluation, and optimization of N flows in farming systems have been somewhat successful but so far require enormous effort. However, none of the existing systems has yet been universally implemented or accepted. Because agricultural process data are gradually becoming increasingly available in digital form, modern FNMS now has the chance to become a tool for optimizing the N flow of agricultural operations. Furthermore, our concept for an FNMS is designed in such a way that other nutrients such as phosphorus, potassium, magnesium, and also carbon, can be integrated in the future. This leads us to a software system for agriculture that provides complete nutrient management enabling farmers and their advisors to make knowledge-based decisions based on comprehensive and integrated data.
Author Contributions
Conceptualization, F.W. and K.-J.H.; methodology, F.W. and K.-J.H.; software, F.L., M.L., and F.W.; investigation, F.W. and K.-J.H.; writing—original draft preparation, F.W., K.-J.H., and F.L.; writing—review and editing, F.W., K.-J.H., and F.L.; visualization, F.W. and K.-J.H.; supervision, K.-J.H. and F.L.; project administration, K.-J.H. and F.L.; funding acquisition, K.-J.H. and F.L. All authors have read and agreed to the published version of the manuscript.
Funding
This work was supported by the Federal Ministry of Food and Agriculture (grant no. 2818OE052) and the Bavarian State Ministry of Food, Agriculture and Forestry (grant no. A/19/09). This Article is funded by the Open Access Publication Fund of Weihenstephan-Triesdorf University of Applied Sciences.
Conflicts of Interest
The authors declare no conflict of interest.
References
- Antle, J.M.; Basso, B.; Conant, R.T.; Godfray, H.C.J.; Jones, J.W.; Herrero, M.; Howitt, R.E.; Keating, B.A.; Munoz-Carpena, R.; Rosenzweig, C.; et al. Towards a new generation of agricultural system data, models and knowledge products: Design and improvement. Agric. Syst. 2017, 155, 255–268. [Google Scholar] [CrossRef]
- Capalbo, S.M.; Antle, J.M.; Seavert, C. Next generation data systems and knowledge products to support agricultural producers and science-based policy decision making. Agric. Syst. 2017, 2017, 191–199. [Google Scholar] [CrossRef] [PubMed]
- Janssen, S.J.C.; Porter, C.H.; Moore, A.D.; Athanasiadis, I.N.; Foster, I.; Jones, J.W.; Antle, J.M. Towards a new generation of agricultural system data, models and knowledge products: Information and communication technology. Agric. Syst. 2017, 155, 200–212. [Google Scholar] [CrossRef] [PubMed]
- Chlingaryan, A.; Sukkarieh, S.; Whelan, B. Machine learning approaches for crop yield prediction and nitrogen status estimation in precision agriculture: A review. Comput. Electron. Agric. 2018, 151, 61–69. [Google Scholar] [CrossRef]
- Christensen, A.A.; Andersen, P.S.; Piil, K.; Andersen, E.; Vejre, H.; Graversgaard, M. Pursuing implementation solutions for targeted nitrogen management in agriculture- a novel approach to synthesize knowledge and facilitate sustainable decision making based on collaborative landscape modelling. J. Environ. Manag. 2019, 246, 679–686. [Google Scholar] [CrossRef] [PubMed]
- Delgado, J.A.; Ascough, J.C.; Lighthart, N.; Neer, D. Potential use of a new nitrogen trading tool to assess nitrogen management practices to protect groundwater quality. Comput. Electron. Agric. 2020, 169, 105195. [Google Scholar] [CrossRef]
- Hirt, U.; Kreins, P.; Kuhn, U.; Mahnkopf, J.; Venohr, M.; Wendland, F. Management options to reduce future nitrogen emissions into rivers: A case study of the Weser river basin, Germany. Agric. Water Manag. 2012, 115, 118–131. [Google Scholar] [CrossRef]
- Mullender, S. NDICEA—A Digital Tool to Model Nutrient Balances across a Crop Rotation. Available online: https://orgprints.org/32609/1/PA_014_ORC_NDICEA_final.pdf (accessed on 6 April 2020).
- Schroeck, A.M.; Gaube, V.; Haas, E.; Winiwarter, W. Estimating nitrogen flows of agricultural soils at a landscape level-A modelling study of the Upper Enns Valley, a long-term socio-ecological research region in Austria. Sci. Total Environ. 2019, 665, 275–289. [Google Scholar] [CrossRef] [PubMed]
- van der Burgt, G.J.H.M.; Oomen, G.J.M.; Habets, A.S.J.; Rossing, W.A.H. The NDICEA model, a tool to improve nitrogen use efficiency in cropping systems. Nutr. Cycl. Agroecosyst. 2006, 74, 275–294. [Google Scholar] [CrossRef]
- Colaço, A.F.; Bramley, R. Do crop sensors promote improved nitrogen management in grain crops? Field Crop. Res. 2018, 218, 126–140. [Google Scholar] [CrossRef]
- Hank, T.; Bach, H.; Mauser, W. Using a Remote Sensing-Supported Hydro-Agroecological Model for Field-Scale Simulation of Heterogeneous Crop Growth and Yield: Application for Wheat in Central Europe. Remote Sens. 2015, 7, 3934–3965. [Google Scholar] [CrossRef] [Green Version]
- Goodlass, G.; Halberg, N.; Verschuur, G. Input output accounting systems in the European community—an appraisal of their usefulness in raising awareness of environmental problems. Eur. J. Agron. 2003, 20, 17–24. [Google Scholar] [CrossRef] [Green Version]
- Halberg, N.; Verschuur, G.; Goodlass, G. Farm level environmental indicators; are they useful? Agric. Ecosyst. Environ. 2005, 105, 195–212. [Google Scholar] [CrossRef] [Green Version]
- Khalil, T.M.; Stöckle, C.O.; Carlson, B.R.; Uslar-Valle, N.; Nelson, R.L.; Frear, C.S.; Ma, J.; Higgins, S.S.; Leytem, A.B.; Dungan, R.S. Dairy-CropSyst: Gaseous emissions and nutrient fate modeling tool. Comput. Electron. Agric. 2019, 162, 962–978. [Google Scholar] [CrossRef]
- Veltman, K.; Jones, C.D.; Gaillard, R.; Cela, S.; Chase, L.; Duval, B.D.; Izaurralde, R.C.; Ketterings, Q.M.; Li, C.; Matlock, M.; et al. Comparison of process-based models to quantify nutrient flows and greenhouse gas emissions associated with milk production. Agric. Ecosyst. Environ. 2017, 237, 31–44. [Google Scholar] [CrossRef] [Green Version]
- Martinez-Feria, R.A.; Castellano, M.J.; Dietzel, R.N.; Helmers, M.J.; Liebman, M.; Huber, I.; Archontoulis, S.V. Linking crop- and soil-based approaches to evaluate system nitrogen-use efficiency and tradeoffs. Agric. Ecosyst. Environ. 2018, 256, 131–143. [Google Scholar] [CrossRef]
- Tribouillois, H.; Constantin, J.; Guillon, B.; Willaume, M.; Aubrion, G.; Fontaine, A.; Hauprich, P.; Kerveillant, P.; Laurent, F.; Therond, O. AqYield-N: A simple model to predict nitrogen leaching from crop fields. Agric. For. Meteorol. 2020, 284, 107890. [Google Scholar] [CrossRef]
- InfoCuria. Available online: http://curia.europa.eu/juris/documents.jsf?num=C-543/16 (accessed on 24 September 2019).
- Godinot, O.; Leterme, P.; Vertès, F.; Carof, M. Indicators to evaluate agricultural nitrogen efficiency of the 27 member states of the European Union. Ecol. Indic. 2016, 66, 612–622. [Google Scholar] [CrossRef]
- European Commission (EC). EU Countries Gross Nutrient Balance. Available online: http://appsso.eurostat.ec.europa.eu/nui/show.do?dataset=aei_pr_gnb&lang=en (accessed on 19 October 2021).
- Offermann, F.; Banse, M.; Freund, F.; Haß, M.; Kreins, P.; Laquai, V.; Osterburg, B.; Hansen, J.; Rösemann, C.; Salamon, P. Thünen-Baseline 2017–2027: Agrarökonomische Projektionen für Deutschland; Johann Heinrich von Thünen-Institut: Braunschweig, Germany, 2018; ISBN 978-3-86576-180-4. [Google Scholar]
- Wiesler, F.; Hund-Rinke, K.; Gäth, S.; George, E.; Greef, M.; Hölzle, L.E.; Holz, F.; Hülsbergen, K.-J.; Pfeil, R.; Severin, K.; et al. Application of Organic Fertilisers and Organic Residual Materials in Agriculture; Scientific Advisory Board on Fertiliser Issues at the Federal Ministry of Food and Agriculture: Bonn, Germany, 2015. [Google Scholar] [CrossRef]
- KLU. Landwirtschaft Quo Vadis? Agrar- und Ernährungssysteme der Zukunft–Vielfalt Gewähren, Handlungsrahmen Abstecken. Available online: https://www.umweltbundesamt.de/sites/default/files/medien/1410/publikationen/190917_uba_kp_landwirtschaft_quovadis_bf.pdf (accessed on 28 February 2020).
- Haenel, H.-D.; Rösemann, C.; Dämmgen, U.; Döring, U.; Wulf, S.; Eurich-Menden, B.; Freibauer, A.; Döhler, H.; Schreiner, C.; Osterburg, B.; et al. Calculations of Gaseous and Particulate Emissions from German Agriculture 1990–2018; Thünen Report 77; Johann Heinrich von Thünen-Institut: Braunschweig, Germany, 2020. [Google Scholar]
- German Environment Agency. Indicator: Agricultural Nitrogen Surplus. Available online: https://www.umweltbundesamt.de/en/data/environmental-indicators/indicator-agricultural-nitrogen-surplus#at-a-glance (accessed on 25 October 2021).
- German Environment Agency. Stickstoff-Flächenbilanzen für Deutschland mit Regionalgliederung Bundesländer und Kreise–Jahre 1995 bis 2017. Available online: https://www.umweltbundesamt.de/sites/default/files/medien/1410/publikationen/2019-10-28_texte_131-2019_stickstoffflaechenbilanz.pdf (accessed on 25 October 2021).
- Garnier, J.; Anglade, J.; Benoit, M.; Billen, G.; Puech, T.; Ramarson, A.; Passy, P.; Silvestre, M.; Lassaletta, L.; Trommenschlager, J.-M.; et al. Reconnecting crop and cattle farming to reduce nitrogen losses to river water of an intensive agricultural catchment (Seine basin, France): Past, present and future. Environ. Sci. Policy 2016, 63, 76–90. [Google Scholar] [CrossRef]
- Andrews, M.; Raven, J.A.; Lea, P.J. Do plants need nitrate? The mechanisms by which nitrogen form affects plants. Ann. Appl. Biol. 2013, 163, 174–199. [Google Scholar] [CrossRef]
- Sanders, J.; Heß, J. (Eds.) Thünen Report 65: Leistungen des Ökologischen Landbaus für Umwelt und Gesellschaft; Johann Heinrich von Thünen-Institut: Braunschweig, Germany, 2019; ISBN 978-3-86576-193-4. [Google Scholar]
- Hülsbergen, K.-J.; Rahmann, G. (Eds.) Thünen Report 29: Klimawirkungen und Nachhaltigkeit ökologischer und konventioneller Betriebssysteme-Untersuchungen in einem Netzwerk von Pilotbetrieben: Forschungsergebnisse 2013–2014; Johann Heinrich von Thünen-Institut: Braunschweig, Germany, 2015; ISBN 978-3-86576-135-4. [Google Scholar]
- Castrignanò, A.; Buttafuoco, G.; Khosla, R.; Mouazen, A.M.; Moshou, D.; Naud, O. Agricultural Internet of Things and Decision Support for Precision Smart Farming; Academic Press: London, UK, 2020; ISBN 978-0-12-818373-1. [Google Scholar]
- Oenema, O. Principles of Integrated, Sustainable Nitrogen Management: Draft Section for a Guidance Document. Available online: https://ec.europa.eu/info/sites/info/files/principles_of_nitrogen_management_-_17sep19.pdf (accessed on 2 December 2020).
- Quemada, M.; Lassaletta, L.; Jensen, L.S.; Godinot, O.; Brentrup, F.; Buckley, C.; Foray, S.; Hvid, S.K.; Oenema, J.; Richards, K.G.; et al. Exploring nitrogen indicators of farm performance among farm types across several European case studies. Agric. Syst. 2020, 177, 102689. [Google Scholar] [CrossRef]
- Salomon, M.; Schmid, E.; Volkens, A.; Hey, C.; Holm-Müller, K.; Foth, H. Towards an integrated nitrogen strategy for Germany. Environ. Sci. Policy 2016, 55, 158–166. [Google Scholar] [CrossRef]
- Godinot, O.; Leterme, P.; Vertès, F.; Faverdin, P.; Carof, M. Relative nitrogen efficiency, a new indicator to assess crop livestock farming systems. Agron. Sustain. Dev. 2015, 35, 857–868. [Google Scholar] [CrossRef] [Green Version]
- Köhler, B.; Kolbe, H. BEFU-Teil Ökologischer Landbau. Available online: http://orgprints.org/13632/1/kolbe-2007-13632-MANUAL_BEFU4.pdf (accessed on 2 December 2020).
- Ratjen, A.; Kage, H. Predicting the site specific soil N supply under winter wheat in Germany. Nutr. Cycl. Agroecosyst. 2017, 110, 71–81. [Google Scholar] [CrossRef]
- Schröder, J.J.; Schulte, R.P.O.; Creamer, R.E.; Delgado, A.; van Leeuwen, J.; Lehtinen, T.; Rutgers, M.; Spiegel, H.; Staes, J.; Tóth, G.; et al. The elusive role of soil quality in nutrient cycling: A review. Soil Use Manag. 2016, 32, 476–486. [Google Scholar] [CrossRef]
- Nafissi, A.; Weckesser, F.; Kessler, I.; Rickert, M.; Pfaff, M.; Peisl, S.; Beck, M. Wissensbasierte digitale Unterstützung in der Pflanzenbauberatung. In Lecture Notes in Informatics (LNI): 39. GIL-Jahrestagung-Digitalisierung für Landwirtschaftliche Betriebe in Kleinstrukturierten Regionen-ein Widerspruch in Sich? Gesellschaft für Informatik, Ed.; Gesellschaft für Informatik: Bonn, Germany, 2019; pp. 145–150. ISBN 978-3-88579-681-7. [Google Scholar]
- Weckesser, F.; Hartmann, A.; Beck, M.; Peisl, S. Entscheidungsunterstützung durch Datenvernetzung-Ein Fallbeispiel der Pflanzenbauberatung. In Lecture Notes in Informatics (LNI): 40. GIL-Jahrestagung-Digitalisierung für Mensch, Umwelt und Tier; Gesellschaft für Informatik, Ed.; Gesellschaft für Informatik: Bonn, Germany, 2020; pp. 337–342. ISBN 978-3-88579-693-0. [Google Scholar]
- Chmelíková, L.; Schmid, H.; Anke, S.; Hülsbergen, K.-J. Nitrogen-use efficiency of organic and conventional arable and dairy farming systems in Germany. Nutr. Cycl. Agroecosyst. 2021, 119, 337–354. [Google Scholar] [CrossRef]
- Klages, S.; Heidecke, C.; Osterburg, B.; Bailey, J.; Calciu, I.; Casey, C.; Dalgaard, T.; Frick, H.; Glavan, M.; D’Haene, K.; et al. Nitrogen Surplus—A Unified Indicator for Water Pollution in Europe? Water 2020, 12, 1197. [Google Scholar] [CrossRef] [Green Version]
- Aveline, A.; Rousseau, M.L.; Guichard, L.; Laurent, M.; Bockstaller, C. Evaluating an environmental indicator: Case study of MERLIN, a method for assessing the risk of nitrate leaching. Agric. Syst. 2009, 100, 22–30. [Google Scholar] [CrossRef]
- Bockstaller, C.; Guichard, L.; Keichinger, O.; Girardin, P.; Galan, M.-B.; Gaillard, G. Comparison of methods to assess the sustainability of agricultural systems. A review. Agron. Sustain. Dev. 2009, 29, 223–235. [Google Scholar] [CrossRef] [Green Version]
- Bockstaller, C.; Guichard, L.; Makowski, D.; Aveline, A.; Girardin, P.; Plantureux, S. Agri-environmental indicators to assess cropping and farming systems. A review. Agron. Sustain. Dev. 2008, 28, 139–149. [Google Scholar] [CrossRef]
- Thiollet-Scholtus, M.; Bockstaller, C. Using indicators to assess the environmental impacts of wine growing activity: The INDIGO® method. Eur. J. Agron. 2015, 62, 13–25. [Google Scholar] [CrossRef]
- Federal Office for Agriculture and Food. Düngeverordnung 2020 (German Fertilizer Ordinance). Available online: https://www.ble-medienservice.de/frontend/esddownload/index/id/1515/on/1756/act/dl (accessed on 18 January 2021).
- LfULG. Düngebedarfsermittlung mit BESyD. Available online: https://www.landwirtschaft.sachsen.de/duengebedarfsermittlung-besyd-20619.html (accessed on 19 October 2021).
- Offenberger, K.; Fischer, K.; Wendland, M.; Sperger, C.; Brandl, M.; Kavka, A. Düngeberatungssystem Stickstoff: DSN 2020; Landesanstalt für Landwirtschaft (LfL): Freising, Germany, 2019. [Google Scholar]
- FarmFacts. Needs-Based Fertilisation. Available online: https://www.nextfarming.com/solutions/needs-based-fertilisation/ (accessed on 1 April 2020).
- YARA. N-Sensor ALS-to Variably Apply Nitrogen. Available online: https://www.yara.co.uk/crop-nutrition/farmers-toolbox/n-sensor/ (accessed on 11 August 2020).
- Fritzmeier. ISARIA. Available online: https://www.isaria-digitalfarming.com/en/product/isaria-pro-active/ (accessed on 11 August 2020).
- Trimble. GreenSeeker System. Available online: https://agriculture.trimble.com/product/greenseeker-system/ (accessed on 7 August 2020).
- BASF. XARVIO Field Manager. Available online: https://www.xarvio.com/global/en/FIELD-MANAGER.html (accessed on 11 May 2020).
- Maidl, F.-X.; Spicker, A.; Prücklmaier, J.; Hülsbergen, K.-J. Minderung von Nitratausträgen in Trinkwassereinzugsgebieten durch sensorgestützte N-Düngung. VDLUFA-Schriftenreihe 2017, 74, 137–144. [Google Scholar]
- YARA. Atfarm. Available online: https://www.at.farm (accessed on 11 May 2020).
- Schmidhalter, U. Development of a Quick On-Farm Test to Determine Nitrate Levels in Soil. J. Plant Nutr. Soil Sci. 2005, 168, 432–438. [Google Scholar] [CrossRef]
- YARA. N-Tester: Instruction Manual. Available online: https://www.yara.my/contentassets/6d5ba39b1a364a33be1e4e6b6b2a2be1/n-tester-instruction-manual.pdf/ (accessed on 20 July 2020).
- Gilabert, M.A.; González-Piqueras, J.; García-Haro, F.J.; Meliá, J. A generalized soil-adjusted vegetation index. Remote Sens. Environ. 2002, 82, 303–310. [Google Scholar] [CrossRef]
- Förster, F. BEFU-Düngungsempfehlungs- und Bilanzierungssystem. Available online: https://publikationen.sachsen.de/bdb/artikel/13447/documents/28974+&cd=2&hl=de&ct=clnk&gl=de&client=firefox-b-d (accessed on 8 August 2020).
- MQuant. Nitrate Test: Instructions for Use. Available online: https://www.merckmillipore.com/DE/en/product/Nitrate-Test,MDA_CHEM-110020 (accessed on 18 January 2021).
- Whelan, B. Site-Specific Crop Management. In Pedometrics; McBratney, A.B., Minasny, B., Stockmann, U., Eds.; Springer International Publishing: Cham, Switzerland, 2018; pp. 597–622. ISBN 978-3-319-63437-1. [Google Scholar]
- Ludowicy, C.; Schwaiberger, R.; Leithold, P. Precision Farming: Handbuch für die Praxis; 1. Auflage; DLG-Verlag: Frankfurt am Main, Germany, 2002; ISBN 978-3769006001. [Google Scholar]
- Lütticken, R. Realisierung des Raum-Zeit-Bezugs von Daten zur Umsetzung Teilflächenspezifischer Bewirtschaftungsmaßnahmen im Pflanzenbau; Koch: Stuttgart, Germany, 1996. [Google Scholar]
- Schmidhalter, U.; Maidl, F.-X.; Heuwinkel, H.; Demmel, M. Precision Farming–Adaptation of Land Use Management to Small Scale Heterogeneity. In Perspectives for Agroecosystem Management; Schröder, P., Pfadenhauer, J., Munch, J.C., Eds.; Elsevier B.V.: Amsterdam, The Netherlands, 2008. [Google Scholar]
- Dataväxt. CropSat. Available online: https://cropsat.com/ (accessed on 29 June 2020).
- DLR. Copernicus Data and Exploitation Platform (CODE-DE). Available online: https://code-de.org (accessed on 29 June 2020).
- Clevers, J.; Gitelson, A.A. Remote estimation of crop and grass chlorophyll and nitrogen content using red-edge bands on Sentinel-2 and -3. Int. J. Appl. Earth Obs. Geoinf. 2013, 23, 344–351. [Google Scholar] [CrossRef]
- VISTA. Ypsilon-Yield Prediction by Satellite. Available online: https://ypsilon.services/ (accessed on 26 June 2020).
- Antille, D.L.; Lobsey, C.R.; McCarthy, C.L.; Thomasson, J.A.; Baillie, C.P. A review of the state of the art in agricultural automation. Part IV: Sensor-based nitrogen management technologies. Meeting Presentation. In Proceedings of the ASABE International Meeting, Detroit, MI, USA, 29 July–1 August 2018. [Google Scholar] [CrossRef]
- Prey, L.; Schmidhalter, U. Temporal and Spectral Optimization of Vegetation Indices for Estimating Grain Nitrogen Uptake and Late-Seasonal Nitrogen Traits in Wheat. Sensors 2019, 19, 4640. [Google Scholar] [CrossRef] [Green Version]
- Prey, L.; Schmidhalter, U. Sensitivity of Vegetation Indices for Estimating Vegetative N Status in Winter Wheat. Sensors 2019, 19, 3712. [Google Scholar] [CrossRef] [PubMed] [Green Version]
- Maidl, F.-X. Method for Ascertaining the Fertilizer Requirement, in Particular the Nitrogen Fertilizer Requirement and Apparatus for Carrying out the Method. German Patent No. DE 10 2011 001 096.3, 4 March 2011. [Google Scholar]
- Maidl, F.-X. Voraussetzungen für eine sensorgesteuerte teilflächen-spezifische N-Düngung. In Lecture Notes in Informatics (LNI); 32. GIL-Jahrestagung-Informationstechnologie für eine nachhaltige, Landbewirtschaftung; Gesellschaft für Informatik, Ed.; Gesellschaft für Informatik: Bonn, Germany, 2012; pp. 199–202. ISBN 978-3-88579-288-8. [Google Scholar]
- Küstermann, B.; Christen, O.; Hülsbergen, K.-J. Modelling nitrogen cycles of farming systems as basis of site- and farm-specific nitrogen management. Agric. Ecosyst. Environ. 2010, 135, 70–80. [Google Scholar] [CrossRef]
- Lin, H.-C.; Huber, J.A.; Gerl, G.; Hülsbergen, K.-J. Nitrogen balances and nitrogen-use efficiency of different organic and conventional farming systems. Nutr. Cycl. Agroecosyst. 2016, 105, 1–23. [Google Scholar] [CrossRef]
- Salo, T.; Turtola, E. Nitrogen balance as an indicator of nitrogen leaching in Finland. Agric. Ecosyst. Environ. 2006, 113, 98–107. [Google Scholar] [CrossRef]
- Sassenrath, G.F.; Schneider, J.M.; Gaj, R.; Grzebisz, W.; Halloran, J.M. Nitrogen balance as an indicator of environmental impact: Toward sustainable agricultural production. Renew. Agric. Food Syst. 2013, 28, 276–289. [Google Scholar] [CrossRef] [Green Version]
- Cherry, K.A.; Shepherd, M.; Withers, P.J.A.; Mooney, S.J. Assessing the effectiveness of actions to mitigate nutrient loss from agriculture: A review of methods. Sci. Total Environ. 2008, 406, 1–23. [Google Scholar] [CrossRef] [PubMed]
- Watson, C.A.; Atkinson, D. Using nitrogen budgets to indicate nitrogen use efficiency and losses fromwhole farm systems: A comparison of three methodological approaches. Nutr. Cycl. Agroecosyst. 1999, 53, 259–267. [Google Scholar] [CrossRef]
- Oenema, O.; Kros, H.; de Vries, W. Approaches and uncertainties in nutrient budgets: Implications for nutrient management and environmental policies. Eur. J. Agron. 2003, 20, 3–16. [Google Scholar] [CrossRef]
- Lin, B.-L.; Sakoda, A.; Shibasaki, R.; Suzuki, M. A Modelling Approach to Global Nitrate Leaching Caused by Anthropogenic Fertilisation. Water Res. 2001, 35, 1961–1968. [Google Scholar] [CrossRef]
- Abraham, J. Auswirkungen von Standortvariabilitäten auf den Stickstoffhaushalt Ackerbaulich Genutzter Böden unter Berücksichtigung der Betriebsstruktur, der Standortspezifischen Bewirtschaftung und der Witterungsbedingungen; Shaker: Aachen, Germany, 2001; ISBN 3-8265-9355-3. [Google Scholar]
- Hülsbergen, K.-J.; Maidl, F.-X.; Forster, F.; Prücklmaier, J. Minderung von Nitratausträgen in Trinkwassereinzugsgebieten durch Optimiertes Stickstoffmanagement; am Beispiel der Gemeinde Hohenthann (Niederbayern) mit Intensiver Landwirtschaftlicher Flächennutzung; Technical University of Munich (TUM): Freising, Germany, 2017. [Google Scholar]
- KTBL. Wirtschaftsdünger-Rechner. Available online: https://daten.ktbl.de/wdrechnerdemo/home.action# (accessed on 28 April 2020).
- StoffBilV. Verordnung über den Umgang mit Nährstoffen im Betrieb und Betriebliche Stoffstrombilanzen. Available online: https://www.gesetze-im-internet.de/stoffbilv/ (accessed on 28 April 2020).
- Hülsbergen, K.-J. Entwicklung und Anwendung Eines Bilanzierungsmodells zur Bewertung der Nachhaltigkeit Landwirtschaftlicher Systeme; Shaker: Aachen, Germany, 2003; ISBN 978-3832214647. [Google Scholar]
- Constantin, J.; Beaudoin, N.; Launay, M.; Duval, J.; Mary, B. Long-term nitrogen dynamics in various catch crop scenarios: Test and simulations with STICS model in a temperate climate. Agric. Ecosyst. Environ. 2012, 147, 36–46. [Google Scholar] [CrossRef] [Green Version]
- Franko, U.; Oelschlägel, B.; Schenk, S.; Puhlmann, M.; Kuka, K.; Mallast née Krüger, J.; Thiel, E.; Prays, N.; Meurer, K.; Bönecke, E. CANDY Manual: Description of Background. Available online: https://www.ufz.de/export/data/2/95948_CANDY_MANUAL.pdf (accessed on 8 August 2020).
- Cannavo, P.; Recous, S.; Parnaudeau, V.; Reau, R. Modeling N Dynamics to Assess Environmental Impacts of Cropped Soils. Adv. Agron. 2008, 97, 131–174. [Google Scholar] [CrossRef]
- Engel, T.; Klöcking, B.; Priesack, E.; Schaaf, T. Simulationsmodelle zur Stickstoffdynamik: Analyse und Vergleich; Verlag Eugen Ulmer: Stuttgart, Germany, 1993; ISBN 3800186438. [Google Scholar]
- ISMC. Model Portal. Available online: https://soil-modeling.org/resources-links/model-portal (accessed on 8 August 2020).
- Banger, K.; Yuan, M.; Wang, J.; Nafziger, E.D.; Pittelkow, C.M. A Vision for Incorporating Environmental Effects into Nitrogen Management Decision Support Tools for U.S. Maize Production. Front. Plant Sci. 2017, 8, 1270. [Google Scholar] [CrossRef] [PubMed] [Green Version]
- Franko, U.; Oelschlägel, B. CANDY-Carbon Nitrogen Dynamics. Agrarinformatik 1993, 25, 99–110. [Google Scholar]
- Hülsbergen, K.-J.; Schmid, H.; Chmelíková, L. 10 Jahre Transdisziplinäre Forschung im Netzwerk der Pilotbetriebe. 2019. Available online: http://www.pilotbetriebe.de/ (accessed on 15 June 2021).
- Lindblom, J.; Lundström, C.; Ljung, M.; Jonsson, A. Promoting sustainable intensification in precision agriculture: Review of decision support systems development and strategies. Precis. Agric. 2017, 18, 309–331. [Google Scholar] [CrossRef] [Green Version]
- Rose, D.; Parker, C.; Fodey, J.; Park, C.; Sutherland, W.; Dicks, L. Involving stakeholders in agricultural decision support systems: Improving user-centred design. Int. J. Agric. Manag. 2018, 6, 80–89. [Google Scholar] [CrossRef]
- Dessart, F.J.; Barreiro-Hurlé, J.; van Bavel, R. Behavioural factors affecting the adoption of sustainable farming practices: A policy-oriented review. Eur. Rev. Agric. Econ. 2019, 46, 417–471. [Google Scholar] [CrossRef] [Green Version]
- Klerkx, L.; Jakku, E.; Labarthe, P. A review of social science on digital agriculture, smart farming and agriculture 4.0: New contributions and a future research agenda. NJAS Wagening. J. Life Sci. 2019, 90, 100315. [Google Scholar] [CrossRef]
- Groeneveld, D.; Tekinerdogan, B.; Garousi, V.; Catal, C. A domain-specific language framework for farm management information systems in precision agriculture. Precis. Agric. 2021, 22, 1067–1106. [Google Scholar] [CrossRef]
- DWD. Open Data Portal. Available online: https://opendata.dwd.de/ (accessed on 12 May 2020).
- Attorre, F.; Alfo’, M.; de Sanctis, M.; Francesconi, F.; Bruno, F. Comparison of interpolation methods for mapping climatic and bioclimatic variables at regional scale. Int. J. Climatol. 2007, 27, 1825–1843. [Google Scholar] [CrossRef] [Green Version]
- Ertel, W. Introduction to Artificial Intelligence, 2nd ed.; Springer International Publishing: Cham, Switzerland, 2017; ISBN 978-3-319-58487-4. [Google Scholar]
- EU. European Data Portal: Agriculture, Fisheries, Forestry & Foods. Available online: https://www.europeandataportal.eu/data/datasets?categories=agri&page=1&locale=en (accessed on 30 June 2020).
- Hutengs, C.; Seidel, M.; Oertel, F.; Ludwig, B.; Vohland, M. In situ and laboratory soil spectroscopy with portable visible-to-near-infrared and mid-infrared instruments for the assessment of organic carbon in soils. Geoderma 2019, 355, 113900. [Google Scholar] [CrossRef]
- Lesecq, S.; Molnos, A.; Gougis, M.; Gouze, E.; Correvon, M.; Dudnik, G.; Di Matteo, A.; Di Palma, V.; Alessi, E.; O’Riordan, A.E.A. SARMENTI: Smart Multisensor Embedded and Securesystem for Soil Nutrient and Gaseous Emission Monitoring. Available online: https://pdfs.semanticscholar.org/5de5/7778d7b6e45ab9b74590464846e9c58f7999.pdf (accessed on 10 August 2020).
- Metzger, K.; Zhang, C.; Ward, M.; Daly, K. Mid-infrared spectroscopy as an alternative to laboratory extraction for the determination of lime requirement in tillage soils. Geoderma 2020, 364, 114171. [Google Scholar] [CrossRef]
- O’Rourke, S.M.; Minasny, B.; Holden, N.M.; McBratney, A.B. Synergistic Use of Vis-NIR, MIR, and XRF Spectroscopy for the Determination of Soil Geochemistry. Soil Sci. Soc. Am. J. 2016, 80, 888–899. [Google Scholar] [CrossRef] [Green Version]
- O’Rourke, S.M.; Stockmann, U.; Holden, N.M.; McBratney, A.B.; Minasny, B. An assessment of model averaging to improve predictive power of portable vis-NIR and XRF for the determination of agronomic soil properties. Geoderma 2016, 279, 31–44. [Google Scholar] [CrossRef]
- European Commission (EC). Integrated Administration and Control System (IACS). Available online: https://ec.europa.eu/info/food-farming-fisheries/key-policies/common-agricultural-policy/financing-cap/financial-assurance/managing-payments_en (accessed on 26 June 2020).
- Michels, M.; Bonke, V.; Mußhoff, O. Investigating the adoption of smartphone apps in crop protection. In Lecture Notes in Informatics (LNI): 40. GIL-Jahrestagung-Digitalisierung für Mensch, Umwelt und Tier; Gesellschaft für Informatik, Ed.; Gesellschaft für Informatik: Bonn, Germany, 2020; pp. 175–180. ISBN 978-3-88579-693-0. [Google Scholar]
- Schulze Schwering, D.; Lemken, D. Totally Digital? Adoption of Digital Farm Management Information Systems. In Lecture Notes in Informatics (LNI): 40. GIL-Jahrestagung-Digitalisierung für Mensch, Umwelt und Tier; Gesellschaft für Informatik, Ed.; Gesellschaft für Informatik: Bonn, Germany, 2020; pp. 295–300. ISBN 978-3-88579-693-0. [Google Scholar]
- Frauenhofer IESE. Agricultural Data Space (ADS): Whitepaper. Available online: https://www.iese.fraunhofer.de/content/dam/iese/de/dokumente/innovationsthemen/COGNAC_Whitepaper_ADS_eng.pdf (accessed on 27 November 2020).
- Klose, J.; Schröder, M.; Becker, S.; Bernardi, A. Datenaufbereitung in der Landwirtschaft Durch Automatisierte Semantische Annotation. In Lecture Notes in Informatics (LNI): 40. GIL-Jahrestagung-Digitalisierung für Mensch, Umwelt und Tier; Gesellschaft für Informatik, Ed.; Gesellschaft für Informatik: Bonn, Germany, 2020; pp. 133–138. ISBN 978-3-88579-693-0. [Google Scholar]
- Roosen, J.; Groß, S. Digitalisierung in Land- und Ernährungswirtschaft: Studie; Vereinigung der Bayerischen Wirtschaft e.V. (vbw): München, Germany, 2017. [Google Scholar]
- Saiz-Rubio, V.; Rovira-Más, F. From Smart Farming towards Agriculture 5.0: A Review on Crop Data Management. Agronomy 2020, 10, 207. [Google Scholar] [CrossRef] [Green Version]
- Paraforos, D.S.; Sharipov, G.M.; Griepentrog, H.W. ISO 11783—Compatible industrial sensor and control systems and related research: A review. Comput. Electron. Agric. 2019, 163, 104863. [Google Scholar] [CrossRef]
- John Deere. HarvestLab 3000. Available online: https://www.deere.de/assets/publications/index.html?id=8cd690bc#1 (accessed on 11 May 2020).
- Horf, M.; Gebbers, R.; Vogel, S.; Ostermann, M.; Piepel, M.-F.; Olfs, H.-W. Determination of Nutrients in Liquid Manures and Biogas Digestates by Portable Energy-Dispersive X-ray Fluorescence Spectrometry. Sensors 2021, 21, 3892. [Google Scholar] [CrossRef] [PubMed]
- Oenema, O.; Tamminga, S. Nitrogen in global animal production and management options for improving nitrogen use efficiency. Sci. China Ser. C Life Sci. 2005, 48, 871–887. [Google Scholar] [CrossRef]
- Pohl, K.; Rupp, C. Basiswissen Requirements Engineering: Aus- und Weiterbildung nach IREB-Standard zum Certified Professional for Requirements Engineering: Foundation Level nach IREB-Standard; 4. überarbeitete Auflage; Dpunkt: Heidelberg, Germany, 2015; ISBN 978-3-86490-283-3. [Google Scholar]
- Fernandez-Mena, H.; Nesme, T.; Pellerin, S. Towards an Agro-Industrial Ecology: A review of nutrient flow modelling and assessment tools in agro-food systems at the local scale. Sci. Total Environ. 2016, 543, 467–479. [Google Scholar] [CrossRef] [PubMed]
- Rose, D.C.; Sutherland, W.J.; Parker, C.; Lobley, M.; Winter, M.; Morris, C.; Twining, S.; Ffoulkes, C.; Amano, T.; Dicks, L.V. Decision support tools for agriculture: Towards effective design and delivery. Agric. Syst. 2016, 149, 165–174. [Google Scholar] [CrossRef] [Green Version]
- Navulur, S.; Sastry, A.; Prasad, M. Agricultural Management through Wireless Sensors and Internet of Things. IJECE 2017, 7, 3492. [Google Scholar] [CrossRef] [Green Version]
- Wolfert, S.; Ge, L.; Verdouw, C.; Bogaardt, M.-J. Big Data in Smart Farming—A review. Agric. Syst. 2017, 153, 69–80. [Google Scholar] [CrossRef]
- Dörr, J.; Fairclough, B.; Henningsen, J.; Jahić, J.; Kersting, S.; Mennig, P.; Peper, C.; Scholten-Buschhoff, F. Scouting the Autonomous Agricultural Machinery Market. Available online: https://www.iese.fraunhofer.de/content/dam/iese/en/dokumente/smart-farming/Scouting-the-Autonomous-Agricultural-Machinery-Market.pdf (accessed on 25 June 2020).
- OPC. OPC Unified Architecture-Interoperability for Industrie 4.0 and the Internet of Things. Available online: https://opcfoundation.org/wp-content/uploads/2017/11/OPC-UA-Interoperability-For-Industrie4-and-IoT-EN.pdf (accessed on 26 June 2020).
- Soma, K.; Bogaardt, M.-J.; Poppe, K.; Wolfert, S.; Beers, G.; Urdu, D.; Pesce, M.; Kirova, M.; Thurston, C.; Monfort Belles, C. Research for AGRI Committee-Impacts of the Digital Economy on the Food Chain and the CAP; European Parliament: Brussels, Belgium, 2019; ISBN 978-92-846-4628-9. [Google Scholar]
- DEMETER: DEMETER’s Goal Is to Lead the Digital Transformation of Europe’s Agri-Food Sector through the Rapid Adoption of Advanced IoT Technologies, Data Science and Smart Farming. Available online: https://h2020-demeter.eu/ (accessed on 20 July 2020).
- IAIS. ATLAS-Agricultural Interoperability and Analysis System. Available online: https://www.atlas-h2020.eu/ (accessed on 18 June 2020).
- Jørgensen, M.H. Agricultural Field Production in an ‘Industry 4.0′ Concept. Agron. Res. 2018, 16, 94–102. [Google Scholar] [CrossRef]
- Mittermayer, M.; Gilg, A.; Maidl, F.-X.; Nätscher, L.; Hülsbergen, K.-J. Site-specific nitrogen balances based on spatially variable soil and plant properties. Precis. Agric. 2021, 22, 1416–1436. [Google Scholar] [CrossRef]
- Richards, M. Software Architecture Patterns; O’Reilly Media: Sebastopol, CA, USA, 2015; ISBN 978-1-4919-2540-9. [Google Scholar]

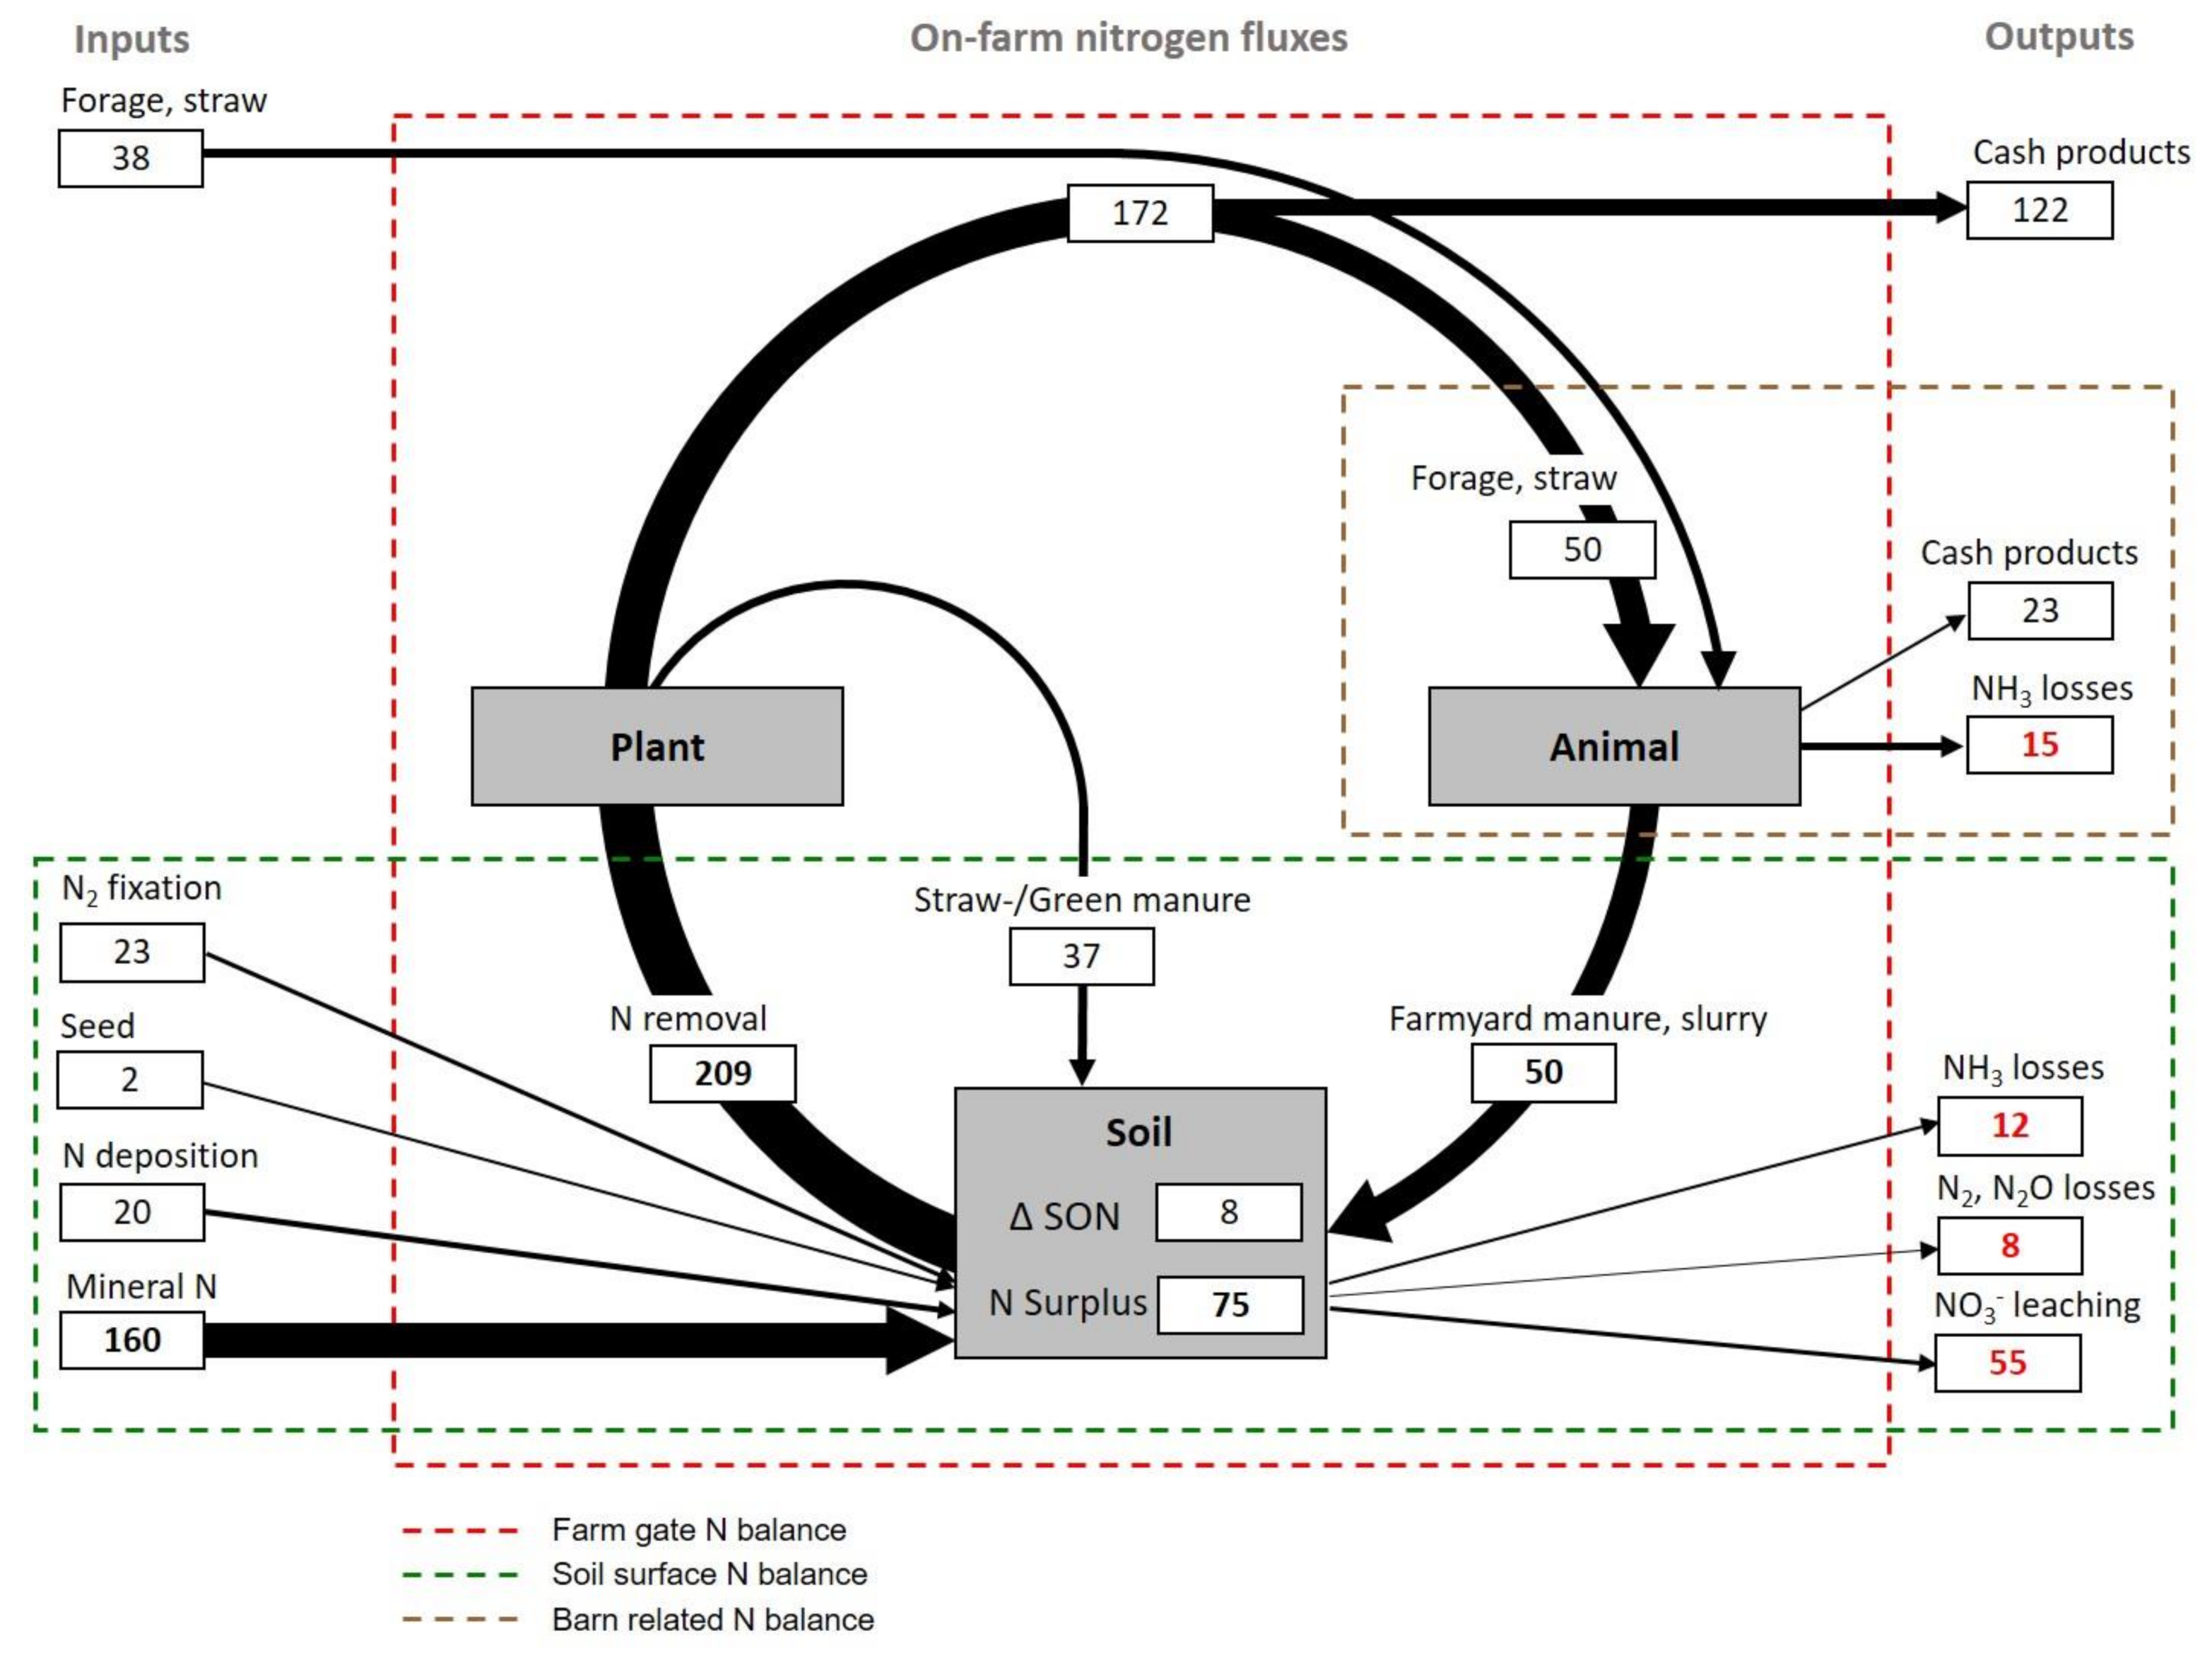
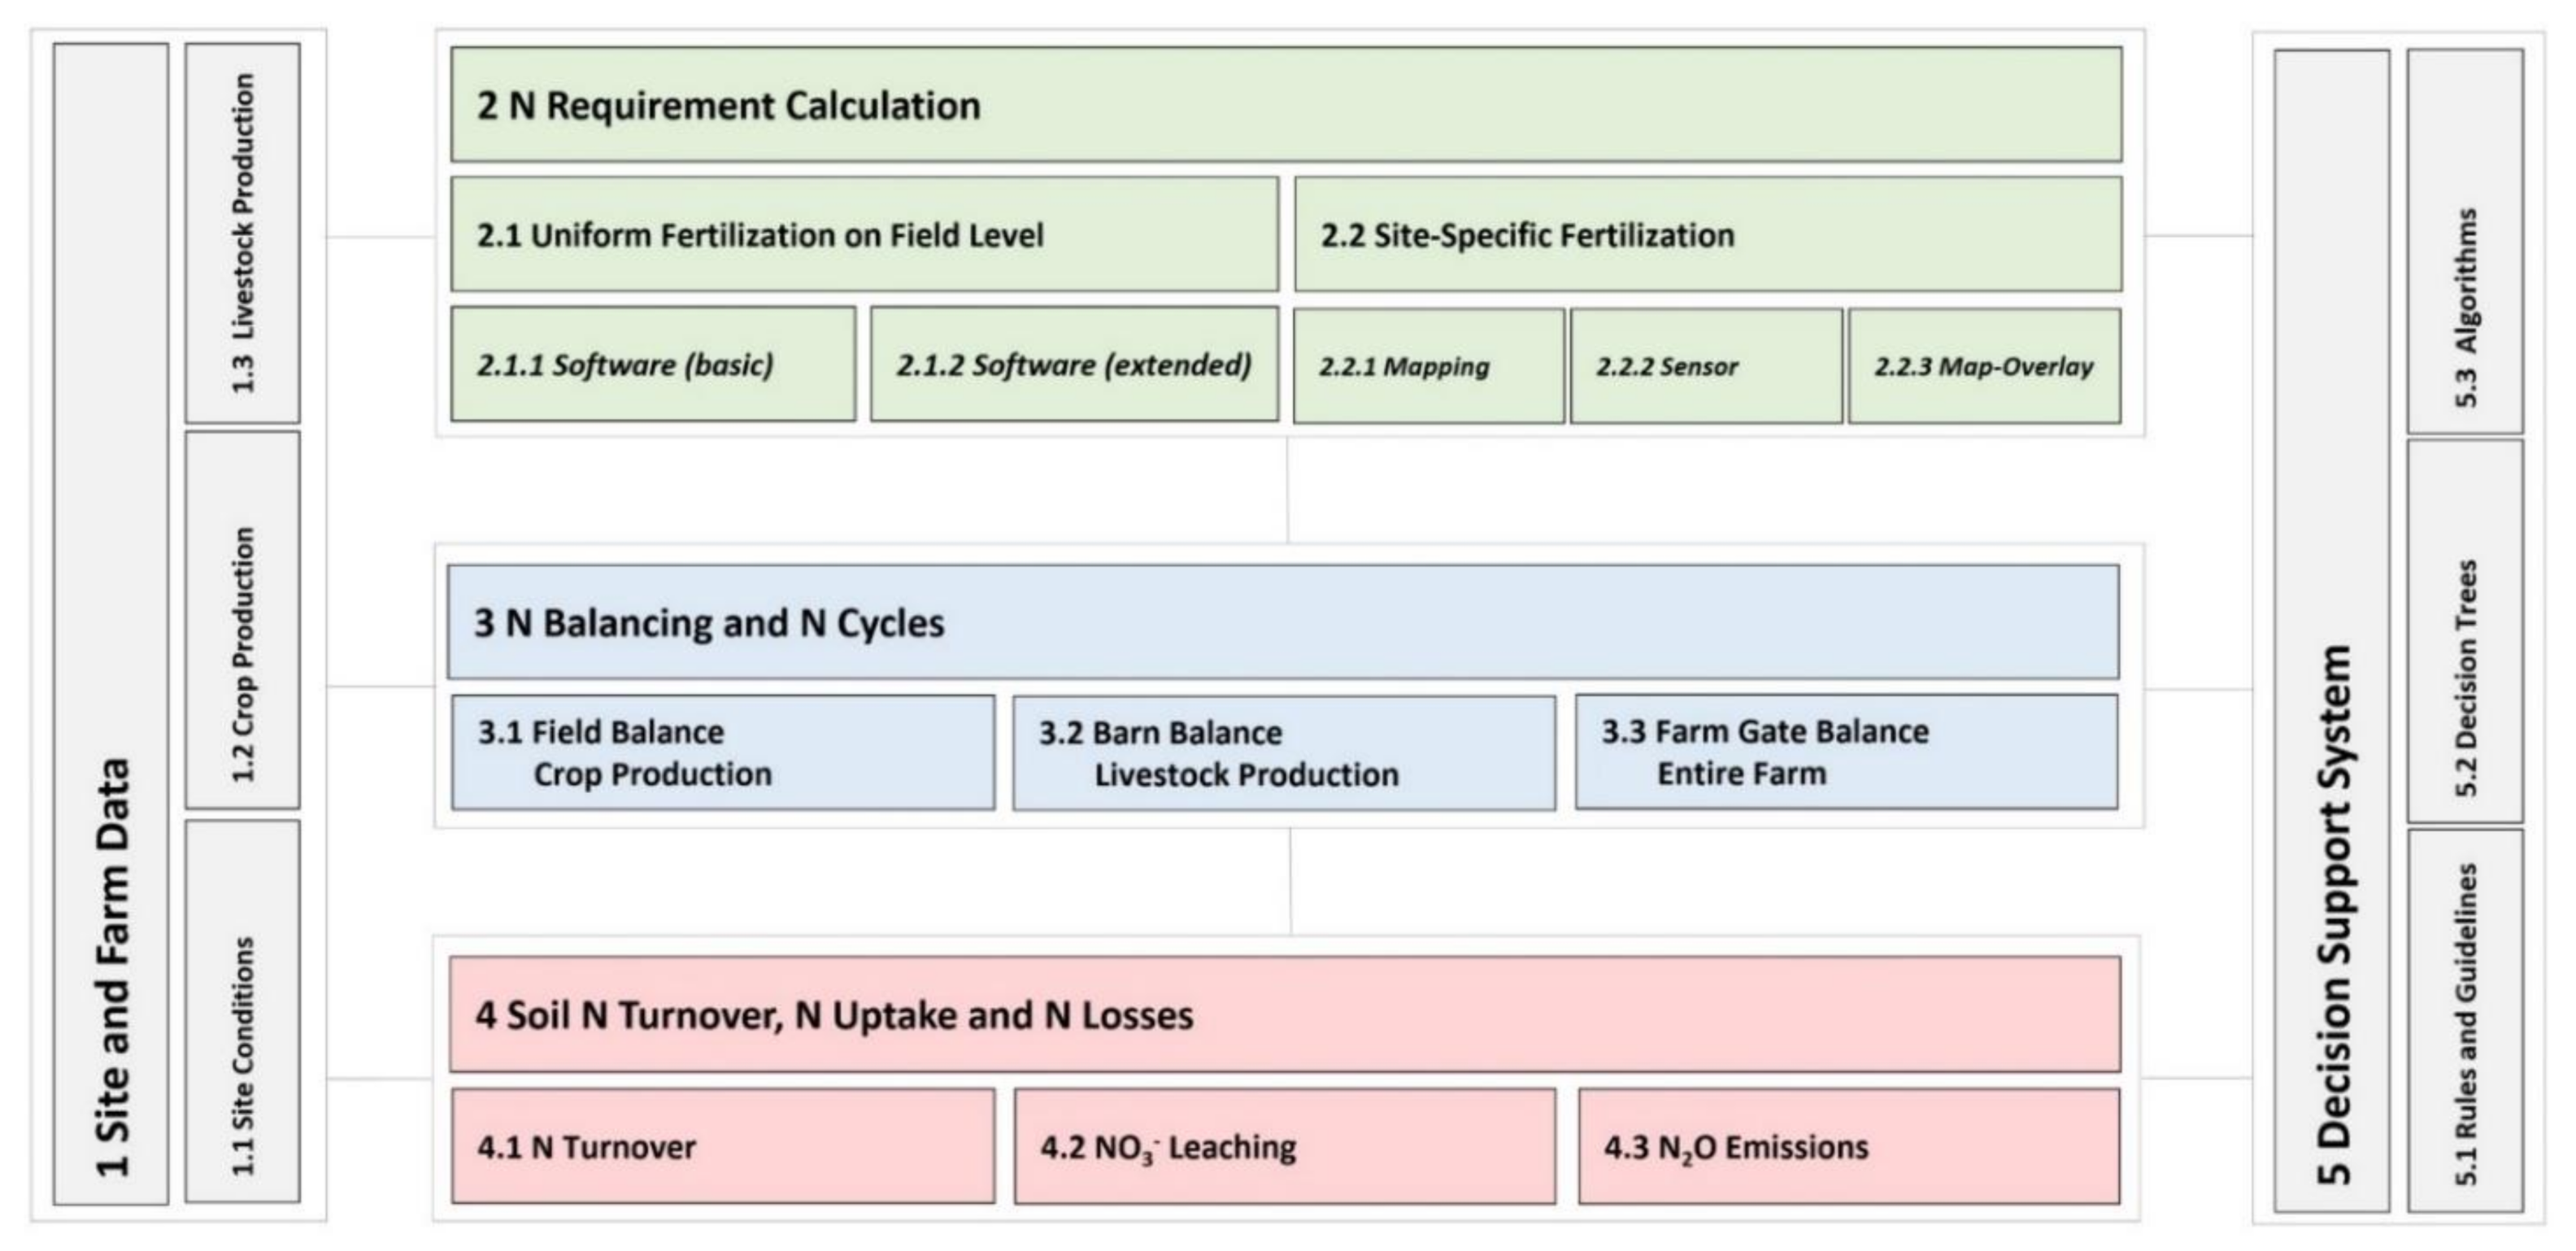
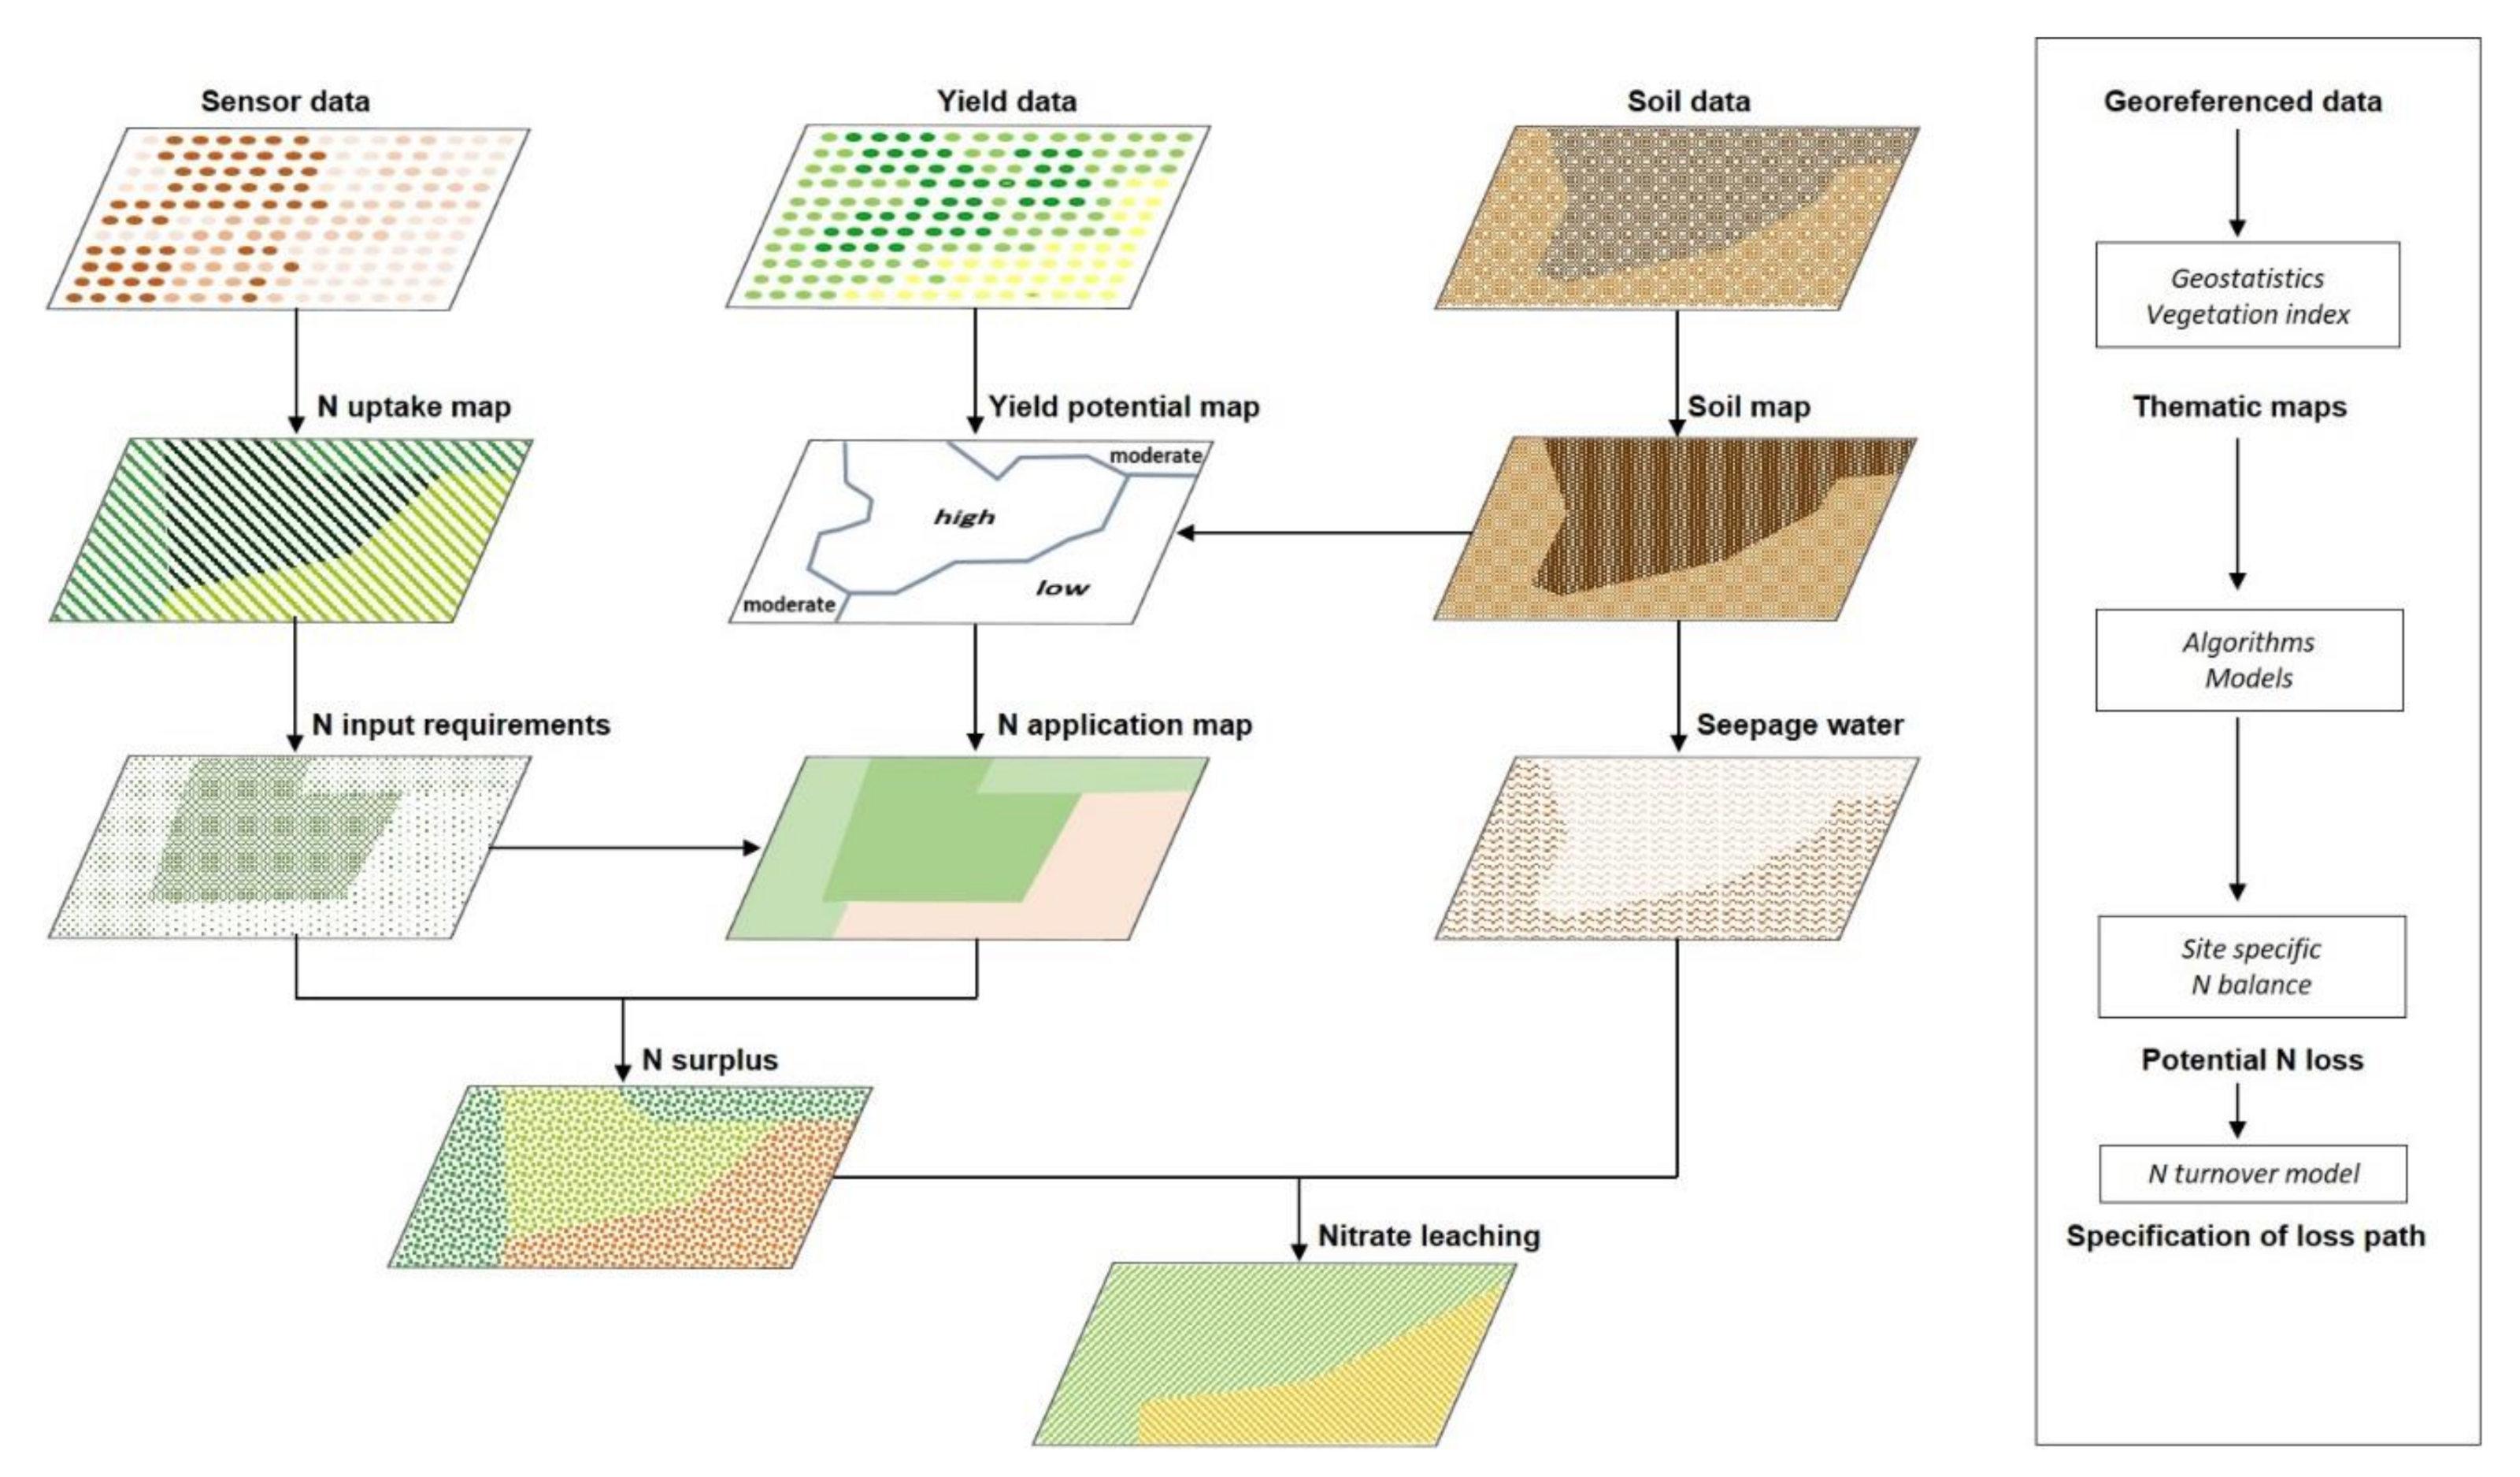
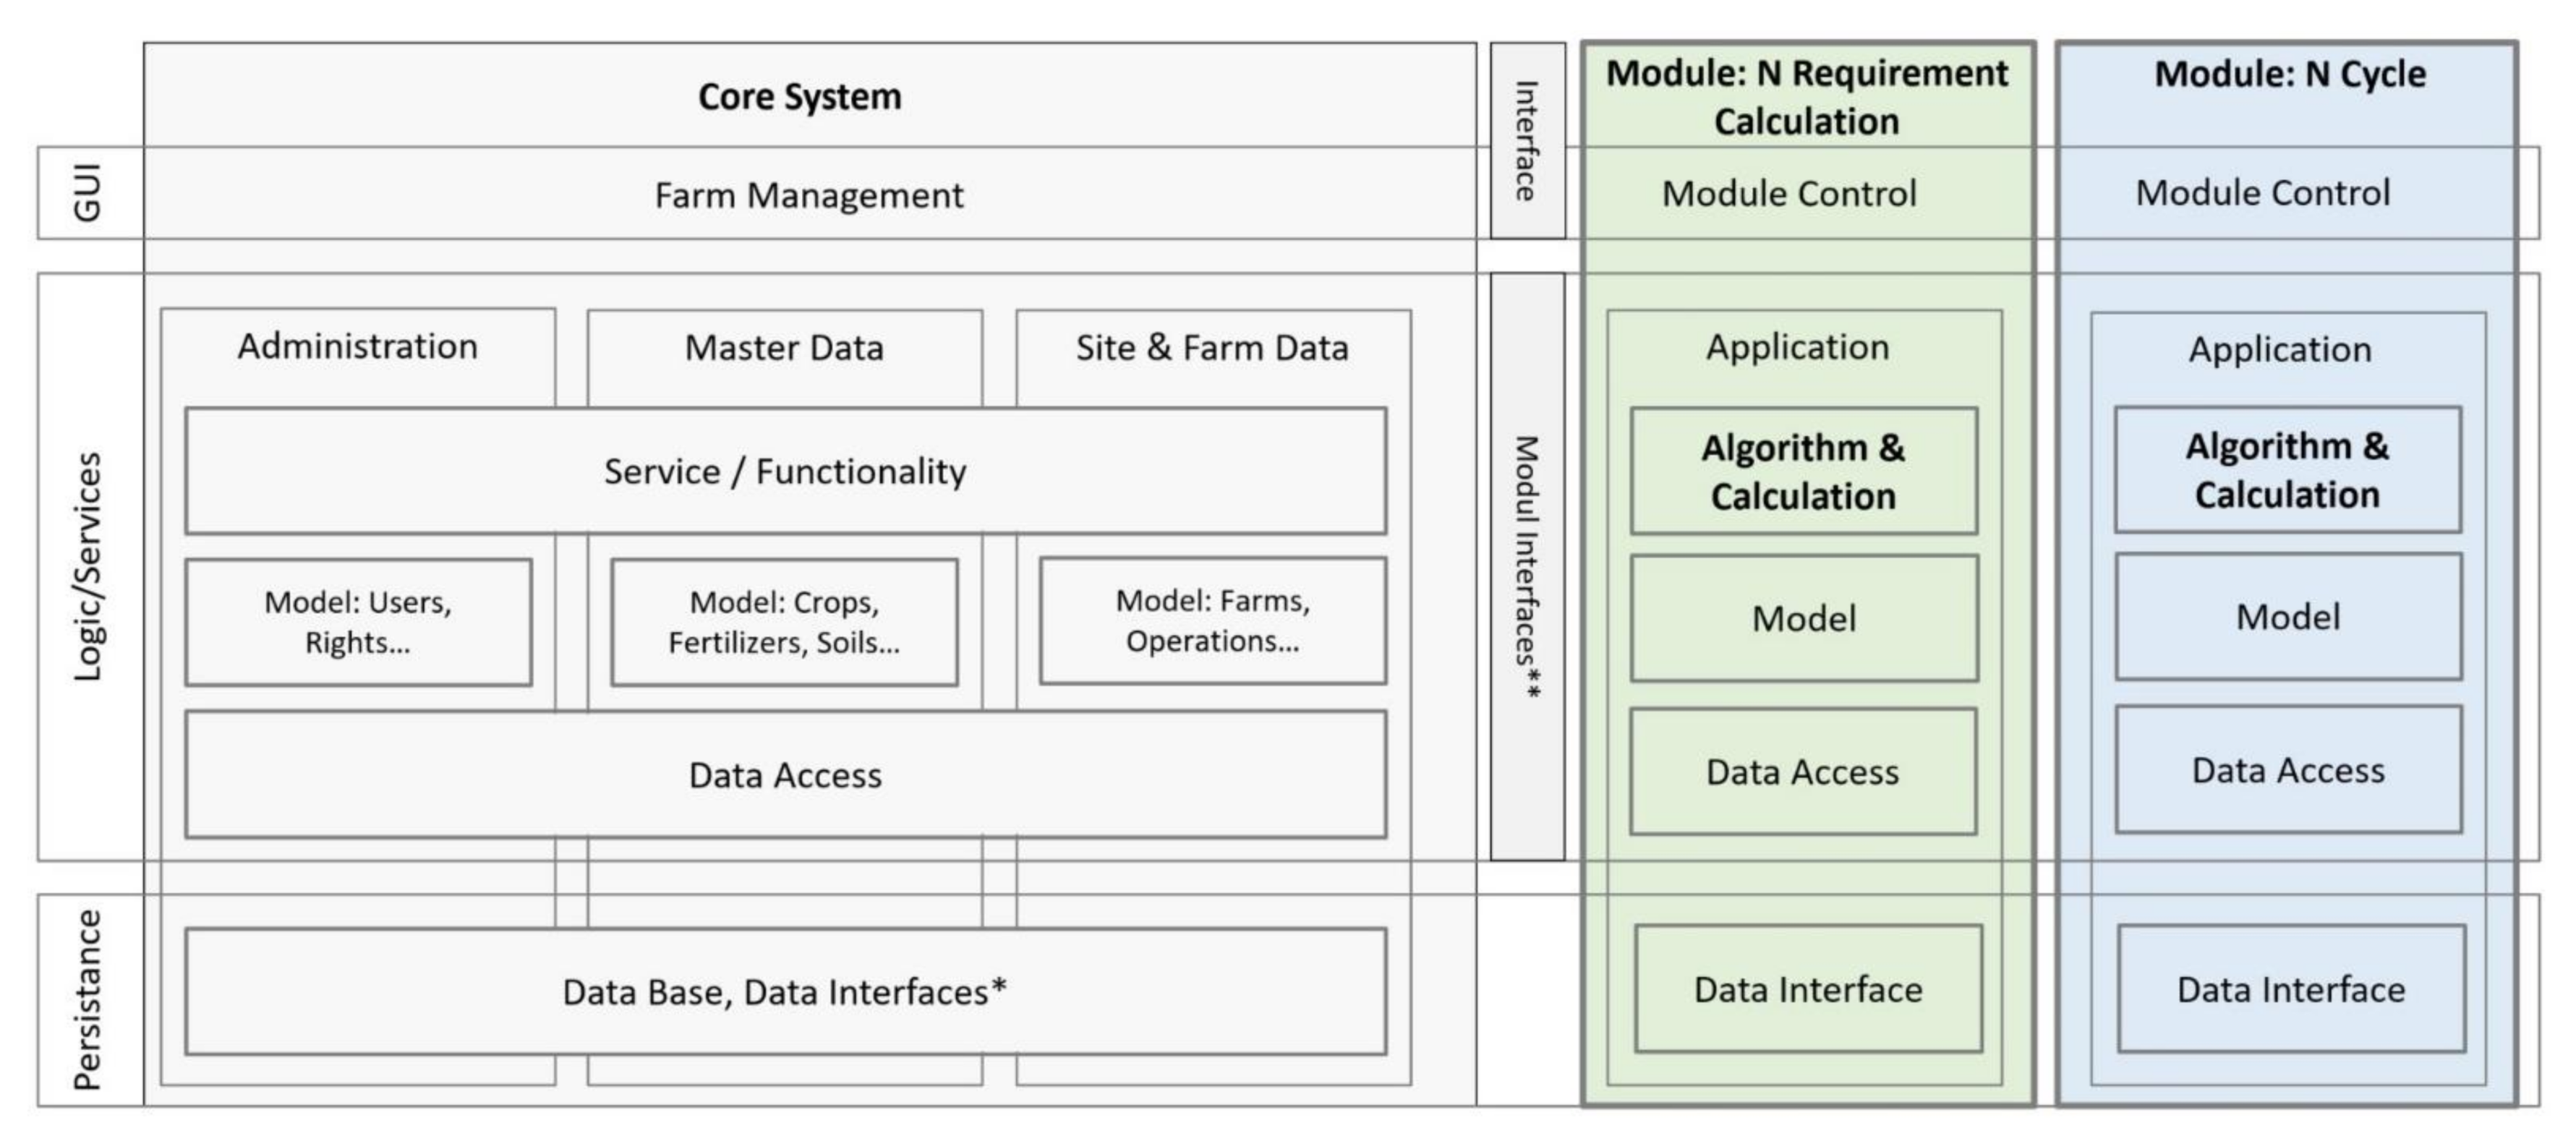
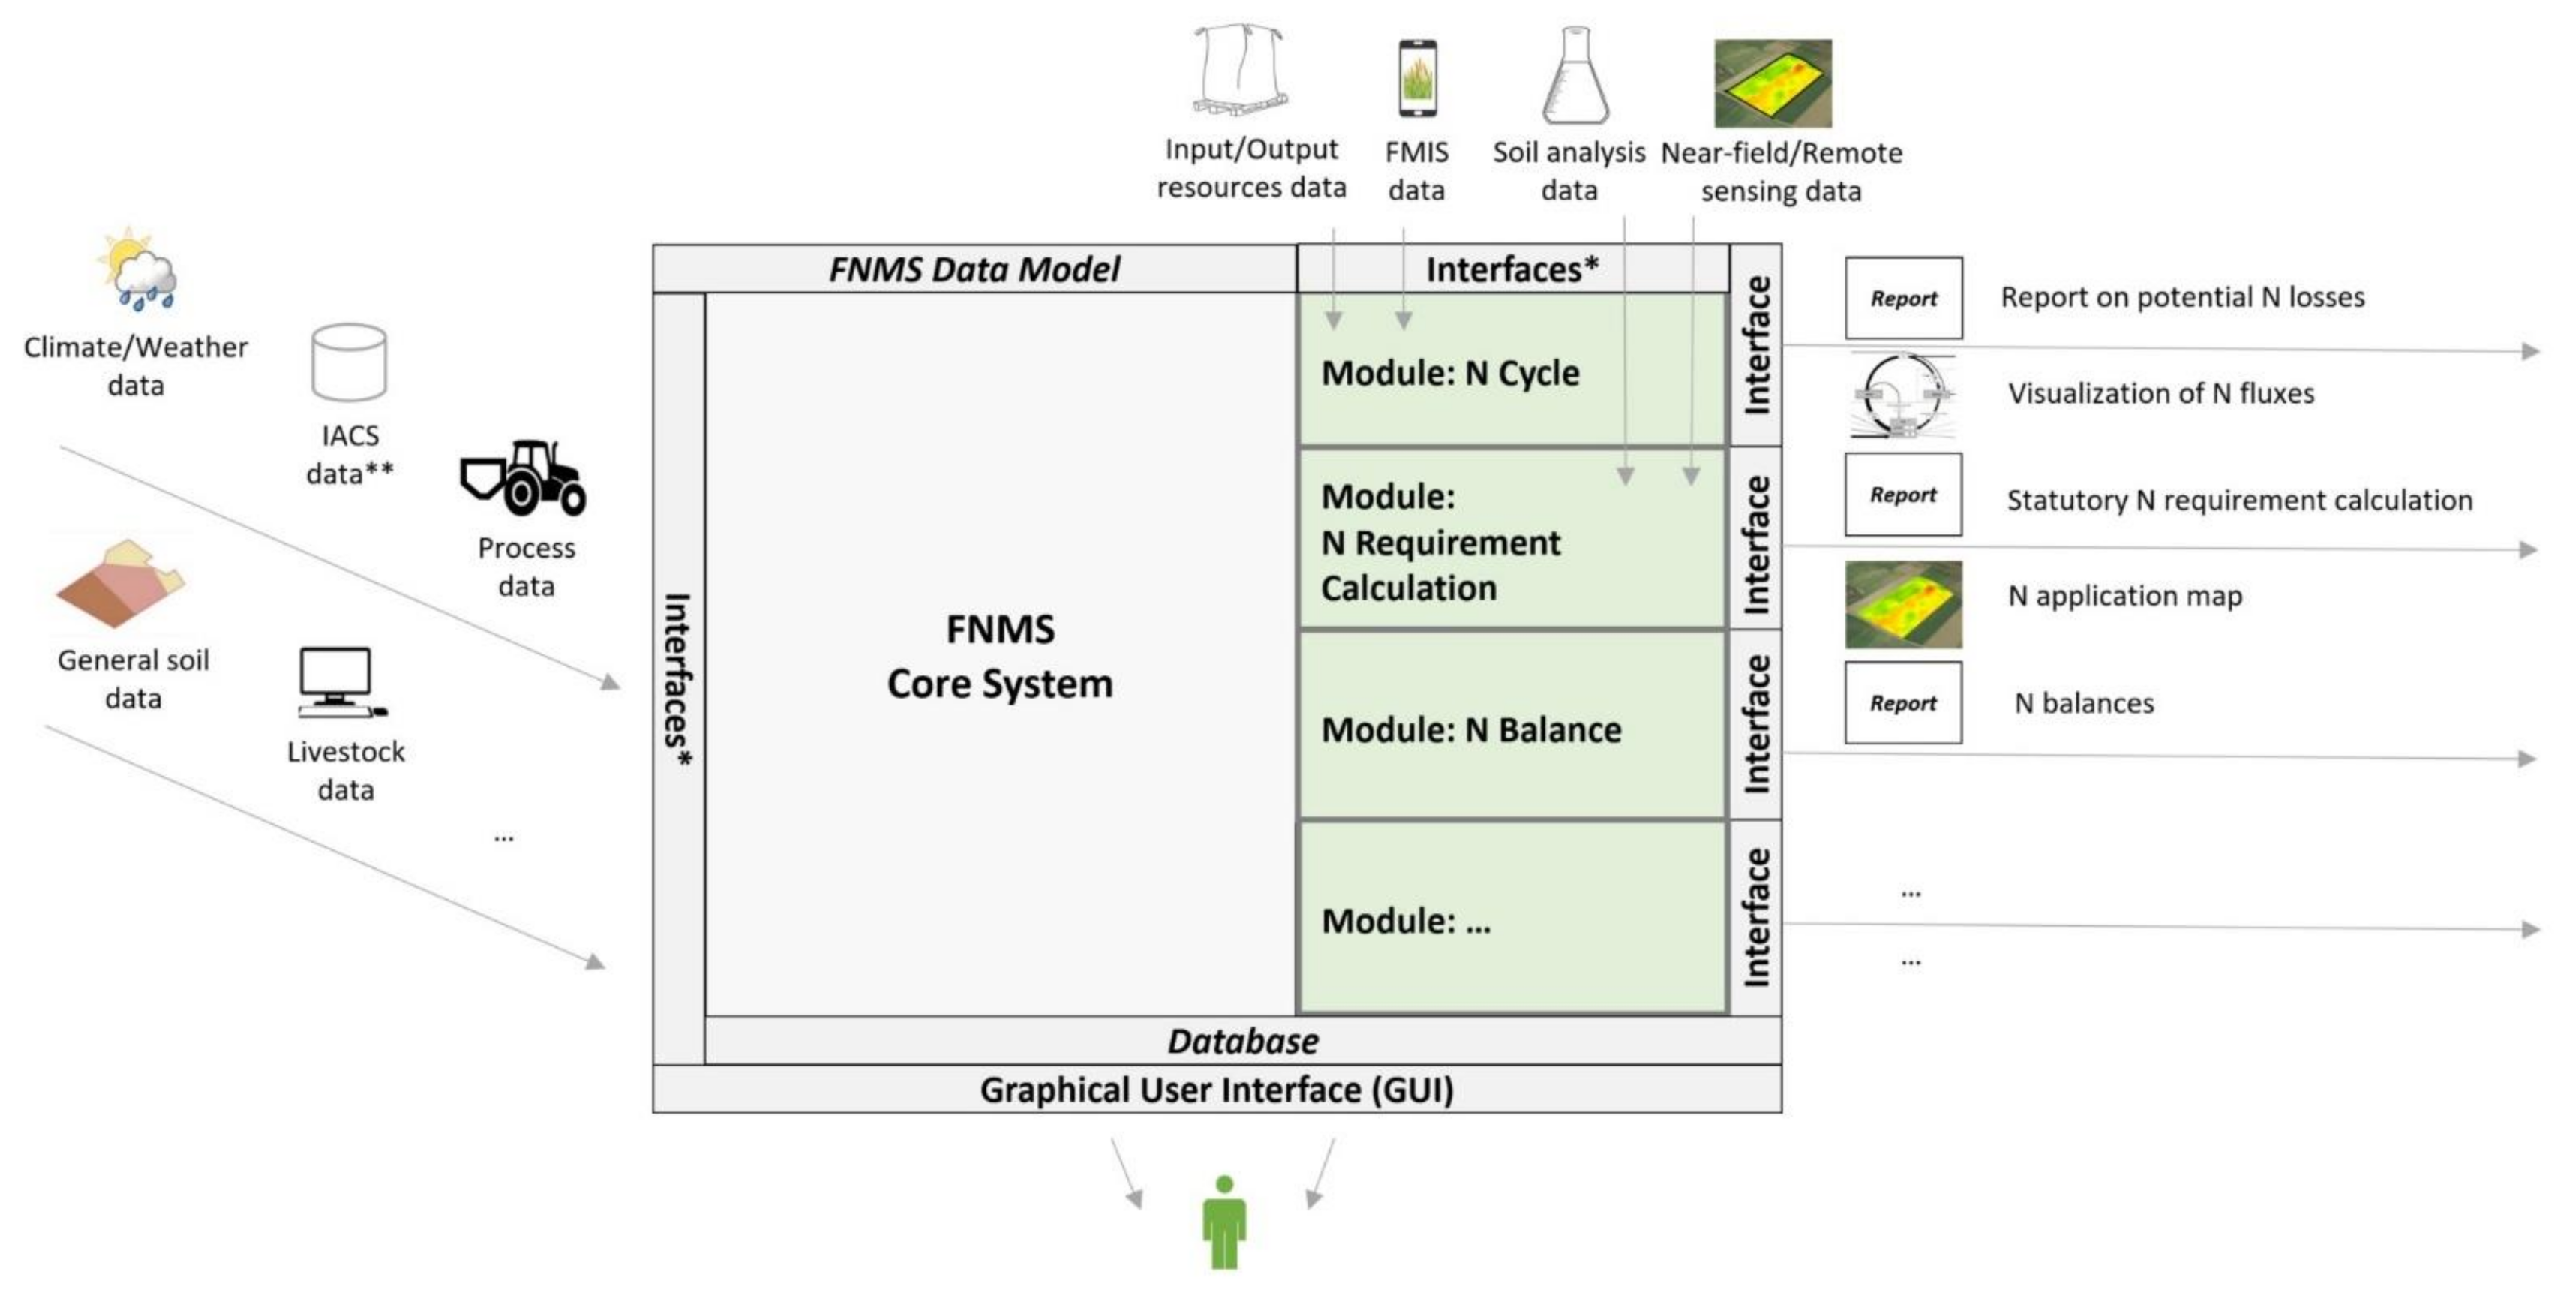
Table 1.
Fertilization systems and methods for the calculation of the crop N requirement of arable and pasture land.
Table 1.
Fertilization systems and methods for the calculation of the crop N requirement of arable and pasture land.
| Fertilization System | Basic Principle to Calculate N Requirement | Data Origin | Benefits 1 (+) | Drawbacks 1 (−) | Examples |
|---|---|---|---|---|---|
| 1. Uniform fertilization on field level | |||||
| 1.1. Basic software | N requirement calculation for field level based on crop type, target quality, and target yield + Correction factors, depending on previous crop and SMN 2 content at the beginning of vegetation period | Reference values, farm or field-related data, measured values or regional averages (pre-crop, fertilization pre-crop, SMN testing 3) | +/(−) Standalone application + Mostly functionality in farm management information systems (FMISs) + Easy to use | − No consideration of soil heterogeneity, crop stand development, SMN content | [48] |
| 1.2. Extended software | Calculation like 1.1 + Additional soil and climate parameters + N nutrition status (N content) of the crop stand | Like 1.1. + N content of the plant biomass (analysis, simulation) 3 + Site factors (altitude, soil humus content, soil-climate area) | + Consideration of crop stand + Dynamic specification of fertilizing strategy | − Additional effort − N content measurement not representative of the entire field − No consideration of the variability in soil parameters | [49,50] |
| 2. Site-specific fertilization | |||||
| 2.1. Mapping system | Generating of fertilizer application maps on the basis of site conditions (e.g., soil texture or yield potential) | Soil maps, soil conductivity measurement, and volume flow measurement harvester (yield map), remote sensing data | + Consideration of the spatial variability in soil and crop parameters + Optimal yield and environmental relief + Time-delayed adjustment during vegetation period + Easy to use | − Yield potential determination partly non-transparent for users − Costs for yield maps − Investment costs (fertilization technology) | [12,51] |
| 2.2. Sensor system | Measurement of the crop biomass or N content of the biomass with sensors in the field, calculation of vegetation indices and N requirement with algorithms | Sensor data, vegetation indices 4, and algorithms 5 | + (Indirect) Consideration of annual effects (e.g., water supply, N mineralization) + Dynamic real-time reaction to crop development at time of fertilizer application | − Investment costs (soft- and hardware) − User qualification − Partly nontransparentcalculations | [52,53,54] |
| 2.3. Map-Overlay system | Combination of mapping (2.1) and sensor systems (2.2) | Digital yield maps, sensor data | + Optimized fertilization + Reducing N losses | − High requirements on system compatibility and − User qualifications | [55,56,57] |
1 Pros and cons regarding practicality, technical implementation, requirements, complexity, functionality, and performance. 2 Soil mineral nitrogen (SMN). 3 Nitrate test [58], N-Tester (measurement of chlorophyll concentration) [59]. 4 Vegetation indices that were derived from satellite data or multispectral sensors are radiometric measures of the spatial and temporal patterns of vegetation photosynthetic activity that are related to biophysical variables such as leaf area index, biomass, or N content [60]. 5 Calculation algorithm that calculates the N requirement in defined development stages of the crop according to the development of the crop based on vegetation indices, yield potential, desired product quality, and other possible influencing factors.
Table 2.
Methods of N balancing.
| System Level | N Inputs | N Outputs | N Turnover, N Pools | N Surplus 6, NUE 7 | Data Origin | Spatial/ Temporal Scale 8 | Scope of Application | Examples |
|---|---|---|---|---|---|---|---|---|
| 1. Crop production system (field balance) | Organic and mineral fertilizer, seeds, N2 fixation 9, (atmospheric N deposition) | Harvest products | Δ SON 10 | N surplus: potential loss of reactive N compounds (NH3, N2O, NO3−) NUE: crop production | Farm management information system (FMIS), farm record keeping | Field, farm/growing season, year | Easy to implement the analysis, Generated results easy to understand, Control function, Differing accuracies and validities of these balance sheets 11 | Legal N balance [48] |
| 2. Livestock production system (barn balance) | Feed (own production, purchase) 12, bedding material, animals (purchase) | Livestock products, manure | Change in livestock numbers 13: feed stock, manure storage | N surplus: N emissions of livestock keeping (NH3) (stable, manure storage) NUE: livestock production | Livestock management system | barn, pasture/ fattening period, year | REPRO [76], Dairy-CropSyst [15] | |
| 3. Farming system (farm-gate balance) | Market purchase | Market products | No consideration | N surplus: potential N loss of reactive N compounds on farm level NUE: farming system | Farm accounting data, purchase and sale documents | Farm, across-farm/year | Analysis of the total N efficiency and N loss potential of the farm | Nutrient flow balance [14], REPRO [76] |
6 N surplus = positive difference of N input − N output; a negative balance would imply a depletion of soil organic N (SON). 7 Nitrogen use efficiency (NUE) = N output/N input. 8 Spatial scale (field, farm, across-farm, and region; [77]); temporal scale (growing season, year, years, and crop rotation). 9 Calculation of N2 fixation or mean crop-specific N2 fixation parameters. 10 Change in the soil-N pool. Soil-N turnover is usually not considered in area-related N balances; in some accounting approaches, turnovers in the soil-N pool (mineralization/immobilization) are considered with the aim of more precisely recording the N loss potential [76,82,84,85]. 11 For example, regarding (1) the use of modeled parameters vs. measured data (e.g., grain-N content), (2) accounting for different N flows (e.g., N emissions, soil-N pool changes, and N mineralization), (3) simple and complex systems (depending on the application), and (4) estimation of N balance elements (N2 fixation). 12 Farm-owned feed stock mostly output in the previous year (i.e., physical nutrient transfer considered in asynchronous balancing). 13 The inventory changes must be recorded for exact balancing since annual feed production and use as well as annual fertilizer accumulation and use usually do not match.
Table 3.
Selection of non-functional requirements for an FNMS.
| Focus | Specification of the Requirements 14 | Impact on FNMS Development |
|---|---|---|
| User group | Support of user groups with different requirements and needs 15: Support simple and complex tasks depending on the abilities and intentions of the users and the objective to be achieved, e.g.,
|
|
| Interoperability | Data management with minimal effort of data originating from different sources:
| Specification and implementation of interfaces to external systems, e.g.,
|
| Scaling | Analysis and evaluation on different spatial and temporal scales:
|
|
| Systemic approach |
|
|
| Transparency |
|
|
| Analysis and decision support |
|
|
| Usability |
|
|
14 The requirements were derived (a) from workshops with stakeholders, (b) from expert surveys, (c) on the basis of experience in developing N balance models [76], and (d) from experience in the long-term use of these models while analyzing and optimizing farms within the scope of the Network of Pilot Farms [96]. 15 The most important user group are farmers and consultants. However, the group of farmers is not homogeneous. There are minimalistic users who only want to meet the legal requirements with little effort, and there are power users (with above-average demands and skills) who place high demands on the performance of an FNMS, e.g., site-specific calculations and sophisticated modeling.
Table 4.
Site-specific and farm data for an FNMS.
| Data | Data Origin | System Level | Acquisition Method |
|---|---|---|---|
| 1. Site conditions | |||
| 1.1. Climate and Weather | WS | R, F | MP, A, M |
| 1.2. Soil | PS, SM, M | Fi, SubFi | MP, LA |
| 2. Crop production | |||
| 2.1. Field and Cropping structure | M, RK | Fi, SubFi | HR |
| 2.2. Production system | PD, M, PS, SM, RK | Fi, SubFi | MP, LA, VI, A, M, HR |
| 3. Livestock production | |||
| 3.1. Husbandry system | SM, RK, PD, SM | F, Fi/GA | MP, LA, HR |
| 3.2. Livestock inventory and performance | RK, SM | F/GA, IA | MP, LA, A, M, HR |
| 3.3. Feeding system | SM, RK | F/GA, IA | MP, LA, A, M, HR |
| 3.4. Manure management | RK, PD, SM, M, PS | F, Fi, SubFi/GA | MP, LA |
| Abbreviations | WS—weather station PS—physical samples SM—sensor measurements M—GIS Maps RK—record keeping software PD—process data | R—regional F—farm Fi—field SubFi—subfield GA—group of animals IA—individual animal | MP—measured physical on-site LA—laboratory analyzes VI—vegetation index A—algorithms M—models HR—human records (qualitative/quantitative data) |
Publisher’s Note: MDPI stays neutral with regard to jurisdictional claims in published maps and institutional affiliations. |
© 2021 by the authors. Licensee MDPI, Basel, Switzerland. This article is an open access article distributed under the terms and conditions of the Creative Commons Attribution (CC BY) license (https://creativecommons.org/licenses/by/4.0/).
Share and Cite
MDPI and ACS Style
Weckesser, F.; Leßke, F.; Luthardt, M.; Hülsbergen, K.-J. Conceptual Design of a Comprehensive Farm Nitrogen Management System. Agronomy 2021, 11, 2501. https://0-doi-org.brum.beds.ac.uk/10.3390/agronomy11122501
AMA Style
Weckesser F, Leßke F, Luthardt M, Hülsbergen K-J. Conceptual Design of a Comprehensive Farm Nitrogen Management System. Agronomy. 2021; 11(12):2501. https://0-doi-org.brum.beds.ac.uk/10.3390/agronomy11122501
Chicago/Turabian StyleWeckesser, Fabian, Frank Leßke, Marco Luthardt, and Kurt-Jürgen Hülsbergen. 2021. "Conceptual Design of a Comprehensive Farm Nitrogen Management System" Agronomy 11, no. 12: 2501. https://0-doi-org.brum.beds.ac.uk/10.3390/agronomy11122501
Note that from the first issue of 2016, this journal uses article numbers instead of page numbers. See further details here.