
Lettuce Production under Mini-PV Modules Arranged in Patterned Designs


1
Mediterranean Research Center for Economy and Sustainable Developement, Engineering Department, CEIA3, University of Almería, 04120 Almería, Spain
2
LEAF—Linking Landscape, Environment, Agriculture and Food—Research Center, Associated Laboratory TERRA, Instituto Superior de Agronomia, Universidade de Lisboa, Tapada da Ajuda, 1349-017 Lisboa, Portugal
*
Author to whom correspondence should be addressed.
Agronomy 2021, 11(12), 2554; https://0-doi-org.brum.beds.ac.uk/10.3390/agronomy11122554
Submission received: 11 October 2021
/
Revised: 12 December 2021
/
Accepted: 14 December 2021
/
Published: 15 December 2021
(This article belongs to the Special Issue Growing Food in Cities: Rooftops, Window Sills, Vertical Farms, Urban Agroecology)
Abstract
:The growing need for clean energy and food production are favoring the use of underused spaces, such as rooftops. This study aims to demonstrate the compatibility of the use of rooftops both for the production of photovoltaic energy and for the production of food, despite the fact that both compete for the same resource, sunlight (rooftop agrivoltaic). In the experiment reported in this study, which was carried out in Almería (Spain) during the spring and summer of 2021, three shade treatments were tested for a lettuce crop, produced by photovoltaic modules with different arrangements: concentrated shade (CS), scattered shade (SS) and full sun (FS). This experiment was repeated in two seasons with high radiation levels and temperature. The results show that in these environmental conditions, the cultivation of plants that demand little sunlight, such as lettuce, is compatible with the shading produced by photovoltaic panels. In addition, it is shown that the same percentage of the area covered with shade (22%), but using mini-PV modules arranged in patterns, improves the productivity (fresh weight, dry matter, number of leaves, maximum length and dry matter of roots) of lettuce cultivation, both in spring and summer.
1. Introduction
Natural resources are under pressure, mainly due to the constant increase in the world population, as well as the demands for food and energy production. Therefore, it is more necessary to implement sustainable practices, such as electricity self-consumption and the self-production of food. Moreover, rural exodus increases urban populations and leads to the abandonment of agricultural and rural areas. It is estimated that, within 30 years, almost two thirds of the world’s population will reside in urban areas and that these will absorb the increase of the entire population [1,2]. Thus, cities will expand at the expense of agricultural land [3], causing the abandonment of productive areas [4]. This transition will require cities to be more sustainable, reuse natural resources, and adapt their infrastructure systems [5,6]. Until now, urban planning focused electricity, water and other infrastructure supplies. However, food production has not caught the attention of planners [7].
For all these reasons, the use of underutilized urban areas, such as the roofs of buildings, for the production of food (rooftop farming) is of interest. In this frame, some studies have concluded that rooftop farming could supply up to 77% of the needs of some cities [8]. Furthermore, it could help conserve the energy of buildings [9] and maintain an aesthetically pleasant environment (green roofing) [10]. Many other benefits have also been cited, such as the decrease inair pollution [11], the management of runoff waters [12], as well as the reduction of the urban heat island effect, carbon sequestration, and the reduction of the noise pollution [13,14,15,16,17,18,19].
On the other hand, the use of solar panels on rooftops for self-consumption is becoming increasingly popular, mainly due to the continuous decrease in the purchase prices of photovoltaic modules and to the increase in their performance [20], making electricity self-consumption competitive against the traditional supply of energy by electricity companies [21].
Southern Europe offers great advantages for combining both technologies, roof farming and electricity self-consumption, with photovoltaic panels on rooftops, mainly due to high solar radiation, which allows a good transformation of sunlight into electricity for each kWp installed [22]. The region also enjoys mild winters, variable springs and autumns, and warm summers [23]; this allows open field cultivation during almost all seasons of the year, although this region is fundamentally dry, especially in summer, which could be an important limitation. However, some researchers have published strategies for the adequate use of water in rooftops, especially in Mediterranean conditions [24].
Agrivoltaic systems, the combined use of photovoltaic panels and agricultural production in the same area unit, has been proposed by some researchers since the last decades of the 20th century [25]. However, further multiple investigations in this area were only developed at the beginning of this century [26,27,28,29,30]. In parallel, a similar line of research has been developed, but applied exclusively to the use of solar panels on the roofs of greenhouses [31,32,33,34,35,36,37,38,39,40,41].
In both lines of research, the results have been mostly similar: the shadow cast by the photovoltaic panels on the crops produces a reduction in incident radiation and a decrease in the commercial harvest [42,43]. This reduction depends on several factors, such as the percentage of the area covered with shade, the outside radiation, the crop used, the arrangement and dimensions of the photovoltaic panels, and the height of placement of the panels [44]. Plant competition for radiation further results in a decrease in production. However, three studies carried out in areas of high solar radiation, such as Almería (Spain) and Agadir (Morocco), led to different results. In these cases, the shading on the crops, produced by the photovoltaic modules, did not decreased the yield of the harvest [32,45] and, in one of them, there was even a slight increase in production when compared to the control [46].
In recent years, a promising, but still underdeveloped, research line has been developed, in which crops and photovoltaic panels share the same space on top of the roofs (rooftop agrivoltaic), and several of the aforementioned synergies are present [47]. However, the break-even point of this food production system is still far from being reached. Therefore, a more appropriate focus seems to be the self-consumption of both food and energy produced. In fact, in general, most rooftop farming projects do not have a commercial purpose [48].
In this sense, this study intends to assess the feasibility of using the same space on rooftops, simultaneously, by photovoltaic modules and by lettuce crops (rooftop agrivoltaic), and whether this approach offers synergies or mutual benefits. The compatibility between the simultaneous rooftop uses is evaluated by comparing biomass production values, fresh weight, humidity, number of leaves, and the maximum length of leaves under specific conditions, created by different shades of photovoltaic panels.
2. Materials and Methods
2.1. Experimental Design
A factorial experiment with two factors and three replications with random arrangement was designed. The first factor is the growing cycle, which features two treatments: Su (summer) and Sp (spring). The second factor is the type of photovoltaic shade, which features three treatments: CS (Concentrated Shadow), SS (Scattered Shadow), and FS (Full Sun). FS is the standard light regime in Almería, so in this experimental design it acted as a control.
2.2. Experimental Site Location
To carry out the experiment, a rooftop totally free of shade was chosen. It was located in the vicinity of the Higher School of Engineering of the University of Almería (Spain), with the coordinates 36°51′12.5″ N, 2°18′41.8″ W; (36.853466, −2.311604), 62 m above sea level. The rooftop was raised 3.5 m above ground level and featured a surface area of 100 m2. It was designed as a non-walkable roof with a maximum load-bearing capacity of 400 kg m−2. Average temperatures in this location varied around 23 °C in the studied period, the maximum being around 27 °C, with an absolute maximum of 34 °, and the minimum around 19 °C, and an absolute minimum of 11 °C. The average temperature rose during the study period from 16 °C to 25 °C. Rain was very scarce: only 42 mm fell during the whole period, concentrating in May and the beginning of June. Regarding the wind, the average was around 16 km/h, reaching maximum values of 37 km/h, with a predominant southwesterly direction.
2.3. Experimental Setup
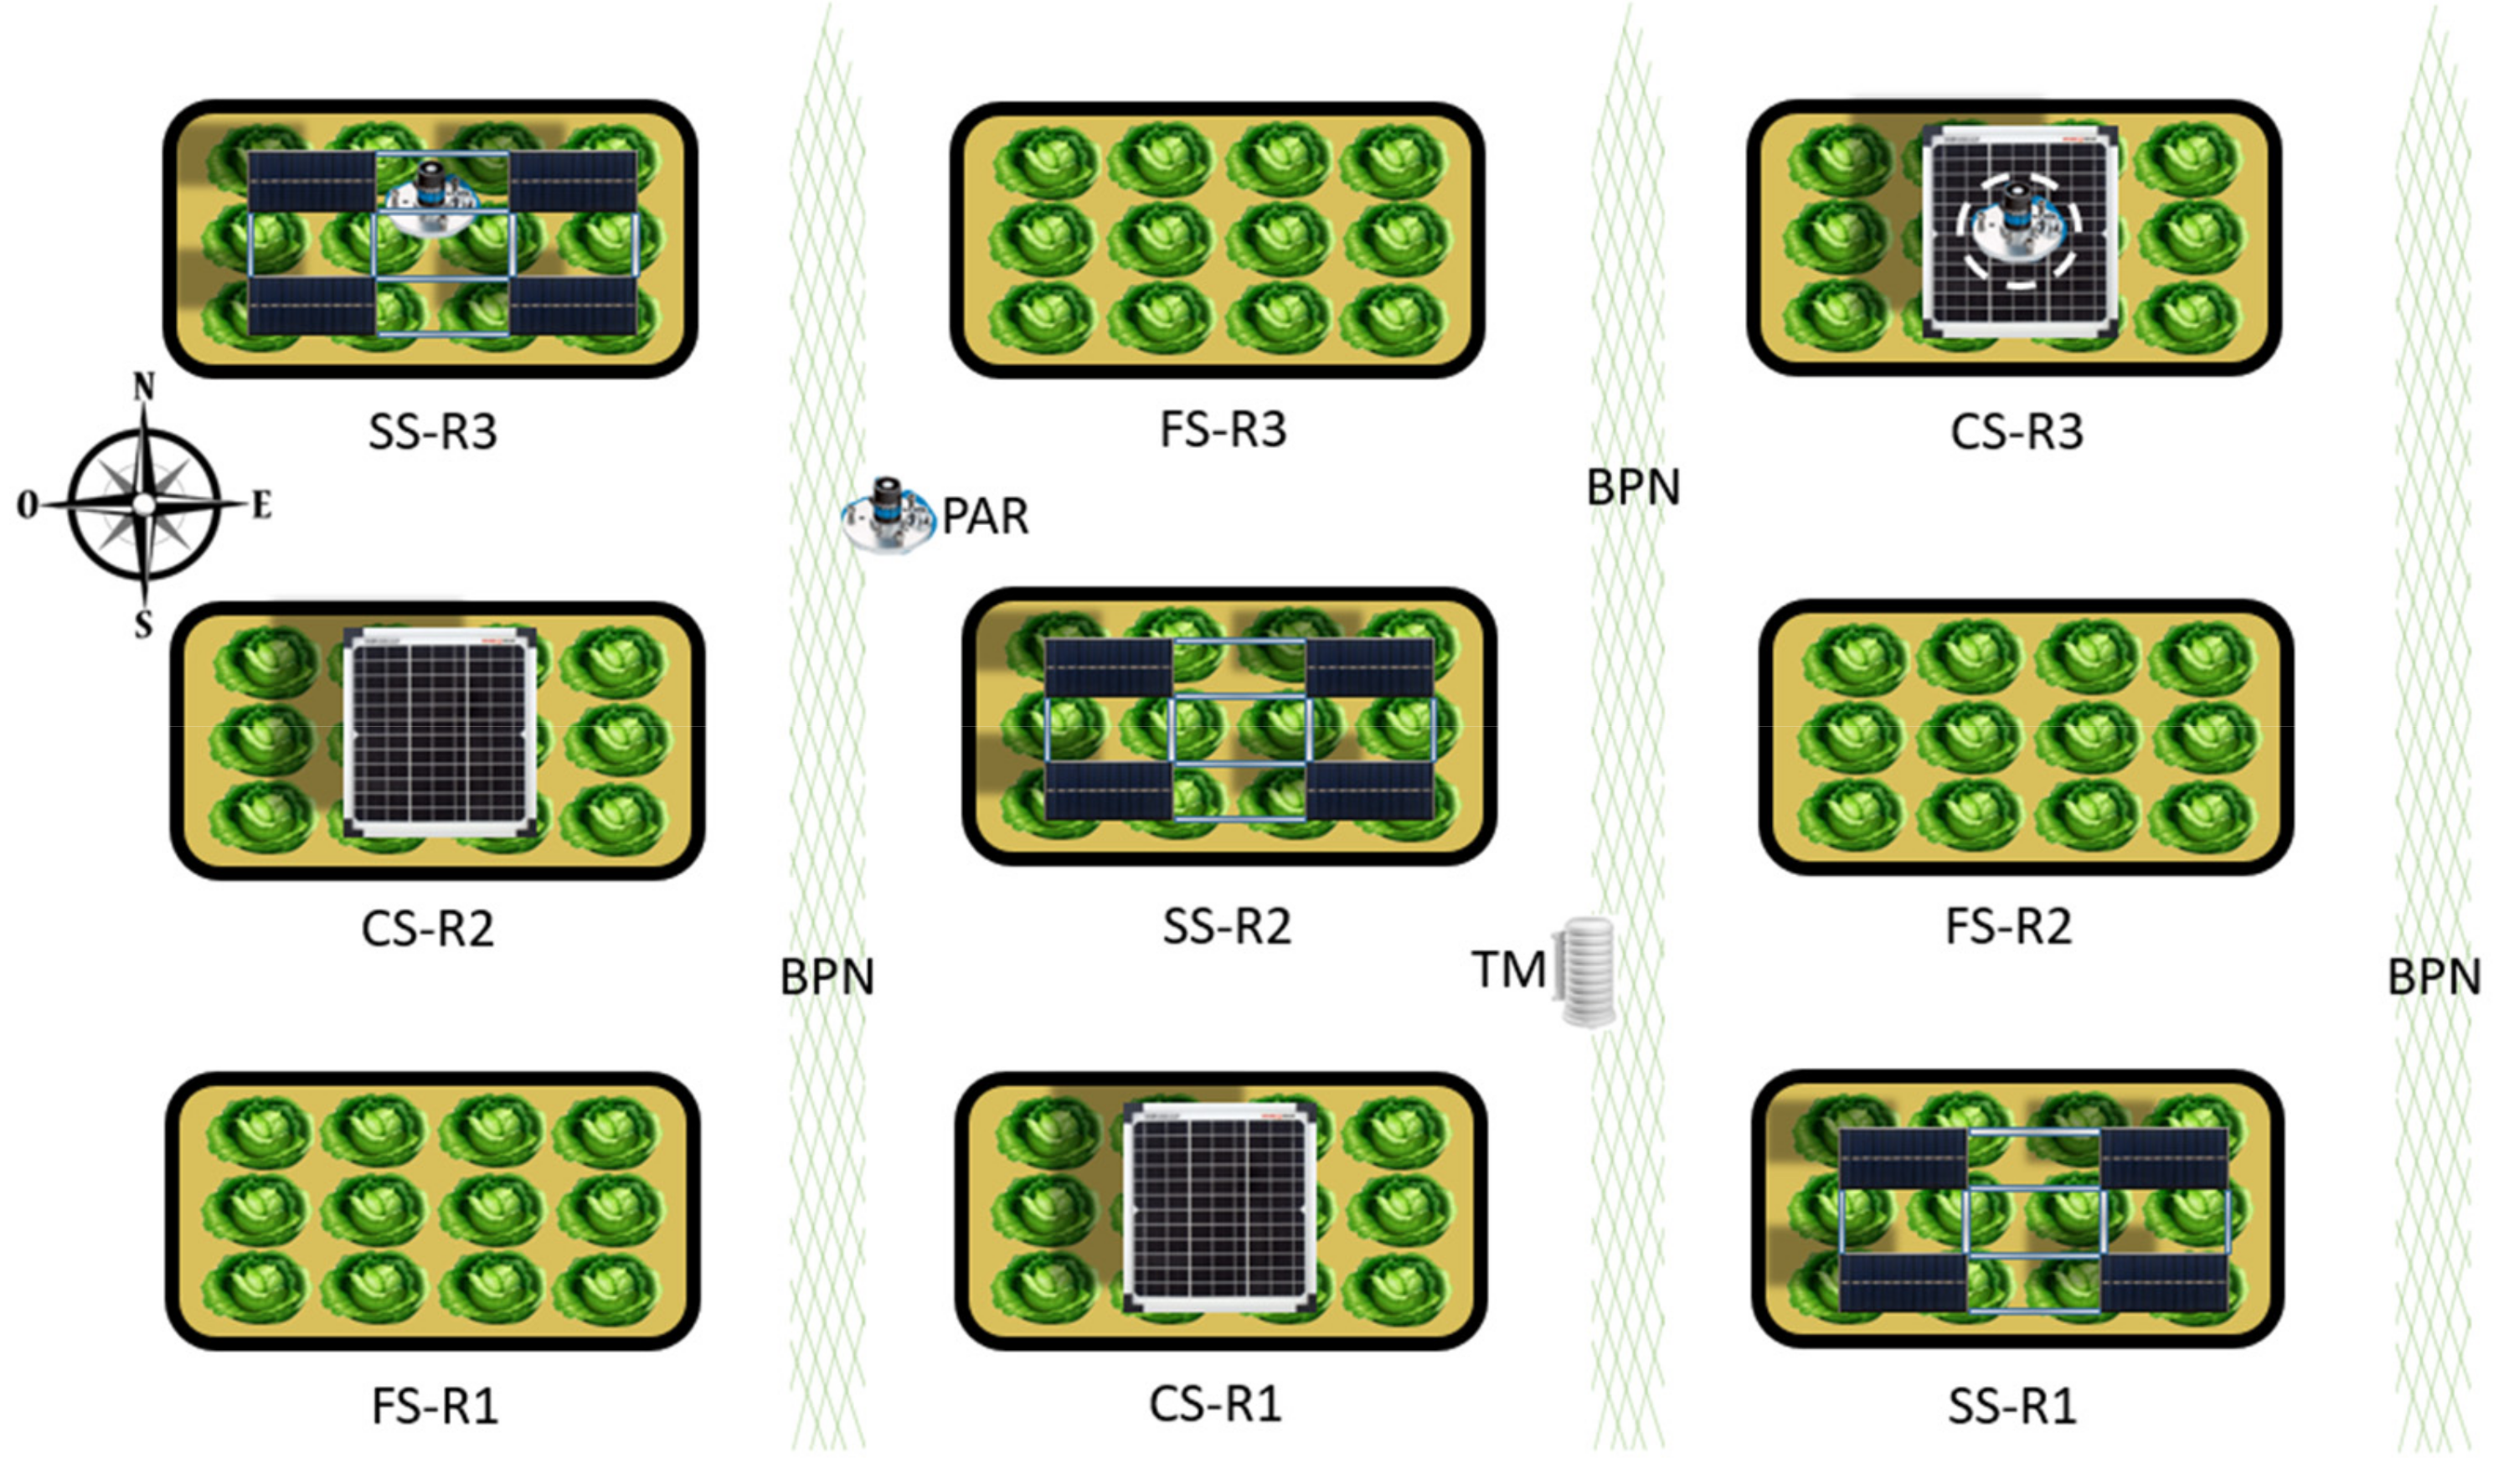
Nine cultivation containers arranged in three rows and three columns were placed on the rooftop, all of them oriented southwards, with a separation of 1.2 m between rows and 0.85 m between columns (Figure 1 and Figure 2). The containers were 81 cm long × 48 cm wide and 20 cm high. All the containers featured a drainage system to eliminate excess water in case of rain.
The cultivation substrate used was a mixture of organic materials (blond peat, black peat, coconut fiber, vegetable compost and perlite) that were subjected to a composting process, with high porosity that allows the aeration of the roots and moisture retention. The technical characteristics of the commercial product used were as follows. Apparent density: 0.54 g cm−3, granulometry: 0/20 mm, humidity: 35–40%, porosity: 80–90%, pH: 5.5–6.5, electrical conductivity: 1640 μs cm−1, and total organic matter: 80–85%. Each container received a substrate layer of 200 mm.
The photovoltaic installation envisaged in the experimental design allowed the comparison of three shading treatments, corresponding to two arrangements of solar panels and one without panels, with full exposure to the sun (FS), which served as a control. The concentrated shade treatment (CS) corresponds to the most commonly used treatment in photovoltaic installations for domestic self-consumption. In this treatment, a photovoltaic panel with dimensions 270 mm × 304 mm was placed at a minimum height of 20 cm above the cultivation surface, facing south with an inclination of 36°. The panel was arranged so that the shadow generated at solar noon (12:00 GMT) was projected in the center of the cultivation area of each container, covering 22% of the total area of the container (21.52% corresponding to the photovoltaic panel itself and 0.4% corresponding to the supports) with shade. The scattered shade treatment (SS) was obtained by arranging four mini-photovoltaic modules 213 mm × 92 mm each, in a design forming patterns (Figure 1), with a separation between rows and columns of 120 mm. They were also located at a height of 20 cm, facing south and with an inclination of 36°, with the average percentage of the crop shading being 22%, 18.4% for the four photovoltaic panels, and 3.7% for the supports. The third treatment, full sun (FS), served as the control, with 100% of the incident radiation.
A protection system against birds was built, consisting of a translucent green PVC mesh, with mesh grid dimensions of 18 mm × 18 mm, which could be fixed on one side of the containers and was able, if necessary, to be spread out on top of photovoltaic panels and growing containers. Every day, the leaves were inspected to see if they were being attacked by birds, so that, in case of significant damage, the protective mesh could be extended. During the two growing cycles, spring and summer, it was not necessary to use the protective mesh on any day. Finally, a verification of the resistance capacity of the rooftop was carried out by calculating the weight of all the containers saturated with water, to which the weight of the photovoltaic panels, plus the weight of a worker, was added, and divided by the surface used for the cultivation system, resulting in a load of 60 kg m−2, a value that is within a safe use range.
2.4. Crop Management
The lettuce plants (Lactuca sativa L. cv. “Baby”), (n = 216) were transplanted from the nursery with 4–5 true leaves, 12 plants for each container with a planting distance of 21.5 × 16.0 cm, resulting in 4 rows and 3 columns for each culture container. The experiment was repeated in two different seasons, spring (108 plants) and summer (108 plants), the planting dates being 2nd May and 16th June 2021, respectively.
The cultural practices were the same for all the treatments, consisting of eliminating weeds, checking the deterioration of the leaves by bird bites to extend or not the protection mesh, fertilization and irrigation. The supply of irrigation was carried out daily until the saturation of the cultivation substrate and surplus drainage were achieved. The nutrient solution was adjusted to achieve the following composition (mmol L−1): 10.50 NO3−, 3.30 NH4−, 1.0 H2PO4−, 1.0 SO4−, 4.0 K+, 2.0 Ca2+, 1.0 Mg2+, plus micronutrients, adjusting pH between 5.5 and 6.5, and the electrical conductivity (EC) to 1.33 dS m−1.
The harvesting was performed 45 days after plantation, 15 June for the spring cycle and 31 July for the summer cycle.
2.5. Measurements
At the time of the harvest, all the plants were measured, obtaining the maximum length (cm) of each plant, without roots. The control of the fresh weight (g) was carried out for each replica of the treatments CS, SS, and FS, at the end of each crop cycle, immediately after harvesting. For the measurements, a Star LS-DS-4000 digital scale (Star, Fujian, China) with a resolution of 1 g was used. All the harvested lettuces were considered.
In the laboratory, the number of leaves (n) of each plant was counted, discarding leaves shorter than 3 cm. Subsequently, the dry matter was obtained by drying the samples in an INDELAB IDL laboratory oven, A-180 (Inde-lab, Lima, Peru) at 70 °C, for 48 h, for subsequent weighing on a digital scale, obtaining the humidity by difference and the dry matter by direct weighing.
The roots of all the plants were also collected and taken to the laboratory for washing, and were subsequently dried with absorbent paper, weighed fresh and later dehydrated in a laboratory oven using the procedure described above.
Photosynthetically active radiation (PAR, 400–700 nm) was determined by three sensors of the LI-190R quantum sensor type (LI-COR Corporate Offices-US, Lincoln, Nebraska USA) capable of measuring the incident photosynthetic photon flux density PPFD (µmol of photons m−2 s−1), with a typical sensitivity of 5 μA per 1000 μmol s−1m−2 and an absolute calibration of ±5% by the National Institute of Standards and Technology (NIST). One of the sensors was installed in an area without shade at a height of 35 cm above the ground, and the other two were placed under the photovoltaic panels of the CS and SS treatments, as shown in Figure 1. The height of the sensors was modified every 4 days to match the growth of the plants, so that the sensors were always at the same height as the surrounding plants and did not cast shadows. The air temperature was measured using a digital probe thermometer with a data logger, model SBS-DL-125E (Steinmberg Systems, Hamburg, Germany), with an accuracy of 0.3 °C and an error of ±0.3 °C. This sensor was placed at a height of 0.5 m, protected from direct radiation, located in the position indicated in Figure 1. Solar radiation was available for the experimental period from a nearby meteorological station in Viator (Almeria, Spain. Coordinates 36.810351000000004, −2.37924428).
2.6. Statistical Analysis
An analysis of variance (ANOVA) was performed following the additive linear model. The significance level considered in the statistical analysis was 5% (α = 0.05) and the LSD (Least significant difference) test was applied to discriminate between treatment results. In addition, the hypotheses of normality and of equality of variances were verified [49]. To this end, the software Statgraphics Centurion XVII-X64 was used.
3. Results
3.1. Environmental Variables
The environmental variables measured at the site were: PAR radiation, in three different positions, and temperature, as described in Section 2.5, and they were complemented by solar radiation data from a nearby station (vd. 2.5).
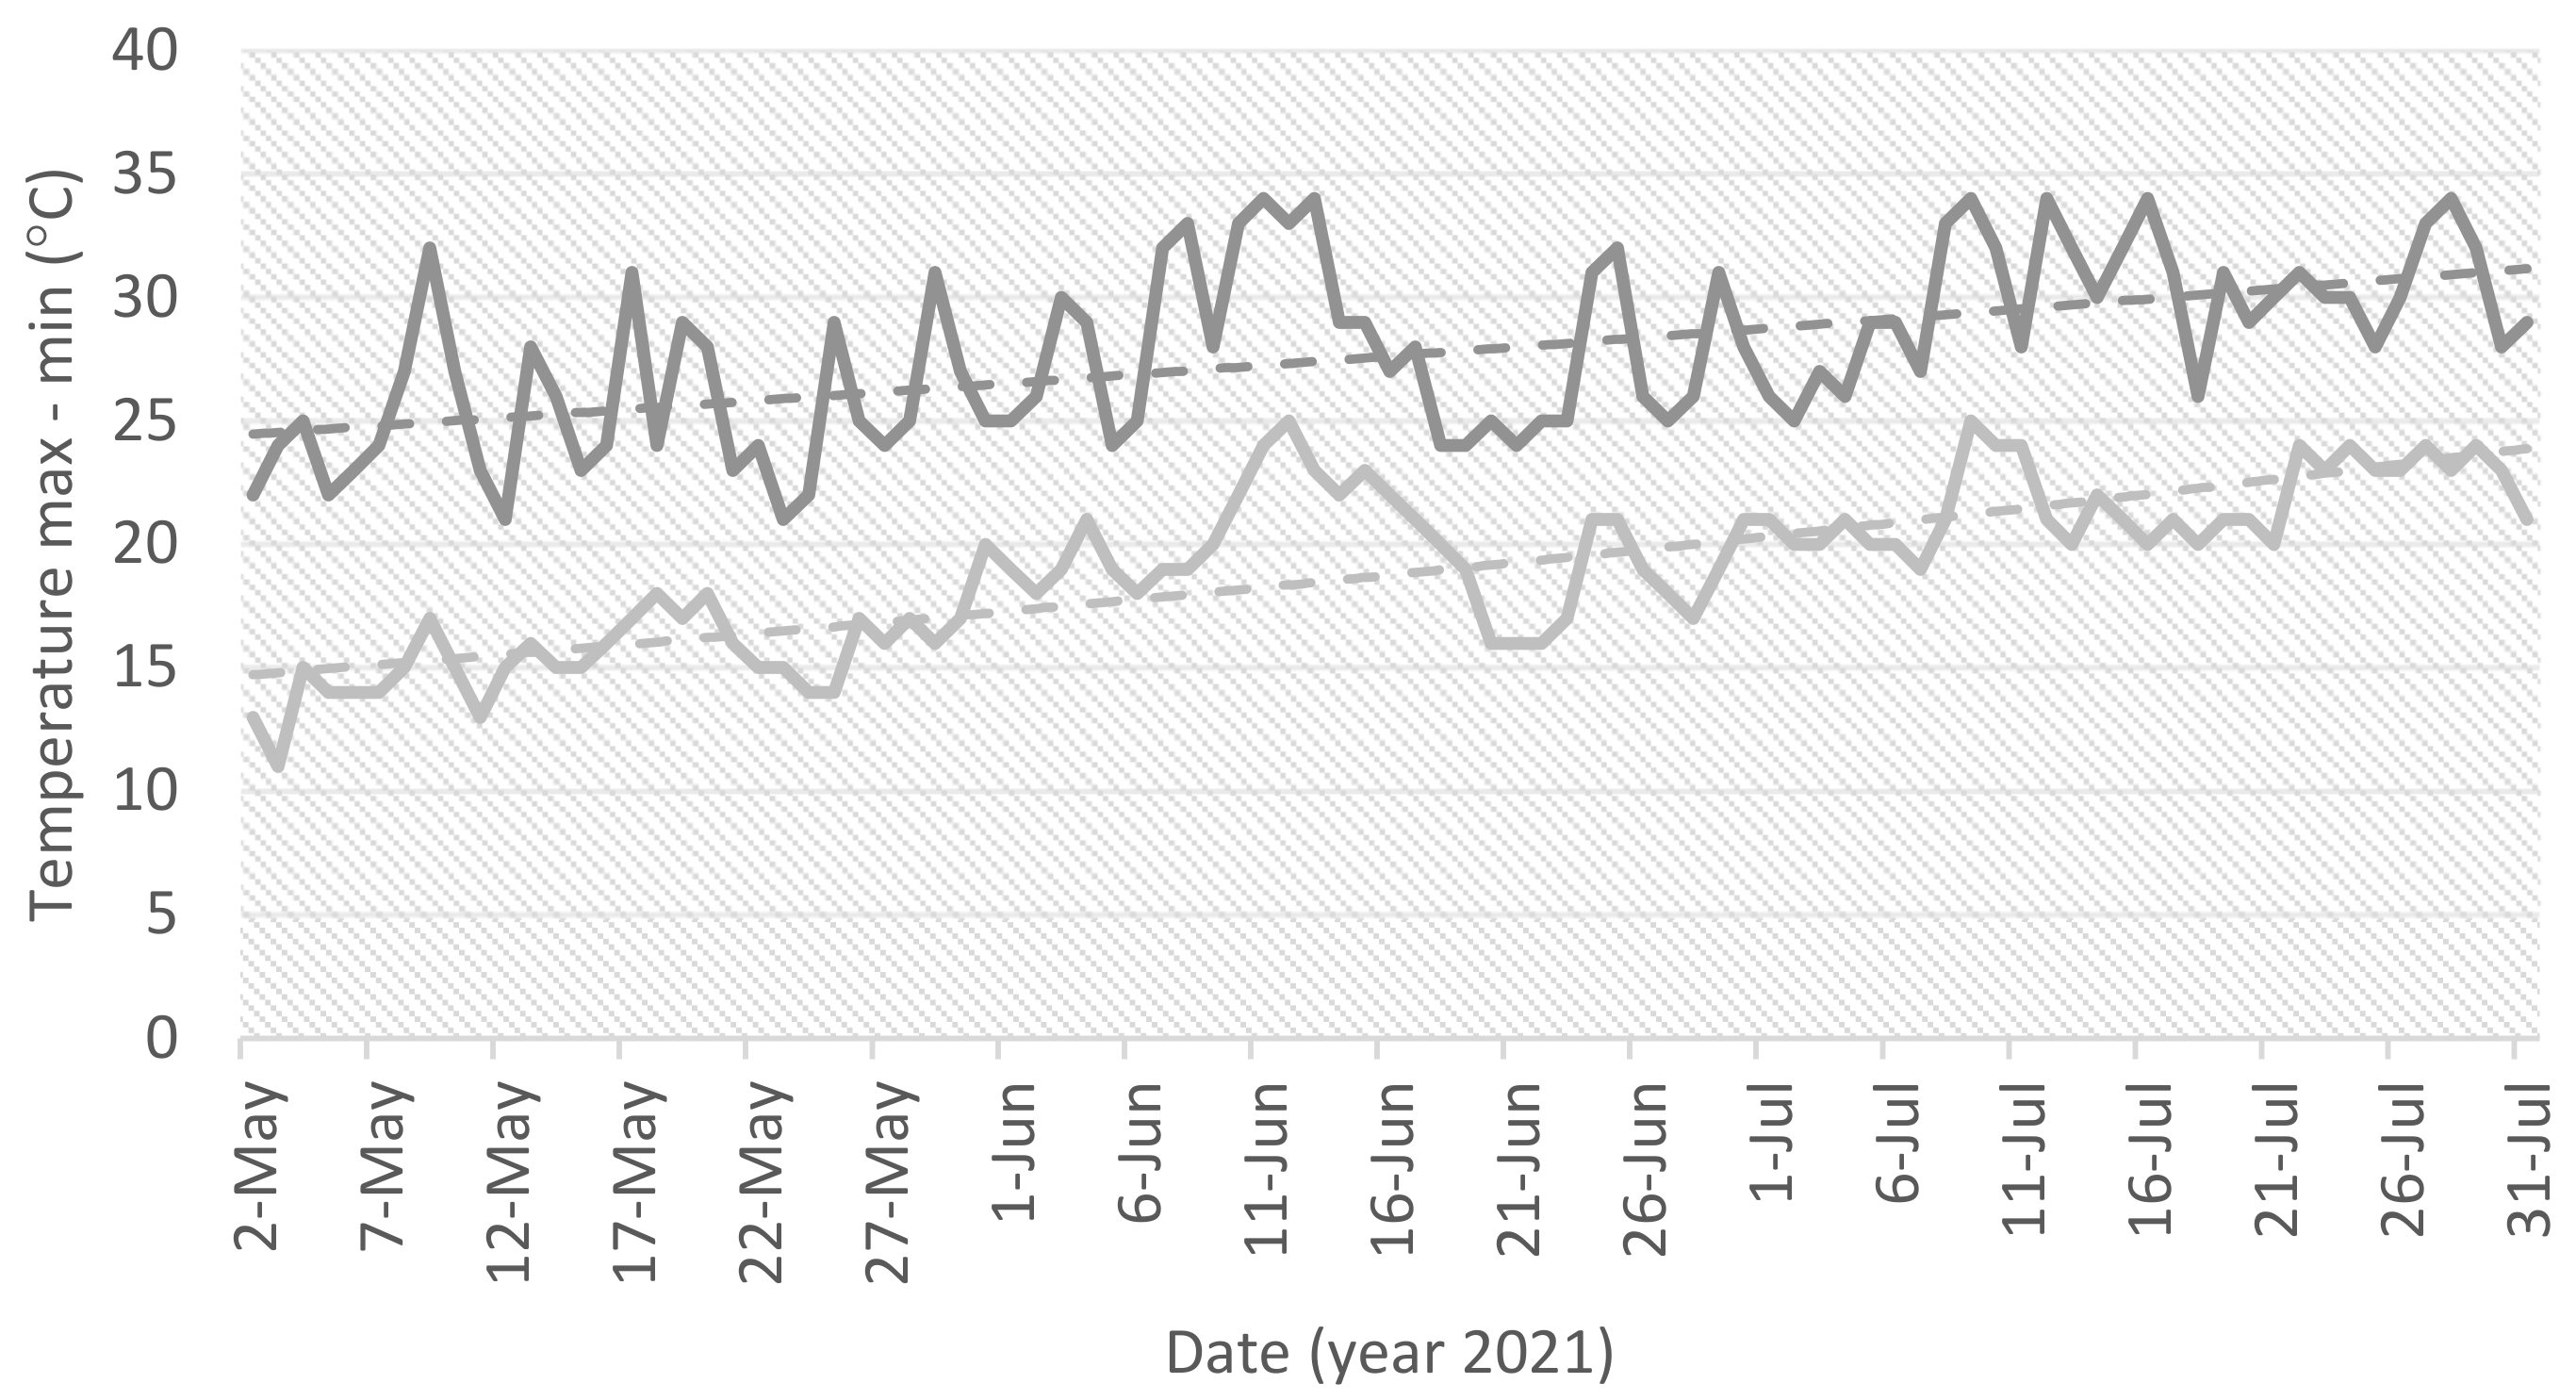
The minimum and maximum temperature values followed an increasing trend during the whole study period, peaking around 35 °C and reaching the lower values around 11 °C. The daily amplitude of air temperature tended to decrease during summer, being approximately 10 °C in the beginning of May and 7 °C in the end of July (Figure 3).
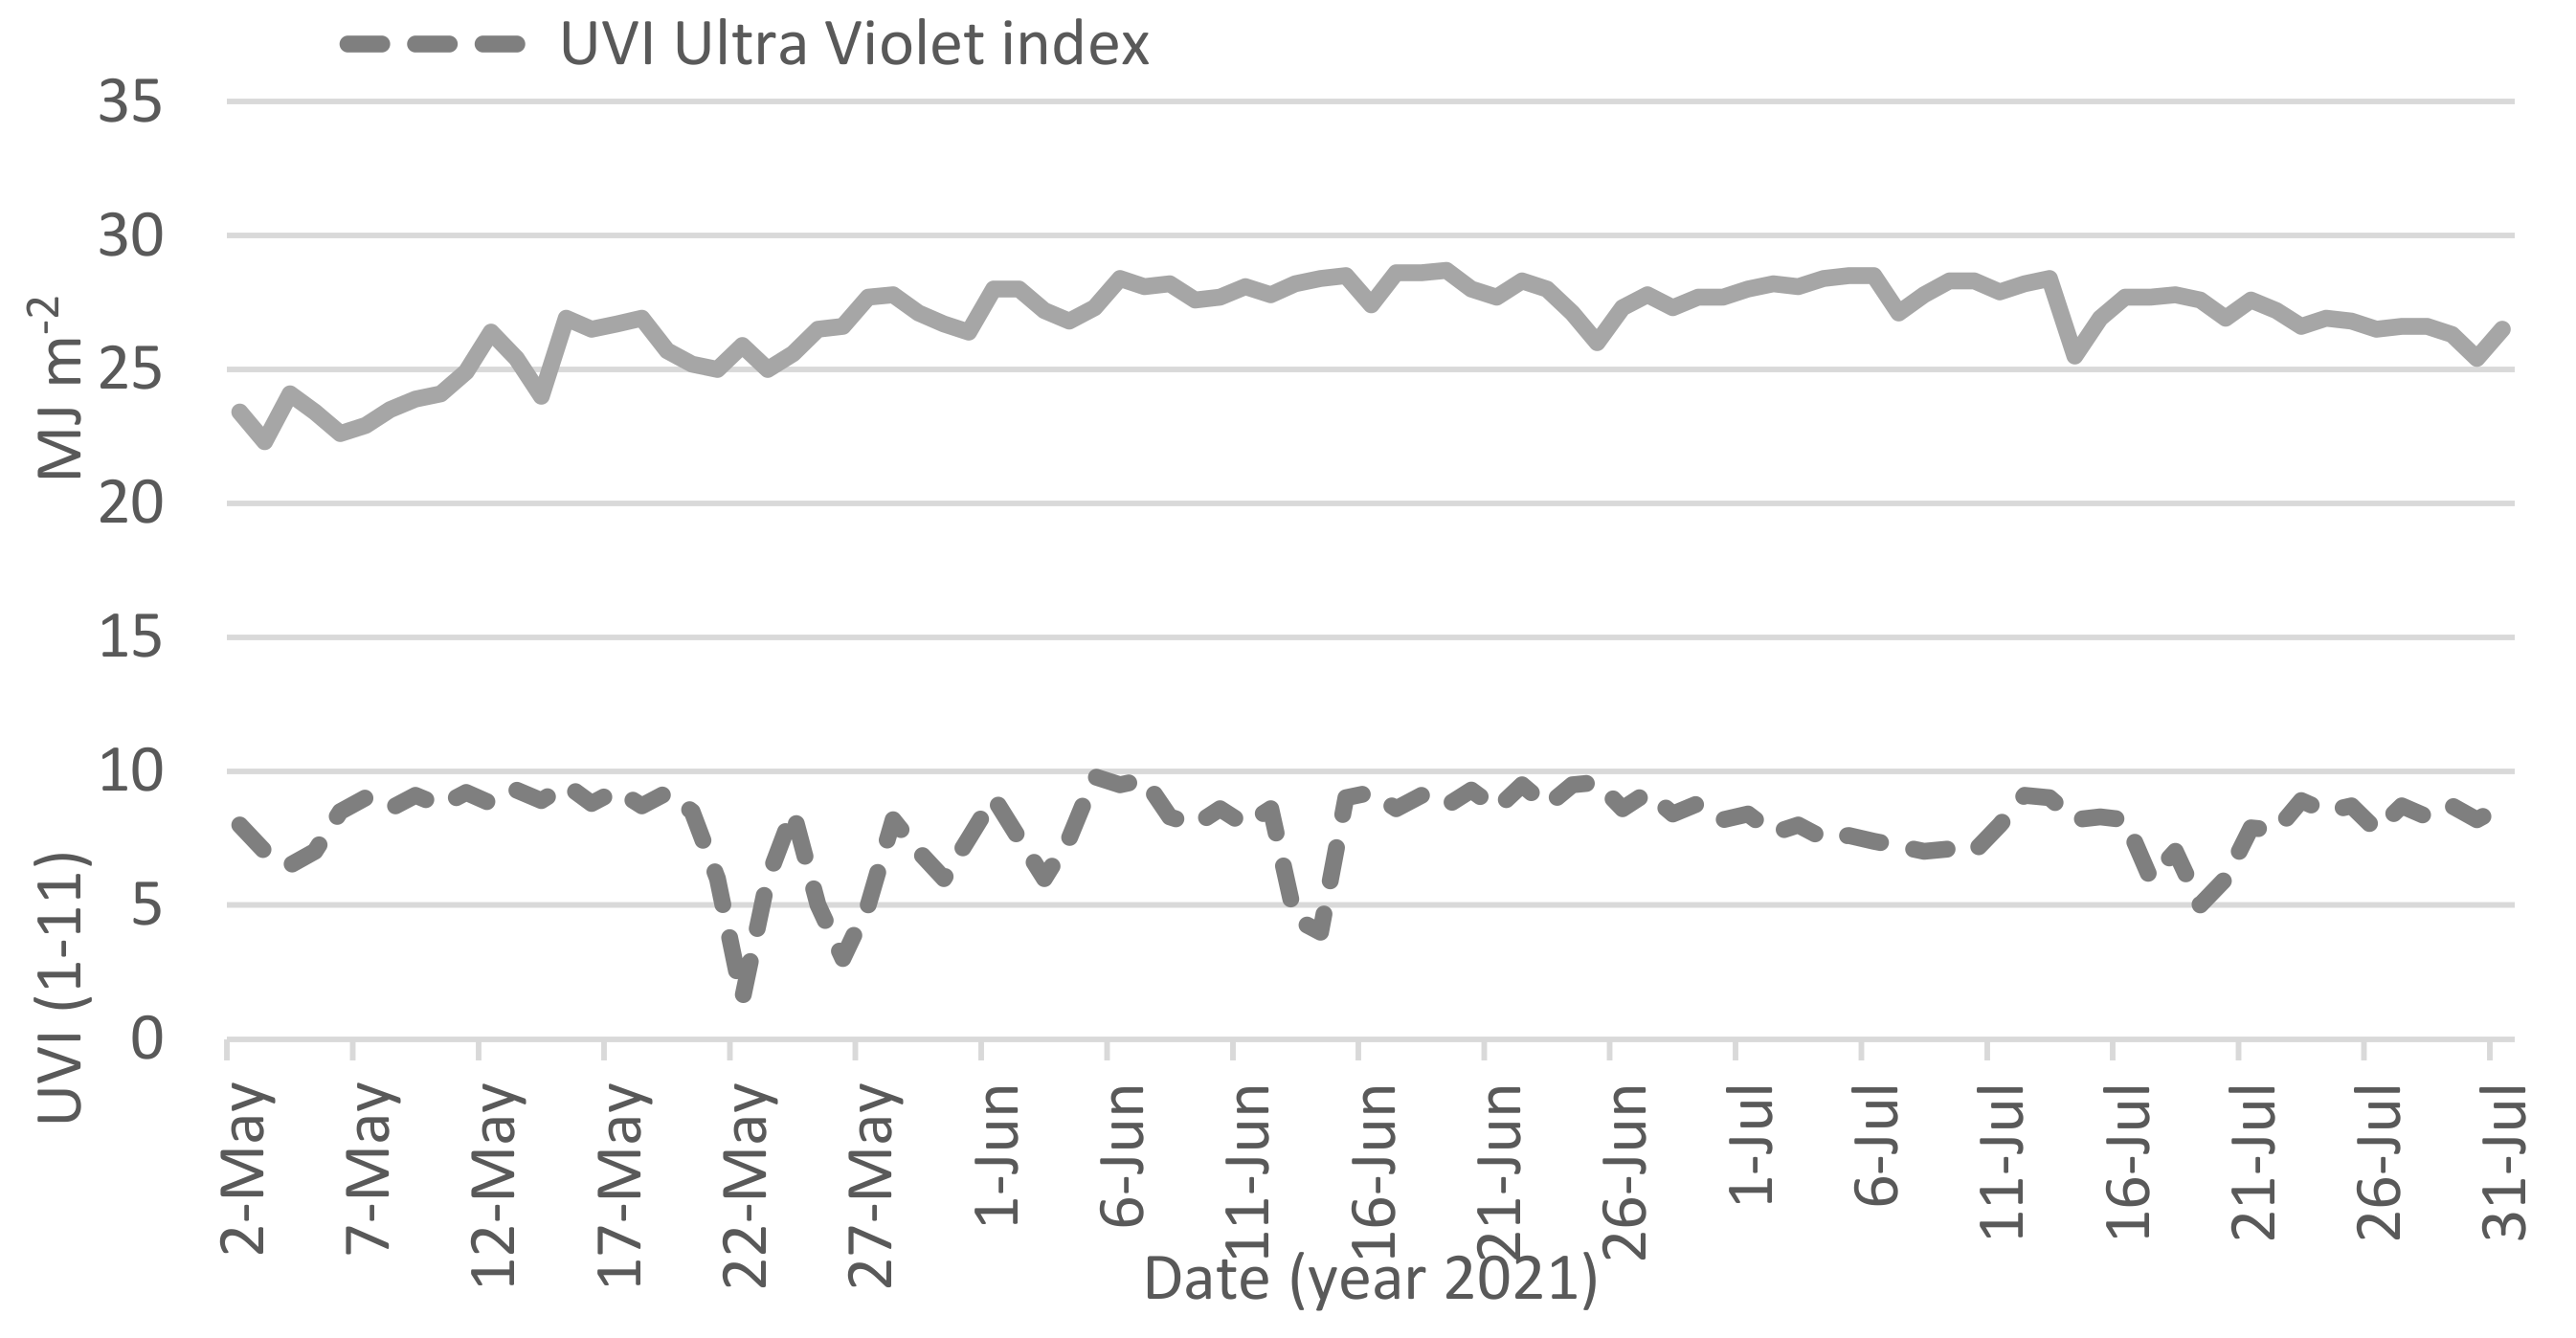
The daily solar radiation showed a tendency to increase from the beginning of the study (2nd May) until 19th June, when a maximum for the whole period was obsrved, with a value of 28.7 MJ m−2. After this date, this value remained approximately constant until the middle of July, later presenting a smooth decline in the last fortnight of the experimental period (Figure 4).
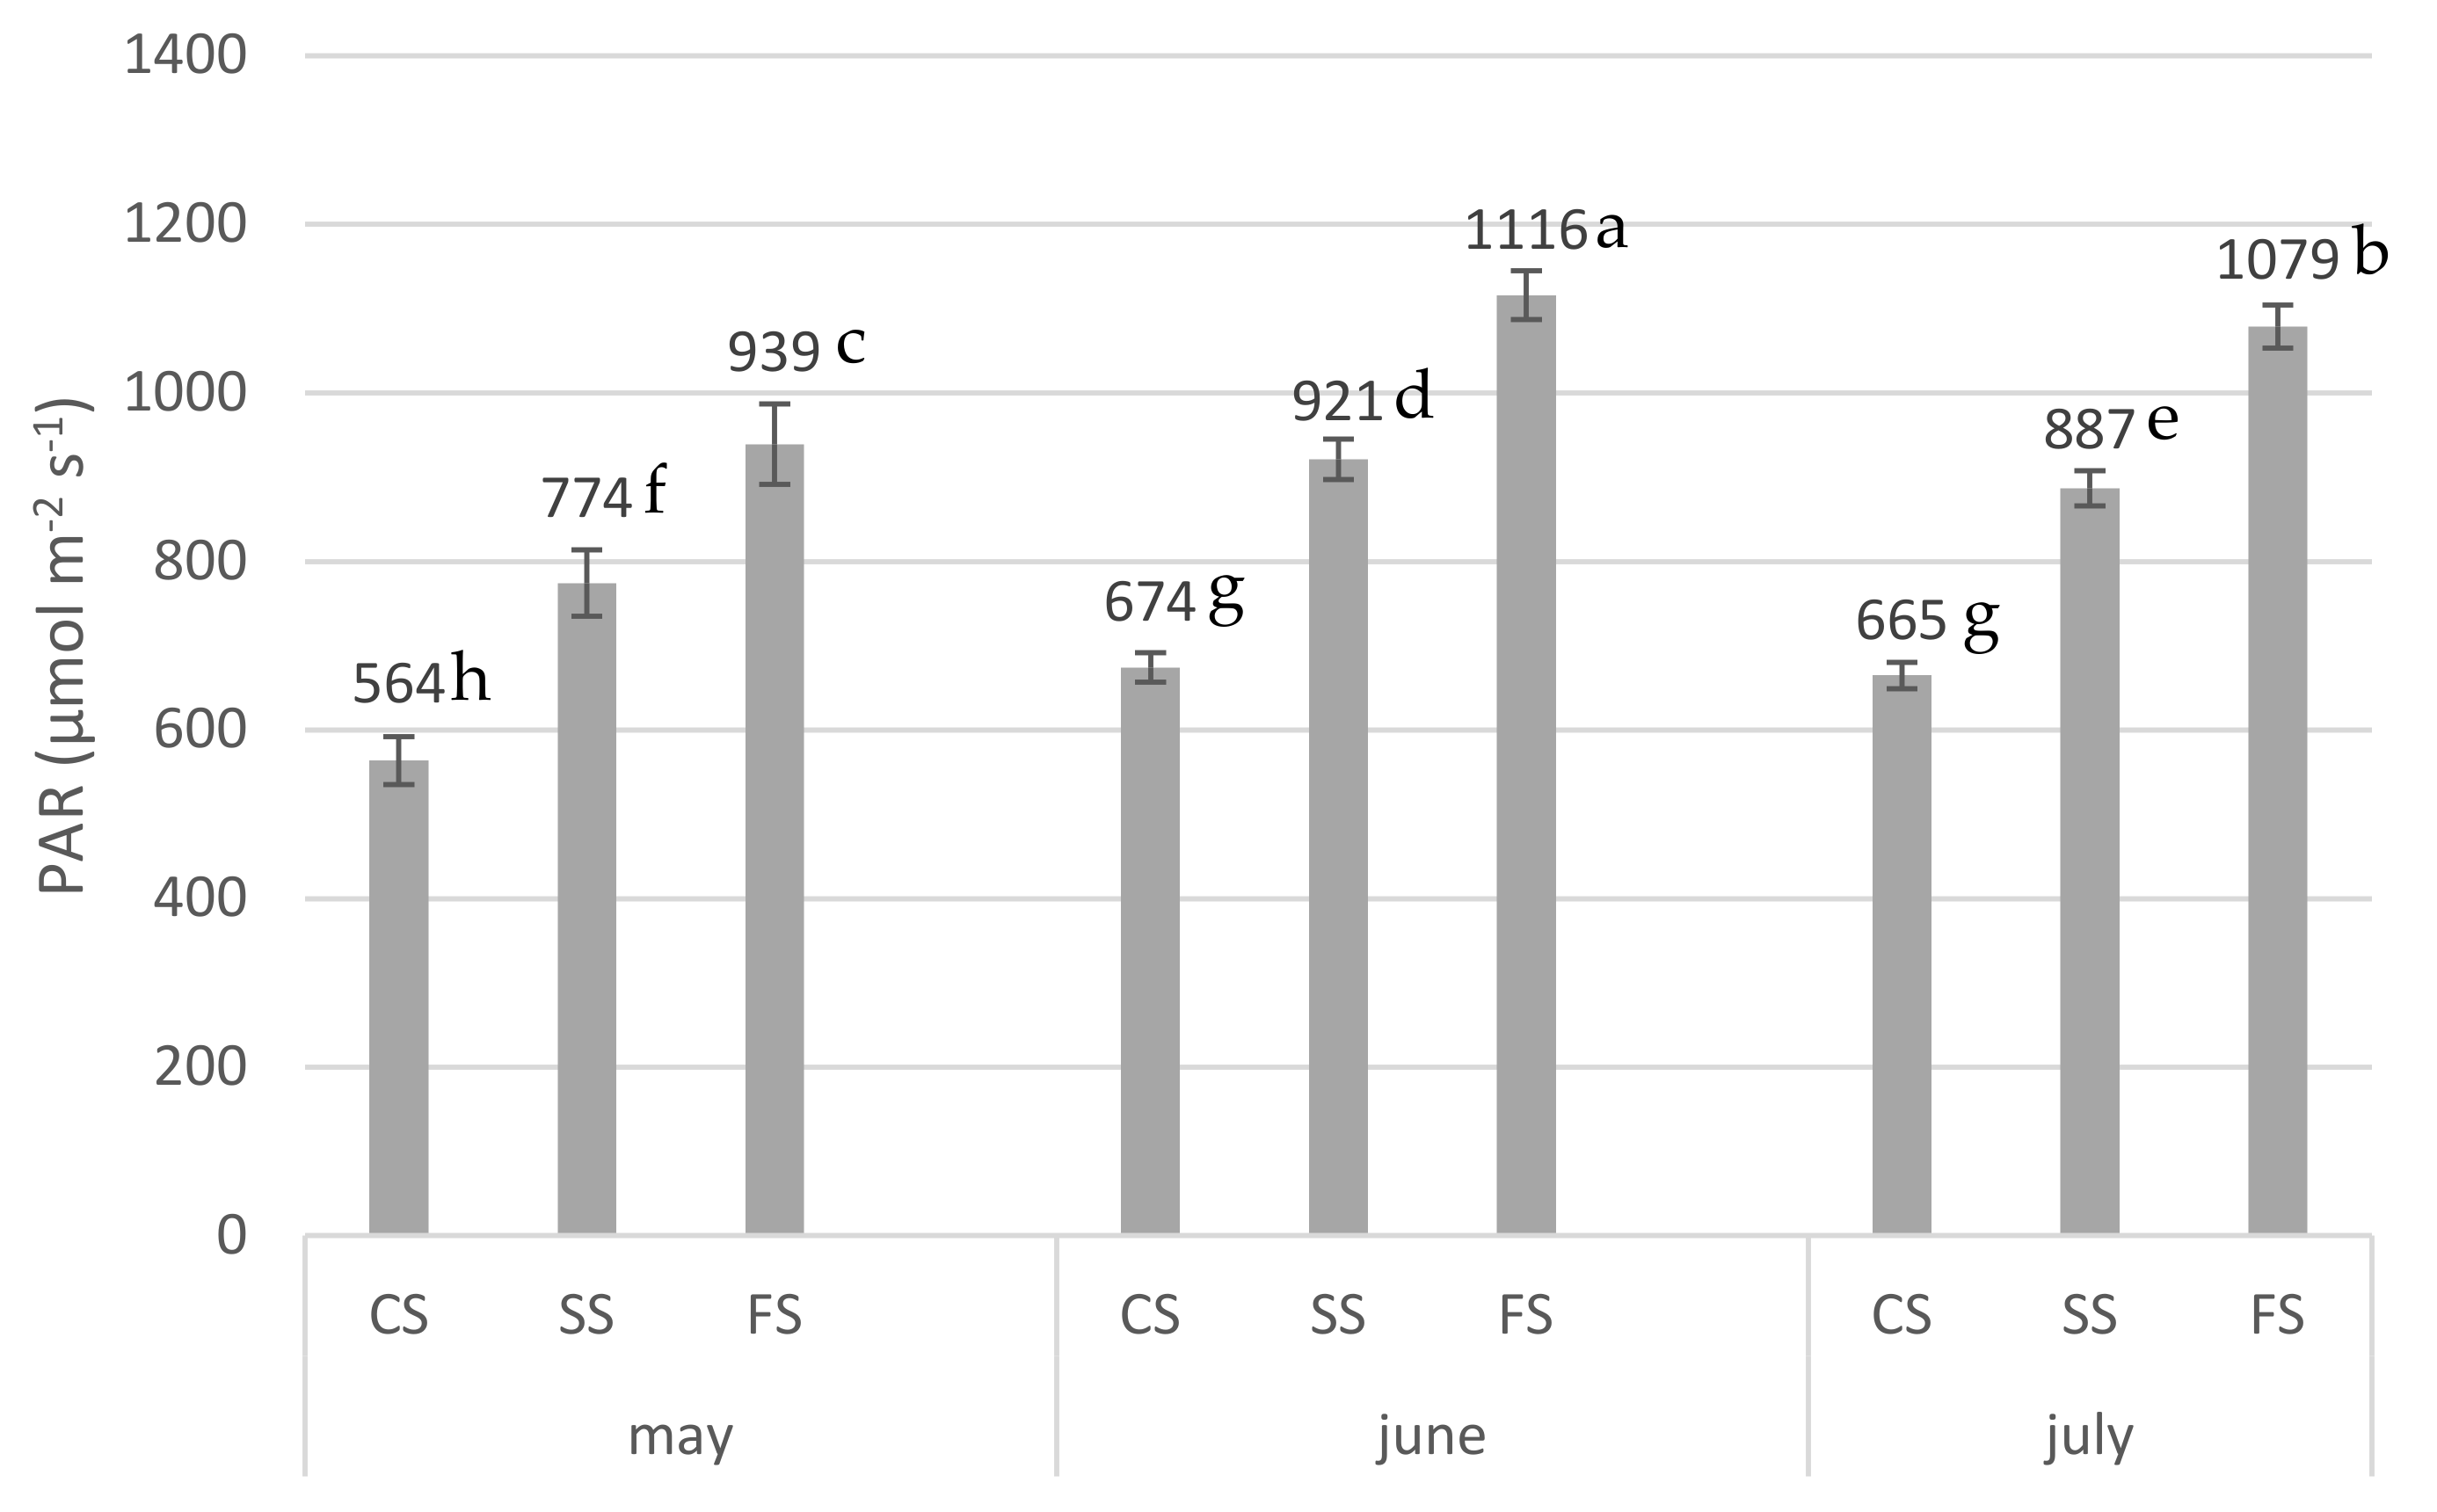
During the month of May, PAR reached a daily average of 939 μmol m−2 s−1 under direct exposure conditions (FS), increasing to 1,116 μmol m−2 s−1 in June and stabilizing around this value in July (Figure 5). As expected, the sensors located under the solar panels provided lower values, but following a monthly trend similar to that of treatment FS: lower PAR levels in May and approximately stable in June and July.
It is noteworthy that the PAR values were higher for treatment SS than for treatment CS for all the months of the experiment.
The daily evolution of PAR radiation showed that the sensors that were exposed to sunlight without shading (FS) displayed values with an increasing trend until 12:15 h, after which the values remained more or less stable until 14:30 h, after which they presented a decrease.
These time bands were repeated during the three months of the study, but with dif-ferences in the maximums reached, since, in the month of May, FS reached a maximum of 1620 μmol m−2 s−1, while in the months of June and July these maximums were close to 1800 μmol m−2 s−1 (Figure 6).
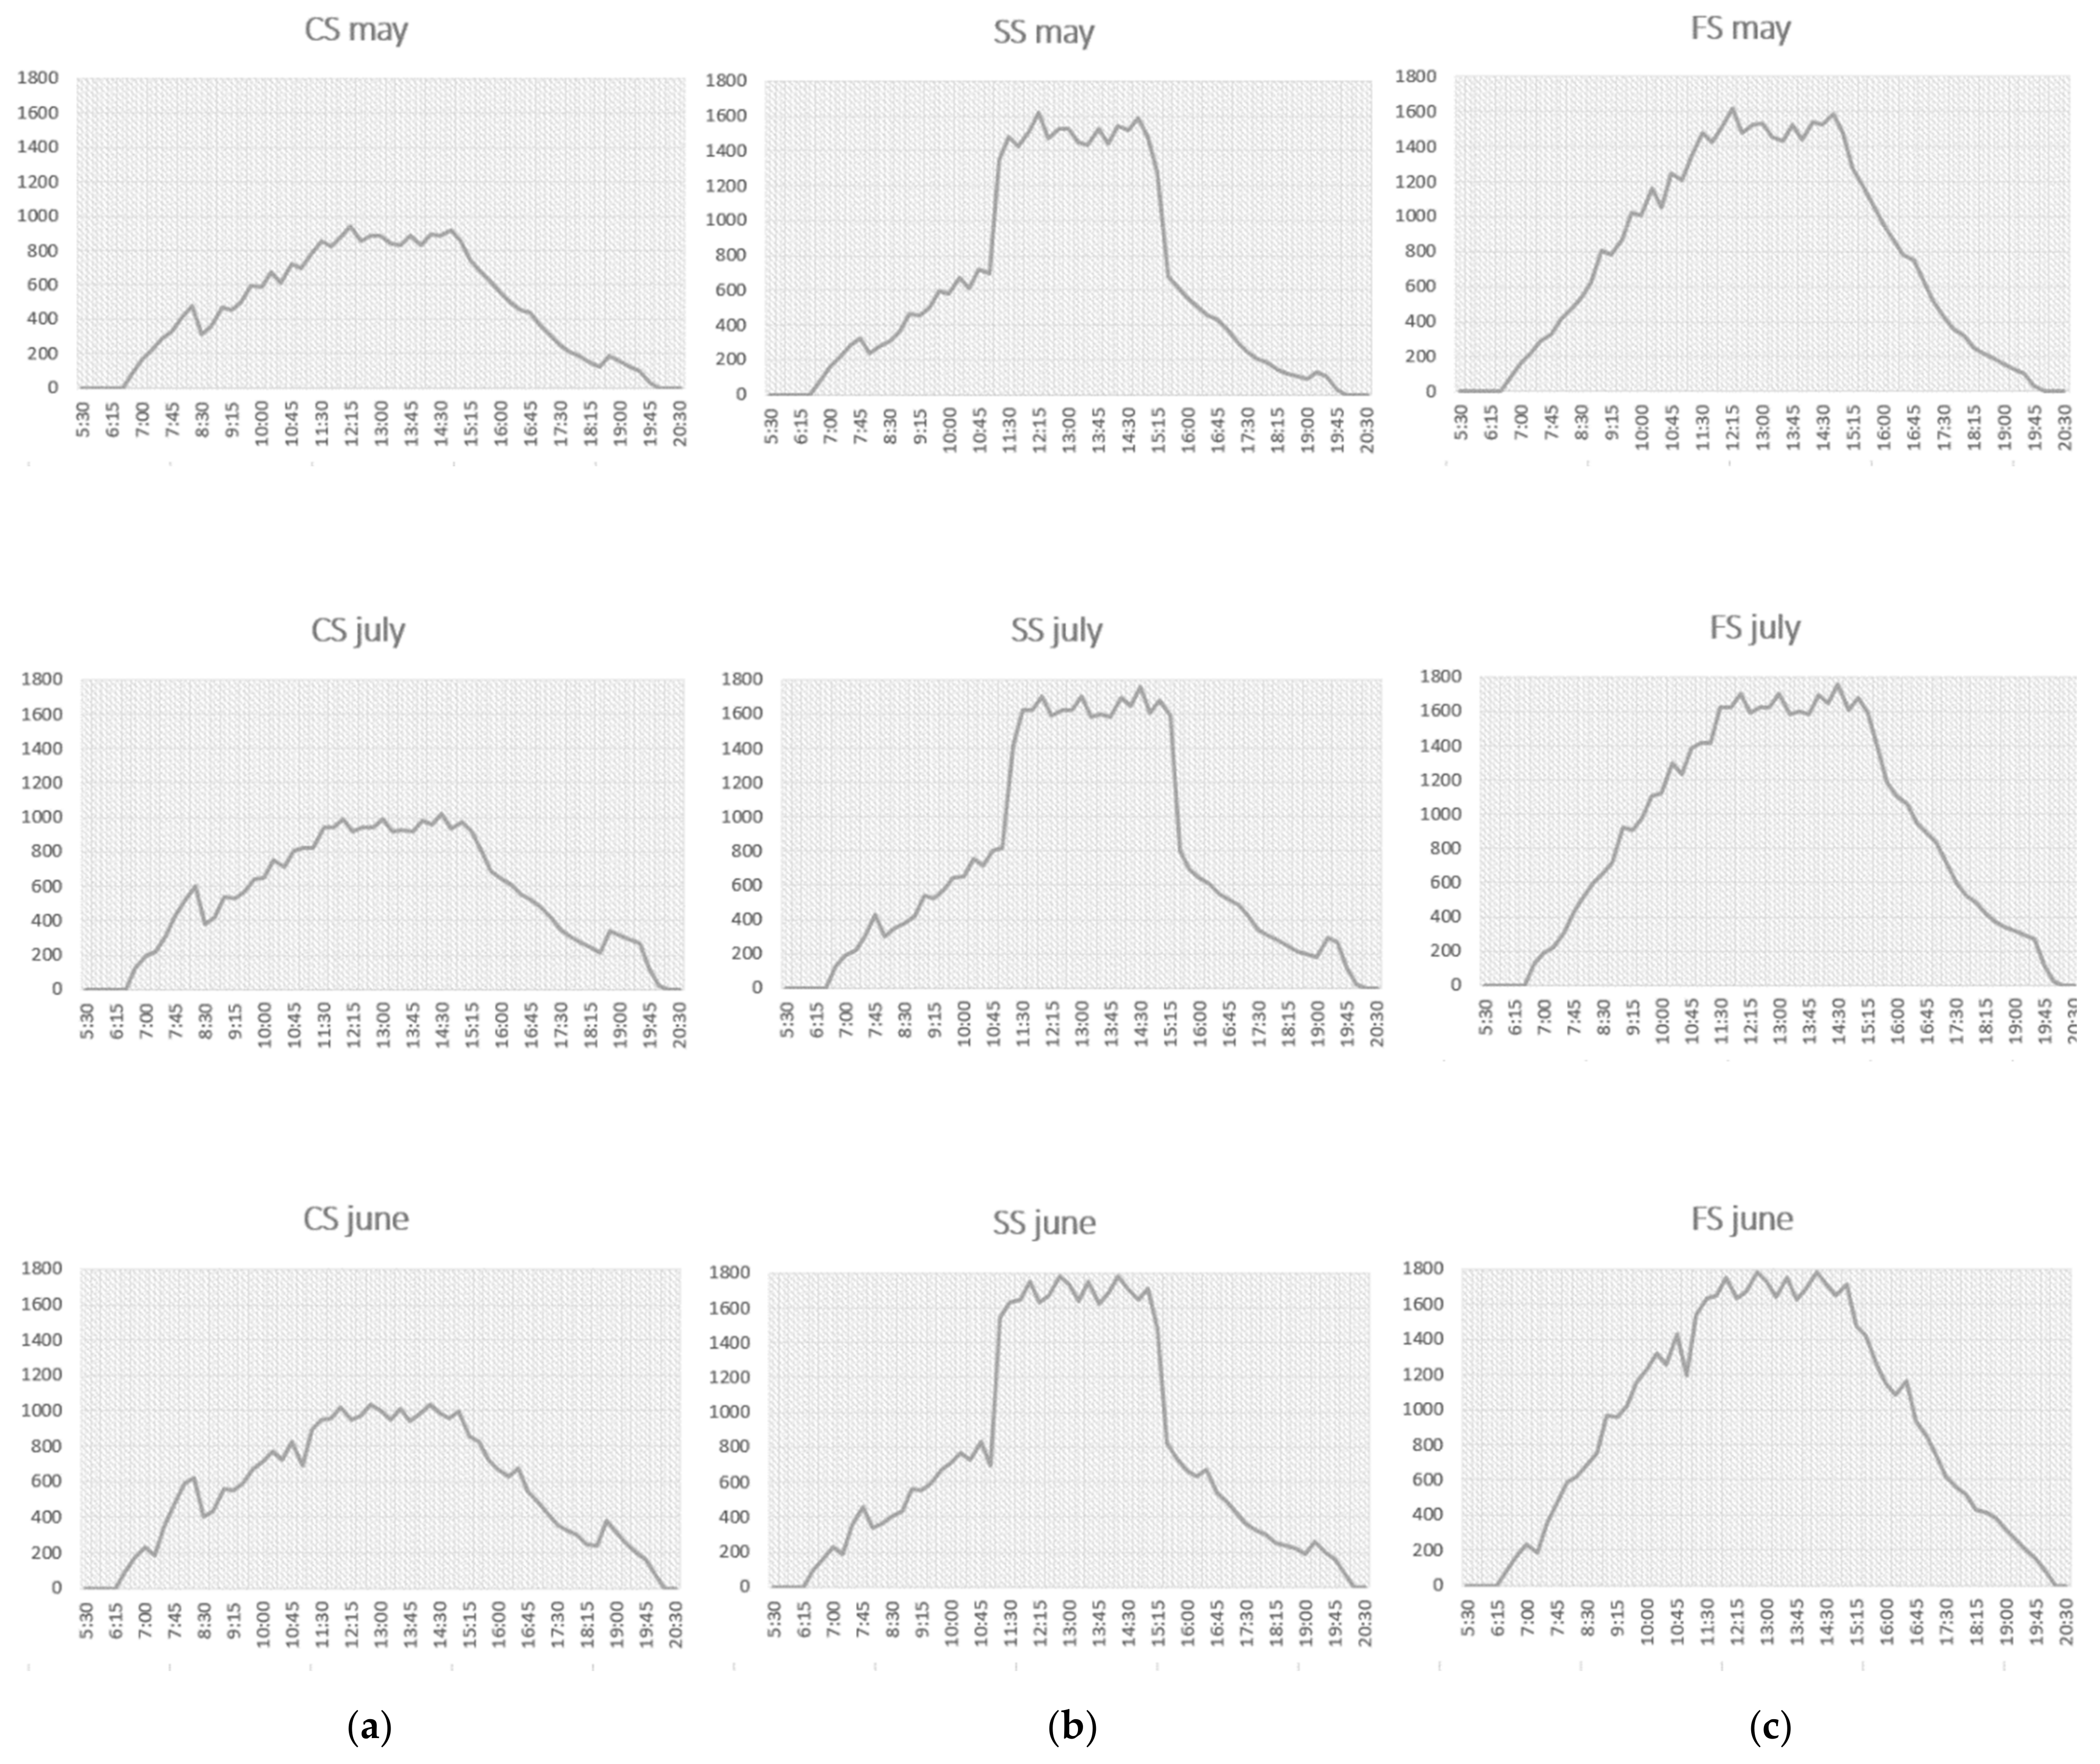
When comparing the daily evolution of the PAR radiation between the CS and SS treat-ments, we verified that there were significant differences between both: CS slightly exceeded SS in the two time periods, 7:45–8:30 and 18:30–19:15, while SS clearly outperformed CS between 11:00 and 15:30. This situation caused the integral of radiation received throughout the day to be significantly higher in SS than in CS.
These same hourly evolutions of CS and SS were repeated in the whole period of the study, although, as with the FS treatment, the peaks reached during the month of May were lower than those reached in June and July.
3.2. Agronomic Variables
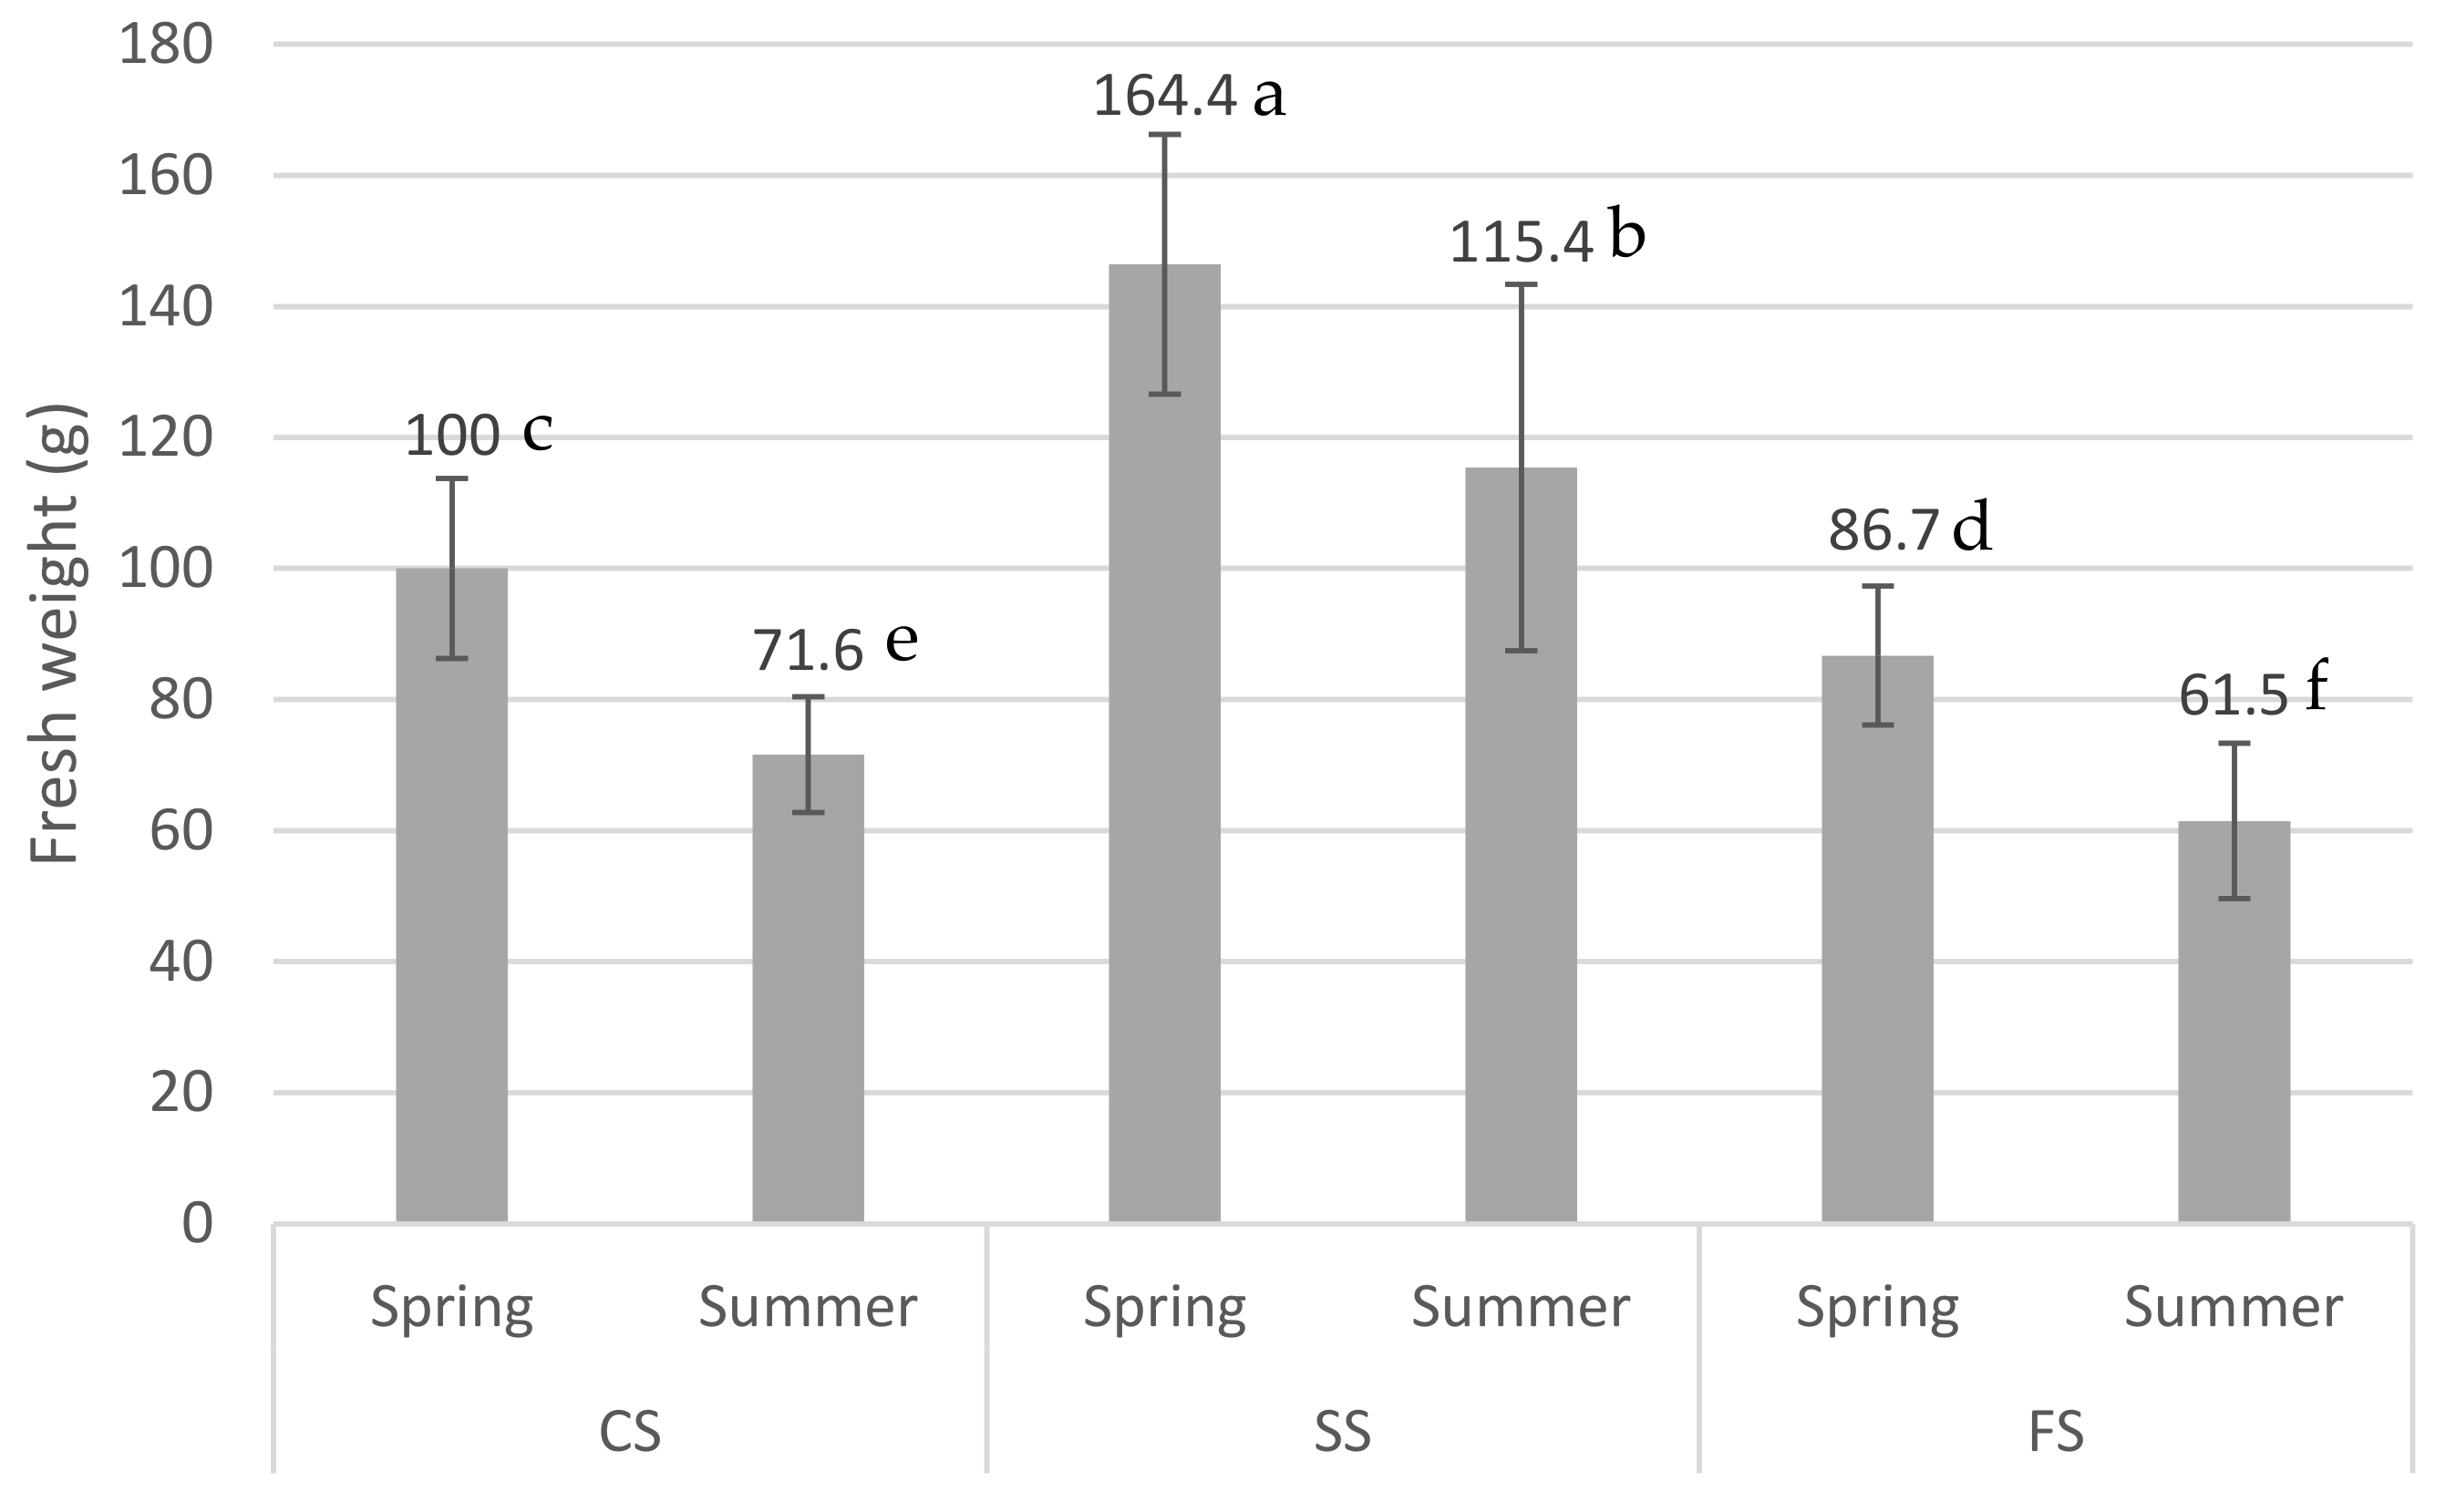
The data obtained for fresh weight at harvest time show that treatment SS was 46.4% more productive than CS treatment and 68.8% more than the FS treatment during the spring cycle. This situation occurred more markedly in the summer cycle, with increases in fresh weight production of 61.2% compared to CS and 87.6% compared to FS. Significant differences were obtained in all the treatments (Figure 7).
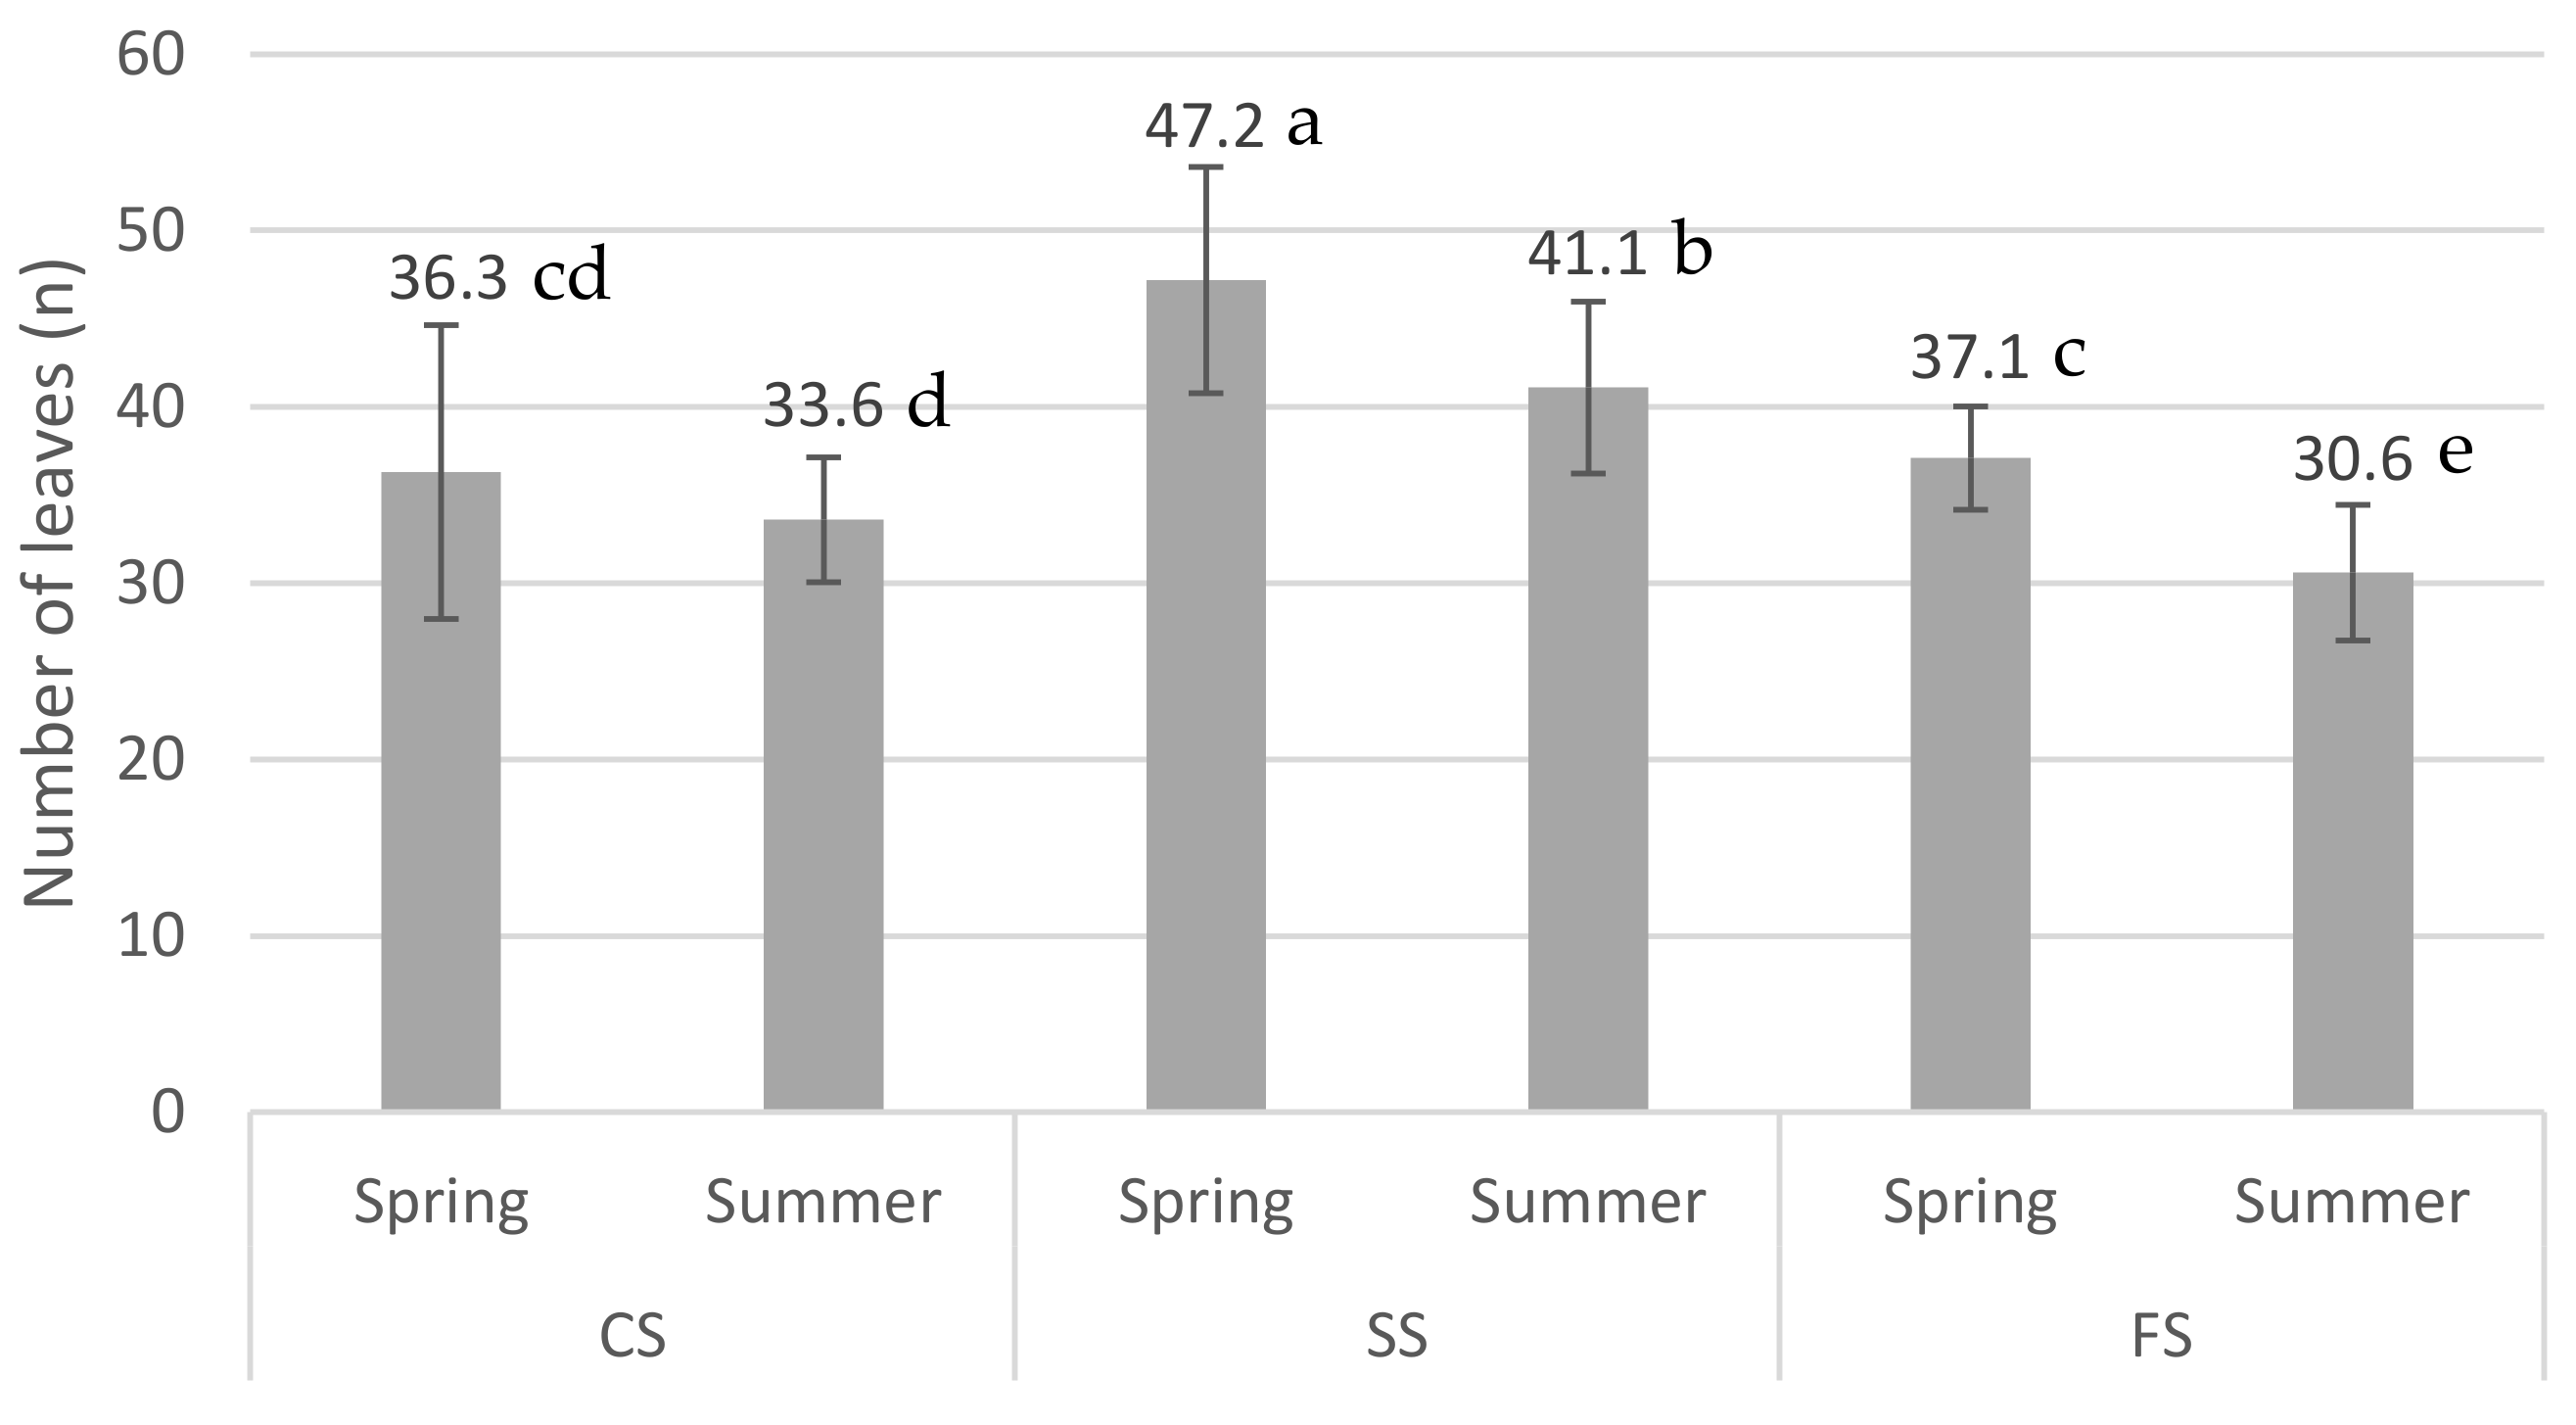
Regarding the average number of leaves (Figure 8), the SS treatment was the most productive both in spring and in summer. The CS and FS treatments also featured significant differences between them, with the treatment fully exposed to the sun (FS) displaying a lower number of leaves during the summer. However, in spring, there were no significant differences between these two treatments. There were also no statistically significant differences between the spring and summer seasons in the CS treatment.
This greater growth shown by the lettuces subjected to scattered shading resulted from these plants having a greater number of leaves (Figure 8) and greater lengths (Figure 9), as well as larger roots (Figure 10). Regarding all these variables, the SS treatment was more productive than the others.
Regarding the maximum length of the leaves (Figure 9), the SS treatment was the most productive both in spring and in summer. The CS and FS treatments featured significant differences only in the summer season, demonstrating better results for CS versus FS. However, in spring, there were no significant differences between these two treatments.
Significant differences were obtained for all the treatments of the root dry matter variable (Figure 10). The most productive was the SS treatment, both in the spring and in the summer seasons. The CS treatment was more productive than FS in both spring and summer.
For all the agronomic variables studied, all the treatments performed better in the spring season than in the summer season, except in the CS treatment for the number of leaves variable, in which no statistically significant differences were obtained.
When comparing the CS and FS treatments, it was observed that the plants subjected to the CS treatment showed a greater development in fresh weight, number of leaves, maximum length and dry matter of roots; although the differences between the means were statistically significant, they were not as marked as in the comparison made with the SS treatment. This situation occurred both in the spring and in the summer cycles. The only exception occurred in the values of the number of leaves in the spring cycle, in which the plants fully exposed to the sun (FS) displayed a slightly higher average than those subjected to concentrated shade. However, these small differences were not statistically significant (Table 1), and the same occurred with the difference between the means of maximum lengths.
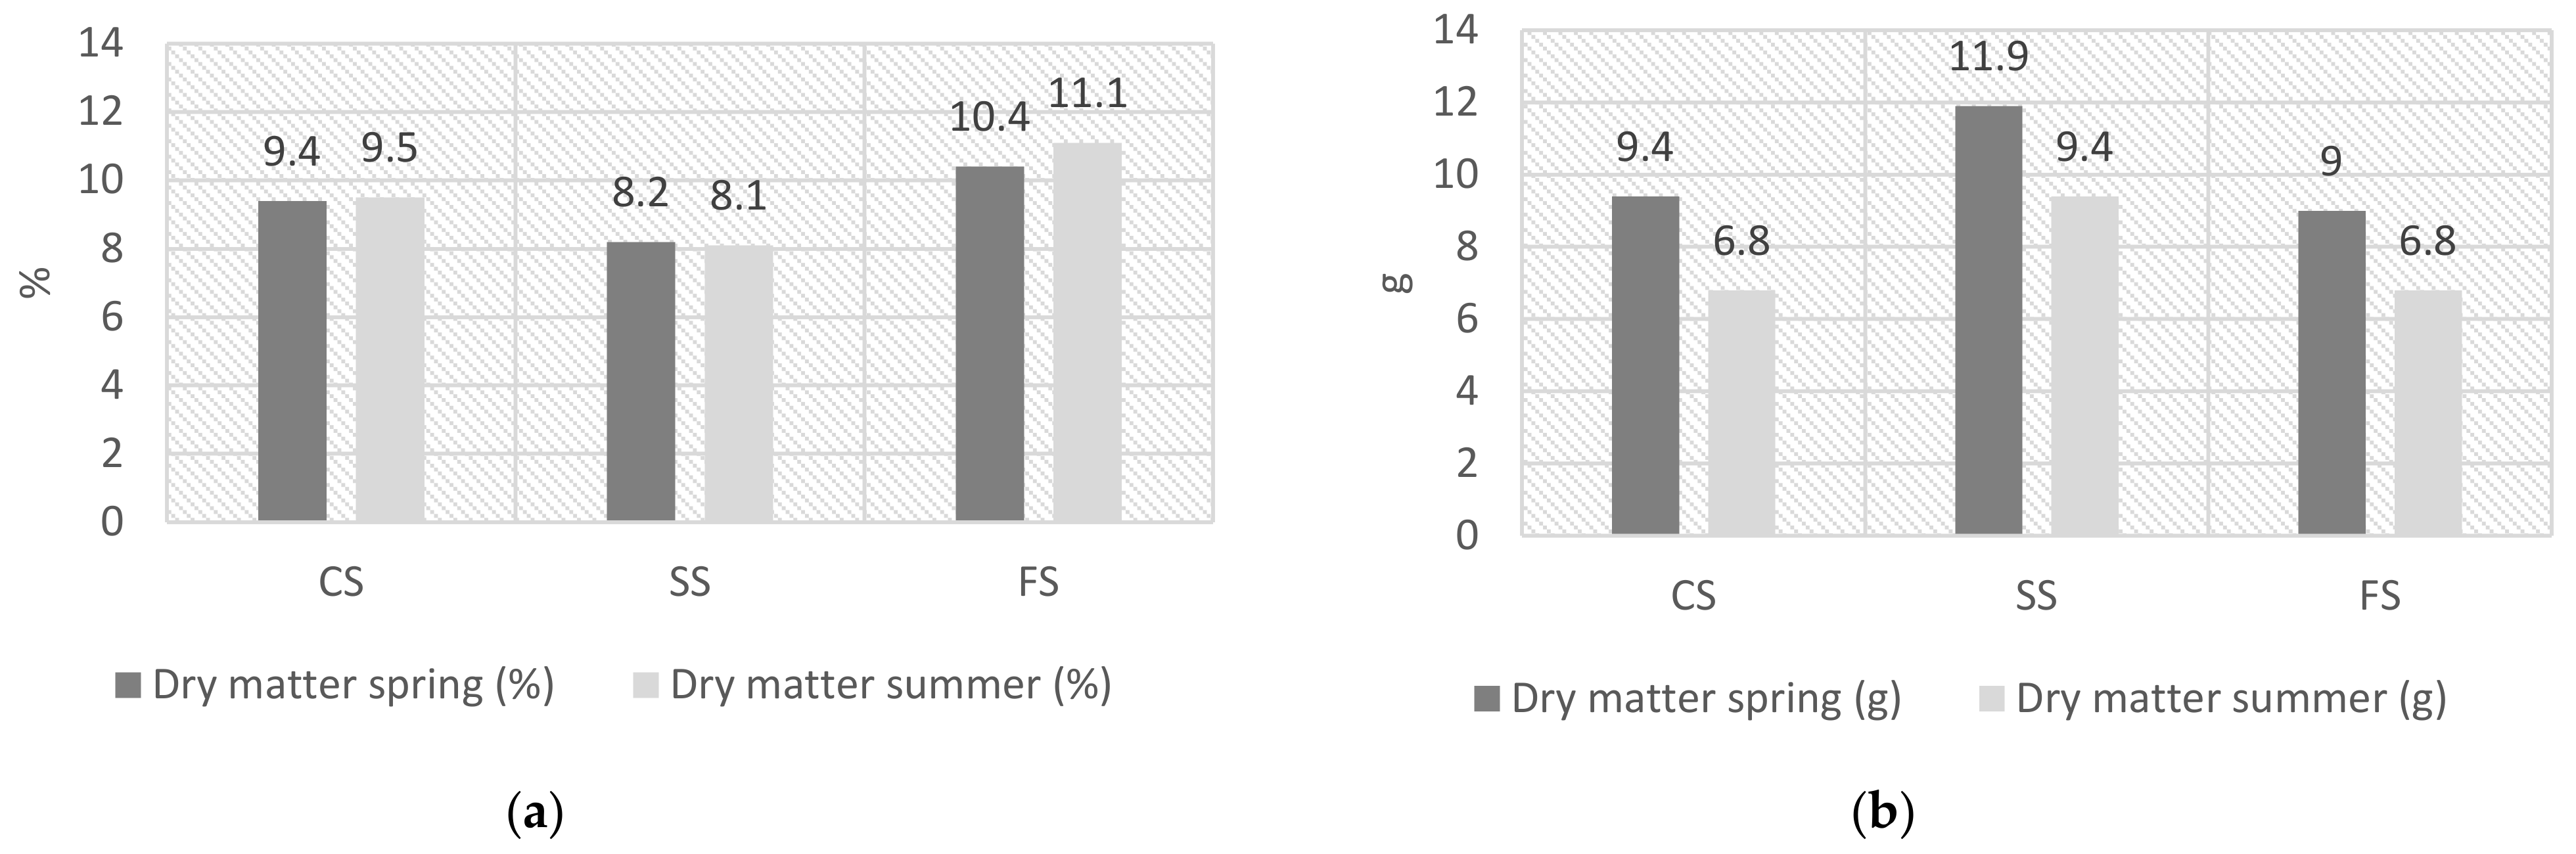
By contrast, the same did not occur with the percentage of dry matter. In this case, the lettuces exposed to the sun without shade (FS) showed higher levels of dry matter (%) than those grown under some type of shade (CS and SS), although when the dry matter data were analyzed in weight (g), the results were identical to those mentioned in previous paragraphs (Figure 11). The same situation occurred with respect to the growing cycle, since, in summer, the dry matter (%) was almost equal to or higher than in spring, being especially significant in lettuces exposed to the sun (FS); nevertheless, the dry matter (g) was higher in the plants that showed higher levels of developement (SS).
The Least Significance Differences (LSD) test (Table 1) showed that the three shade treatments adopted in this study (CS, SS, FS) were, since they presented significant statistical differences, with very small or null p-values. The results were also significantly different between the spring and summer cycles, with statistically different means for all the treatments. Nevertheless, when studying the possible interactions between cycles and types of shading, the results showed that there were no combined effects (the change in cycles does not depend on the shade treatments and vice-versa), except in the percentage of dry matter, albeit with a value of low significance.
4. Discussion
The results show two relevant facts, the first of which is that the same proportion of the total area covered with shade, CS (22%) and SS (22%), produced different results. In both the spring and summer cycles, the SS treatment was more productive, in relation to all the variables studied (fresh weight, number of leaves, maximum length, dry matter), than CS. Therefore, the effect of a patterned mini-module design had positive consequences in the environmental conditions studied, which allowed higher plant productivity. This result is consistent with those obtained by Perma et al. [50], although the proposal made by these authors was limited to optical modeling, consisting of the implementation of a computer model that simulates the movement of the sun and the shadows projected on the ground, based on different variables, such as geographic location, the height above the ground of the photovoltaic panels, and the dimensions and shapes of the panels. Some authors [29,30,34,41,42,51] have shown that an increase in the percentage of the area covered with shade led to a decrease in production, but none of them compared the same percentage with different patterns in the design of the photovoltaic modules.
The second relevant fact is that, in the SS treatment, an inverse relationship between received PAR radiation and productivity was not observed, while in the CS and FS treatments that inverse relationship was apparent (Figure 12 and Figure 13). In both the spring and summer cycles, the plants fully exposed to the sun (FS treatment) were the least productive, yet they received the highest amounts of PAR radiation. Furthermore, comparing the FS treatment in spring versus summer (Figure 12), it was observed that in spring it receivesd slightly less radiation (998 µmol m−2 s−1) than in summer (1091 µmol m−2 s−1), while the mean fresh harvested mass decreased from 87 g to 61 g. It seems, therefore, that higher radiation is detrimental and led, in this case, to poorer production results. However, when analyzing the SS treatment, the above premise was not met. The results obtained for the CS and FS treatments were consistent with the results published in previous investigations [52,53,54,55] but these do not coincide with the result of the SS treatment.
In Figure 12, the blue arrows mark the trend of radiation, and the orange arrows mark the trend of expected production. The SS treatment corresponds to an intermediate radiation level between CS and FS. However, the fresh weight does not follow the same trend of radiation. For the SS treatment, it is higher than expected (marked in Figure 12 with an orange dot). The radiation flux measured in the different treatments presents the following order: FS > SS > CS. Therefore, the expected production should be the inverse: FS < SS < CS. However, the production obtained followed the order, FS < CS < SS.
It can also be observed that the CS treatment suffered a decrease in PAR radiation, around 40% in both spring and summer, a result that is consistent with previous studies of PV-green roofs [56].
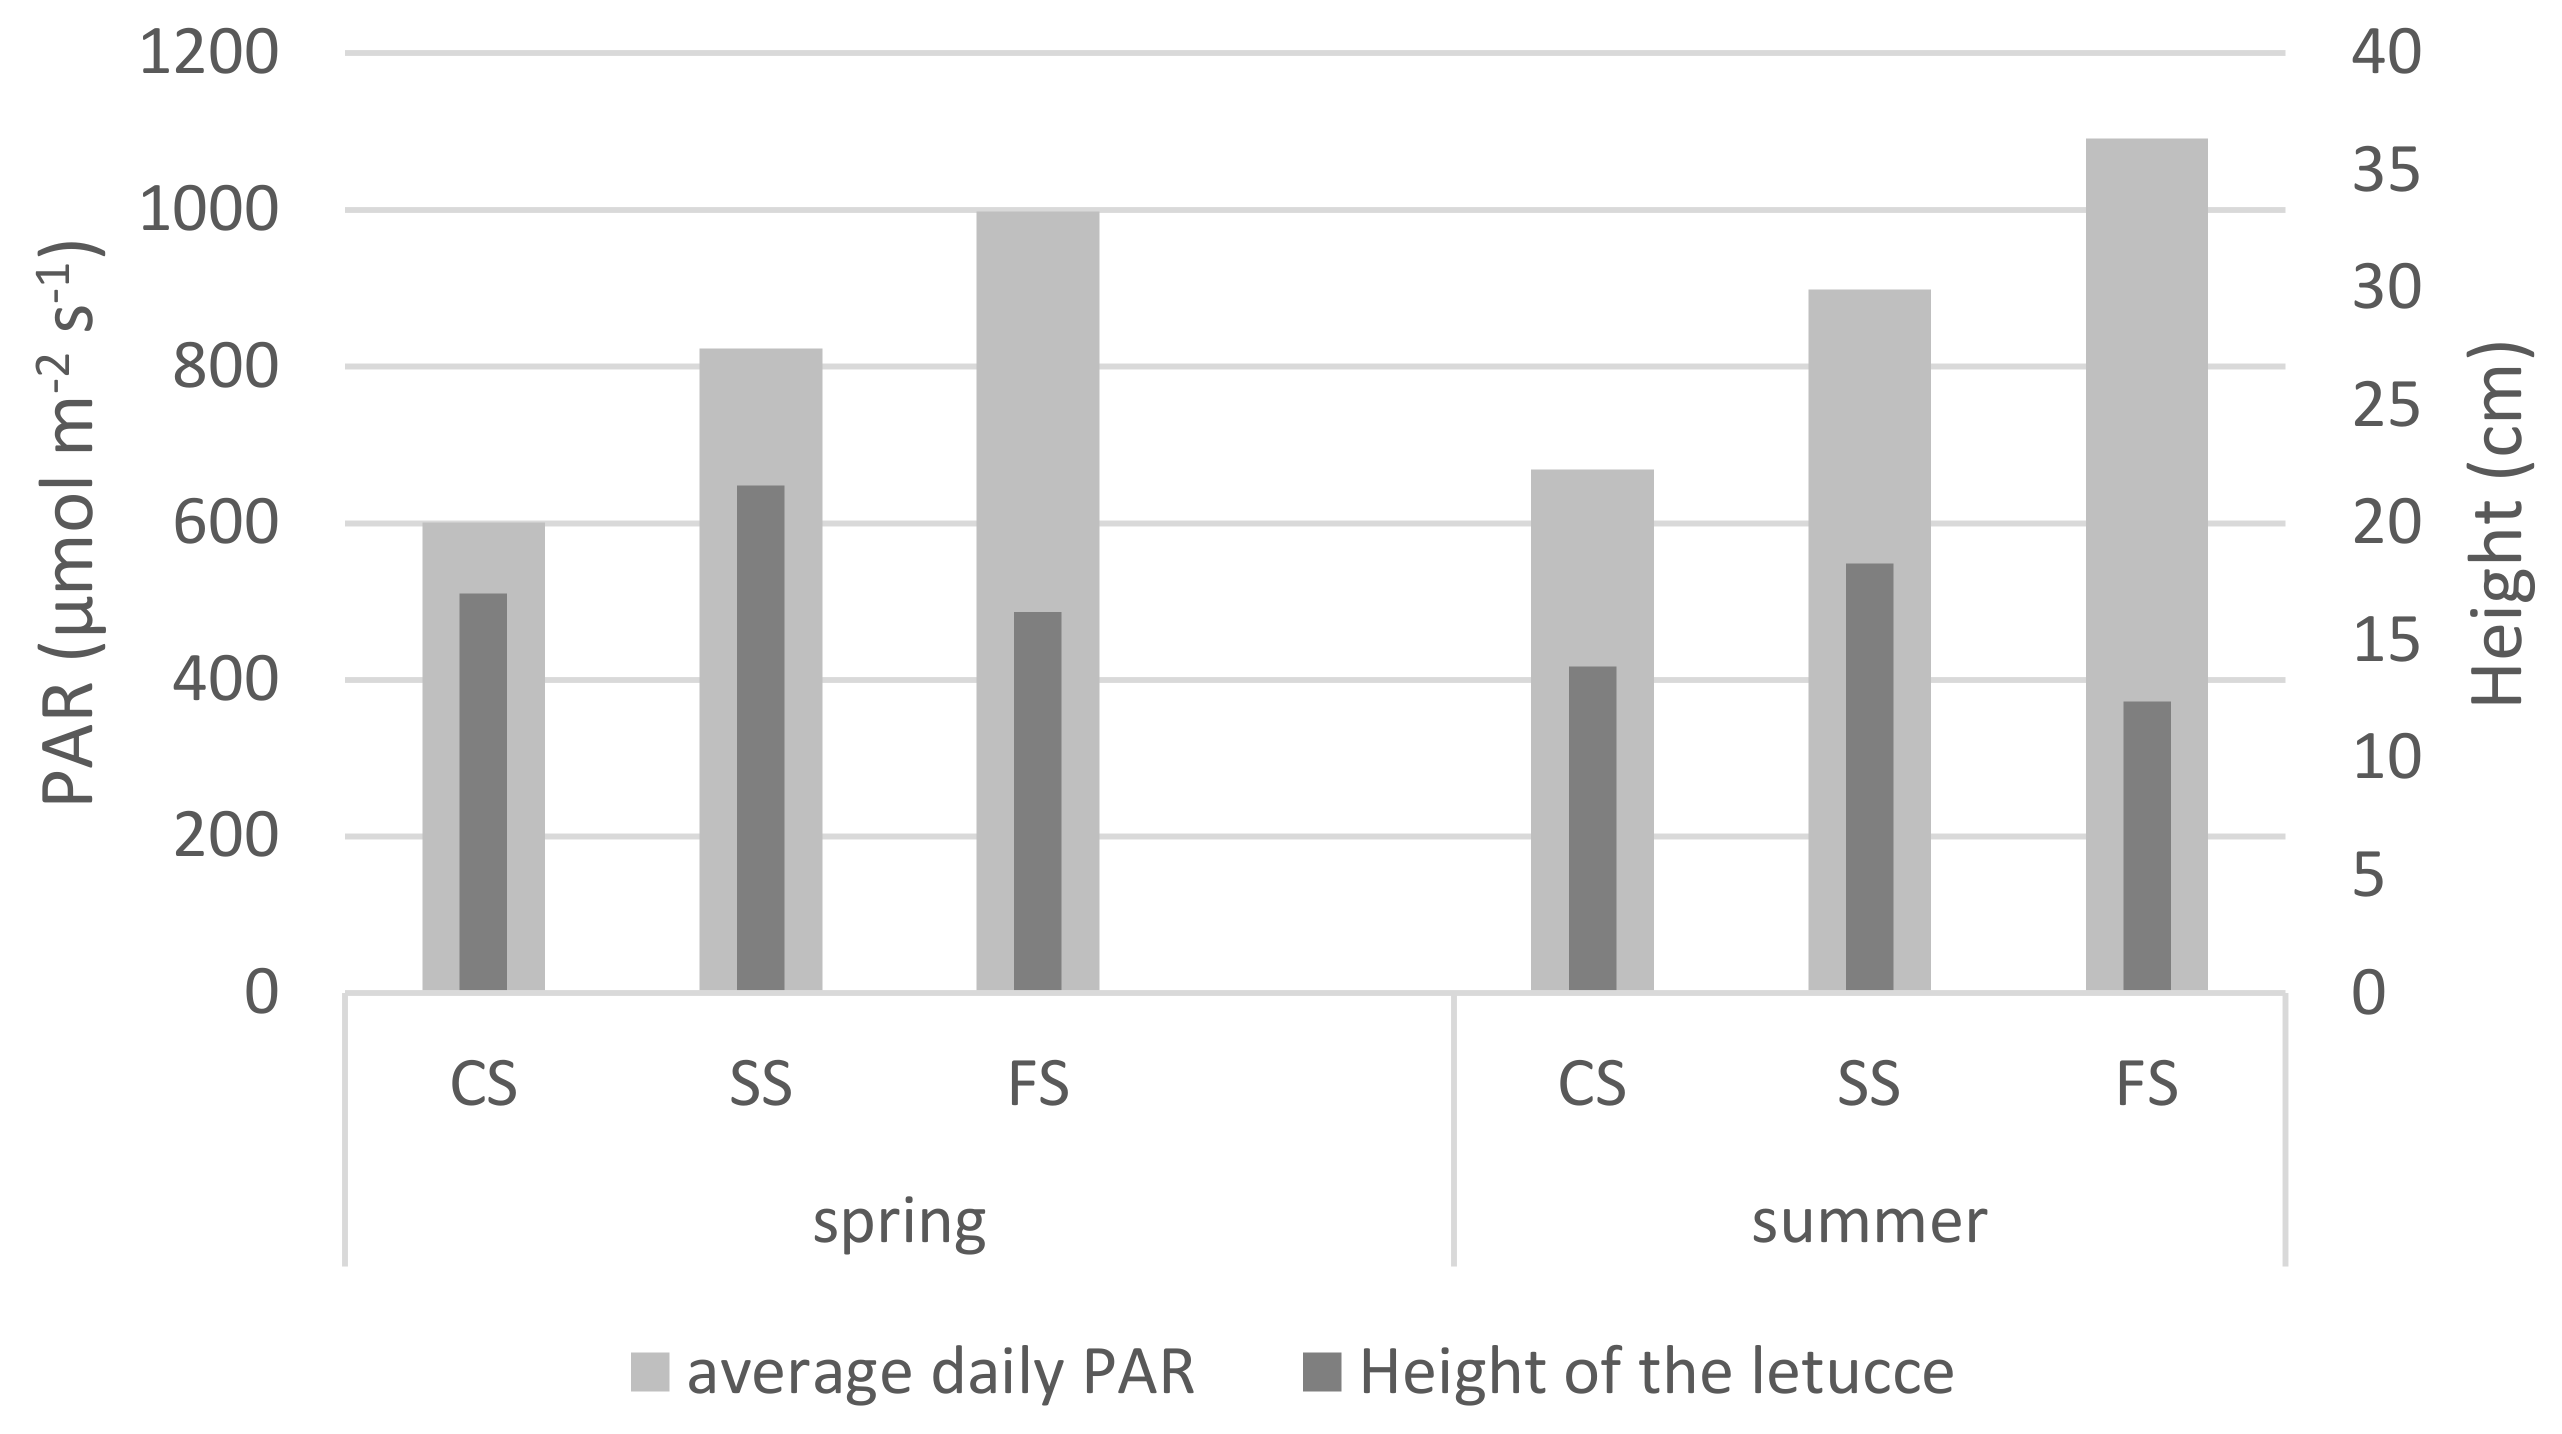
A similar situation occurred when we compared the PAR radiation and the resulting height of the lettuces for each treatment (Figure 13).
A possible explanation for the fact that the CS treatment receivesd less PAR radiation than the SS treatment, even though both displayed a 22% shaded cultivation surface, can be observed in Figure 6. The arrangement in patterns of the PV mini-modules (SS treatment) allowed the passage of light in the hours of greatest solar incidence, while in CS, direct radiation could only access the plants located under the panel when the solar angle was very low, during sunrise and sunset. It seems clear that the arrangement of the modules, their size, placement, height, and orientation can affect the amount of radiation reaching crops.
Another factor that can explain this inverse relationship between radiation and productivity is the relative incidence of ultraviolet radiation. Some authors, [57] note that UV-B radiation can induce photooxidation damages, and cellular membrane or DNA changes in plants. Thus, under higher amounts of radiation, particularly at high intensity levels, damages directly effecting decreases in productivity can occur.
Figure 4 shows the levels of UV radiation, measured according to the Ultra Violet Index, verifying that they were very high (8–10) both in spring and summer. This could explain the fact that the lettuces in shade, better protected from UV radiation, demonstrated level of a productivity that was somewhat higher than the FS lettuces. However, it does not explain the decreases in productivity experienced by the three treatments between the spring and summer cycles, since the UV radiation was similar in both seasons. Therefore, other variables might explain the differences between spring and summer.
The evolution of temperature during the period studied (Figure 3) seems to explain the differences in productivity between spring and summer. An increase in temperature increases cellular respiration, decreasing net photosynthesis, from a level considered optimal. Some authors have investigated this optimum level in lettuce cultivation [58], placing it around 22 °C, although it is highly dependent on other environmental variables. As shown in Figure 3, the temperature iwa often higher than that value and higher in summer than in spring. A higher temperature in summer, around 28 °C, would imply less net photosynthesis when compared to the spring cycle, when the temperature is around 25 °C. However, temperature alone does not explain the productivity differences between the CS and SS treatments.
A factor that could explain the better performance in treatment SS is the continuous exposure time to excessive radiation (without interruption by shading), which, for this treatment, was shorter than for the other treatments. The use of mini-PV modules submitted the plants below them to short periods of direct radiation and shading. As described by some authors [57,59], the photoinhibition process induced by high radiation levels, during the periods of excessive direct radiation, results in the degradation of the photosystems II (PSII), and also the photosystems I (PSI), to a smaller extent, with a decrease in photosynthetic activity. During shading periods, or periods of non-excessive radiation, PSII and PSI recover at a faster rate than they degrade. In the case of SS treatment, the interchange between direct radiation and shading, after long periods, allowed the damage in PSII and PSI to remain low and to be quickly recovered during the shading periods.
In future studies, other variables, such as the dimensions, placement height, orienta-tion, and patterns of the mini-PV modules should be optimized, adapting them in relation to the light saturation points of selected crops, with more efficient arrangements. This increase in efficiency must be observed from the agronomic point of view and considering the photovoltaic yield, since some studies [37] show that the use of PV modules with a patterned arrangement could reduce the energy yield of the photovoltaic installation by up to 5%. Other studies also show the beneficial effects on PV panel performance when the latter are installed over vegetated roofs and other constructions [60,61,62].
This study features limitations, since it is not usable on a large scale because the metallic frames and PV panels used were small, since they were designed for use on rooftops. However, the results obtained, especially in the case of scattered shadow, allow us to design photovoltaic panels of greater size than and of different shapes to those those currently in use, which could be used in large agricultural areas.
5. Conclusions
In this study, the behavior of different percentages of the total area covered with shade produced by photovoltaic modules on rooftop lettuce crops was compared. The test was repeated in two seasons with high temperature and radiation levels: spring and summer.
The results suggest that in regions with high radiation levels and temperatures, it is possible to use the same space on rooftops to produce photovoltaic energy and cultivate plant species that demand little light, such as lettuce.
The use of solar panels that shaded the crop (CS and SS treatments), under the mentioned conditions produced an increase in the productivity of the crop (fresh weight, dry matter, number of leaves, maximum length, dry matter of roots).
The same coverage area percentage (22%) can produce different productivity results, depending only on the arrangement of the photovoltaic modules. The results showed that the use of mini-PV modules with pattern design, which produce a scattered shadow (SS treatment), achieved higher productivity than when using the same percentage of coverage area, but concentrated (CS).
The productivity differences between the spring and summer treatments showed that spring conditions are better for the development of lettuce crops. However, all the conclusions previously mentioned are valid for both seasons.
Author Contributions
Conceptualization, A.C.-O. and T.A.d.P.; methodology, A.C.-O. and M.G.-G.; software, M.D.-P.; formal analysis, M.D.-P.; investigation, A.C.-O. and T.A.d.P.; writing—original draft preparation, A.C.-O.; writing—review and editing, T.A.d.P.; supervision, A.C.-O., T.A.d.P., M.D.-P. and M.G.-G. All authors have read and agreed to the published version of the manuscript.
Funding
This research was funded by OTRI contract number 401312.
Institutional Review Board Statement
Not applicable.
Informed Consent Statement
Not applicable.
Acknowledgments
ISA Instituto Superior de Agronomia, Universidade de Lisboa, Portugal.
Conflicts of Interest
The authors declare no conflict of interest.
References
- Ritchie, H.; Roser, M. Urbanization. Available online: https://ourworldindata.org/how-urban-is-the-world (accessed on 4 September 2021).
- United Nations. Worlds Urbanizations Prospects: The 2018 Revisions. Key Factors. Population Division of the UN Department of Economic and Social Affairs. 2018. Available online: https://population.un.org/wup/Publications/Files/WUP2018-Methodology.pdf (accessed on 4 September 2021).
- Abu Hatab, A.; Cavinato, M.E.R.; Lindemer, A.; Lagerkvist, C.-J. Urban Sprawl, Food Security and Agricultural Systems in Developing Countries: A Systematic Review of the Literature. Cities 2019, 94, 129–142. [Google Scholar] [CrossRef]
- Panagos, P.; Standardi, G.; Borrelli, P.; Lugato, E.; Montanarella, L.; Bosello, F. Cost of Agricultural Productivity Loss Due to Soil Erosion in the European Union: From Direct Cost Evaluation Approaches to the Use of Macroeconomic Models. Land Degrad. Dev. 2018, 29, 471–484. [Google Scholar] [CrossRef]
- Herrera-Gomez, S.S.; Quevedo-Nolasco, A.; Pérez-Urrestarazu, L. The Role of Green Roofs in Climate Change Mitigation. A Case Study in Seville (Spain). Build. Environ. 2017, 123, 575–584. [Google Scholar] [CrossRef]
- Canet-Martí, A.; Pineda-Martos, R.; Junge, R.; Bohn, K.; Paço, T.A.; Delgado, C.; Alenčikienė, G.; Skar, S.L.G.; Baganz, G.F.M. Nature-Based Solutions for Agriculture in Circular Cities: Challenges, Gaps, and Opportunities. Water 2021, 13, 2565. [Google Scholar] [CrossRef]
- Pothukuchi, K.; Kaufman, J.L. Placing the Food System on the Urban Agenda: The Role of Municipal Institutions in Food Systems Planning. Agric. Hum. Values 1999, 16, 213–224. [Google Scholar] [CrossRef]
- Orsini, F.; Gasperi, D.; Marchetti, L.; Piovene, C.; Draghetti, S.; Ramazzotti, S.; Bazzocchi, G.; Gianquinto, G. Exploring the Production Capacity of Rooftop Gardens (RTGs) in Urban Agriculture: The Potential Impact on Food and Nutrition Security, Biodiversity and Other Ecosystem Services in the City of Bologna. Food Secur. 2014, 6, 781–792. [Google Scholar] [CrossRef]
- Eumorfopoulou, E.; Aravantinos, D. The Contribution of a Planted Roof to the Thermal Protection of Buildings in Greece. Energy Build. 1998, 27, 29–36. [Google Scholar] [CrossRef]
- Loder, A. ‘There’s a Meadow outside my Workplace’: A Phenomenological Exploration of Aesthetics and Green Roofs in Chicago and Toronto. Landsc. Urban Plan. 2014, 126, 94–106. [Google Scholar] [CrossRef]
- Yang, J.; Yu, Q.; Gong, P. Quantifying Air Pollution Removal by Green Roofs in Chicago. Atmos. Environ. 2008, 42, 7266–7273. [Google Scholar] [CrossRef]
- VanWoert, N.D.; Rowe, D.B.; Andresen, J.A.; Rugh, C.L.; Fernandez, R.T.; Xiao, L. Green Roof Stormwater Retention. J. Environ. Qual. 2005, 34, 1036–1044. [Google Scholar] [CrossRef]
- Oberndorfer, E.; Lundholm, J.; Bass, B.; Coffman, R.R.; Doshi, H.; Dunnett, N.; Gaffin, S.; Köhler, M.; Liu, K.K.Y.; Rowe, B. Green Roofs as Urban Ecosystems: Ecological Structures, Functions, and Services. BioScience 2007, 57, 823–833. [Google Scholar] [CrossRef]
- Takebayashi, H.; Moriyama, M. Surface Heat Budget on Green Roof and High Reflection Roof for Mitigation of Urban Heat Island. Build. Environ. 2007, 42, 2971–2979. [Google Scholar] [CrossRef] [Green Version]
- Alexandri, E.; Jones, P. Temperature Decreases in an Urban Canyon Due to Green Walls and Green Roofs in Diverse Climates. Build. Environ. 2008, 43, 480–493. [Google Scholar] [CrossRef]
- Getter, K.L.; Rowe, D.B.; Robertson, G.; Cregg, B.M.; Andresen, J.A. Carbon Sequestration Potential of Extensive Green Roofs. Environ. Sci. Technol. 2009, 43, 7564–7570. [Google Scholar] [CrossRef]
- Rowe, D.B. Green Roofs as a Means of Pollution Abatement. Environ. Pollut. 2011, 159, 2100–2110. [Google Scholar] [CrossRef] [Green Version]
- Veisten, K.; Smyrnova, Y.; Klæboe, R.; Hornikx, M.; Mosslemi, M.; Kang, J. Valuation of Green Walls and Green Roofs as Soundscape Measures: Including Monetised Amenity Values Together with Noise-Attenuation Values in a Cost-Benefit Analysis of Green Wall a_Ecting Courtyards. Int. J. Environ. Res. Public Health 2012, 9, 3770–3788. [Google Scholar] [CrossRef] [Green Version]
- Snodgrass, E.E.; McIntyre, L. The Green Roof Manual: A Professional Guide to Design, Installation, and Maintenance. Choice Rev. Online 2011, 48, 48–4481. [Google Scholar] [CrossRef]
- Cengiz, M.S.; Mamiş, M.S. Price-Efficiency Relationship for Photovoltaic Systems on a Global Basis. Int. J. Photoenergy 2015, 2015, 256101. [Google Scholar] [CrossRef] [Green Version]
- Jäger-Waldau, A.; Adinolfi, G.; Batlle, A.; Braun, M.; Bucher, C.; Detollenaere, A.; Frederiksen, K.H.B.; Graditi, G.; Lemus, R.G.; Lindahl, J.; et al. Electricity Produced from Photovoltaic Systems in Apartment Buildings and Self-Consumption: Comparison of the Situation in Various IEA PVPS Countries. In Proceedings of the 2019 IEEE 46th Photovoltaic Specialists Conference (PVSC), Chicago, IL, USA, 16–21 June 2019; pp. 1701–1710. [Google Scholar]
- European Commission. PVGIS Project; Joint Research Centre, Institute for Energy and Transport: Ispra, Italy, 2013; Available online: http://re.jrc.ec.europa.eu/pvgis/solres/solrespvgis.htm (accessed on 15 August 2021).
- Lionello, P.; Malanotte-Rizzoli, P.; Boscolo, R.; Alpert, P.; Artale, V.; Li, L.; Luterbacher, J.; May, W.; Trigo, R.; Tsimplis, M.; et al. The Mediterranean Climate: An Overview of the Main Characteristics and Issues. Dev. Earth Environ. Sci. 2006, 4, 1–26. [Google Scholar]
- Paço, T.A.; De Carvalho, R.C.; Arsénio, P.; Martins, D. Green Roof Design Techniques to Improve Water Use under Mediterranean Conditions. Urban Sci. 2019, 3, 14. [Google Scholar] [CrossRef] [Green Version]
- Goetzberger, A.; Zastrow, A. On the Coexistence of Solar-Energy Conversion and Plant Cultivation. Int. J. Sol. Energy 1982, 1, 55–69. [Google Scholar] [CrossRef]
- Dupraz, C.; Marrou, H.; Talbot, G.; Dufour, L.; Nogier, A.; Ferard, Y. Combining Solar Photovoltaic Panels and Food Crops for Optimising Land Use: Towards New Agrivoltaic Schemes. Renew. Energy 2011, 36, 2725–2732. [Google Scholar] [CrossRef]
- Brudermann, T.; Reinsberger, K.; Orthofer, A.; Kislinger, M.; Posch, A. Photovoltaics in Agriculture: A Case Study on Decision Making of Farmers. Energy Policy 2013, 61, 96–103. [Google Scholar] [CrossRef]
- Mekhilef, S.; Faramarzi, S.Z.; Saidur, R.; Salam, Z. The Application of Solar Technologies for Sustainable Development of Agri-cultural Sector. Renew. Sustain. Energy Rev. 2013, 18, 583–594. [Google Scholar] [CrossRef]
- Marrou, H.; Guilioni, L.; Dufour, L.; Dupraz, C.; Wery, J. Microclimate under Agrivoltaic Systems: Is Crop Growth Rate Affected in the Partial Shade of Solar Panels? Agric. For. Meteorol. 2013, 177, 117–132. [Google Scholar] [CrossRef]
- Dinesh, H.; Pearce, J.M. The Potential of Agrivoltaic Systems. Renew. Sustain. Energy Rev. 2015, 54, 299–308. [Google Scholar] [CrossRef] [Green Version]
- Yano, A.; Cossu, M. Energy Sustainable Greenhouse Crop Cultivation Using Photovoltaic Technologies. Renew. Sustain. Energy Rev. 2019, 109, 116–137. [Google Scholar] [CrossRef]
- Ureña-Sánchez, R.; Callejon-Ferre, A.J.; Pérez-Alonso, J.; Ortega, A.C. Greenhouse Tomato Production with Electricity Generation by Roof-Mounted Flexible Solar Panels. Sci. Agricola 2012, 69, 233–239. [Google Scholar] [CrossRef]
- Marucci, A.; Monarca, D.; Cecchini, M.; Colantoni, A.; Manzo, A.; Cappuccini, A. The Semitransparent Photovoltaic Films for Mediterranean Greenhouse: A New Sustainable Technology. Math. Probl. Eng. 2012, 2012, 451934. [Google Scholar] [CrossRef]
- Cossu, M.; Murgia, L.; Ledda, L.; Deligios, P.A.; Sirigu, A.; Chessa, F.; Pazzona, A. Solar Radiation Distribution inside a Greenhouse with South-Oriented Photovoltaic Roofs and Effects on Crop Productivity. Appl. Energy 2014, 133, 89–100. [Google Scholar] [CrossRef]
- Fatnassi, H.; Poncet, C.; Bazzano, M.M.; Brun, R.; Bertin, N. A Numerical Simulation of the Photovoltaic Greenhouse Microclimate. Sol. Energy 2015, 120, 575–584. [Google Scholar] [CrossRef]
- Carreño-Ortega, A.; Galdeano-Gómez, E.; Pérez-Mesa, J.C.; Galera-Quiles, M.D.C. Policy and Environmental Implications of Photovoltaic Systems in Farming in Southeast Spain: Can Greenhouses Reduce the Greenhouse Effect? Energies 2017, 10, 761. [Google Scholar] [CrossRef] [Green Version]
- Cossu, M.; Cossu, A.; Deligios, P.A.; Ledda, L.; Li, Z.; Fatnassi, H.; Poncet, C.; Yano, A. Assessment and Comparison of the Solar Radiation Distribution inside the Main Commercial Photovoltaic Greenhouse Types in Europe. Renew. Sustain. Energy Rev. 2018, 94, 822–834. [Google Scholar] [CrossRef]
- Yano, A.; Kadowaki, M.; Furue, A.; Tamaki, N.; Tanaka, T.; Hiraki, E.; Kato, Y.; Ishizu, F.; Noda, S. Shading and Electrical Features of a Photovoltaic Array Mounted Inside the Roof of an East-West Oriented Greenhouse. Biosyst. Eng. 2010, 106, 367–377. [Google Scholar] [CrossRef]
- Peretz, M.F.; Geoola, F.; Yehia, I.; Ozer, S.; Levi, A.; Magadley, E.; Brikman, R.; Rosenfeld, L.; Levy, A.; Kacira, M.; et al. Testing Organic Photovoltaic Modules for Application as Greenhouse Cover or Shading Element. Biosyst. Eng. 2019, 184, 24–36. [Google Scholar] [CrossRef]
- Moretti, S.; Marucci, A. A Photovoltaic Greenhouse with Variable Shading for the Optimization of Agricultural and Energy Production. Energies 2019, 12, 2589. [Google Scholar] [CrossRef] [Green Version]
- López-Díaz, G.; Carreño-Ortega, A.; Fatnassi, H.; Poncet, C.; Díaz-Pérez, M. The Effect of Different Levels of Shading in a Photovoltaic Greenhouse with a North–South Orientation. Appl. Sci. 2020, 10, 882. [Google Scholar] [CrossRef] [Green Version]
- Bulgari, R.; Cola, G.; Ferrante, A.; Mariani, L.; Martinetti, L. Micrometeorological Environment in Traditional and Photovoltaic Greenhouses and Effects on Growth and Quality of Tomato (Solanum lycopersicum L). Ital. J. Agrometeorol. 2015, 1054, 27–38. [Google Scholar] [CrossRef]
- Bertin, N.; Fatnassi, H.; Vercambre, G.; Poncet, C. Simulation of Tomato Production under Photovoltaic Greenhouses. Acta Hortic. 2017, 1170, 425–432. [Google Scholar] [CrossRef]
- Aroca-Delgado, R.; Pérez-Alonso, J.; Callejón-Ferre, Á.J.; Velázquez-Martí, B. Compatibility between Crops and Solar Panels: An Overview from Shading Systems. Sustainability 2018, 10, 743. [Google Scholar] [CrossRef] [Green Version]
- Ezzaeri, K.; Fatnassi, H.; Wifaya, A.; Bazgaou, A.; Aharoune, A.; Poncet, C.; Bekkaoui, A.; Bouirden, L. Performance of Photovoltaic Canarian Greenhouse: A Comparison Study between Summer and Winter Seasons. Sol. Energy 2020, 198, 275–282. [Google Scholar] [CrossRef]
- Ezzaeri, K.; Fatnassi, H.; Bouharroud, R.; Gourdo, L.; Bazgaou, A.; Wifaya, A.; Demrati, H.; Bekkaoui, A.; Aharoune, A.; Poncet, C.; et al. The Effect of Photovoltaic Panels on the Microclimate and on the Tomato Production under Photovoltaic Canarian Greenhouses. Sol. Energy 2018, 173, 1126–1134. [Google Scholar] [CrossRef]
- Bousselot, J. Rooftop Agrivoltaics, University of Colorado State, Ted Talks. 2020. Available online: https://www.youtube.com/watch?v=pobj34HuHO8 (accessed on 2 August 2021).
- Appolloni, E.; Orsini, F.; Specht, K.; Thomaier, S.; Sanyé-Mengual, E.; Pennisi, G.; Gianquinto, G. The Global Rise of urban Rooftop Agriculture: A Review of Worldwide Cases. J. Clean. Prod. 2021, 296, 126556. [Google Scholar] [CrossRef]
- Montgomery, D.C. Design and Analysis of Experiments; John Wiley&Sons: Hoboken, NJ, USA, 2017. [Google Scholar]
- Perna, A.; Grubbs, E.K.; Agrawal, R.; Bermel, P. Design Considerations for Agrophotovoltaic Systems: Maintaining PV Area with Increased Crop Yield. In Proceedings of the 2019 IEEE 46th Photovoltaic Specialists Conference (PVSC), Chicago, IL, USA, 16–21 June 2019; pp. 0668–0672. [Google Scholar] [CrossRef]
- Marrou, H.; Wery, J.; Dufour, L.; Dupraz, C. Productivity and Radiation use Efficiency of Lettuces Grown in the Partial Shade of Photovoltaic Panels. Eur. J. Agron. 2013, 44, 54–66. [Google Scholar] [CrossRef]
- Martínez-Nicolás, M.; Robles-Martínez, M.L.; Pliego-Marín, L.; Aragón-Robles, E.; Heinrich, L.; Lopez-Baltazar, J. Efecto Del Sombreado Sobre El Crecimiento, Rendimiento Y Contenido De Clorofila En Plantas De Lechuga Hidropónica. In Proceedings of the XV Congreso Internacional En Ciencias Hortícolas, Mexicali, Baja California, Mexico, 25–26 October 2012; p. 276. [Google Scholar]
- Sekiyama, T.; Nagashima, A. Solar Sharing for Both Food and Clean Energy Production: Performance of Agrivoltaic Systems for Corn, A Typical Shade-Intolerant Crop. Environments 2019, 6, 65. [Google Scholar] [CrossRef] [Green Version]
- Cometti, N.N.; da Silva, J.V.; Zonta, E.; Cessa, R.M. Evaluation of Photosynthetic Photon Flux in Lettuce Cultivation at Different Shading Levels. Hortic. Bras. 2020, 38, 65–70. [Google Scholar] [CrossRef]
- Carini, F.; Filho, A.C.; Kleinpaul, J.A.; Neu, I.M.M.; Silveira, D.L.; Pacheco, M.; Andriolo, J.L. Agronomic Performance of Lettuce Cultivars in Different Seasons and Shading Conditions. Idesia 2020, 38, 47–58. [Google Scholar] [CrossRef]
- Jahanfar, A.; Drake, J.; Sleep, B.; Margolis, L. Evaluating the Shading Effect of Photovoltaic Panels on Green Roof Discharge Reduction and Plant Growth. J. Hydrol. 2018, 568, 919–928. [Google Scholar] [CrossRef]
- Casierra-Posada, F. Photoinhibition: Physiological Response of Plants to High-Irradiance Stress. A Review. Rev. Colomb. Cienc. Hort. 2011, 1, 114–123. [Google Scholar] [CrossRef] [Green Version]
- Seginer, I.; Shina, G.; Albright, L.D.; Marsh, L.S. Optimal Temperature Setpoints for Greenhouse Lettuce. J. Agric. Eng. Res. 1991, 49, 209–226. [Google Scholar] [CrossRef]
- Fujii, R.; Yamano, N.; Hashimoto, H.; Misawa, N.; Ifuku, K. Photoprotection vs. Photoinhibition of Photosystem II in Transplastomic Lettuce (Lactuca sativa) Dominantly Accumulating Astaxanthin. Plant Cell Physiol. 2015, 57, pcv187. [Google Scholar] [CrossRef] [PubMed] [Green Version]
- Chemisana, D.; Lamnatou, C. Photovoltaic-Green Roofs: An Experimental Evaluation of System Performance. Appl. Energy 2014, 119, 246–256. [Google Scholar] [CrossRef]
- Alshayeb, M.J.; Chang, J.D. Variations of PV Panel Performance Installed over a Vegetated Roof and a Conventional Black Roof. Energies 2018, 11, 1110. [Google Scholar] [CrossRef] [Green Version]
- Bilčík, M.; Božiková, M.; Čimo, J. Influence of Roof Installation of PV Modules on the Microclimate Conditions of Cattle Breeding Objects. Appl. Sci. 2021, 11, 2140. [Google Scholar] [CrossRef]
Figure 1.
Experimental design. SS (Scattered shade), CS (Concentrated shade), FS (Full Sun), R (treatment replication), BPN (Bird proof net), PAR (quantum PAR sensor, within a discontinuous line indicated below the panel), TM (Thermometer).
Figure 1.
Experimental design. SS (Scattered shade), CS (Concentrated shade), FS (Full Sun), R (treatment replication), BPN (Bird proof net), PAR (quantum PAR sensor, within a discontinuous line indicated below the panel), TM (Thermometer).

Figure 2.
Aerial photograph of the experimental design.

Figure 3.
Maximun and minimum temperatures during May–June–July (°C).

Figure 4.
UVI (Ultra Violet Index) and daily irradiance during May–June–July (MJ m−2).

Figure 5.
Average daily values of photosynthetically active radiation (PAR) and errors, during May–June–July (μmol m−2 s−1). Different letters indicate significant differences, with ANOVA significance level α = 0.05. (CS) Concentrated shadow treatment. (SS) Scattered shadow treatment. (FS) Full sun treatment.

Figure 6.
Monthly daily average evolution of photosynthetically active radiation (PAR) during May-June-July (μmol m−2 s−1). (a) Concentrated shadow treatment. (b) Scattered shadow treatment. (c) Full sun treatment.
Figure 6.
Monthly daily average evolution of photosynthetically active radiation (PAR) during May-June-July (μmol m−2 s−1). (a) Concentrated shadow treatment. (b) Scattered shadow treatment. (c) Full sun treatment.

Figure 7.
Average lettuce fresh weight (g) and errors, during spring and summer season. Different letters indicate significance differences, with ANOVA significance level α = 0.05. (CS) Concentrated shadow treatment. (SS) Scattered shadow treatment. (FS) Full sun treatment.
Figure 7.
Average lettuce fresh weight (g) and errors, during spring and summer season. Different letters indicate significance differences, with ANOVA significance level α = 0.05. (CS) Concentrated shadow treatment. (SS) Scattered shadow treatment. (FS) Full sun treatment.

Figure 8.
Average lettuce number of leaves (n) and errors during spring and summer season. Different letters indicate significance differences, with ANOVA significance level α = 0.05. (CS) Concentrated shadow treatment. (SS) Scattered shadow treatment. (FS) Full sun treatment.
Figure 8.
Average lettuce number of leaves (n) and errors during spring and summer season. Different letters indicate significance differences, with ANOVA significance level α = 0.05. (CS) Concentrated shadow treatment. (SS) Scattered shadow treatment. (FS) Full sun treatment.

Figure 9.
Average lettuce maximun length of the leaves (cm) and errors, during spring and summer seasons. Different letters indicate significance differences, with ANOVA significance level α = 0.05. (CS) Concentrated shadow treatment. (SS) Scattered shadow treatment. (FS) Full sun treatment.
Figure 9.
Average lettuce maximun length of the leaves (cm) and errors, during spring and summer seasons. Different letters indicate significance differences, with ANOVA significance level α = 0.05. (CS) Concentrated shadow treatment. (SS) Scattered shadow treatment. (FS) Full sun treatment.

Figure 10.
Average lettuce roots dry matter (g) and errors, during spring and summer seasons. Different letters indicate significance differences, with ANOVA significance level α = 0.05. (CS) Concentrated shadow treatment. (SS) Scattered shadow treatment. (FS) Full sun treatment.
Figure 10.
Average lettuce roots dry matter (g) and errors, during spring and summer seasons. Different letters indicate significance differences, with ANOVA significance level α = 0.05. (CS) Concentrated shadow treatment. (SS) Scattered shadow treatment. (FS) Full sun treatment.

Figure 11.
Lettuce plants dry matter results for the spring and summer cycles: (a) percentage (%); (b) mass (g). (CS) Concentrated shadow treatment. (SS) Scattered shadow treatment. (FS) Full sun treatment.
Figure 11.
Lettuce plants dry matter results for the spring and summer cycles: (a) percentage (%); (b) mass (g). (CS) Concentrated shadow treatment. (SS) Scattered shadow treatment. (FS) Full sun treatment.

Figure 12.
Comparison between levels of radiation input (PPFD) PAR and resulting lettuce fresh weight for each treatment, during spring and summer seasons. (CS) Concentrated shadow treatment. (SS) Scattered shadow treatment. (FS) Full sun treatment.
Figure 12.
Comparison between levels of radiation input (PPFD) PAR and resulting lettuce fresh weight for each treatment, during spring and summer seasons. (CS) Concentrated shadow treatment. (SS) Scattered shadow treatment. (FS) Full sun treatment.

Figure 13.
Comparison between levels of radiation input (PPFD) PAR and resulting height of the lettuces for each treatment, during spring and summer seasons. (CS) Concentrated shadow treatment. (SS) Scattered shadow treatment. (FS) Full sun treatment.
Figure 13.
Comparison between levels of radiation input (PPFD) PAR and resulting height of the lettuces for each treatment, during spring and summer seasons. (CS) Concentrated shadow treatment. (SS) Scattered shadow treatment. (FS) Full sun treatment.


Table 1.
Multifactorial ANOVA and LSD test. Different letters indicate significance differences, with ANOVA significance level α = 0.05.
Table 1.
Multifactorial ANOVA and LSD test. Different letters indicate significance differences, with ANOVA significance level α = 0.05.
| Fresh Weight (g) | Dry Matter (%) | Number of Leaves (n) | Maximum Length (cm) | Root Dry Matter (g) | |
|---|---|---|---|---|---|
| A: season | |||||
| Spring | 111.0a | 9.3b | 40.2a | 18.3a | 8.9a |
| Summer | 82.9b | 9.6a | 35.1b | 14.9b | 5.1b |
| p-value | 0 | 0.0444 | 0 | 0 | 0 |
| B: treatment | |||||
| CS | 85.8b | 9.5b | 35.0b | 15.4b | 5.3b |
| SS | 130.9a | 8.1c | 44.2a | 19.9a | 8.1c |
| FS | 74.1c | 10.6a | 33.9b | 14.3b | 4.6a |
| p-value | 0 | 0 | 0 | 0 | 0 |
| Interactions | |||||
| AB | 0.5995 | 0.0315 | 0.2337 | 0.8405 | 0.5071 |
Publisher’s Note: MDPI stays neutral with regard to jurisdictional claims in published maps and institutional affiliations. |
© 2021 by the authors. Licensee MDPI, Basel, Switzerland. This article is an open access article distributed under the terms and conditions of the Creative Commons Attribution (CC BY) license (https://creativecommons.org/licenses/by/4.0/).
Share and Cite
MDPI and ACS Style
Carreño-Ortega, A.; do Paço, T.A.; Díaz-Pérez, M.; Gómez-Galán, M. Lettuce Production under Mini-PV Modules Arranged in Patterned Designs. Agronomy 2021, 11, 2554. https://0-doi-org.brum.beds.ac.uk/10.3390/agronomy11122554
AMA Style
Carreño-Ortega A, do Paço TA, Díaz-Pérez M, Gómez-Galán M. Lettuce Production under Mini-PV Modules Arranged in Patterned Designs. Agronomy. 2021; 11(12):2554. https://0-doi-org.brum.beds.ac.uk/10.3390/agronomy11122554
Chicago/Turabian StyleCarreño-Ortega, Angel, Teresa A. do Paço, Manuel Díaz-Pérez, and Marta Gómez-Galán. 2021. "Lettuce Production under Mini-PV Modules Arranged in Patterned Designs" Agronomy 11, no. 12: 2554. https://0-doi-org.brum.beds.ac.uk/10.3390/agronomy11122554
Note that from the first issue of 2016, this journal uses article numbers instead of page numbers. See further details here.