Analysis of the Content Values of Sweet Maize (Zea mays L. Convar Saccharata Koern) in Precision Farming

 ,
,  and
and 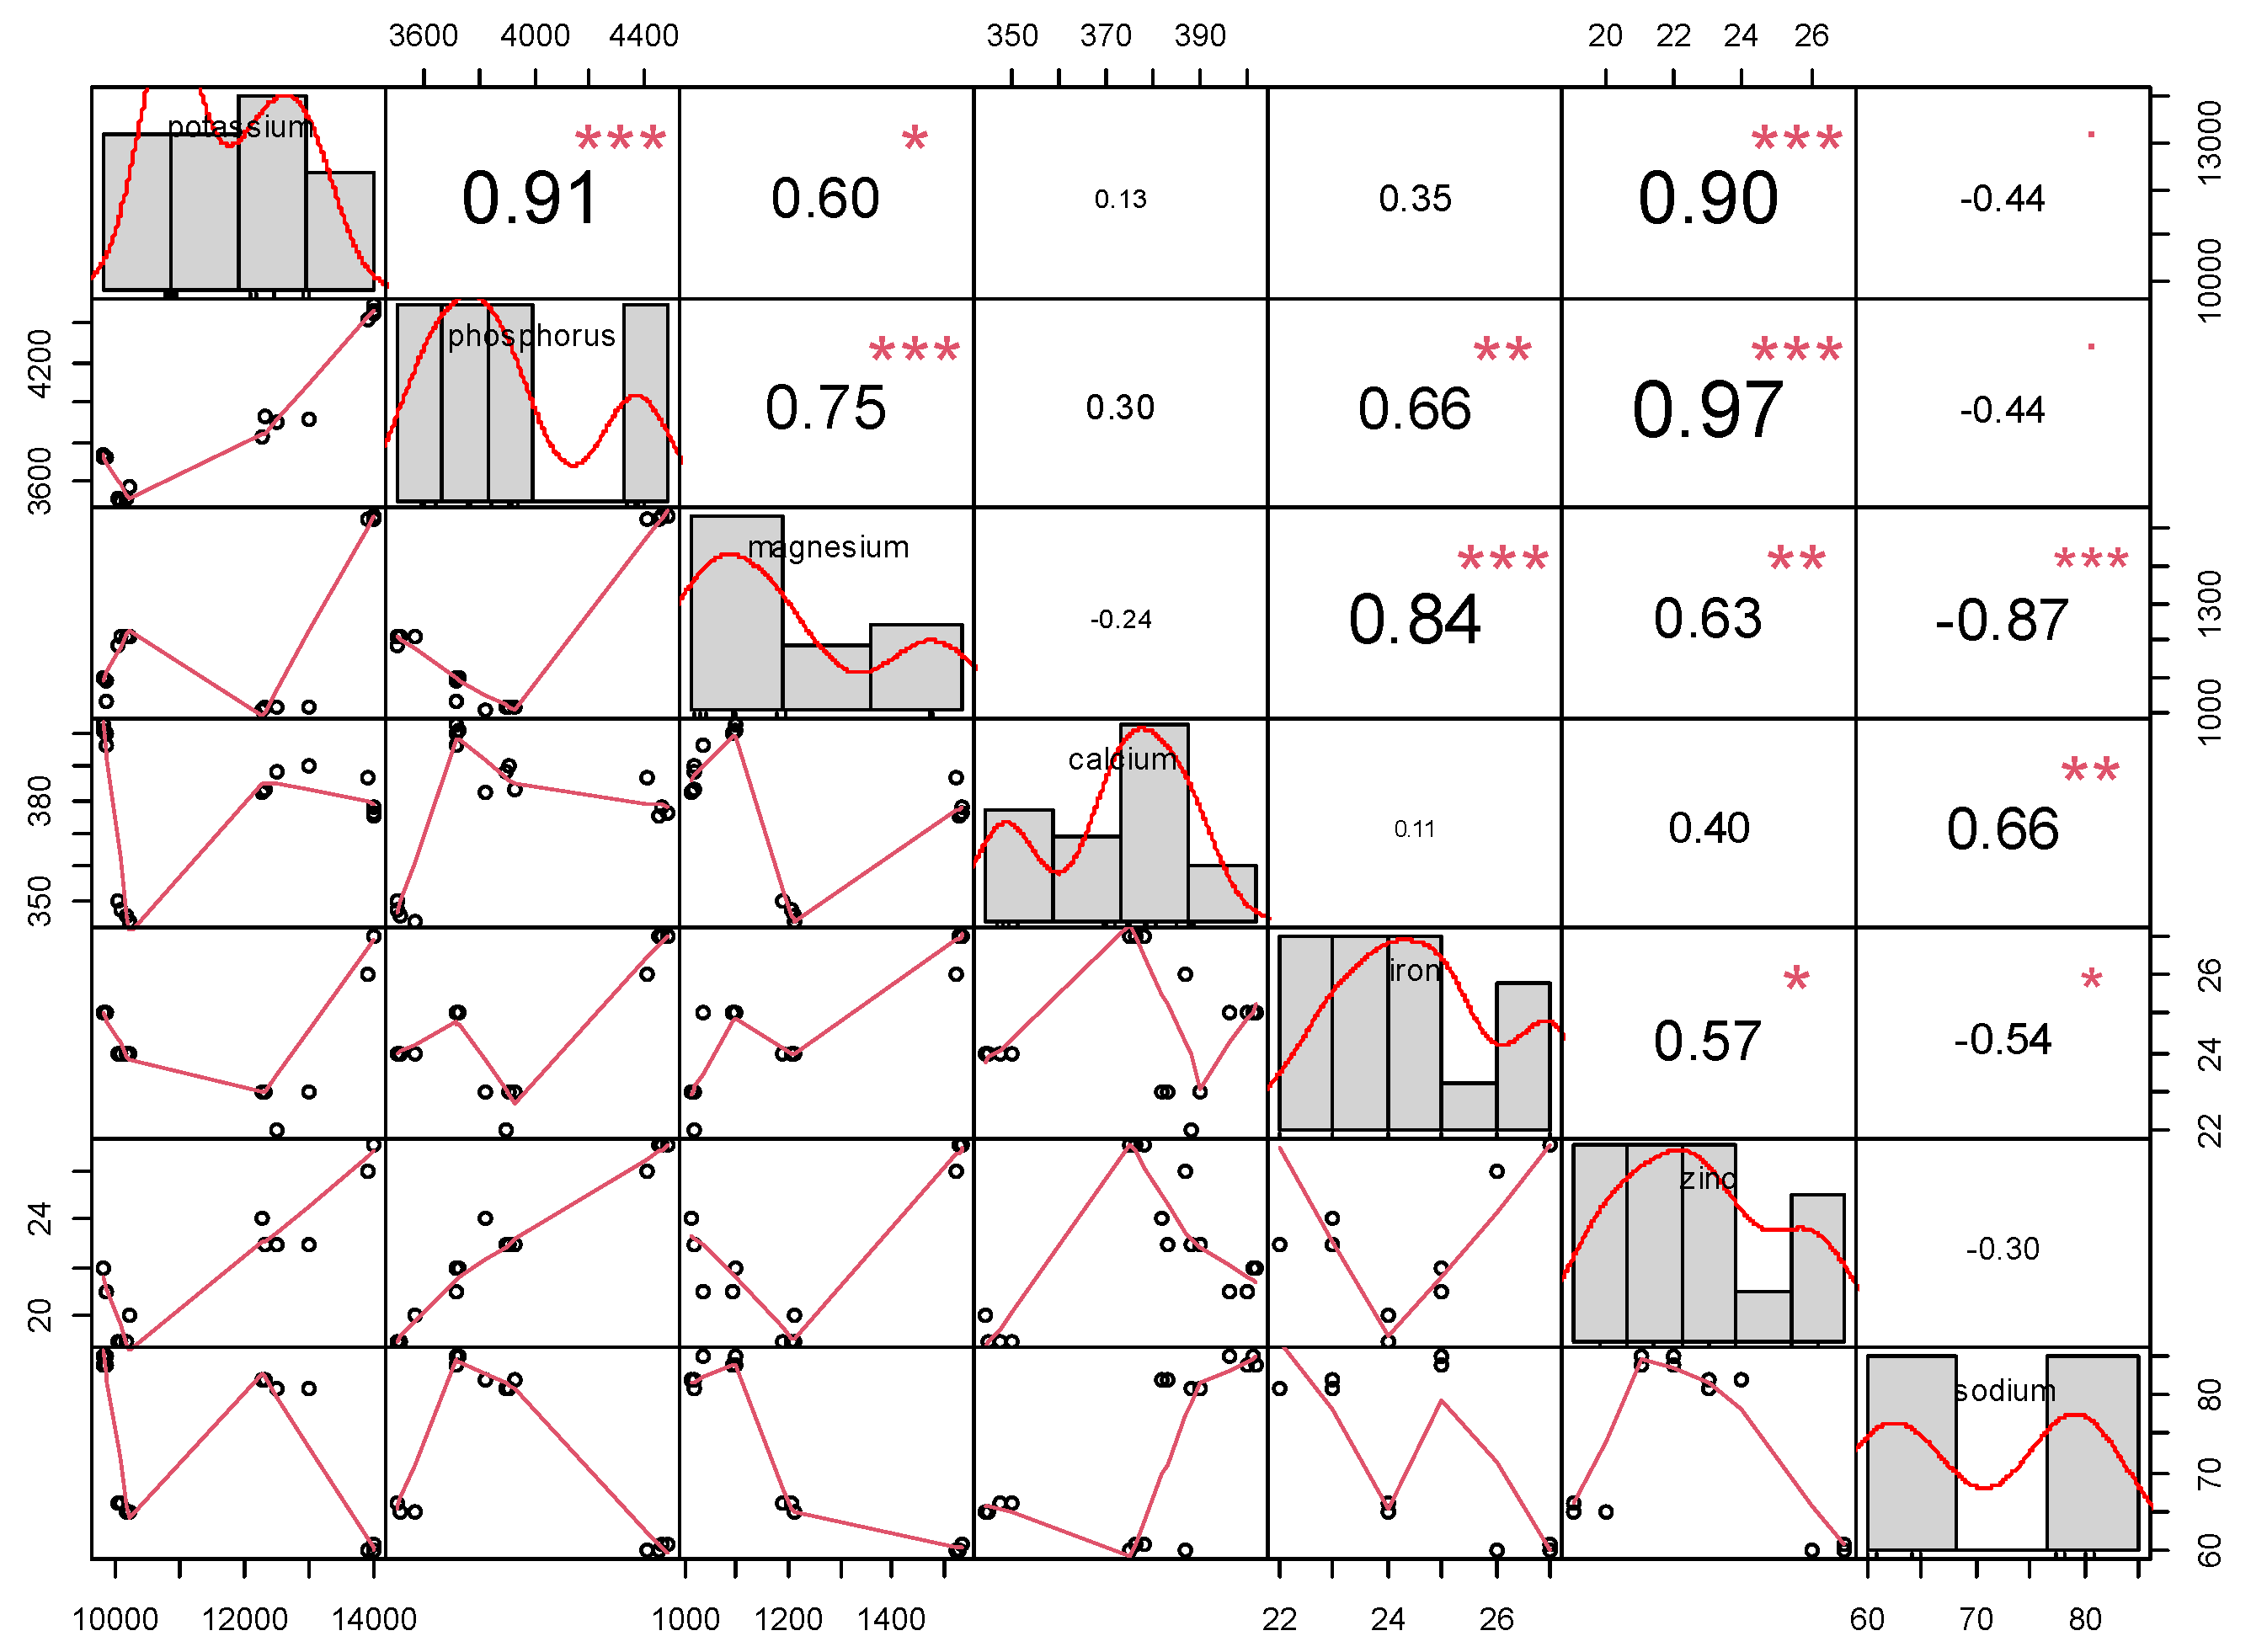
Abstract
:1. Introduction
2. Materials and Methods
2.1. Site Description
2.2. Laboratory Testing Methodology
2.3. Statistical Analysis
3. Results
3.1. Correlation Analysis
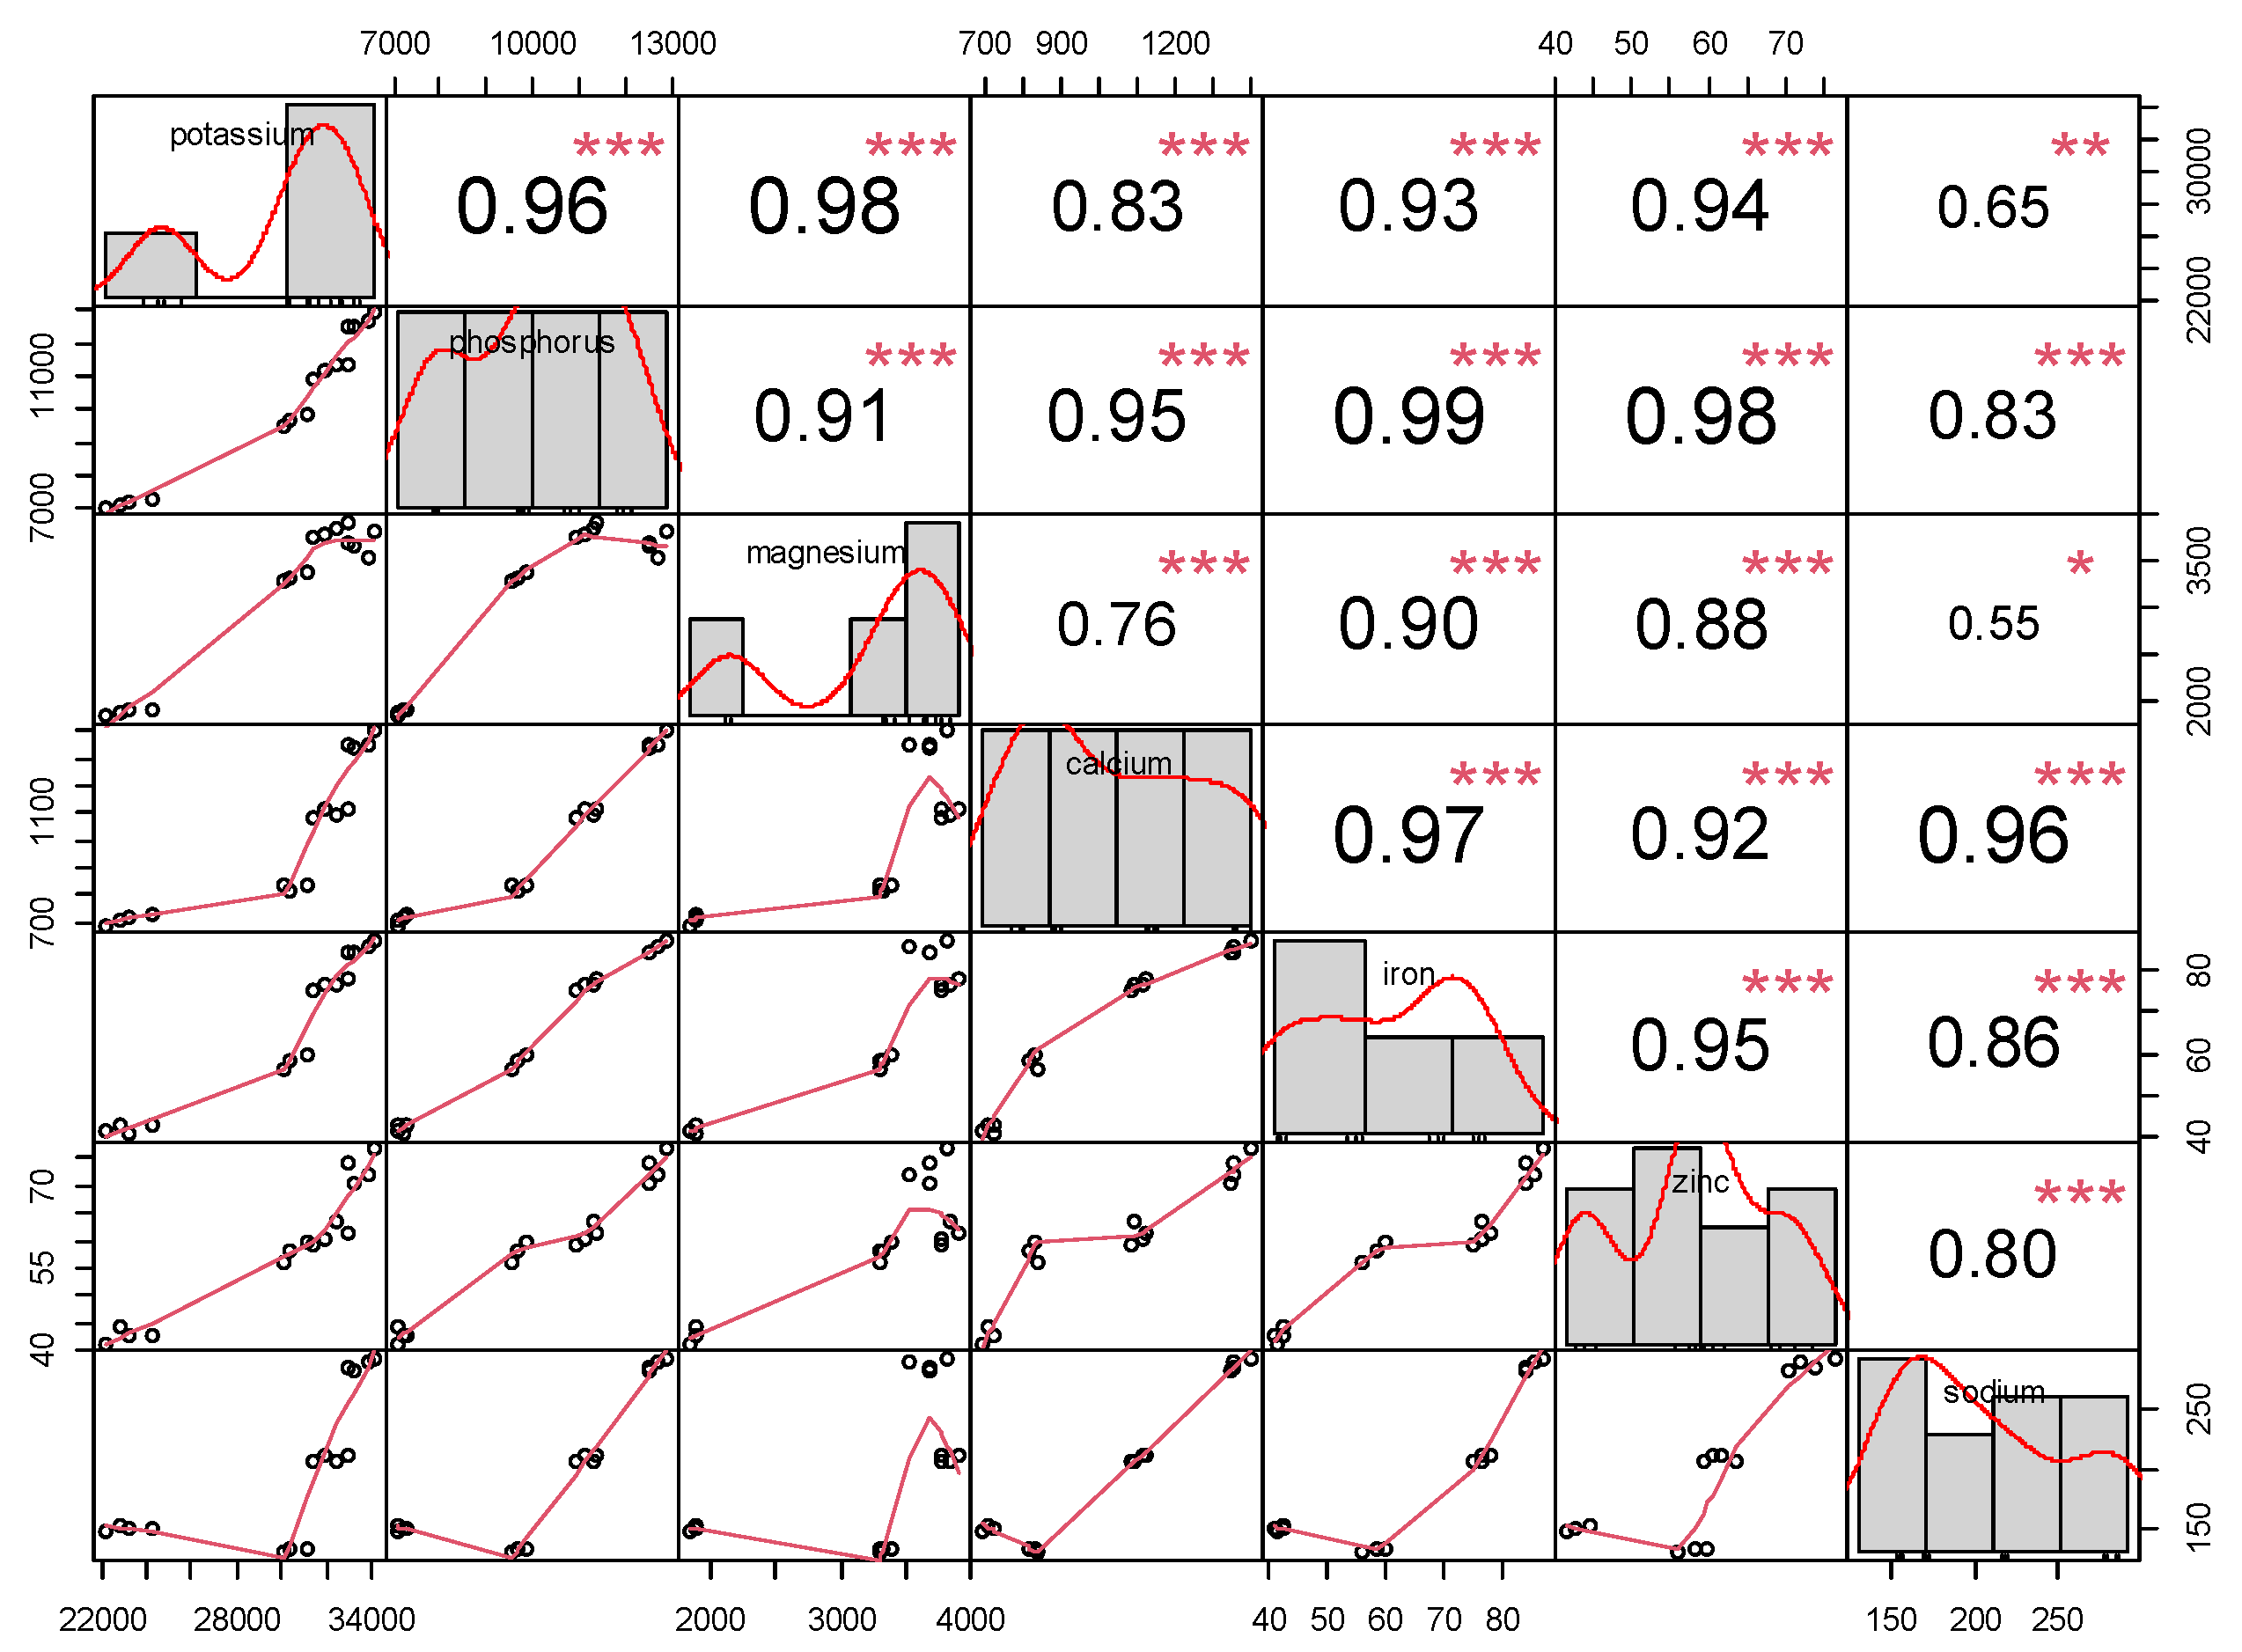
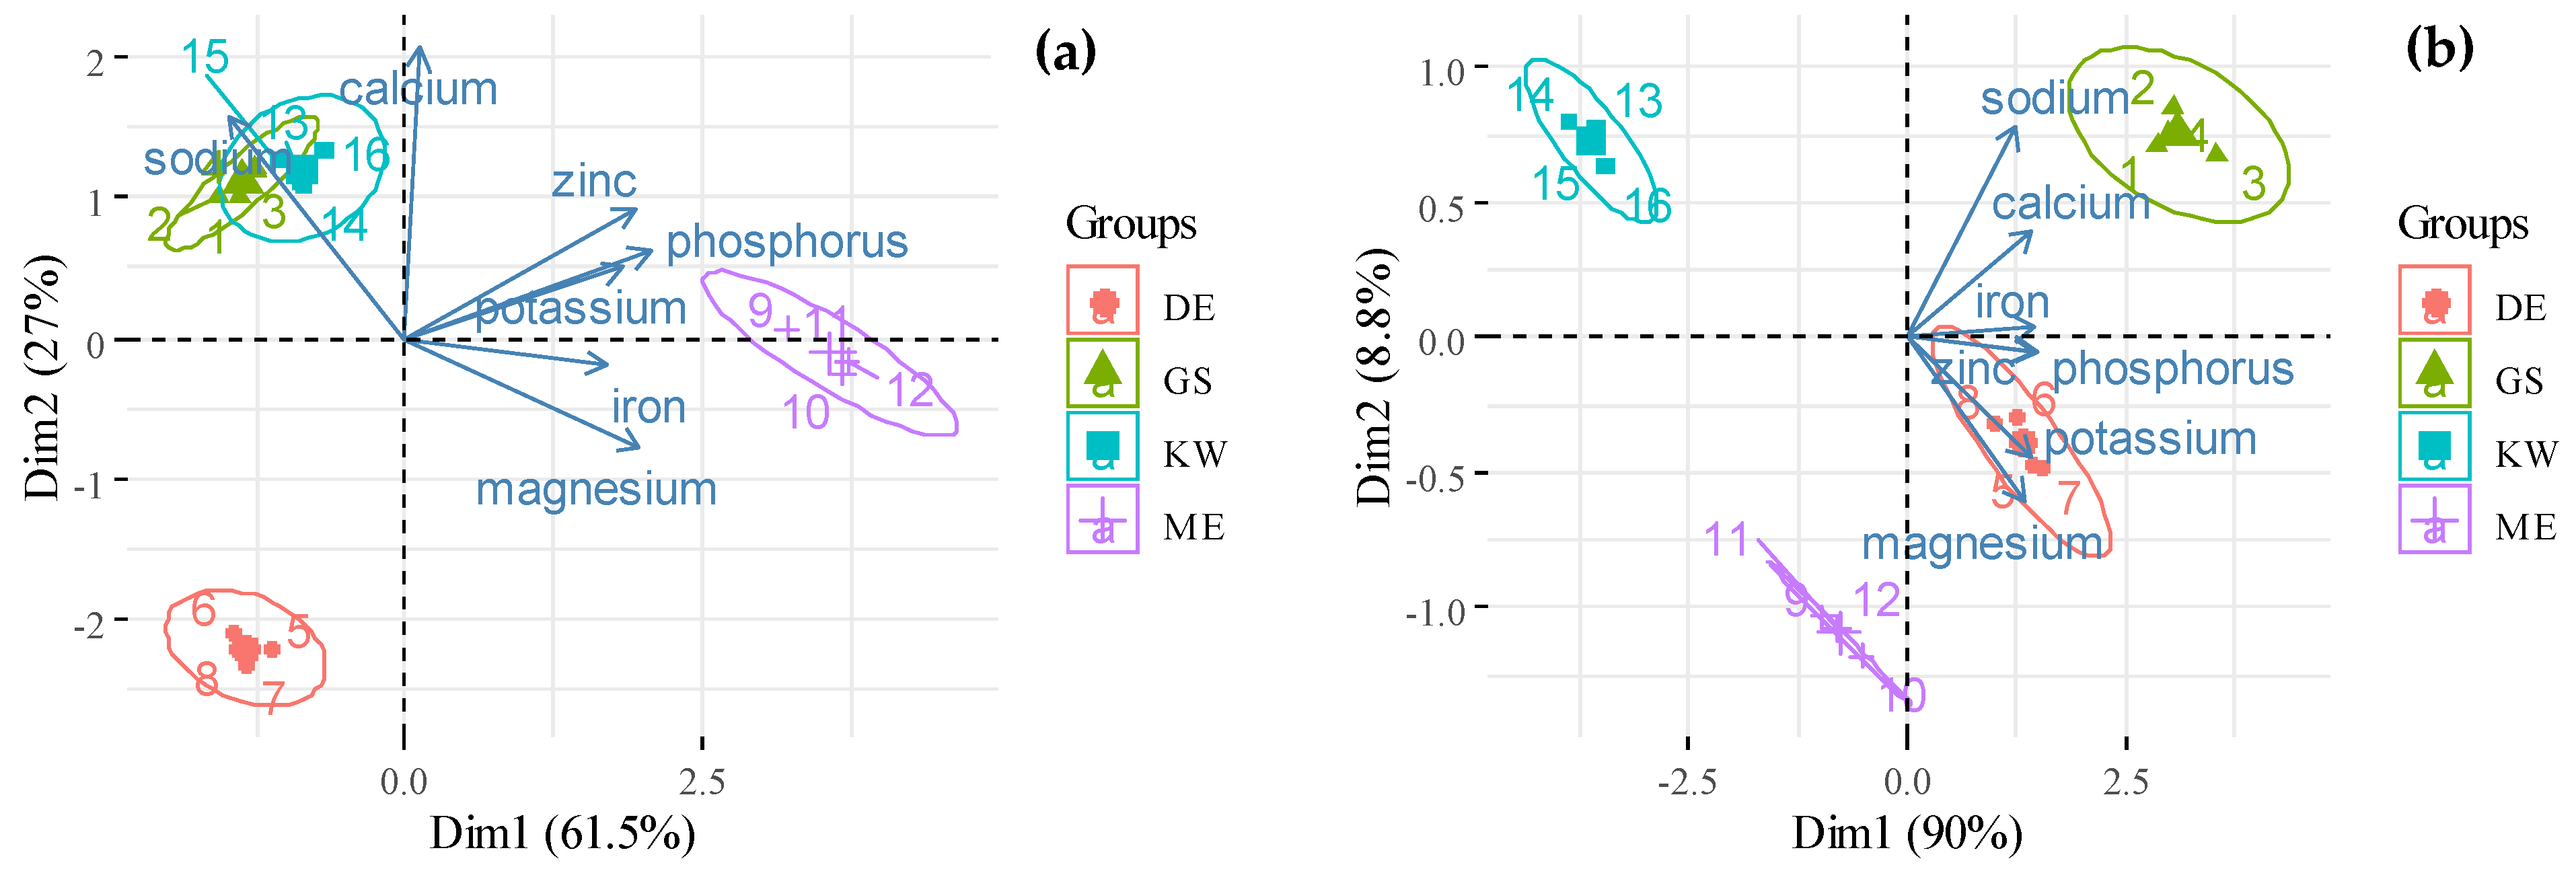
3.1.1. Inorganic Substances, Macro- and Microelements
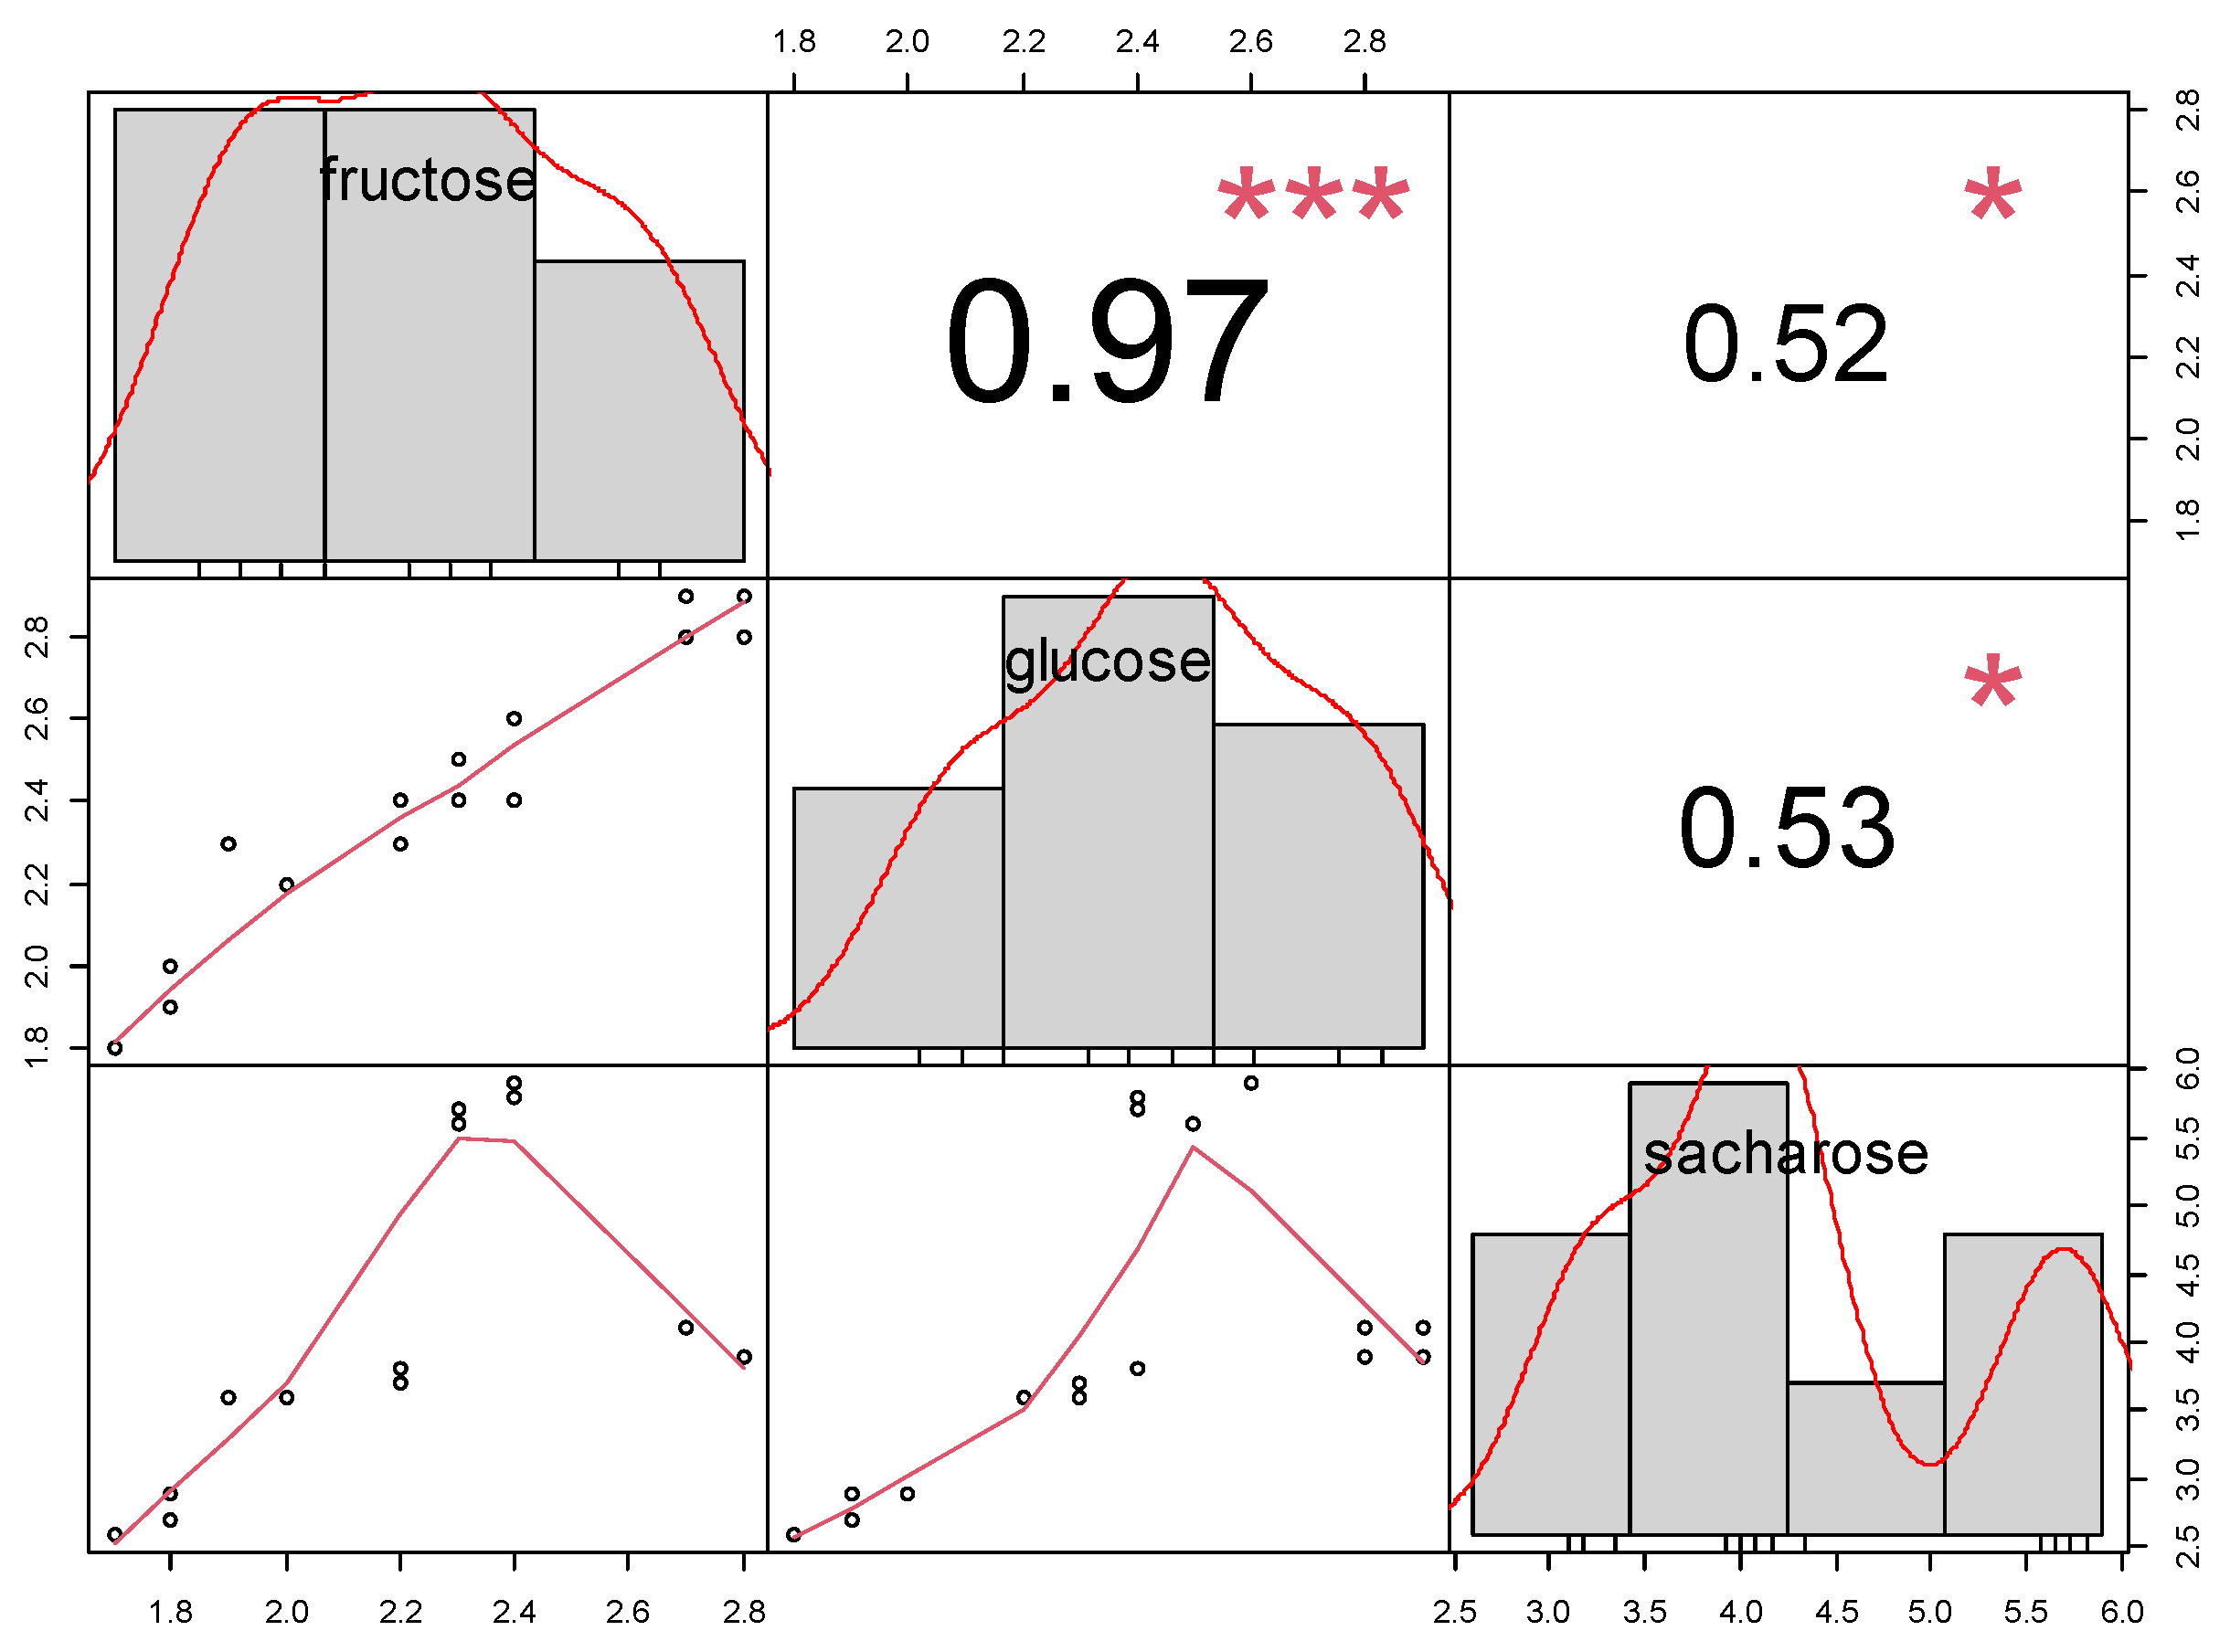
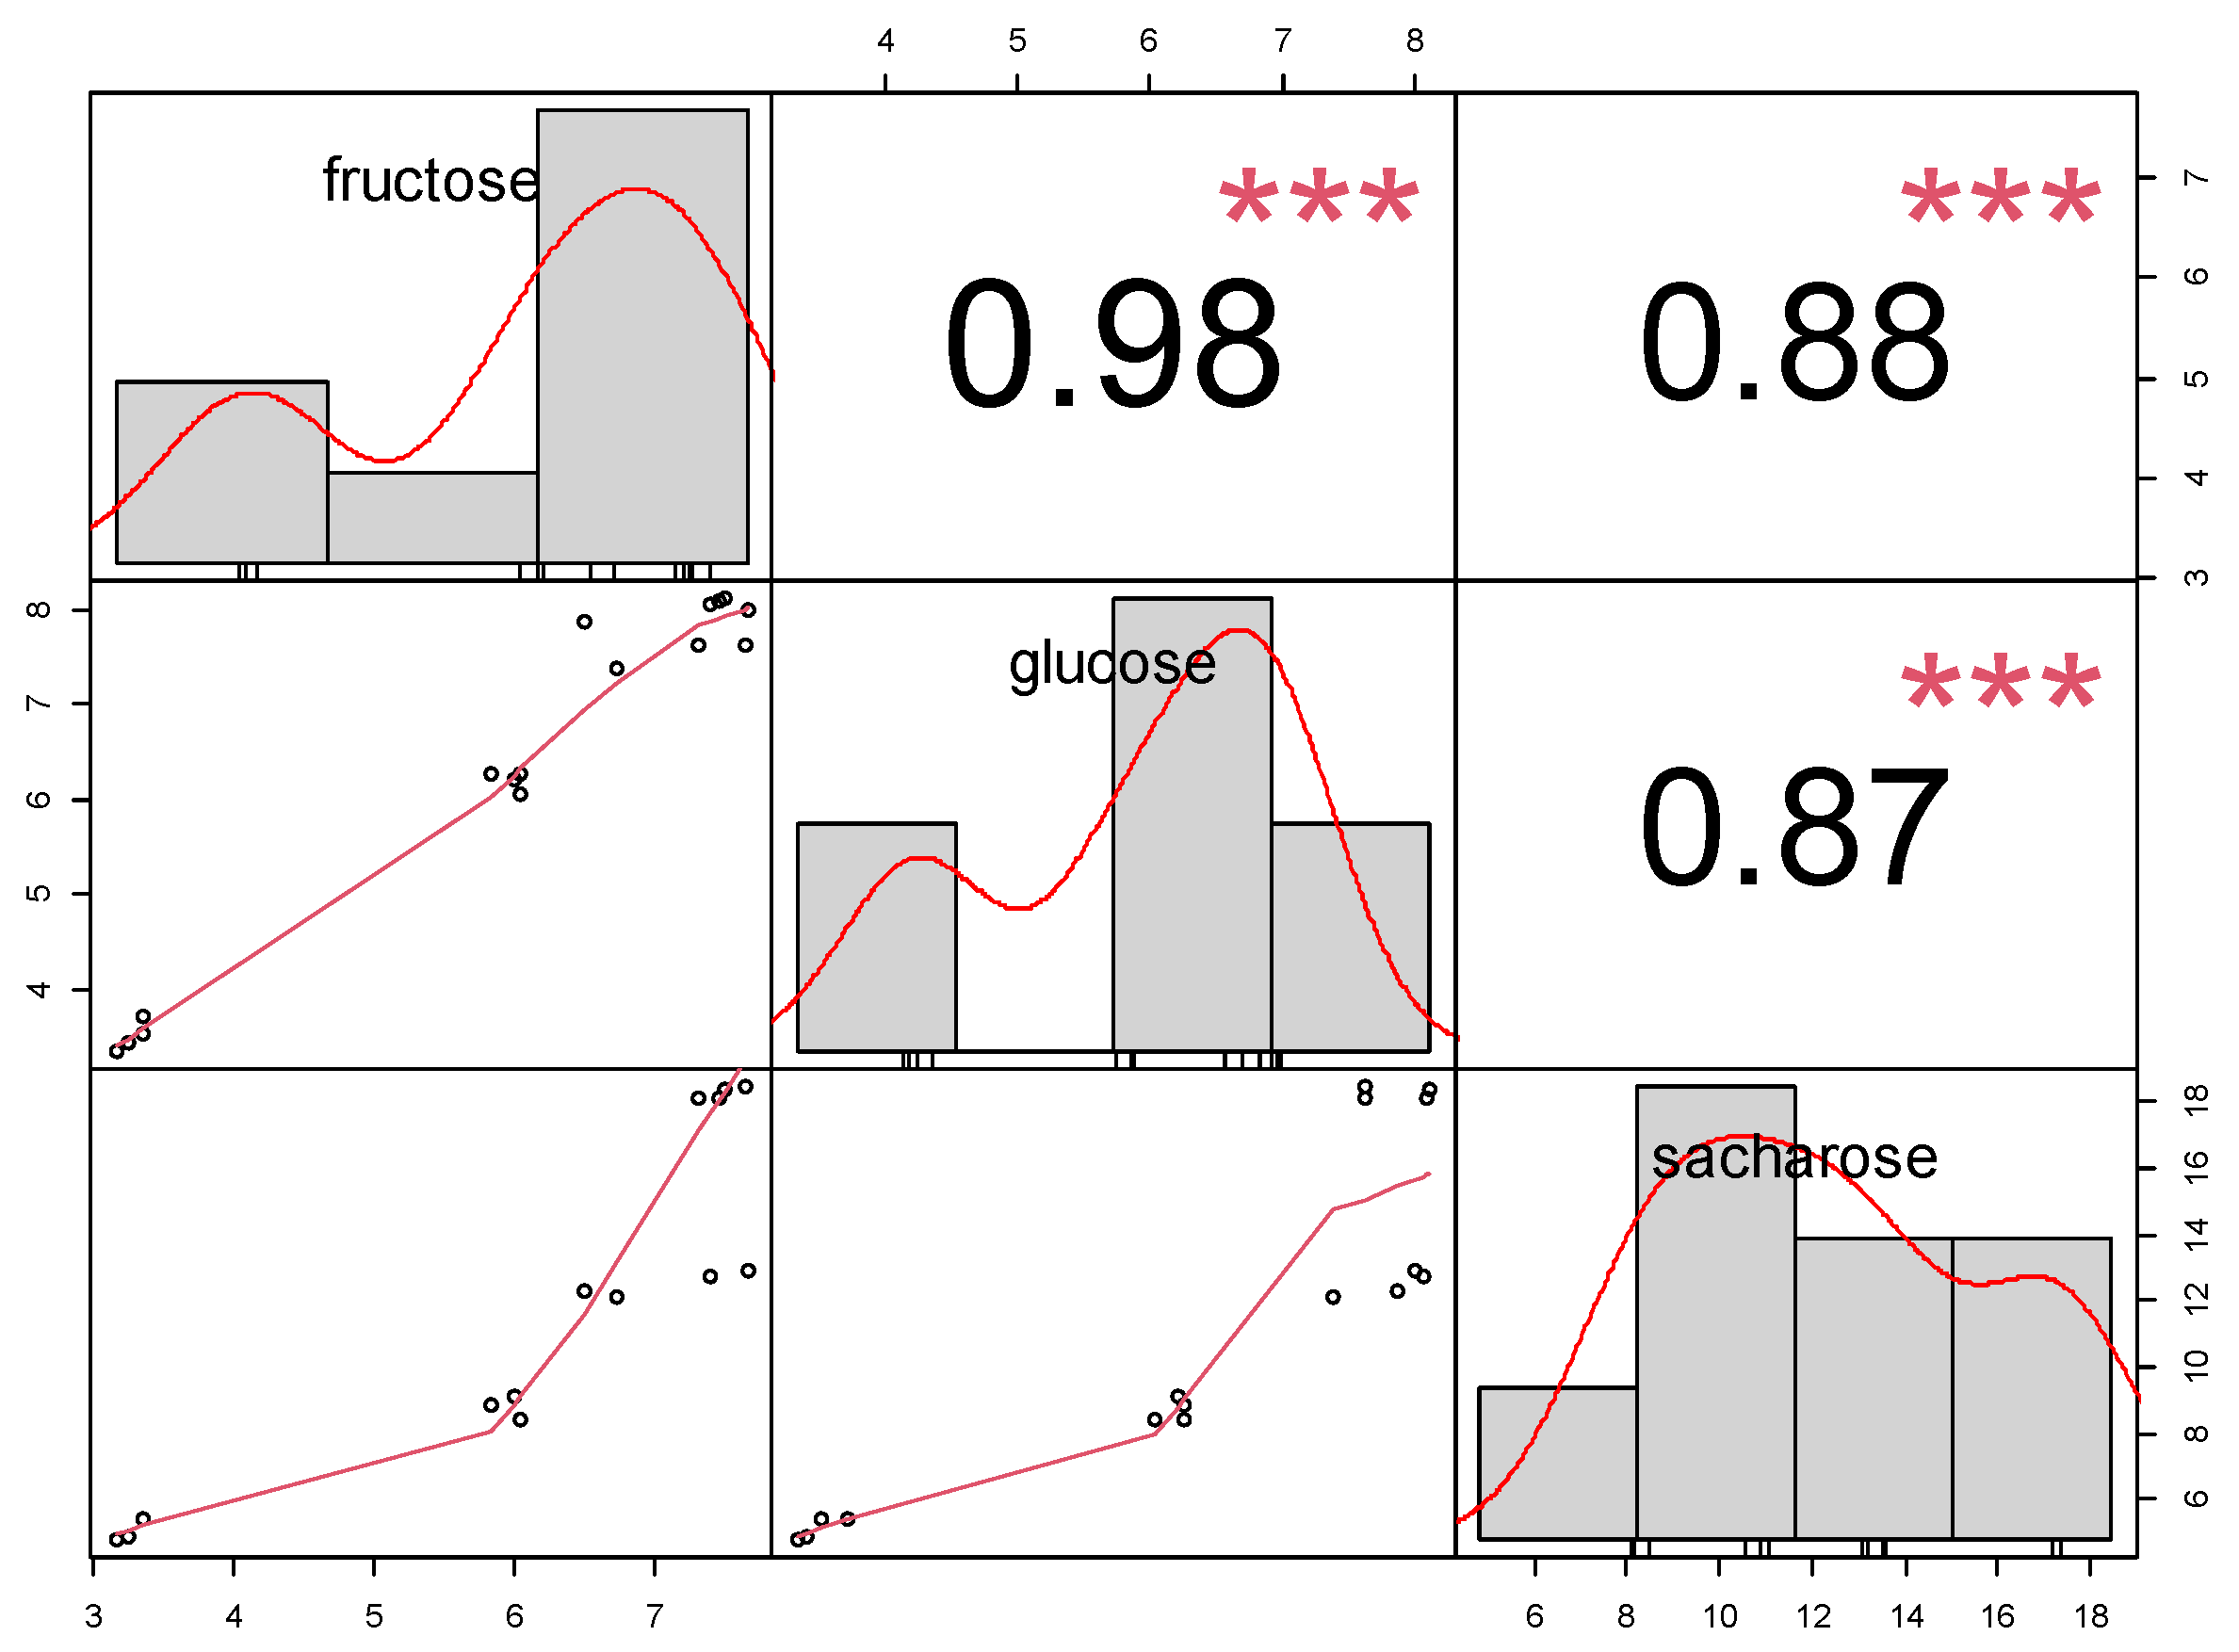
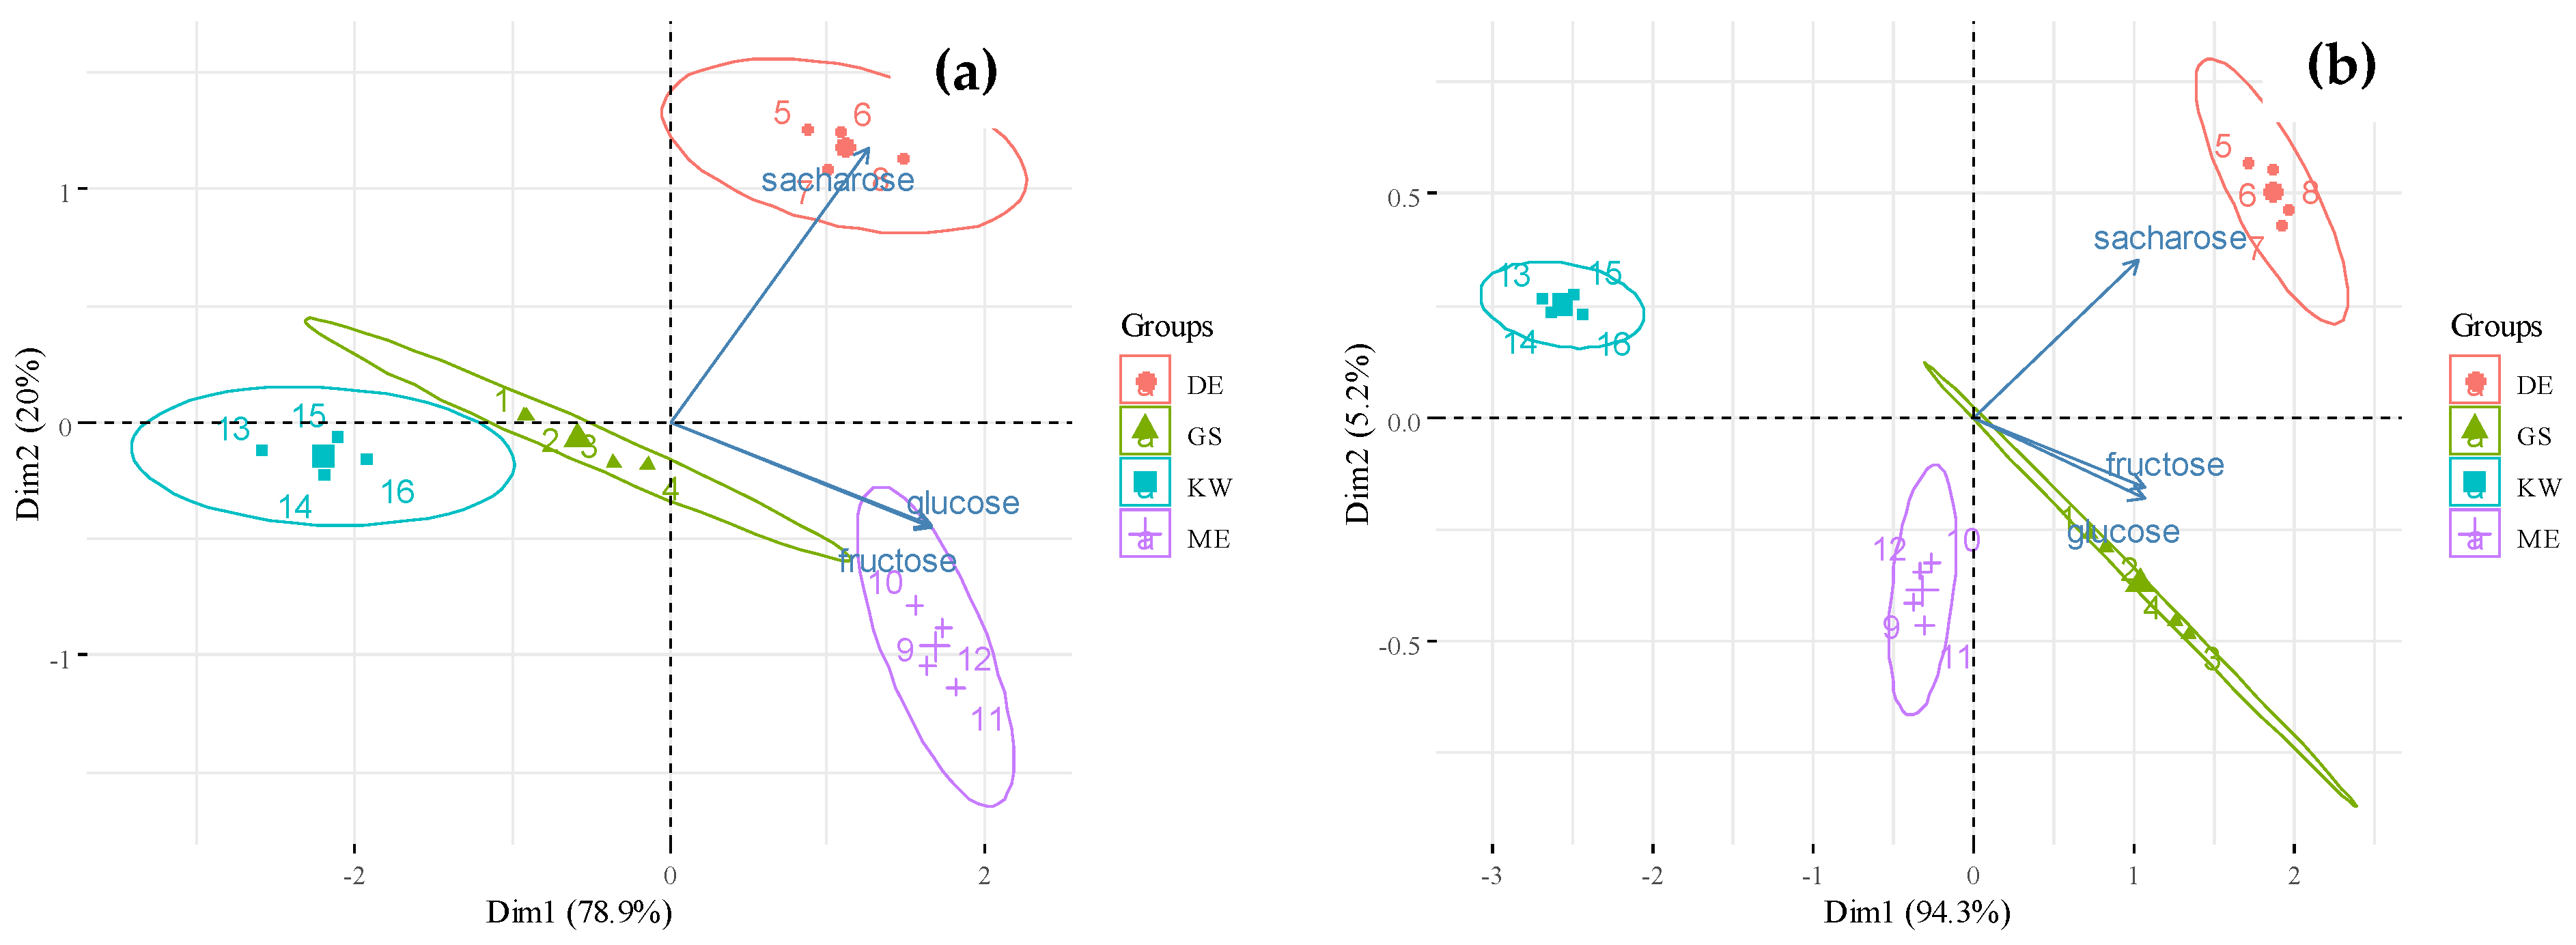
3.1.2. Fructose, Glucose, Sucrose
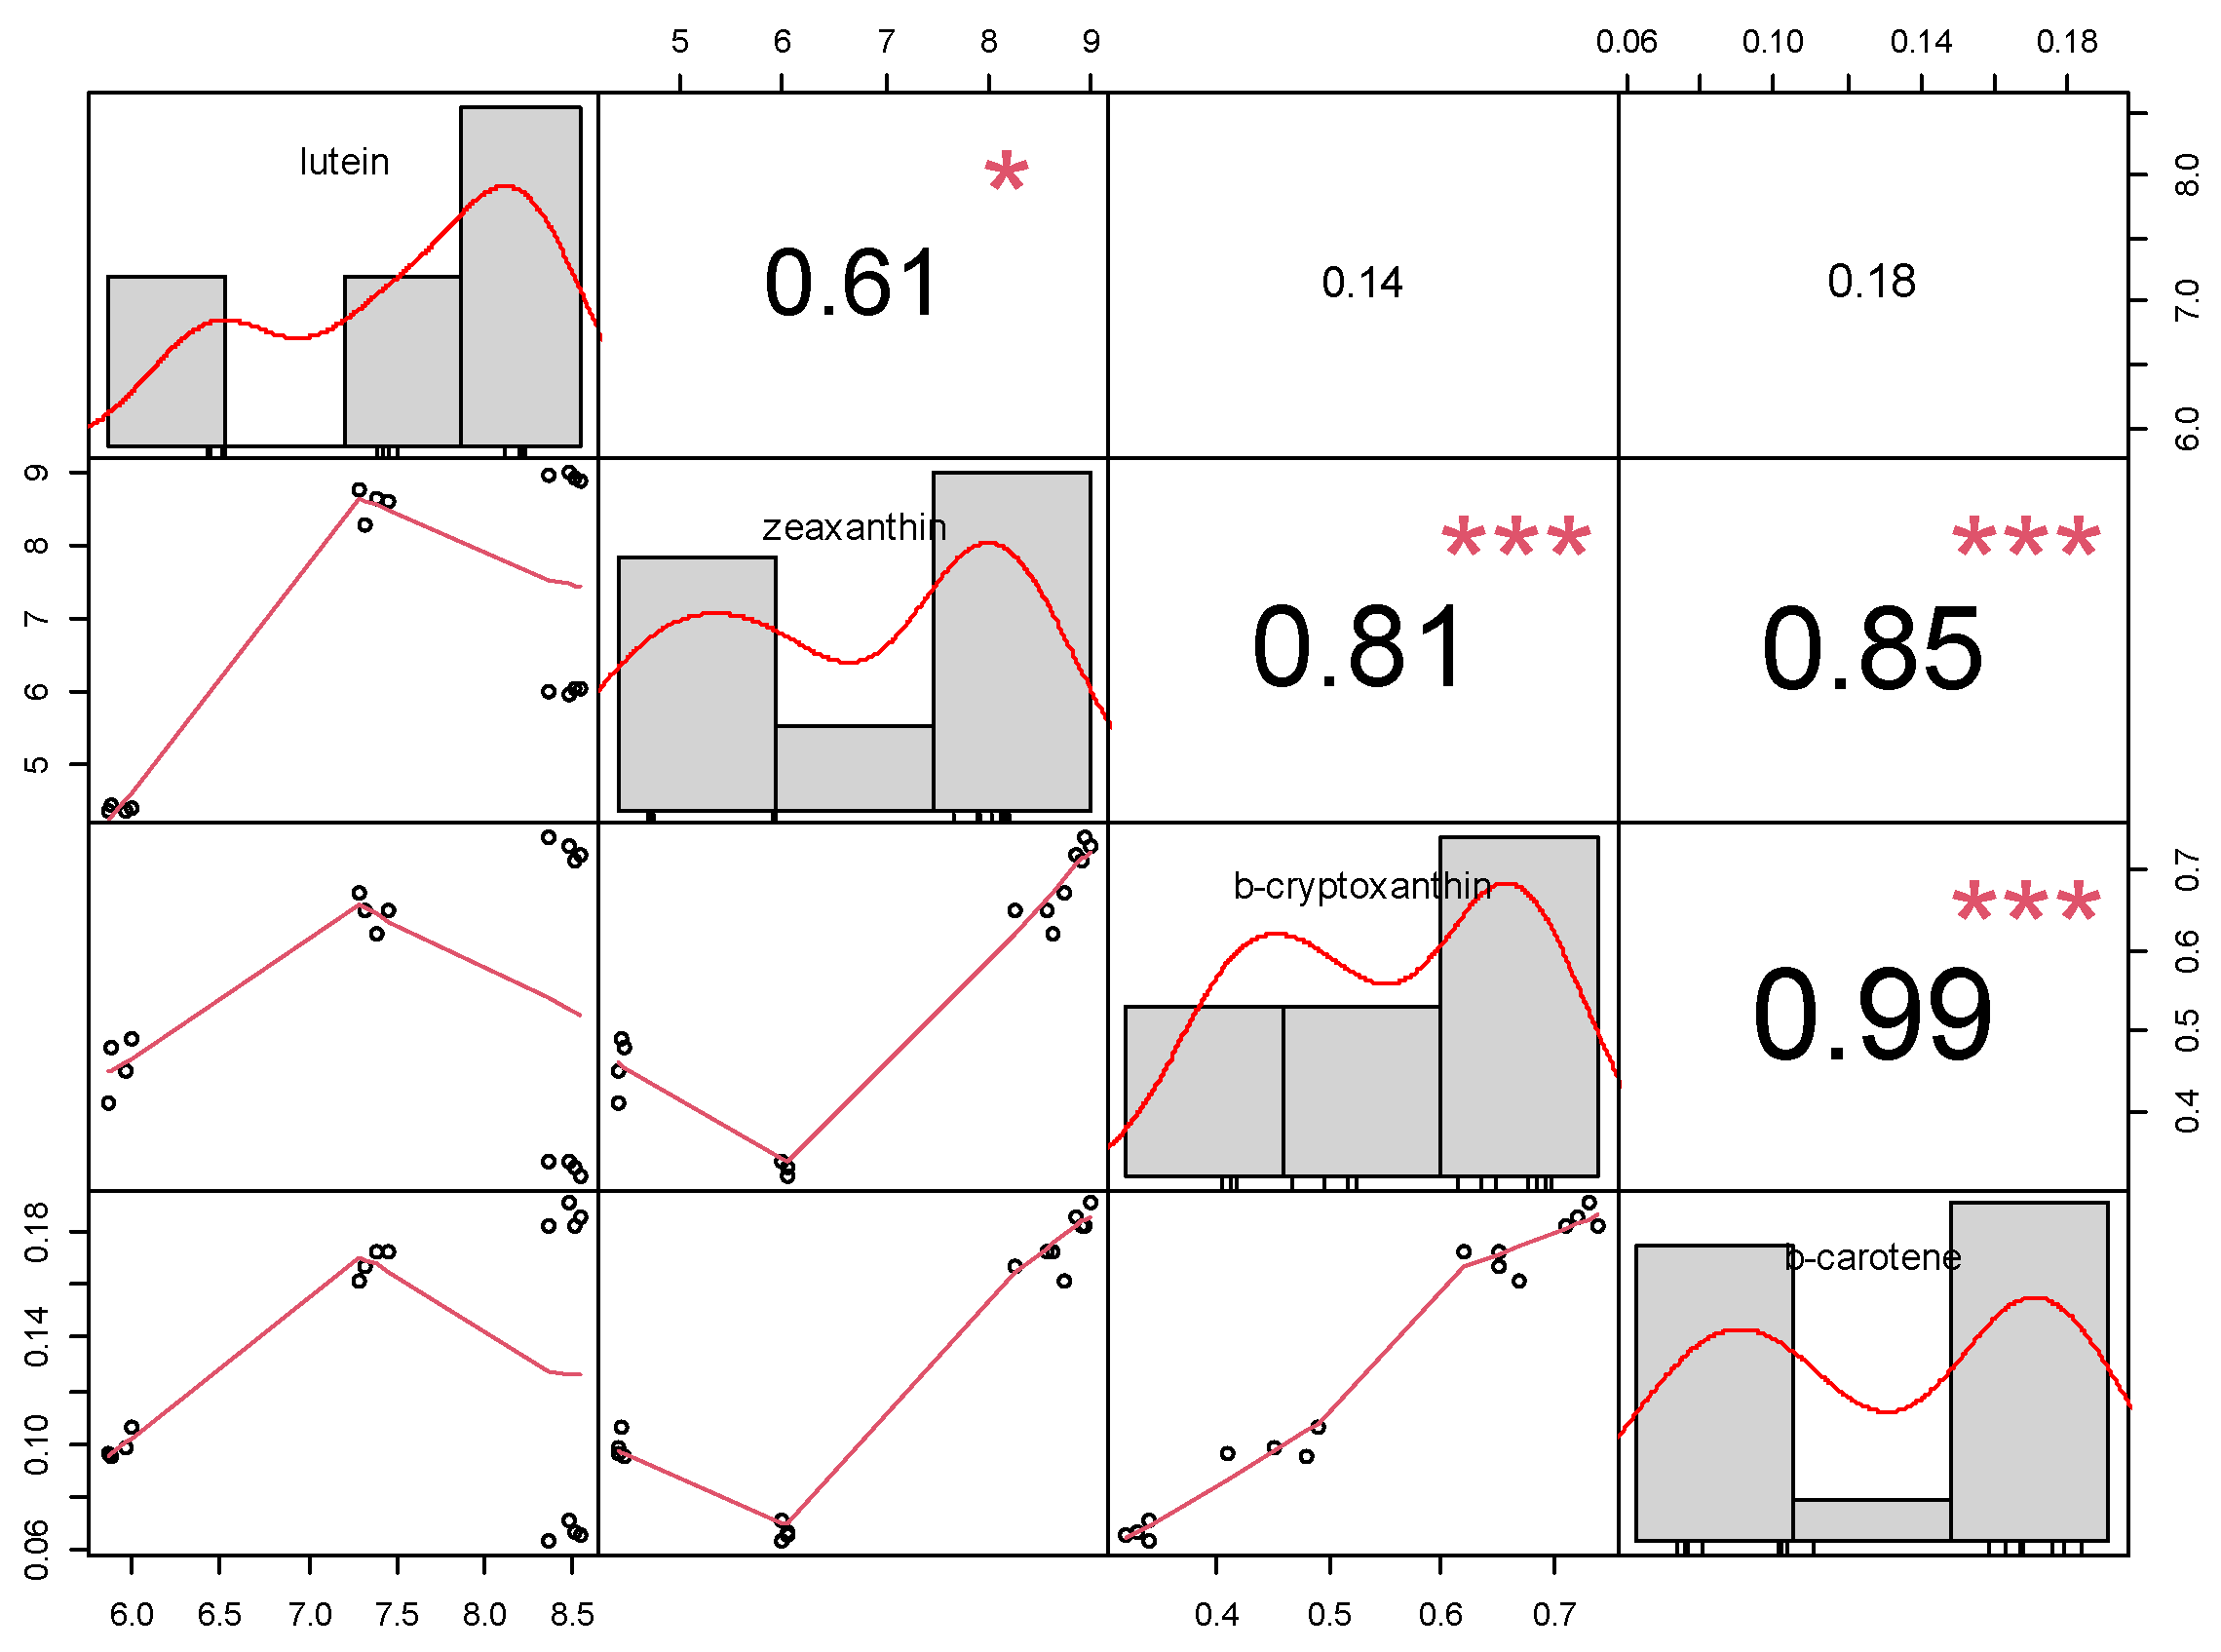
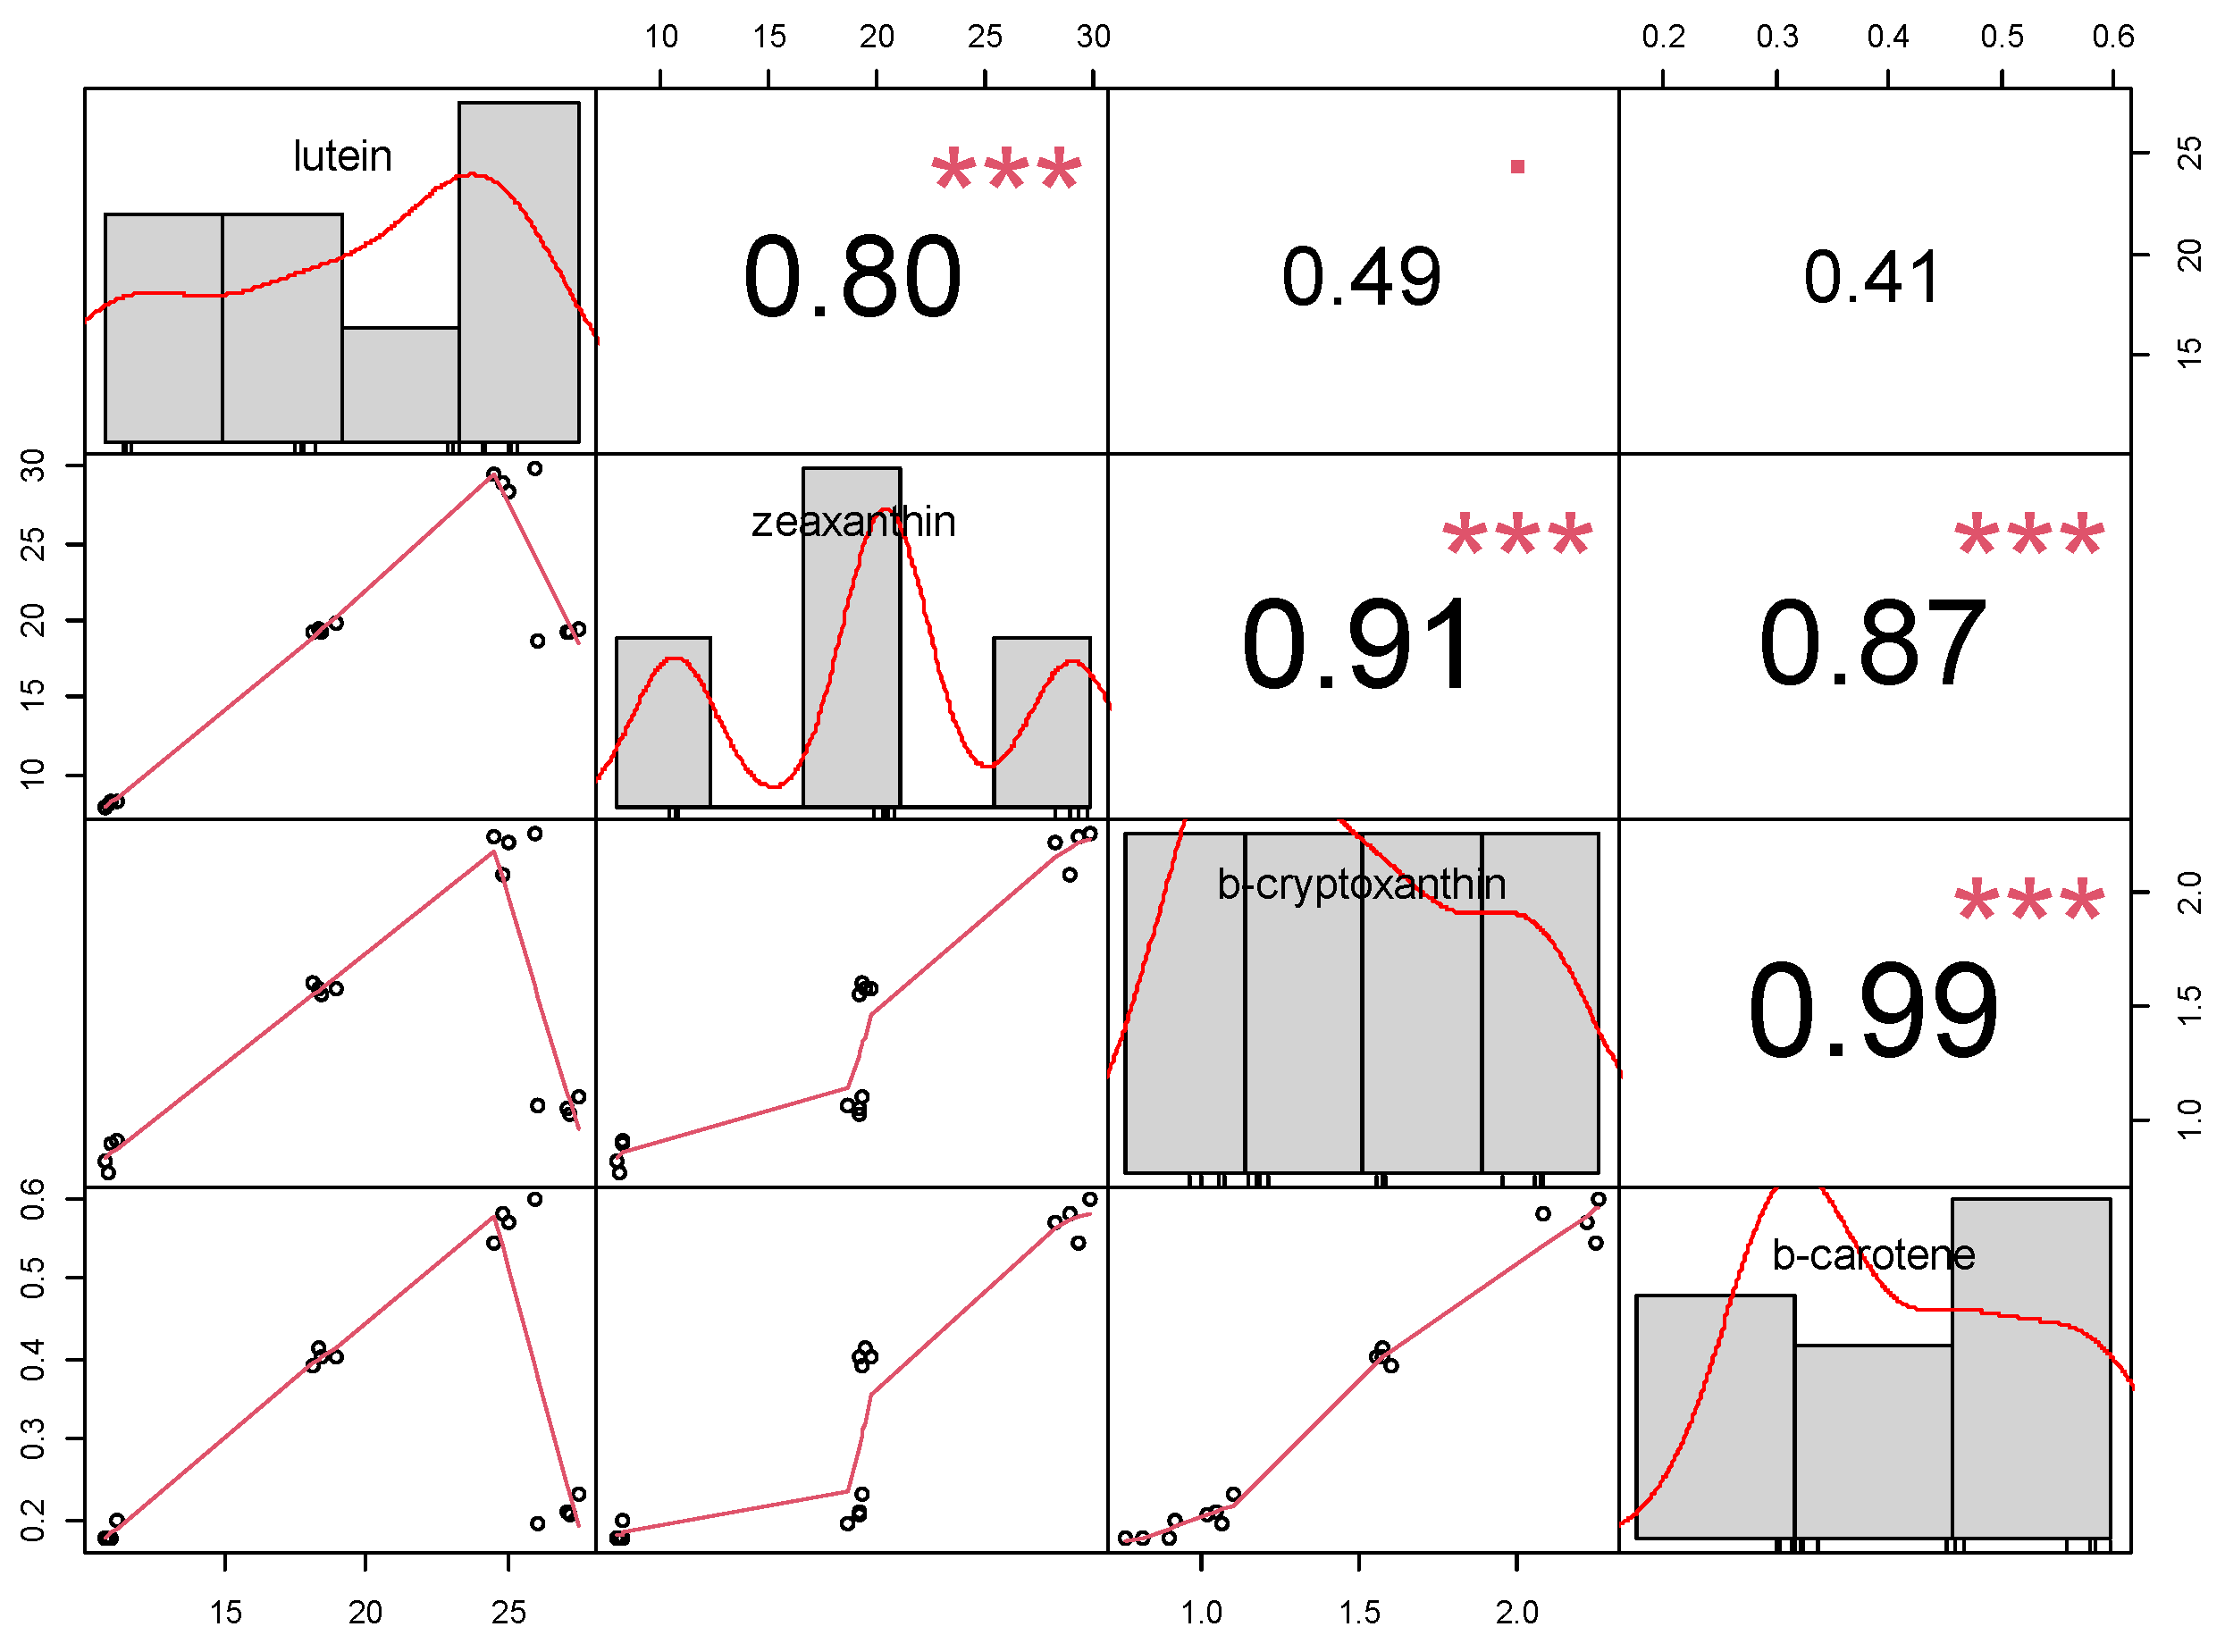
3.1.3. Lutein, Zeaxanthin, β-kriptoxanthin, β-carothene
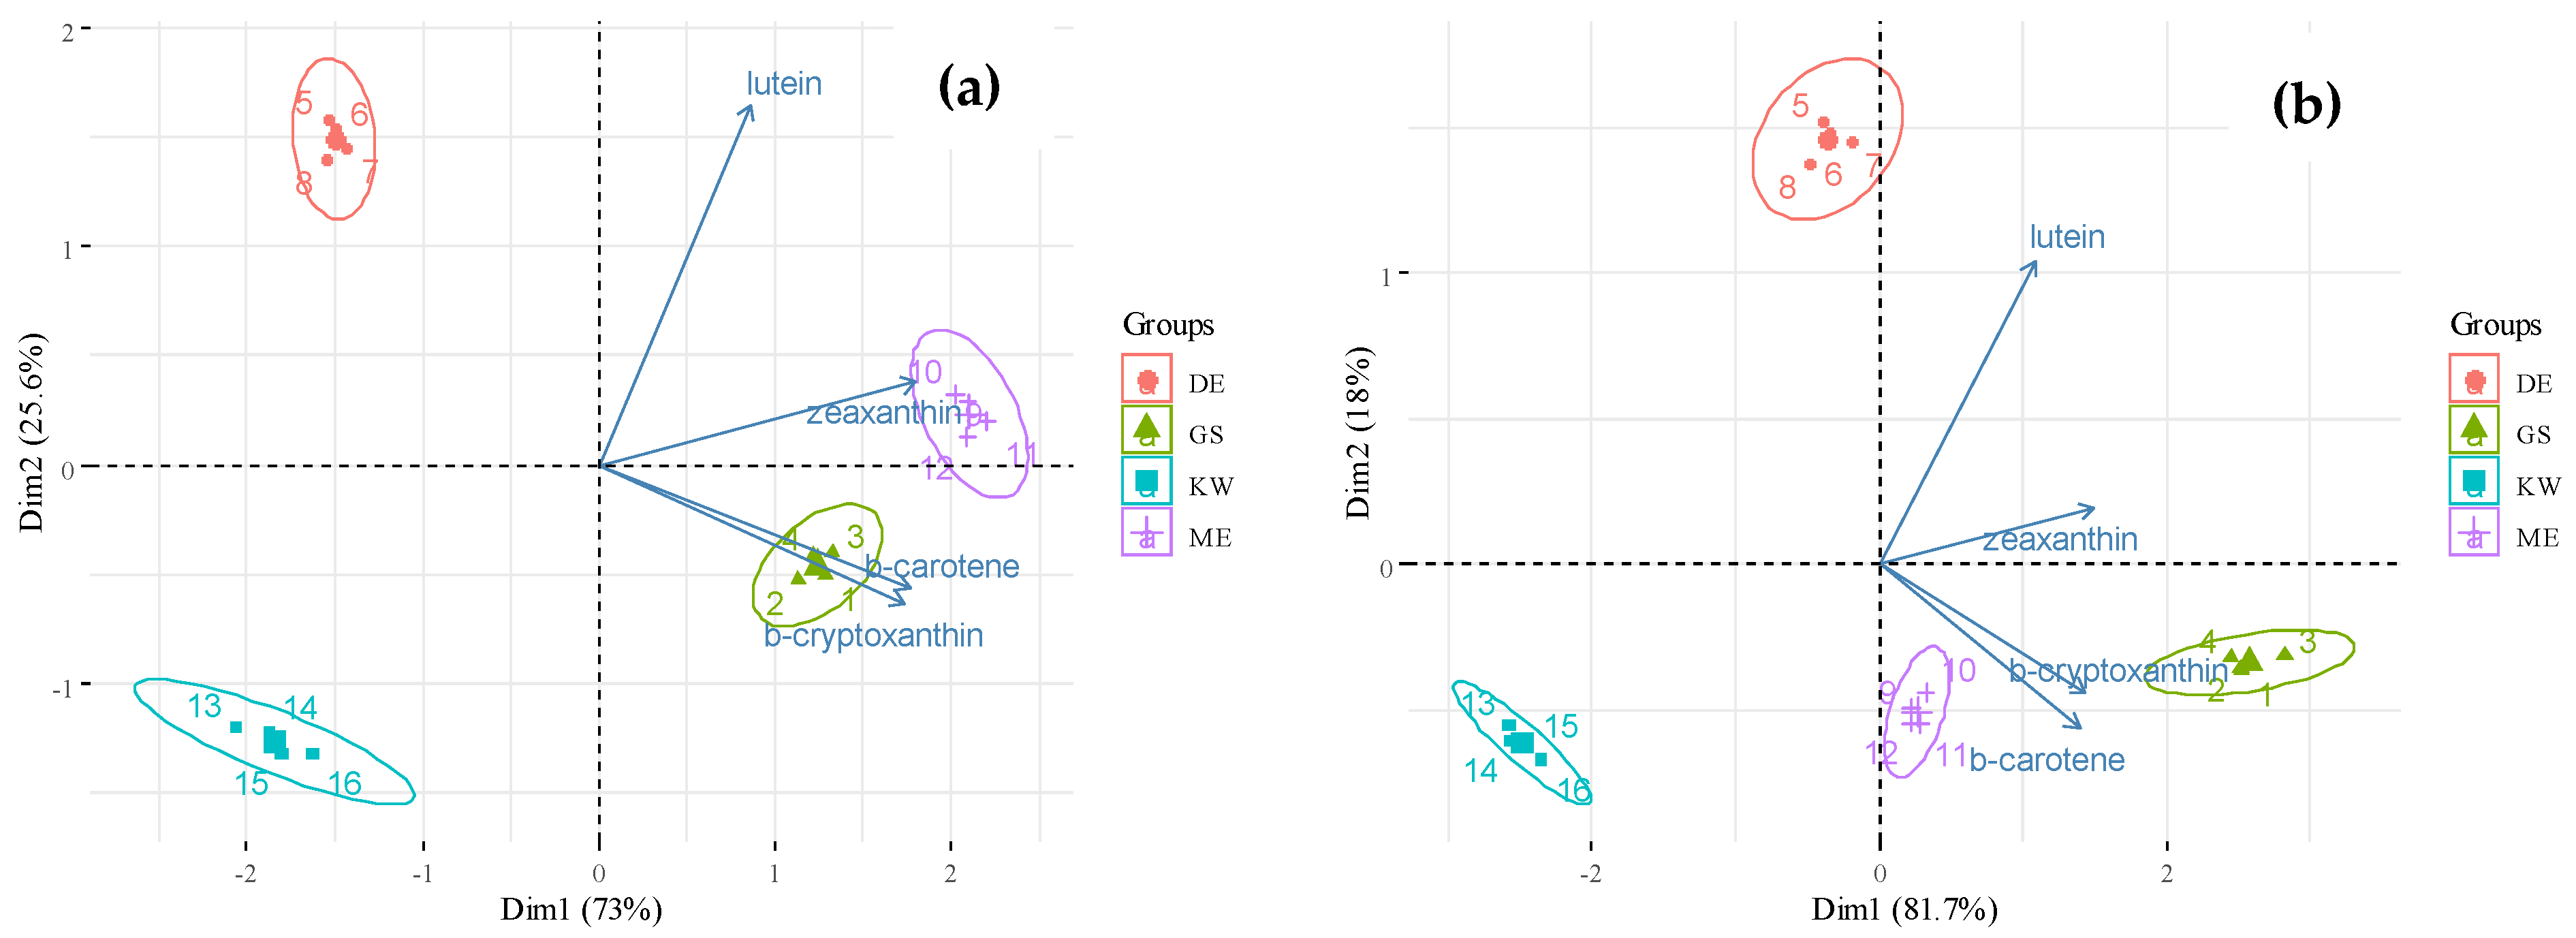
3.2. Results of the Principal Component Analysis
4. Discussion
5. Conclusions
Author Contributions
Funding
Institutional Review Board Statement
Acknowledgments
Conflicts of Interest
References
- Erdal, S.; Pamukcu, M.; Savur, O.; Tezel, M. Evaluation of developed standard sweet corn (Zea mays sacharata L.) hybrids for fresh yield, yield component and quality parameters. Turk J. Field Crops 2011, 16, 153–156. [Google Scholar]
- Santos, P.H.A.D.; Pereira, M.G.; Trindade, R.D.S.; Cunha, K.S.D.; Entringer, G.C.; Vettorazzi, J.C.F. Agronomic performance of super-sweet corn genotypes in the north of Rio de Janeiro. Crop Breed. Appl. Biot. 2014, 14, 8–14. [Google Scholar] [CrossRef] [Green Version]
- Swapna, G.; Jadesha, G.; Mahadevu, P. Assessment of Correlation and Path Coefficient Analysis for Yield and it’s Attributing Traits in Rice (Oryza sativa L.) Genotypes. Int. J. Curr. Microbiol. Appl. Sci. 2020, 9, 3859–3865. [Google Scholar] [CrossRef]
- Revilla, P.; Anibas, C.; Tracy, W. Sweet Corn Research around the World 2015–2020. Agronomy 2021, 11, 534. [Google Scholar] [CrossRef]
- Lertrat, K.; Pulam, T. Breeding for increased sweetness in sweet corn. Int. J. Plant Breed. 2007, 1, 27–30. [Google Scholar]
- Sadaiah, K.; Narsimha, R.V.; Sudheer, S. Heterosis and Combining ability Studies for Sugar content in Sweet corn (Zea mays saccharata L.). Int. J. Sci. Res. Public. 2013, 3, 2250–3153. [Google Scholar]
- Lykhovyd, P.V. Sweet Corn Yield Simulation Using Normalized Difference Vegetation Index and Leaf Area Index. J. Ecol. Eng. 2020, 21, 228–236. [Google Scholar] [CrossRef]
- Lykhovyd, P.V. Prediction of sweet corn yield depending on cultivation technology parameters by using linear re-gression and artificial neural network methods. Biosyst. Div. 2018, 26, 11–15. [Google Scholar] [CrossRef]
- Lauriault, L.M.; Guldan, S.J.; Popiel-Powers, F.G.; Steiner, R.L.; Martin, C.A.; Heyduck, R.F.; Falk, C.L.; Petersen, M.K.; May, T. Relay Intercropping with Cover Crops Improved Autumn Forage Potential of Sweet Maize Stover. Agriculture 2018, 8, 103. [Google Scholar] [CrossRef] [Green Version]
- Pereira, M.G.; Gonçalves, G.M.B.; Durães, N.N.L.; Crevelari, J.A.; Júnior, J.A.F.; Entringer, G.C. UENF SD 08 and UENF SD 09: Super-sweet corn hybrids for Northern Rio de Janeiro, Brazil. Crop Breed. Appl. Biotechnol. 2019, 19, 235–239. [Google Scholar] [CrossRef] [Green Version]
- Soare, R.; Dinu, M.; Hoza, G.; Bonea, D.; Babeanu, C.; Soare, M. The influence of the hybrid and the sowing period on the production of sweet corn. Sci. Pap. Ser. B Hortic. 2019, 63, 391–397. [Google Scholar]
- Mehta, B.K.; Hossain, F.; Muthusamy, V.; Zunjare, R.U.; Sekhar, J.C.; Gupta, H.S. Analyzing the role of sowing and harvest time as factors for selecting super sweet (−sh2sh2) corn hybrids. Indian J. Genet. Plant Breed. 2017, 77, 348. [Google Scholar] [CrossRef]
- Nazli, M.H.; Halim, R.A.; Abdullah, A.M.; Hussin, G.; Samsudin, A.A. Potential of four corn varieties at different harvest stages for silage production in Malaysia. Asian-Australasian J. Anim. Sci. 2019, 32, 224–232. [Google Scholar] [CrossRef] [PubMed]
- Prasanthi, P.S.; Naveena, N.; Rao, M.V.; Bhaskarachary, K. Compositional variability of nutrients and phytochemicals in corn after processing. J. Food Sci. Technol. 2017, 54, 1080–1090. [Google Scholar] [CrossRef] [PubMed] [Green Version]
- Xie, Y.; Liu, S.; Jia, L.; Gao, E.; Song, H. Effect of different storage temperatures on respiration and marketable quality of sweet corn. Adv. Eng. Technol. 2016, 3, 219–224. [Google Scholar] [CrossRef]
- Baseggio, M.; Murray, M.; Magallanes-Lundback, M.; Kaczmar, N.; Chamness, J.; Buckler, E.S.; Smith, M.E.; DellaPenna, D.; Tracy, W.F.; Gore, M. Genome-Wide Association and Genomic Prediction Models of Tocochromanols in Fresh Sweet Corn Kernels. Plant Gen. 2019, 12, 180038. [Google Scholar] [CrossRef] [Green Version]
- Hong, H.T.; Netzel, M.E.; O’Hare, T.J. Optimisation of extraction procedure and development of LC–DAD–MS methodology for anthocyanin analysis in anthocyanin-pigmented corn kernels. Food Chem. 2020, 319, 126515. [Google Scholar] [CrossRef]
- Xiang, N.; Wen, T.; Yu, B.; Li, G.; Li, C.; Li, W.; Lu, W.; Hu, J.; Guo, X. Dynamic effects of post-harvest preservation on phytochemical profiles and antioxidant activities in sweet corn kernels. Int. J. Food Sci. Technol. 2020, 55, 3111–3122. [Google Scholar] [CrossRef]
- Mesarovic, J.; Srdić, J.; Mladenovic-Drinic, S.; Dragicevic, V.; Simic, M.; Brankov, M.; Milojkovic-Opsenica, D. Antioxidant status of the different sweet maize hybrids under herbicide and foliar fertilizer application. Genetika 2018, 50, 1023–1033. [Google Scholar] [CrossRef]
- Calvo-Brenes, P.; Fanning, K.; O’Hare, T. Does kernel position on the cob affect zeaxanthin, lutein and total carotenoid contents or quality parameters, in zeaxanthin-biofortified sweet-corn? Food Chem. 2018, 277, 490–495. [Google Scholar] [CrossRef]
- Cheah, Z.X.; Kopittke, P.M.; Harper, S.M.; Meyer, G.; O’Hare, T.J.; Bell, M.J. Speciation, and accumulation of Zn in sweet corn kernels for genetic and agronomic biofortification programs. Planta 2019, 250, 219–227. [Google Scholar] [CrossRef]
- Cheah, Z.W.; O’Hare, T.J.; Harper, S.M.; Bell, M.J. Variation in Sweet Corn Kernel Zn Concentration a Reflection of Source-Sink Dynamics Influenced by Kernel Number. Available online: http://creativecommons.org/licenses/by/4.0/ (accessed on 14 June 2020).
- Szymanek, M.; Dziwulska-Hunek, A.; Tanaś, W. Influence of Blanching Time on Moisture, Sugars, Protein, and Processing Recovery of Sweet Corn Kernels. Processes 2020, 8, 340. [Google Scholar] [CrossRef] [Green Version]
- Calvo-Brenes, P.; O’Hare, T. Effect of freezing and cool storage on carotenoid content and quality of zeaxan-thin-biofortified and standard yellow sweetcorn (Zea mays L.). J. Food Comp. Anal. 2020, 86, 103353. [Google Scholar] [CrossRef]
- Usubharatana, P.; Phungrassami, H. ECOLOGICAL FOOTPRINT ANALYSIS OF CANNED SWEET CORN. J. Ecol. Eng. 2016, 17, 22–29. [Google Scholar] [CrossRef] [Green Version]
- Aguilar, M.; Mondaca, P.; Ginocchio, R.; Vidal, K.; Sauvé, S.; Neaman, A. Comparison of exposure to trace elements through vegetable consumption between a mining area and an agricultural area in central Chile. Environ. Sci. Pollut. Res. 2018, 25, 19114–19121. [Google Scholar] [CrossRef] [PubMed]
- Pairochteerakul, P.; Jothityangkoon, D.; Ketthaisong, D.; Simla, S.; Lertrat, K.; Suriharn, B. Seed Germination in Re-lation to Total Sugar and Starch in Endosperm Mutant of Sweet Corn Genotypes. Agronomy 2018, 8, 299. [Google Scholar] [CrossRef] [Green Version]
- Liu, R.; Boehlein, S.K.; Tracy, W.F.; Resende, M.F., Jr.; Hudalla, G.A. Characterizing the Physical Properties and Cell Compatibility of Phytoglycogen Extracted from Different Sweet Corn Varieties. Molecules 2020, 25, 637. [Google Scholar] [CrossRef] [PubMed] [Green Version]
- Jusoh, N.; Ahmad, A.; Tengah, R.Y. Evaluation of nutritive values and consumer acceptance of sweet corn (Zea mays) juice as a recovery beverage for exercising people. Malays. J. Fundam. Appl. Sci. 2019, 15, 504–507. [Google Scholar] [CrossRef]
- El-Abady, M. Viability of Stored Maize Seed Exposed to Different Periods of High Temperature During the Artificial Drying. Res. J. Seed Sci. 2014, 7, 75–86. [Google Scholar] [CrossRef] [Green Version]
- Moros, E.E.; Darnoko, D.; Cheryan, M.; Perkins, E.G.; Jerrell, J. Analysis of Xanthophylls in Corn by HPLC. J. Agric. Food Chem. 2002, 50, 5787–5790. [Google Scholar] [CrossRef] [PubMed]
- Dziuban, C.D.; Shirkey, E.C. When is a correlation matrix appropriate for factor analysis? Some decision rules. Psychol. Bull. 1974, 81, 358–361. [Google Scholar] [CrossRef]
- Kaiser, H.F. A second-generation little jiffy. Psychometrika 1970, 35, 401–415. [Google Scholar] [CrossRef]
- Kaiser, H.F. An index of factorial simplicity. Psychometrika 1974, 39, 31–36. [Google Scholar] [CrossRef]
- R Core R: A Language and Environment for Statistical Computing. R Foundation for Statistical Computing, Vienna, Austria. Available online: https://www.R-project.org/ (accessed on 4 February 2021).


Publisher’s Note: MDPI stays neutral with regard to jurisdictional claims in published maps and institutional affiliations. |
© 2021 by the authors. Licensee MDPI, Basel, Switzerland. This article is an open access article distributed under the terms and conditions of the Creative Commons Attribution (CC BY) license (https://creativecommons.org/licenses/by/4.0/).
Share and Cite
Demeter, C.; Nagy, J.; Huzsvai, L.; Zelenák, A.; Szabó, A.; Széles, A. Analysis of the Content Values of Sweet Maize (Zea mays L. Convar Saccharata Koern) in Precision Farming. Agronomy 2021, 11, 2596. https://0-doi-org.brum.beds.ac.uk/10.3390/agronomy11122596
Demeter C, Nagy J, Huzsvai L, Zelenák A, Szabó A, Széles A. Analysis of the Content Values of Sweet Maize (Zea mays L. Convar Saccharata Koern) in Precision Farming. Agronomy. 2021; 11(12):2596. https://0-doi-org.brum.beds.ac.uk/10.3390/agronomy11122596
Chicago/Turabian StyleDemeter, Cintia, János Nagy, László Huzsvai, Annabella Zelenák, Atala Szabó, and Adrienn Széles. 2021. "Analysis of the Content Values of Sweet Maize (Zea mays L. Convar Saccharata Koern) in Precision Farming" Agronomy 11, no. 12: 2596. https://0-doi-org.brum.beds.ac.uk/10.3390/agronomy11122596