Article

Amelioration Effect of LED Lighting in the Bioactive Compounds Synthesis during Carrot Sprouting

by
Lorena Martínez-Zamora
1,2,
Noelia Castillejo
1,2,
Perla A. Gómez
2 and
Francisco Artés-Hernández
1,2,*
1
Postharvest and Refrigeration Group, Department of Agronomical Engineering, Universidad Politécnica de Cartagena, Paseo Alfonso XIII, 48, 30203 Cartagena, Murcia, Spain
2
Institute of Plant Biotechnology, Universidad Politécnica de Cartagena, 30202 Cartagena, Murcia, Spain
*
Author to whom correspondence should be addressed.
Submission received: 11 January 2021 / Revised: 1 February 2021 / Accepted: 3 February 2021 / Published: 9 February 2021
(This article belongs to the Special Issue Sprouts, Microgreens and Edible Flowers as Novel Functional Foods)

Abstract

:
Background: This work investigates the morphological and compositional changes of carrots sprouts during 17 days at 20 °C. Methods: Growing conditions were 7 days in darkness (dD) followed by 3, 7, or 10 days of a 16 h light/8 h darkness photoperiod (dP). Light stimuli used were fluorescent light (Fl), Blue+Red (B+R), Blue+Red+Far-Red (B+R+FR) Light-Emitting Diodes—LEDs- and darkness as control. Results: Results showed that lighting conditions improved the total antioxidant activity and increased the bioactive compounds compared to darkness treatment. However, hypocotyl and sprout length were increased under darkness conditions. Both LEDs treatments (B+R and B+R+FR) increased the phenolic content (phenolic acids and rutin) by 45% and 65% compared to darkness and by 32% regarding Fl. Moreover, a similar trend was observed in the carotenoids content under B+R LEDs, but not when FR was added. Conclusions: Our results suggest that LED lighting during carrot sprouting improved the synthesis of health-promoting compounds.

Graphical Abstract

1. Introduction

Darkness and fluorescent lighting are widely used during sprouting and growth of different crops. Plant pigments absorb light in the visible spectrum between 400 and 700 nm, which is typically referred to as photosynthetically active radiation (PAR). Light, both the quantity (intensity) and quality (spectrum), plays an important role in cultivation. Nowadays, the use of artificial light during growing has suggested a new way to extend the shelf-life of fruit and vegetables while improving their nutritional properties and promotes the biosynthesis of phytochemical compounds, such as phenols and carotenoids [1,2,3]. The influence of color light on the accumulation and biosynthesis of plant compounds has been known for years, as well as the application of abiotic stresses for enhancing the nutraceutical content of fresh fruit and vegetables [1,4]. However, researchers are just starting to discover the basic mechanisms by which light signals are transduced to modulate the growth and the production of photoprotective compounds [5].
Many authors have reported that red and blue lights are one of the most important spectral regions as they selectively activate different photoreceptors related to photosynthesis. These photoreceptors can absorb a range of light wavelengths from near ultraviolet —UV- (300–350 nm) to far-red light (700–750 nm). In fact, cryptochromes, phototropins, and Zeitlupe family proteins for blue light (430–480 nm) and phytochromes for red light (640–700 nm) have important roles in seed germination, plant development, flowering, leaf expansion, and biosynthesis of phytochemical compounds [6,7]. Red light has been reported to promote vegetative growth by increasing the chlorophyll content and reproductive growth [8], while blue light, being mostly absorbed by carotenoid pigments (like lutein and β-carotene), has also been reported to improve the photosynthetic capacity of plants [9]. Plant growth and metabolism can be optimized when multiple LEDs are combined or alternated [10]. They have a narrow-brand wavelength allowing monochromatic lights with different intensities. In these facts lie the efficiency and versatility of LEDs, which, added to their low cost, are now a good alternative to replace the most common current cultivation cycle of fluorescent light and darkness.
Sprouts and microgreens are valued as functional foods because of their greater concentrations of nutraceutical compounds as compared to the adult plant [11,12]. For this reason, plants during the first steps of their germination and growth show relevant health benefits for the consumer concerned about a healthy lifestyle. Specifically, Nam et al. [13] have reported an improvement by 10% the total phenolic content and 12% the total flavonoid content of common buckwheat sprouts after 7 days of sprouting under a 16 h blue light/8 h darkness daily photoperiod. Seo et al. [14] showed an increase of 465% of anthocyanin content after 11 days of sprouting under the same photoperiod.
Although the bibliography on this topic is extensive, no previous reports have studied the influence of these lights on development of carrot sprouts, selected as a plant-model with high carotenoid content. Carrot (Daucus carota L.) is a root vegetable, well-known as an important source of dietary fiber and natural antioxidants, including carotenoids, vitamins, minerals, and phenolic compounds [15,16]. These bioactive compounds act as free radical scavengers and inhibitors of prooxidative enzymes or external agents. In fact, carrot roots contain abundant biologically active substances which play important roles in preventing diseases through the diet [15,16].
Therefore, the aim of the present study was to evaluate the morphological development and the bioactive compounds synthesis (carotenoids and phenolics) during 7 days of Darkness (dD) + a 10 days Photoperiod (dP) of carrot sprouts’ growth under different lighting treatments including LEDs (Blue, Red, and Far-Red) in a 16 h light/8 h darkness photoperiod.

2. Materials and Methods

2.1. Reagents

Folin-Ciocalteu reagent, DPPH (2,2-diphenyl-1-picrylhydrazyl), ABTS (2,2′-azino-bis(3-ethylbenzothiazoline-6-sulfonic acid)), and TPTZ (2,4,6-Tris(2-pyridyl)-s-triazine) were purchased from Merck (Sigma, Darmstadt, Germany). Sodium carbonate (Na2CO3), sodium hydroxide (NaOH), sodium chloride (NaCl), and chlorogenic acid, caffeic acid, p-coumaric acid, ferulic acid, hydroxycinnamic acid, and rutin standards were purchased from Merck (Sigma, Darmstadt, Germany). Trolox (6-hydroxy-2,5,7,8-tetramethylchroman-2-carboxylic acid), chlorogenic acid (5-caffeoylquinic acid), β-carotene, and lutein standards were purchased from Merck (Sigma, Darmstadt, Germany). Tert-methyl butyl ether (MTBE), methanol, chloroform, dichloromethane, and phosphoric acid were purchased from Panreac (Barcelona, Spain). All reagents were High Performance Liquid Chromatography (HPLC) grade. Milli-Q water was obtained from a water purification system (Millipore, Merck, Darmstadt, Germany).

2.2. Plant Material and Sprouting Conditions

Carrot (Daucus carota L.) seeds were provided by Intersemillas S.A. (Valencia, Spain). The weight of 100 seeds was 0.11 ± 0.00 g. Two g of carrot seeds (909 seeds g−1) were soaked in distilled water overnight at room temperature. Then, they were transferred into sterilized polypropylene trays (173 × 120 × 80 mm; 1500 mL) with water-moistened filter paper on the bottom. Seeds were germinated in a plant growth chamber (Sanyo MLR-350 H, Osaka, Japan) under darkness conditions for 7 days (7 dD) at 20 °C and 90% Relative Humidity (RH). After that period, the sprouts were exposed to daily cycles of 16 h light/8 h darkness photoperiod (dP). Each replicate was a tray, and each sample was composed of five replicates.

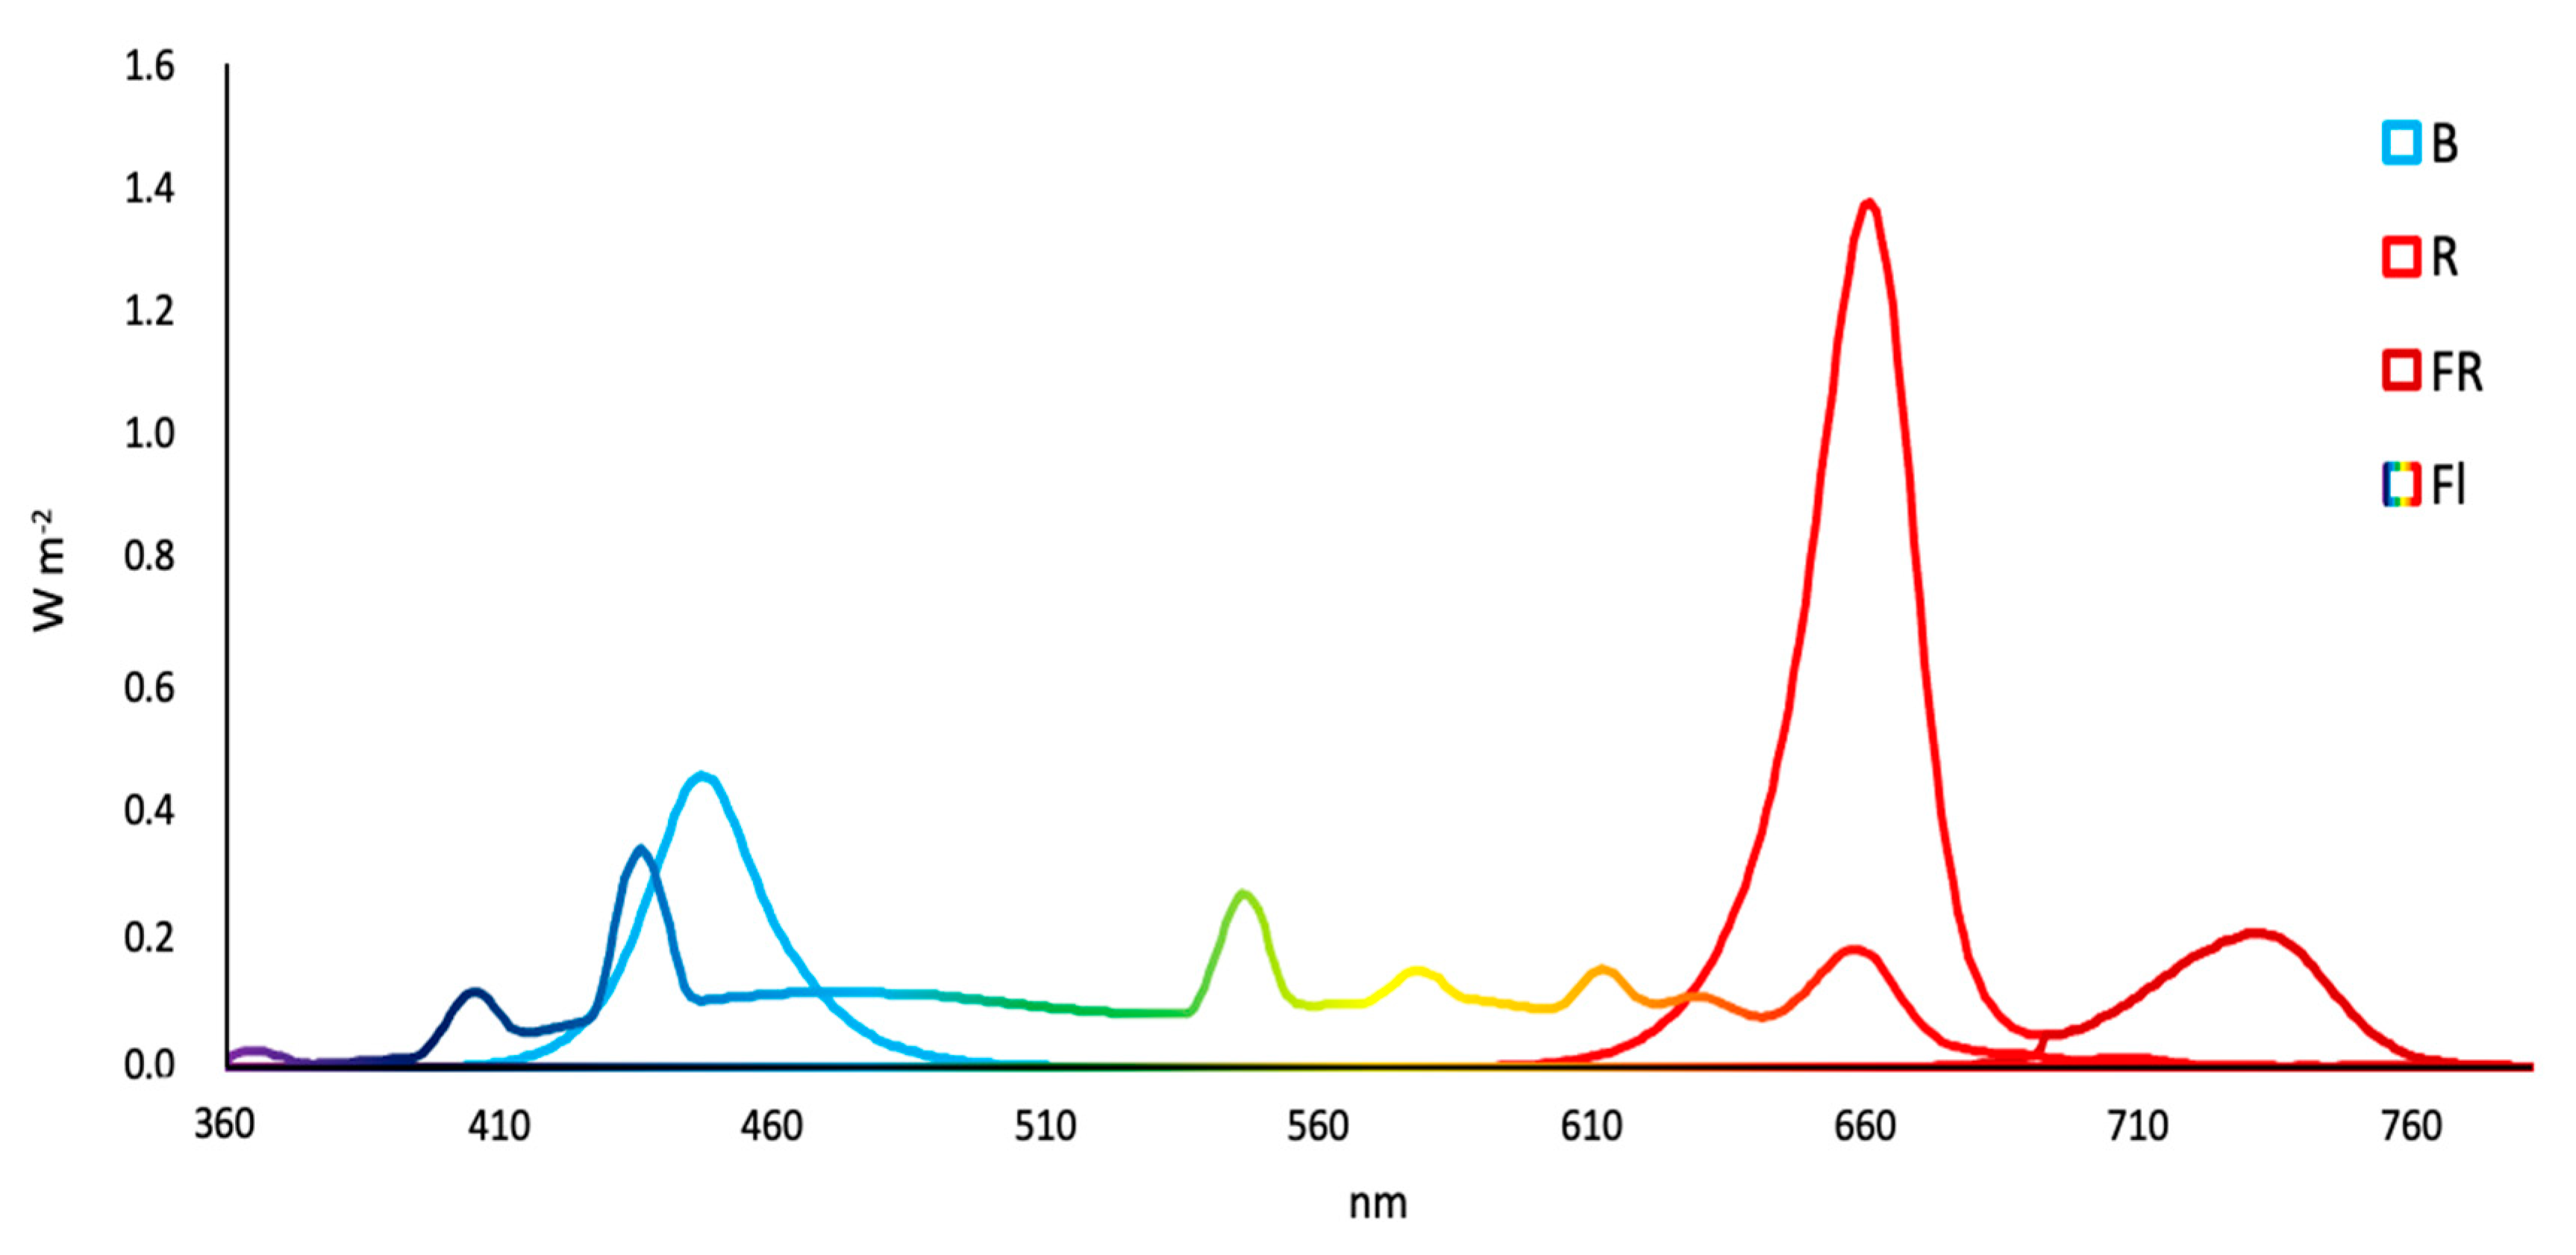
2.3. Light Treatments Used during the Photoperiod

Light treatments assayed during the photoperiod were: Fl (fluorescent), B+R (Blue+Red), and B+R+FR (Blue+Red+Far-Red) LED lamps, while darkness was used as a control. LED lamps used in the trial were provided by LEDMurcia S.L. (Murcia, Spain): Blue (B; peak at 450 nm), Deep-Red (R: 660 nm), and Far-Red (FR; peak at 730 nm). Fl lighting was provided by fluorescent lamps with white spectrum (Philips 36W/54-765) during the photoperiod (2016 kJ m−2). When applying LED illumination, the majority of the published works deal with a simultaneous combination of LEDs. However, there are few studies reporting the effect of an alternation of the LED lights. In fact, Ohtake et al. [10] reported that an alternation of 12 h red and 4 h blue lights (Red/Blue ratio = 3) improved the plant growth and enhanced the nutritional quality of lettuce compared to a simultaneous combination of the same LED lights. However, no other works studied such effect during seed sprouting. Therefore, we assayed such light combinations during carrot sprouting. For B+R treatment, the ratio of 3 was achieved by switching the B light on for 4 h followed by R LEDs for 12 h (2073.74 kJ m−2). For B+R+FR LED lighting, B LEDs were switched on for 3 h 31 min followed by R LEDs for 10 h 24 min and FR LEDs for 2 h 5 min (2361.8 kJ m−2). R+B and R+B+FR ratios were calculated by comparing the area under the curve of the spectral regions in the B (440–455 nm), R (650–670 nm), and the FR (720–740 nm). Spectral properties were determined using an illuminance spectrophotometer (CAS 140CT, Instrument Systems, Konica Minolta Group, Munich, Germany). A constant PPF (photosynthetic photon flux) for Fl, B+R, and B+R+FR of 168, 173, and 197 μmol m−2 s−1 respectively, were measured using a Quantum-Photo Radiometer Data Logger DO 9721 (Delta Ohm, S.R.L., Venice, Italy). Spectral composition of each light treatment is shown in Figure 1.
Sprouts were sampled for quality analyses on days 0 (seeds), 3 (3 dD), and 7 (7 dD) during initial growth in darkness, and after 3 (7 dD+3 dP), 7 (7 dD+7 dP), and 10 days (7 dD+10 dP) of the light/darkness photoperiod. On such days, sprouts were immediately frozen at −80 °C and freeze-dried by freeze dryer equipment (LyoQuest −85, Telstar, Terrassa, Spain) and stored at room temperature until further analysis.

2.4. Morphological Characteristics

Morphological measurements were carried out using the software ImageJ, Version 1.52 v for Windows. Photographs of carrot sprouts next to a ruler (cm) were used to measure hypocotyl (H), root (R), and total sprout lengths (H+R). The sprout length was measured from root apical meristem to shoot apical meristem. H/R ratio was also calculated. Three repetitions of 15 sprouts per each treatment were measured on each sampling day.

2.5. Extraction and Determination of Total Phenolic Content

Twenty-five mg of freeze-dried samples were weighed in plastic tubes and 3 mL of methanol:water (80:20, v/v) was added. This mix was homogenized using an IKA A11 basic grinder (IKA, Staufen, Germany). The extraction was carried out in an orbital shaker (Stuart, Stone, UK) for 1 h at 200 rpm in darkness at 4 °C. The extracts were centrifuged at 3220× g for 10 min at 4 °C. The supernatant was collected and used as phenolic and total antioxidant capacity (TAC) extracts.
The total phenolic content (TPC) was determined as previously described by Singleton and Rossi [17]. Briefly, 19 μL TPC extract was placed on a flat-bottom PS 96-well plate (Greiner Bio-One; Frickenhausen, Germany) and 29 μL of 1 mol L−1 Folin-Ciocalteu reagent was added. After 3 min incubation in darkness at room temperature, 192 μL of Na2CO3 (0.4%) and NaOH (2%) were added. The absorbance was measured at 750 nm after 1 h incubation at room temperature in darkness using a Multiscan plate reader (Tecan Infinite M200, Männedorf, Switzerland). The TPC was expressed as mg chlorogenic acid equivalents (CAE) kg−1 dry weight (dw). Each sample was analyzed in triplicate.

2.6. Individual Phenolic Content Analyses

A sample of 1 mL of the extracted solution was collected and filtered using 0.2 µm PTFE membrane filters. Analysis and identification of individual phenolic compounds were conducted according to Moreira-Rodríguez et al. [18]. An Ultra High-Performance Liquid Chromatography instrument (Shimadzu, Kyoto, Japan) equipped with a DGU-20A degasser, LC-30AD quaternary pump, SIL-30AC autosampler, CTO-10AS column heater, and SPDM-20A photodiode array detector was used. Chromatographic analyses were carried out into a Gemini C18 column (250 × 4.6 mm, 5 µm particle size; Phenomenex, Torrance, CA, USA). The peaks of the chromatogram shown in Figure 2 were identified by retention time of different standards, such as chlorogenic acid, caffeic acid, p-coumaric acid, ferulic acid, hydroxycinnamic acid, and rutin. Phenolic acids were quantified as equivalents of chlorogenic acid. The results were expressed as mg kg−1 dw. Each sample was analyzed in triplicate.

2.7. Total Antioxidant Capacity

The TAC was analyzed by three different methods: DPPH (assay used to measure the scavenging activity against DPPH generated in organic phase), FRAP (Ferric Reducing Antioxidant Power), and ABTS (to measure the scavenging capacity against ABTS generated in aqueous phase) assays. In the DPPH assay [19], 194 μL of DPPH solution was added to 21 μL of sprout extract in a 96-well plate. The mixture was incubated for 30 min at room temperature in darkness. The TAC by DPPH was measured by changes in absorbance at 515 nm. The ABTS assay was carried out following the method previously described by Castillejo et al. [20]. For that, 200 μL of the activated ABTS solution (32 µM) was added to 11 μL of sprout extract in a 96-well plate and incubated for 20 min at room temperature in darkness. The TAC by ABTS was measured by changes in absorbance at 414 nm. In the FRAP assay [19], 198 μL of the FRAP solution was added to 6 μL of sprout extract in a 96-well plate and incubated for 14 min at room temperature in darkness. After this time, the absorbance was measured at 593 nm. All TAC data were expressed as mg of Trolox Equivalents (TE) kg−1 dw. Each sample was analyzed in triplicate.
The TAC index was calculated using the equation: (TACDPPH+TACABTS+TACFRAP)/3. Total Scavenging Activity (%) was calculated using the formula: (% ScavengingDPPH+% ScavengingABTS)/2. The radical scavenging activity of each sample against each reagent was calculated using the formula: ((Abs reagent − Abs Sample)/Abs reagent) × 100.

2.8. Extraction and Analysis of Carotenoids

Extraction and analysis of carotenoids were carried out as described by Gupta et al. [21]. For that, freeze-dried samples (150 mg) were homogenized with 1.5 mL of chloroform:dichloromethane (2:1, v/v) in a basic grinder (IKA A11, Staufen, Germany). The extraction was carried out in an orbital shaker (Stuart, Stone, UK) for 20 min at 200 rpm at 4 °C. After this time, 0.5 mL of 1 M NaCl solution was added for phase separation. The extracts were centrifuged at 5000× g for 10 min at 4 °C and the organic phase was collected. The extracted phase was dried by centrifugal evaporation and re-dissolved in 1.2 mL methanol:MTBE (60:40, v/v) and filtered using 0.2 µm PTFE membrane filters.
Analysis and identification of individual carotenoids were conducted according to Gupta et al. [21]. An Ultra High-Performance Liquid Chromatography (UHPLC) instrument (Shimadzu, Kyoto, Japan) equipped with a DGU-20A degasser, LC-30AD quaternary pump, SIL-30AC autosampler, CTO-10AS column heater, and SPDM-20A photodiode array detector was used. Chromatographic analyses were carried out into a C30 column (250 × 4.6 mm, 3 µm particle size; YMC Co., Kyoto, Japan). The peaks of the chromatogram shown in Figure 3 were identified by absorption spectra of different individual carotenoids (different absorption spectra of each peak are included in the Supplementary Figure S1). Carotenoids were quantified as equivalents of β-carotene and trans-lutein. The results were expressed as mg kg−1 dw. Each sample was analyzed in triplicate.

2.9. Statistical Analyses

The experiment was a two-factor (treatment × time) design subjected to analysis of variance (ANOVA) using Statgraphics Plus software (v. 5.1. Statpoint Technologies. Inc. Warrenton, VA, USA). Statistical significance was assessed at the level p < 0.05, and Tukey’s multiple range test was used to separate means.

3. Results

3.1. Morphological Characteristics of Carrot Sprouts

Table 1 shows the morphological development of carrot sprouts during growth at 20 °C. After 7 days in darkness, sprouts’ length reached 2.61 ± 0.16 cm. When transferring samples to the photoperiod, the length of control samples grown in darkness increased up from 3.43 ± 0.58 cm (after 3 dP) to 6.91 ± 0.68 cm (after 10 dP) (hypocotyl from 2.51 ± 0.22 to 5.68 ± 0.67 cm, while root from 1.17 ± 0.21 to 1.23 ± 0.34 cm). The longest hypocotyls and sprouts were shown by samples grown under darkness conditions. In this way, carrot sprouts after 17 days at 20 °C (7 dD+10 dP) presented 64%, 67%, and 68% shorter hypocotyls under Fl, B+R, and B+R+FR lighting, than darkness treatment, respectively. There is not a clear trend in root growth due to the light exposure. Rate of sprout growth decreased by lighting (both Fl and LEDs). In fact, Fl lighting reduced the sprout growth by 37% compared to darkness, while B+R and B+R+FR treatments reduced by 38% and 44% respectively, after 7 dD+10 dP. Similarly, H/R ratio was also affected by light treatments, decreasing by 81% (Fl) and 78% (B+R and B+R+FR) after 17 days (7 dD+10 dP) concerning samples grown in darkness. After germination, carrot sprouts increased 4.5-fold (11.0 ± 1.11 g) their initial weight under darkness conditions, while under photoperiod, Fl, B+R, and B+R+FR increased by 2.75- (7.50 ± 1.25 g), 2.25- (6.5 ± 1.56 g), and 3-fold (8.09 ± 0.95 g), without differences among them (data not shown).

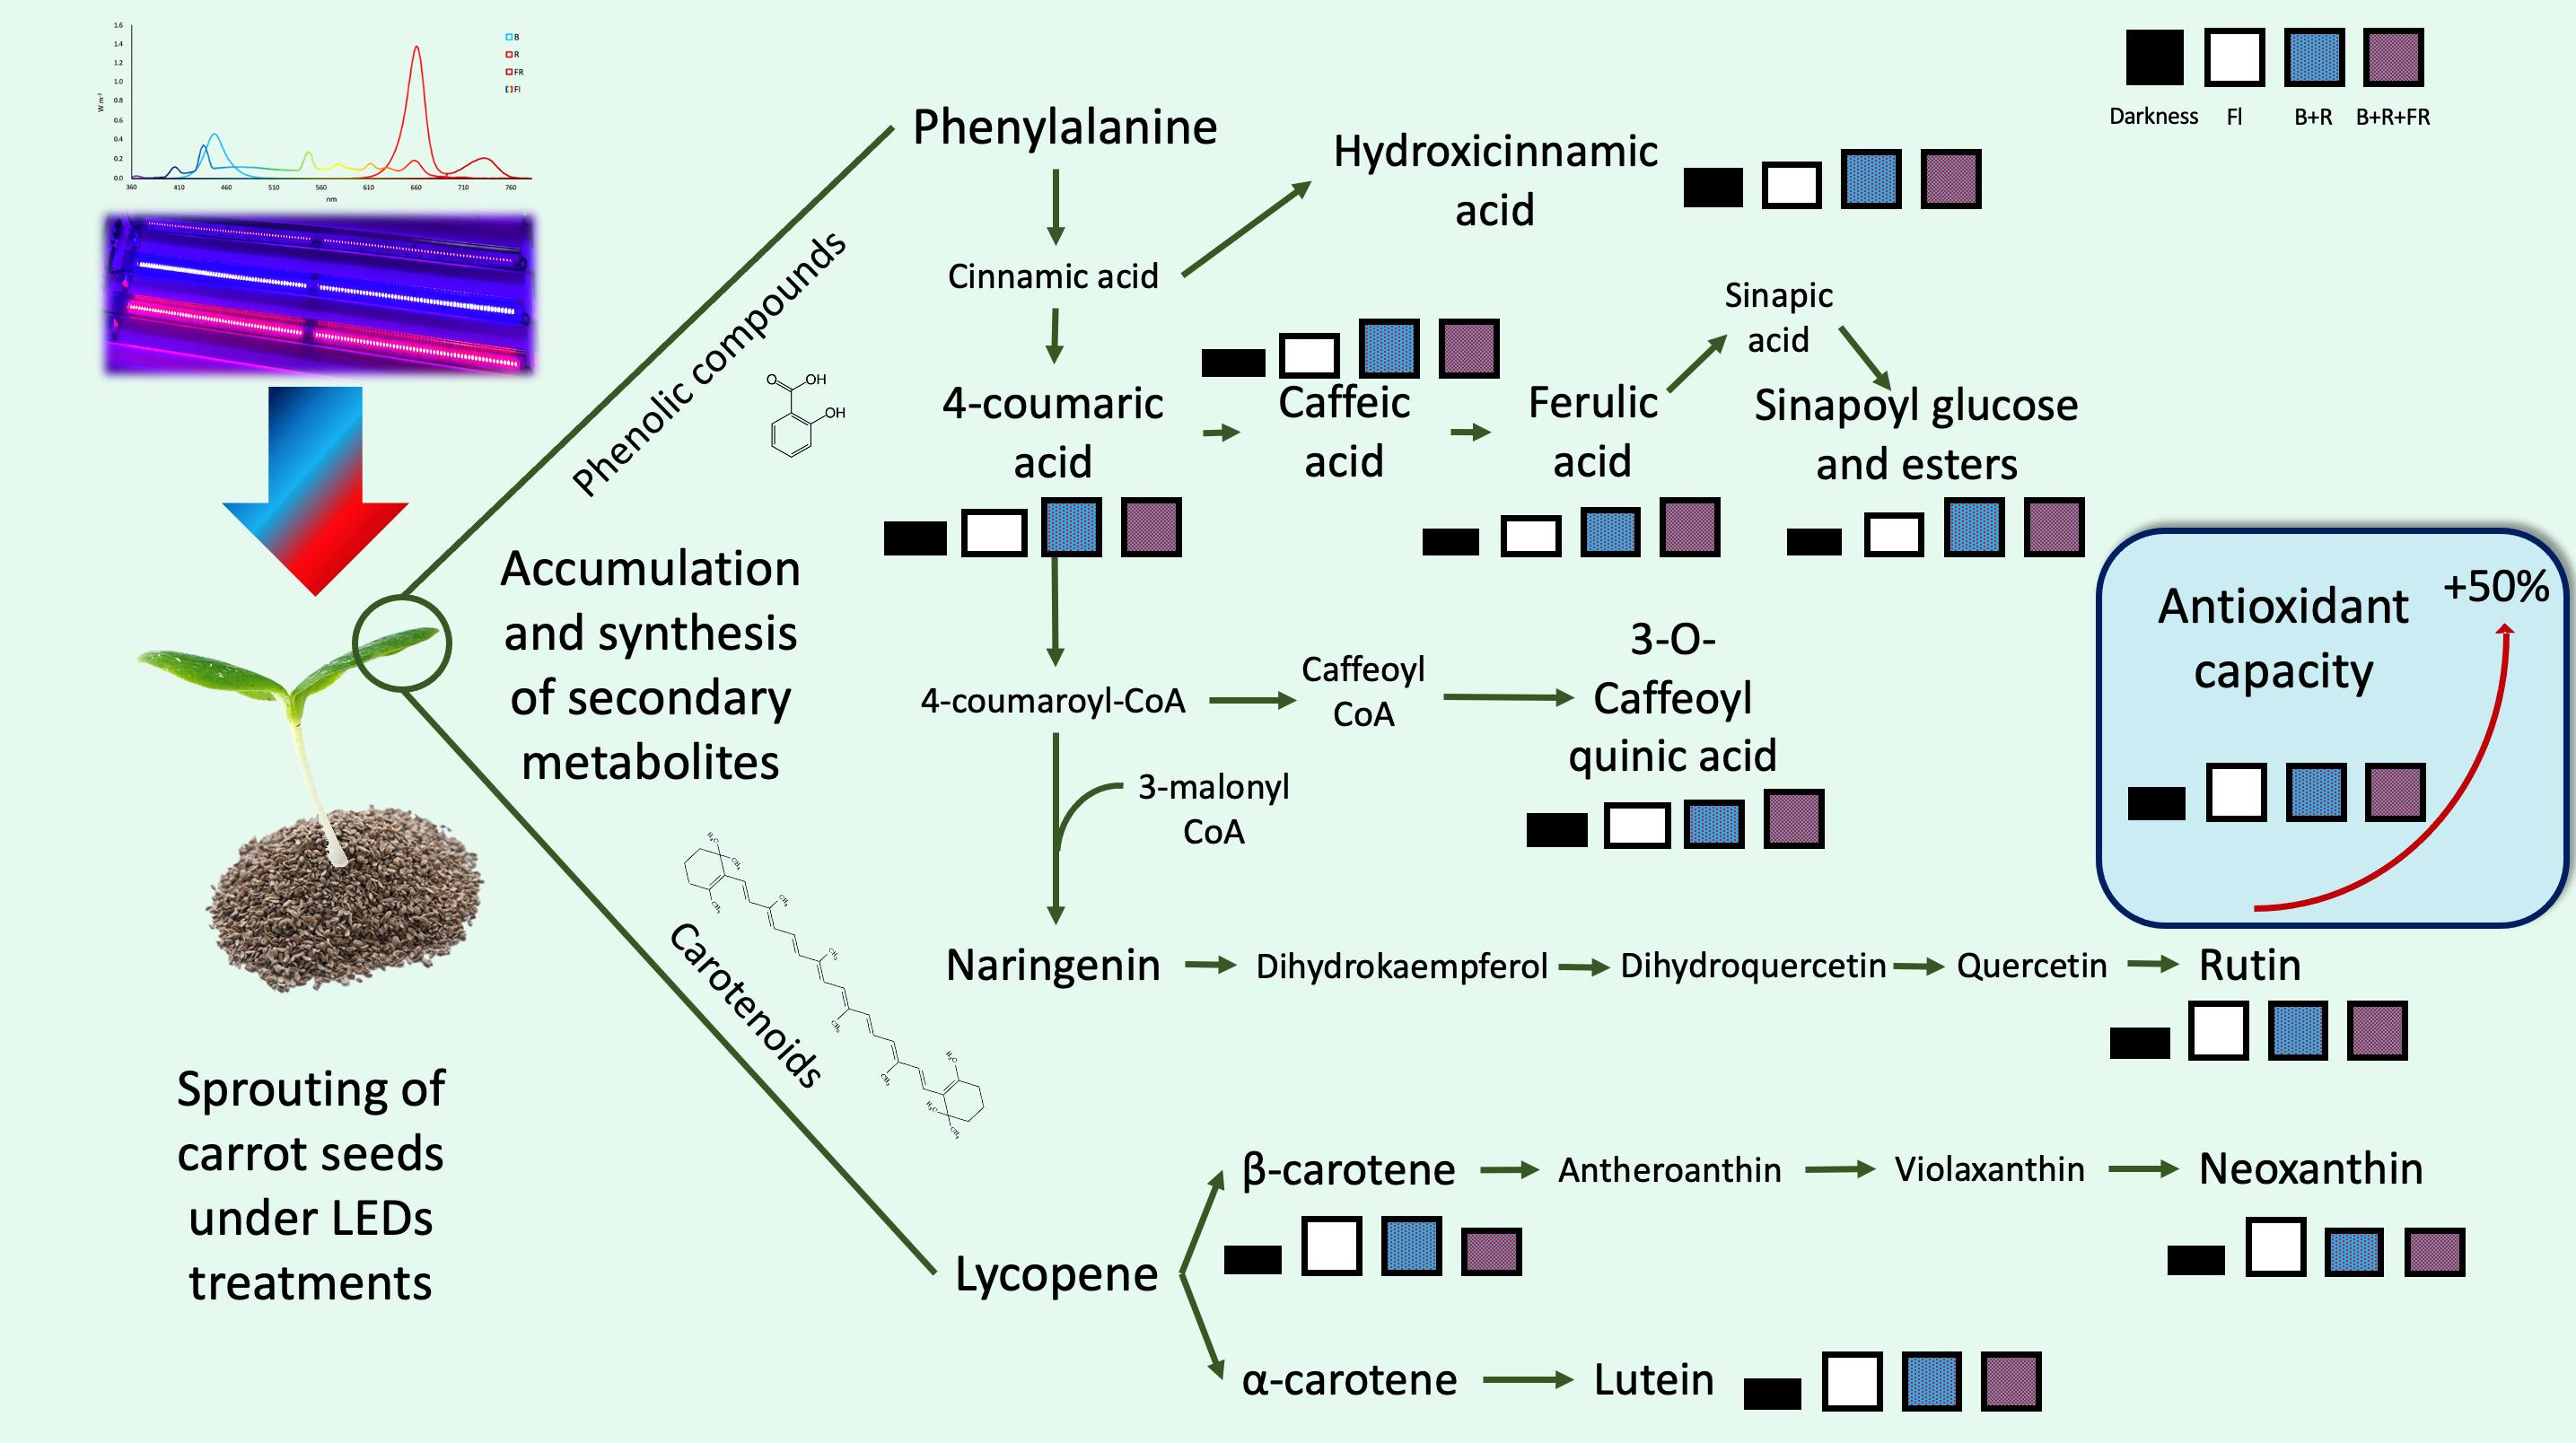
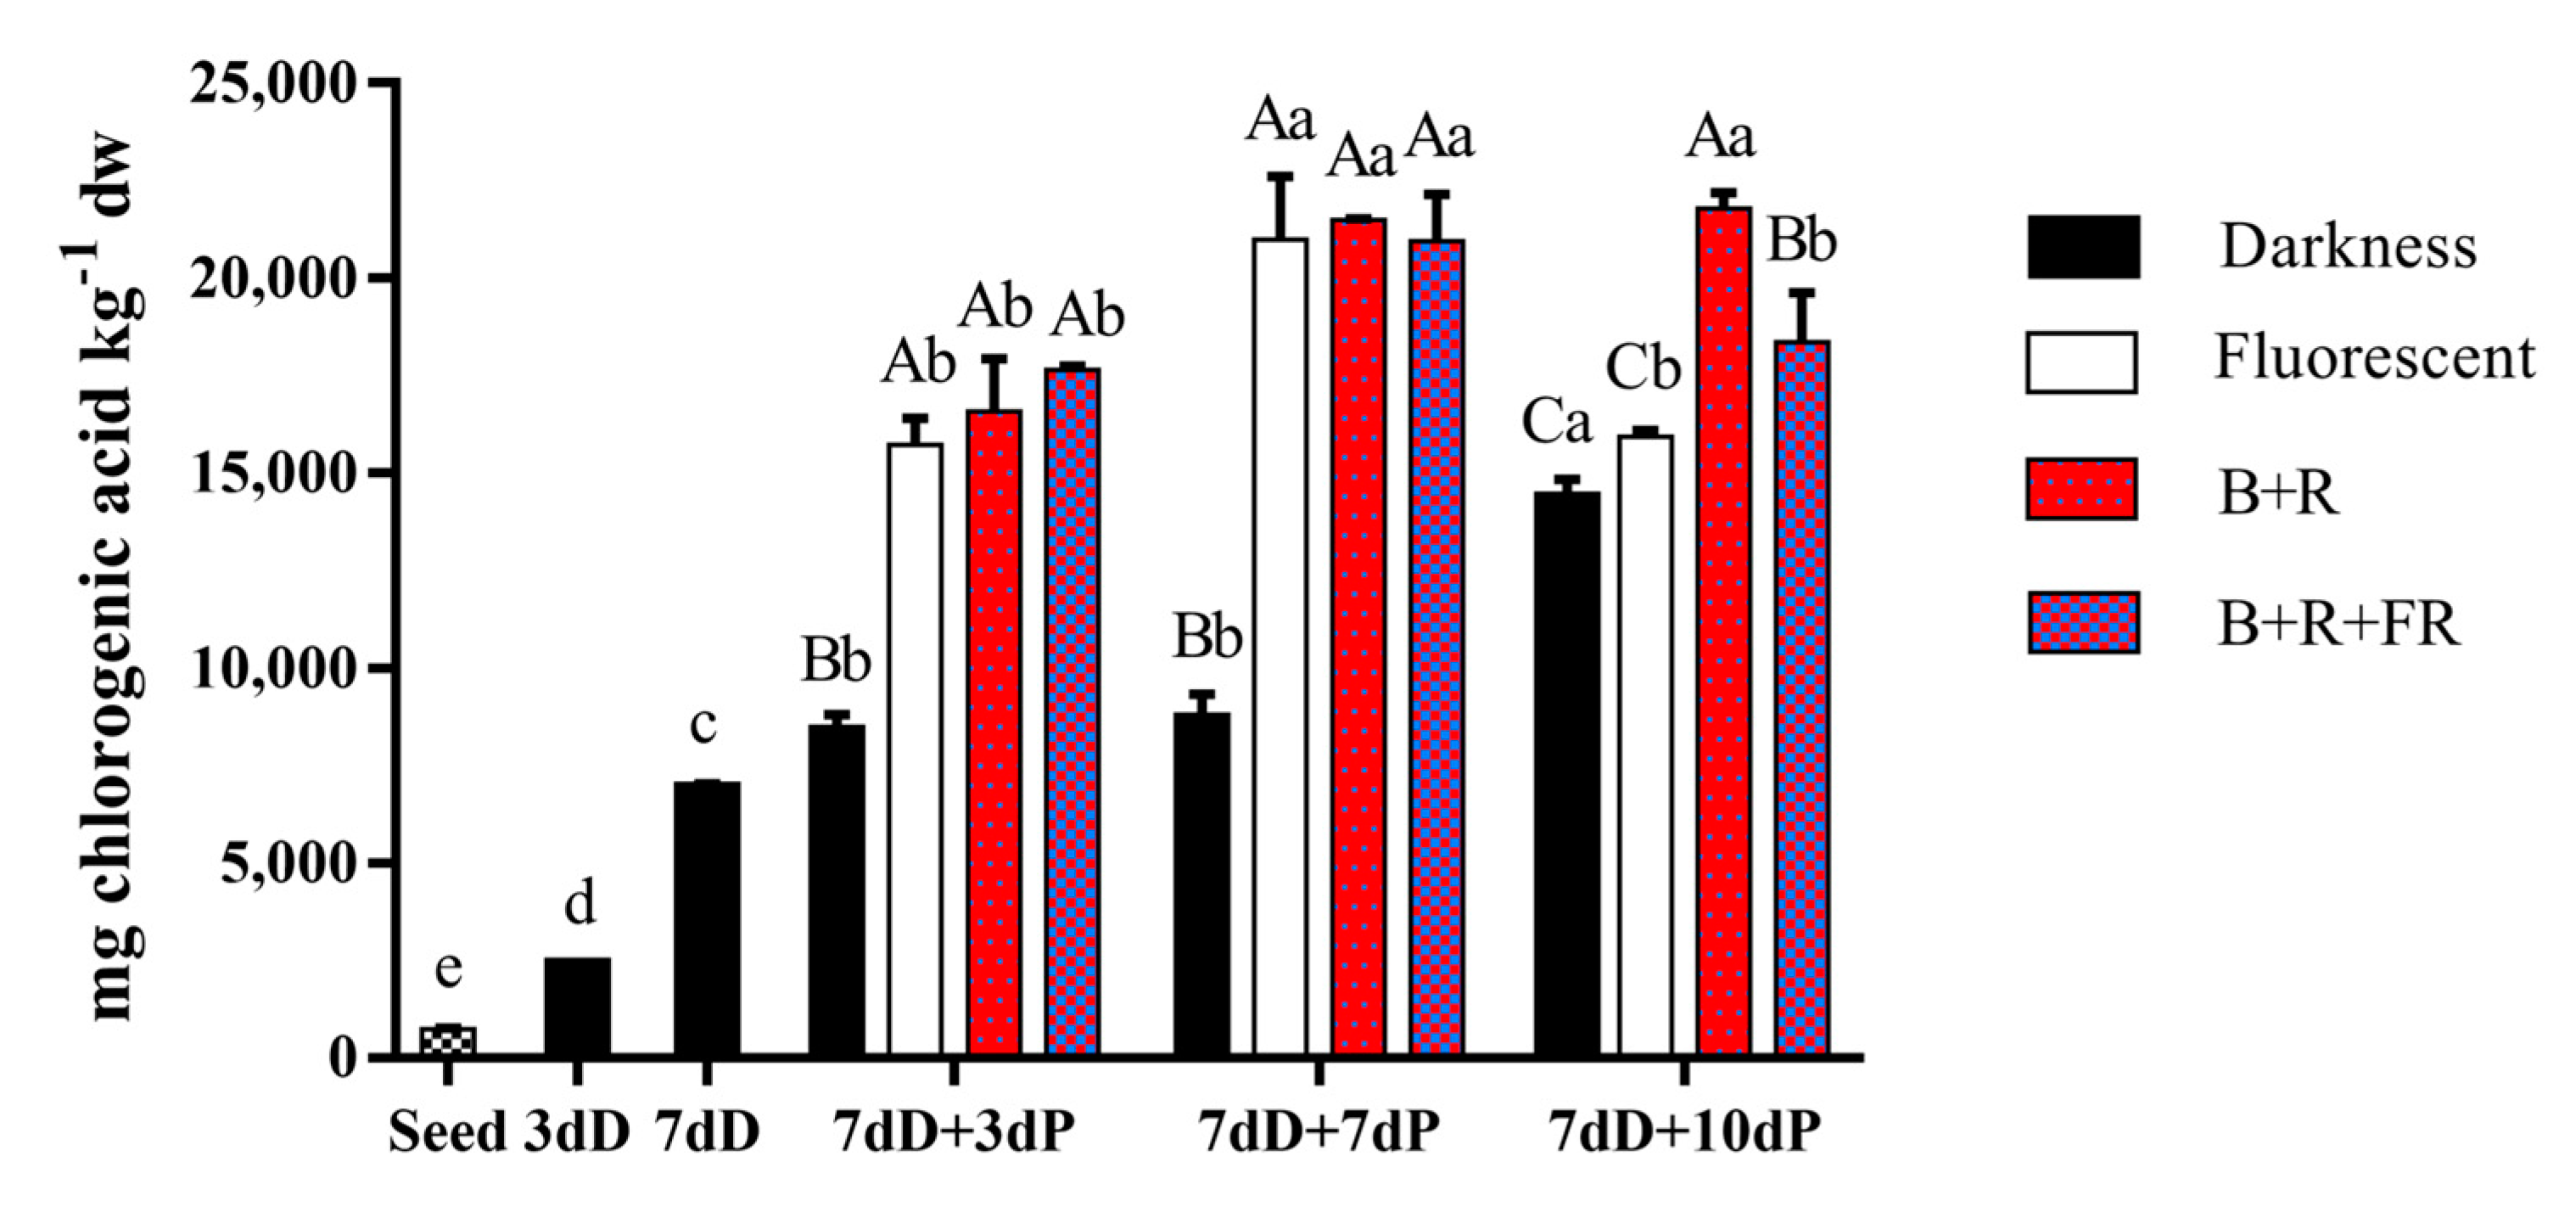
3.2. Total Phenolic Content

Initially, the total phenolic content of the carrot seeds was 737.3 ± 31.2 mg chlorogenic acid kg−1 dw, while after 10 days (7 dD+3 dP), this value was increased more than 10-fold up to 8494 ± 299.3 mg chlorogenic acid kg−1 dw, which was increased 2-fold on day 17 (Figure 4). In addition, on 7 dD+3 dP and 7 dD+7 dP, carrot sprouts treated with Fl and LEDs lights (B+R and B+R+FR) did not present differences between them but increased almost twice the total phenolic content with regards to control treatment (darkness). Hence, seeds germinated under darkness conditions for 7 dD+3 dP and 7 dD+7 dP presented 50% lower concentration of phenolic compounds compared to those germinated under Fl and LEDs lighting during 3 dP and 7 dP. Furthermore, it is remarkable that total phenolic content was kept stable during the 17 days (7 dD+10 dP) of germination only in the samples grown under B+R LEDs, while Fl and B+R+FR treatments reduced the total phenolic content by 24% and 12% with regards to 7 dD+7 dP of sprouting, respectively.

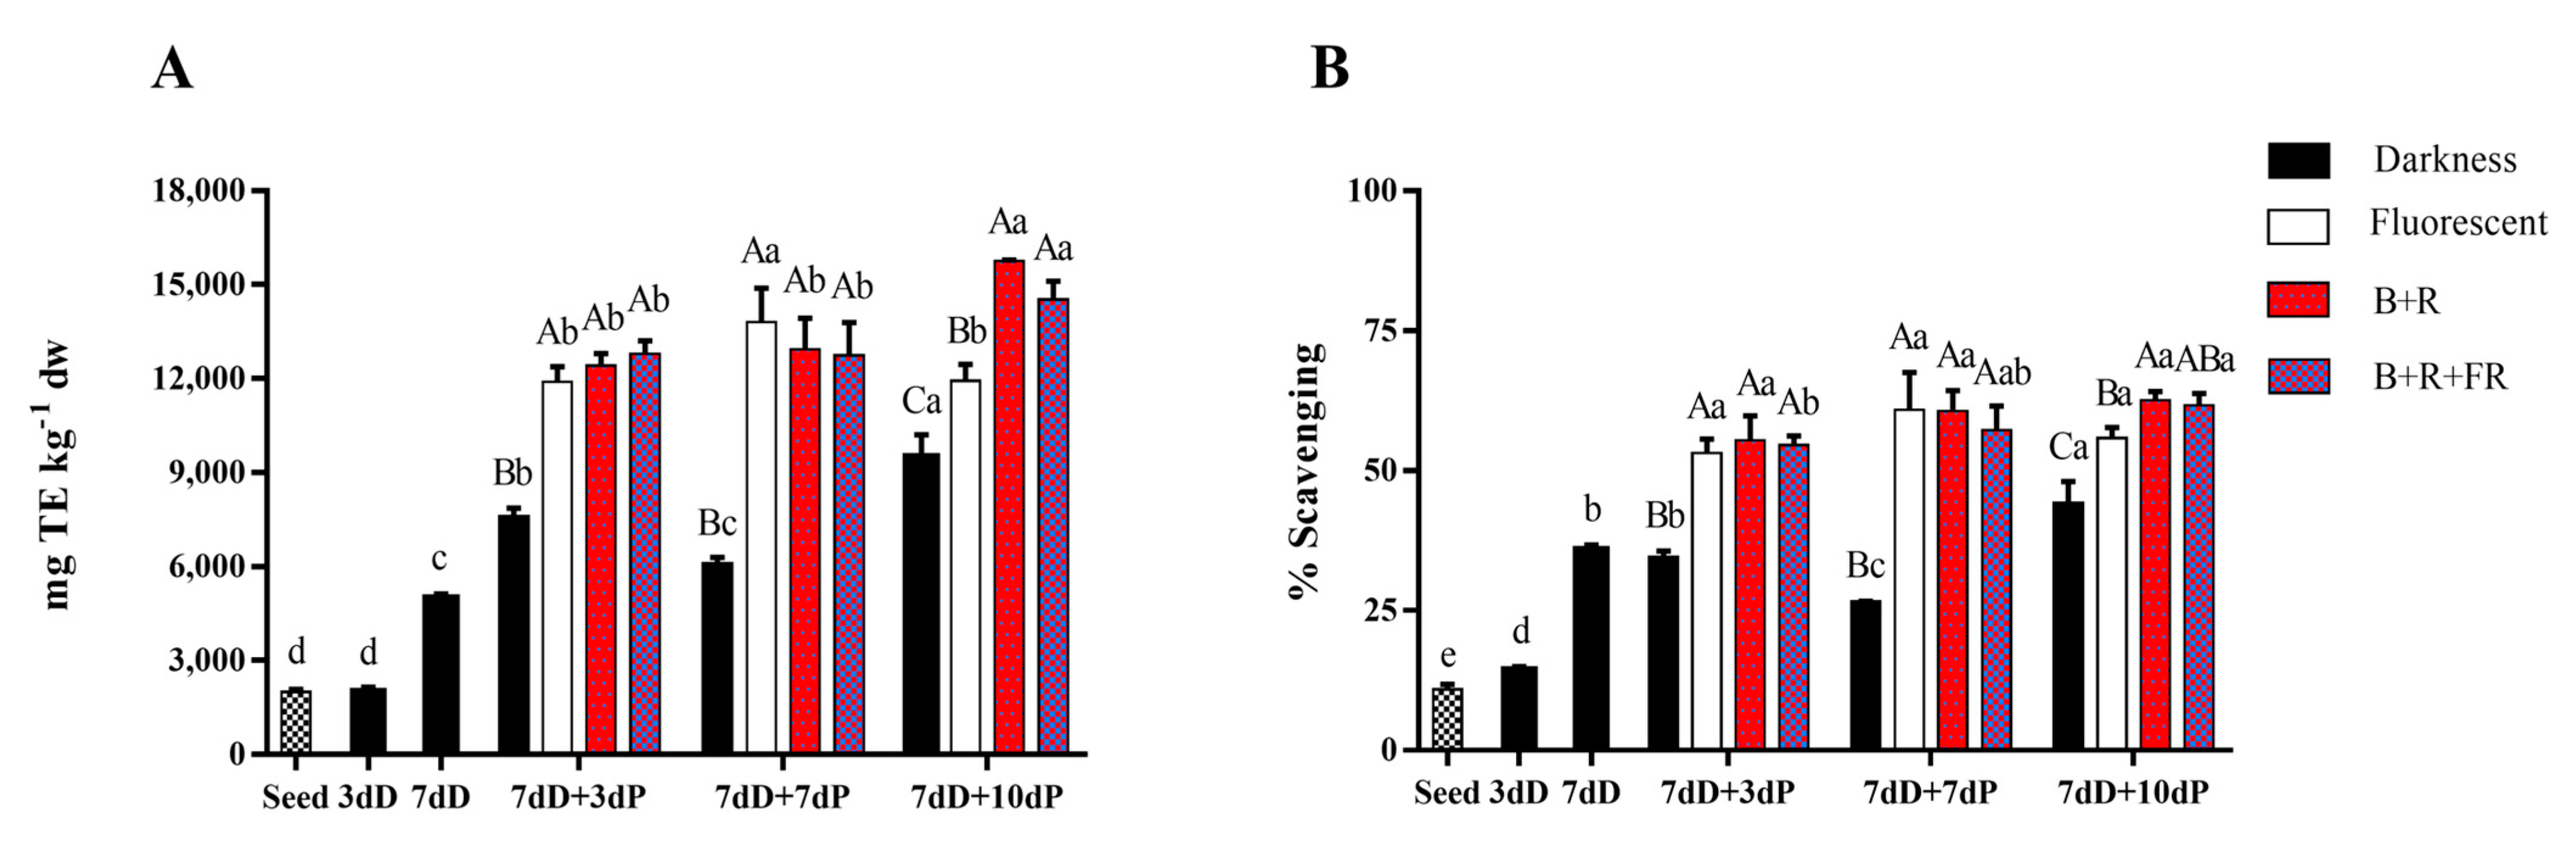
3.3. Total Antioxidant Capacity

Table 2 shows the obtained results of TAC measured by the DPPH free radical scavenging method, FRAP, and ABTS+ radical cation assay. The TAC of carrot seeds measured by DPPH at the beginning of the study was 834.7 ± 39.6 mg TE kg−1, which increased to 7579.4 ± 179.8 mg TE kg−1 after 10 days (7 dD+3 dP) under darkness conditions. On the same sampling day, carrot sprouts treated by Fl or LED (B+R or B+R+FR) lighting increased the TAC by 44%, 50%, and 55% with regards to the samples in darkness, respectively. Moreover, no differences were observed between the light treatments, except on 7 dD+10 dP, when sprouts from the Fl treatment reported 39.4% less TAC than those grown under B+R LEDs, which can also be related to the results obtained for TPC (Figure 4).
The initial TAC of carrot seeds by the FRAP method was 3230.7 ± 194.0 mg TE kg−1, increasing twice under darkness conditions and 4-fold under Fl and LEDs lighting (B+R or B+R+FR) after 7 dD+3 dP. At this time, no differences were shown between light treatments. However, 7 days later, carrot sprouts under Fl lights presented 44% less TAC than B+R samples. In fact, this behavior is very similar to that previously described (DPPH and TPC); hence, changes on TPC can explain these variations on 7 dD+10 dP.
The TAC of carrot seeds measured by the ABTS assay was 1944.8 ± 144.4 mg TE kg−1. This value was increased four times under darkness conditions and seven times under Fl and LED lighting after 7 dD+3 dP. In this case, LED lighting (both B+R and B+R+FR) kept stable values until the end of the study, while carrot sprouts under Fl lighting decreased the TAC by 25% and 27% respectively, compared to LED lighting on 7 dD+10 dP.
In Figure 5, TAC index (Figure 5A) and total scavenging activity index (Figure 5B) are shown. Firstly, TAC (Figure 5A) of carrot seeds measured by DPPH, FRAP, and ABTS was 2003.4 ± 79.2 mg TE kg−1 dw, which increased after sprouting twice and almost four times (7 dD+10 dP) under darkness conditions. Furthermore, light treatments increased the total TAC index by 62% (Fl), 77% (B+R), and 73% (B+R+FR) with regards to the control sample (darkness). In addition, B+R kept the TAC of carrot sprouts stable during the study, showing the highest values, without differences with B+R+FR treatment. Otherwise, Fl lighting showed a reduction of 13.5% among 7 dD+7 dP and 7 dD+10 dP of sprouting. Therefore, combination of LED lighting reported the best results of TAC.
The scavenging activity (Figure 5B) of the studied phenolic compounds leads to the ability to quench free radicals, blocking its reactivity and inhibiting the generation of new radicals able to affect the cells (both vegetal and animal, in this case those of consumers). In this way, the scavenging activity of carrot seeds studied was 10.9% ± 0.6%, which was increased after sprouting in a similar manner, as previously described (Figure 5A). Hence, a general increase is shown under Fl and LED lighting. However, only the combinations of LEDs (B+R or B+R+FR) were able to maintain the scavenging capacity (>60%) on day 7 dD+10 dP of the study compared to Fl, which reported a decrease of ~10%, while darkness showed ~29% less scavenging activity than carrot sprouts under LED lighting on the same day.
High correlations (R2 > 0.900) between TAC (measured by DPPH (R2 = 0.9713), FRAP (R2 = 0.9291), and ABTS (R2 = 0.9836)) and TPC (measured by Folin-Ciocalteu method), were obtained for the studied carrot sprouts.

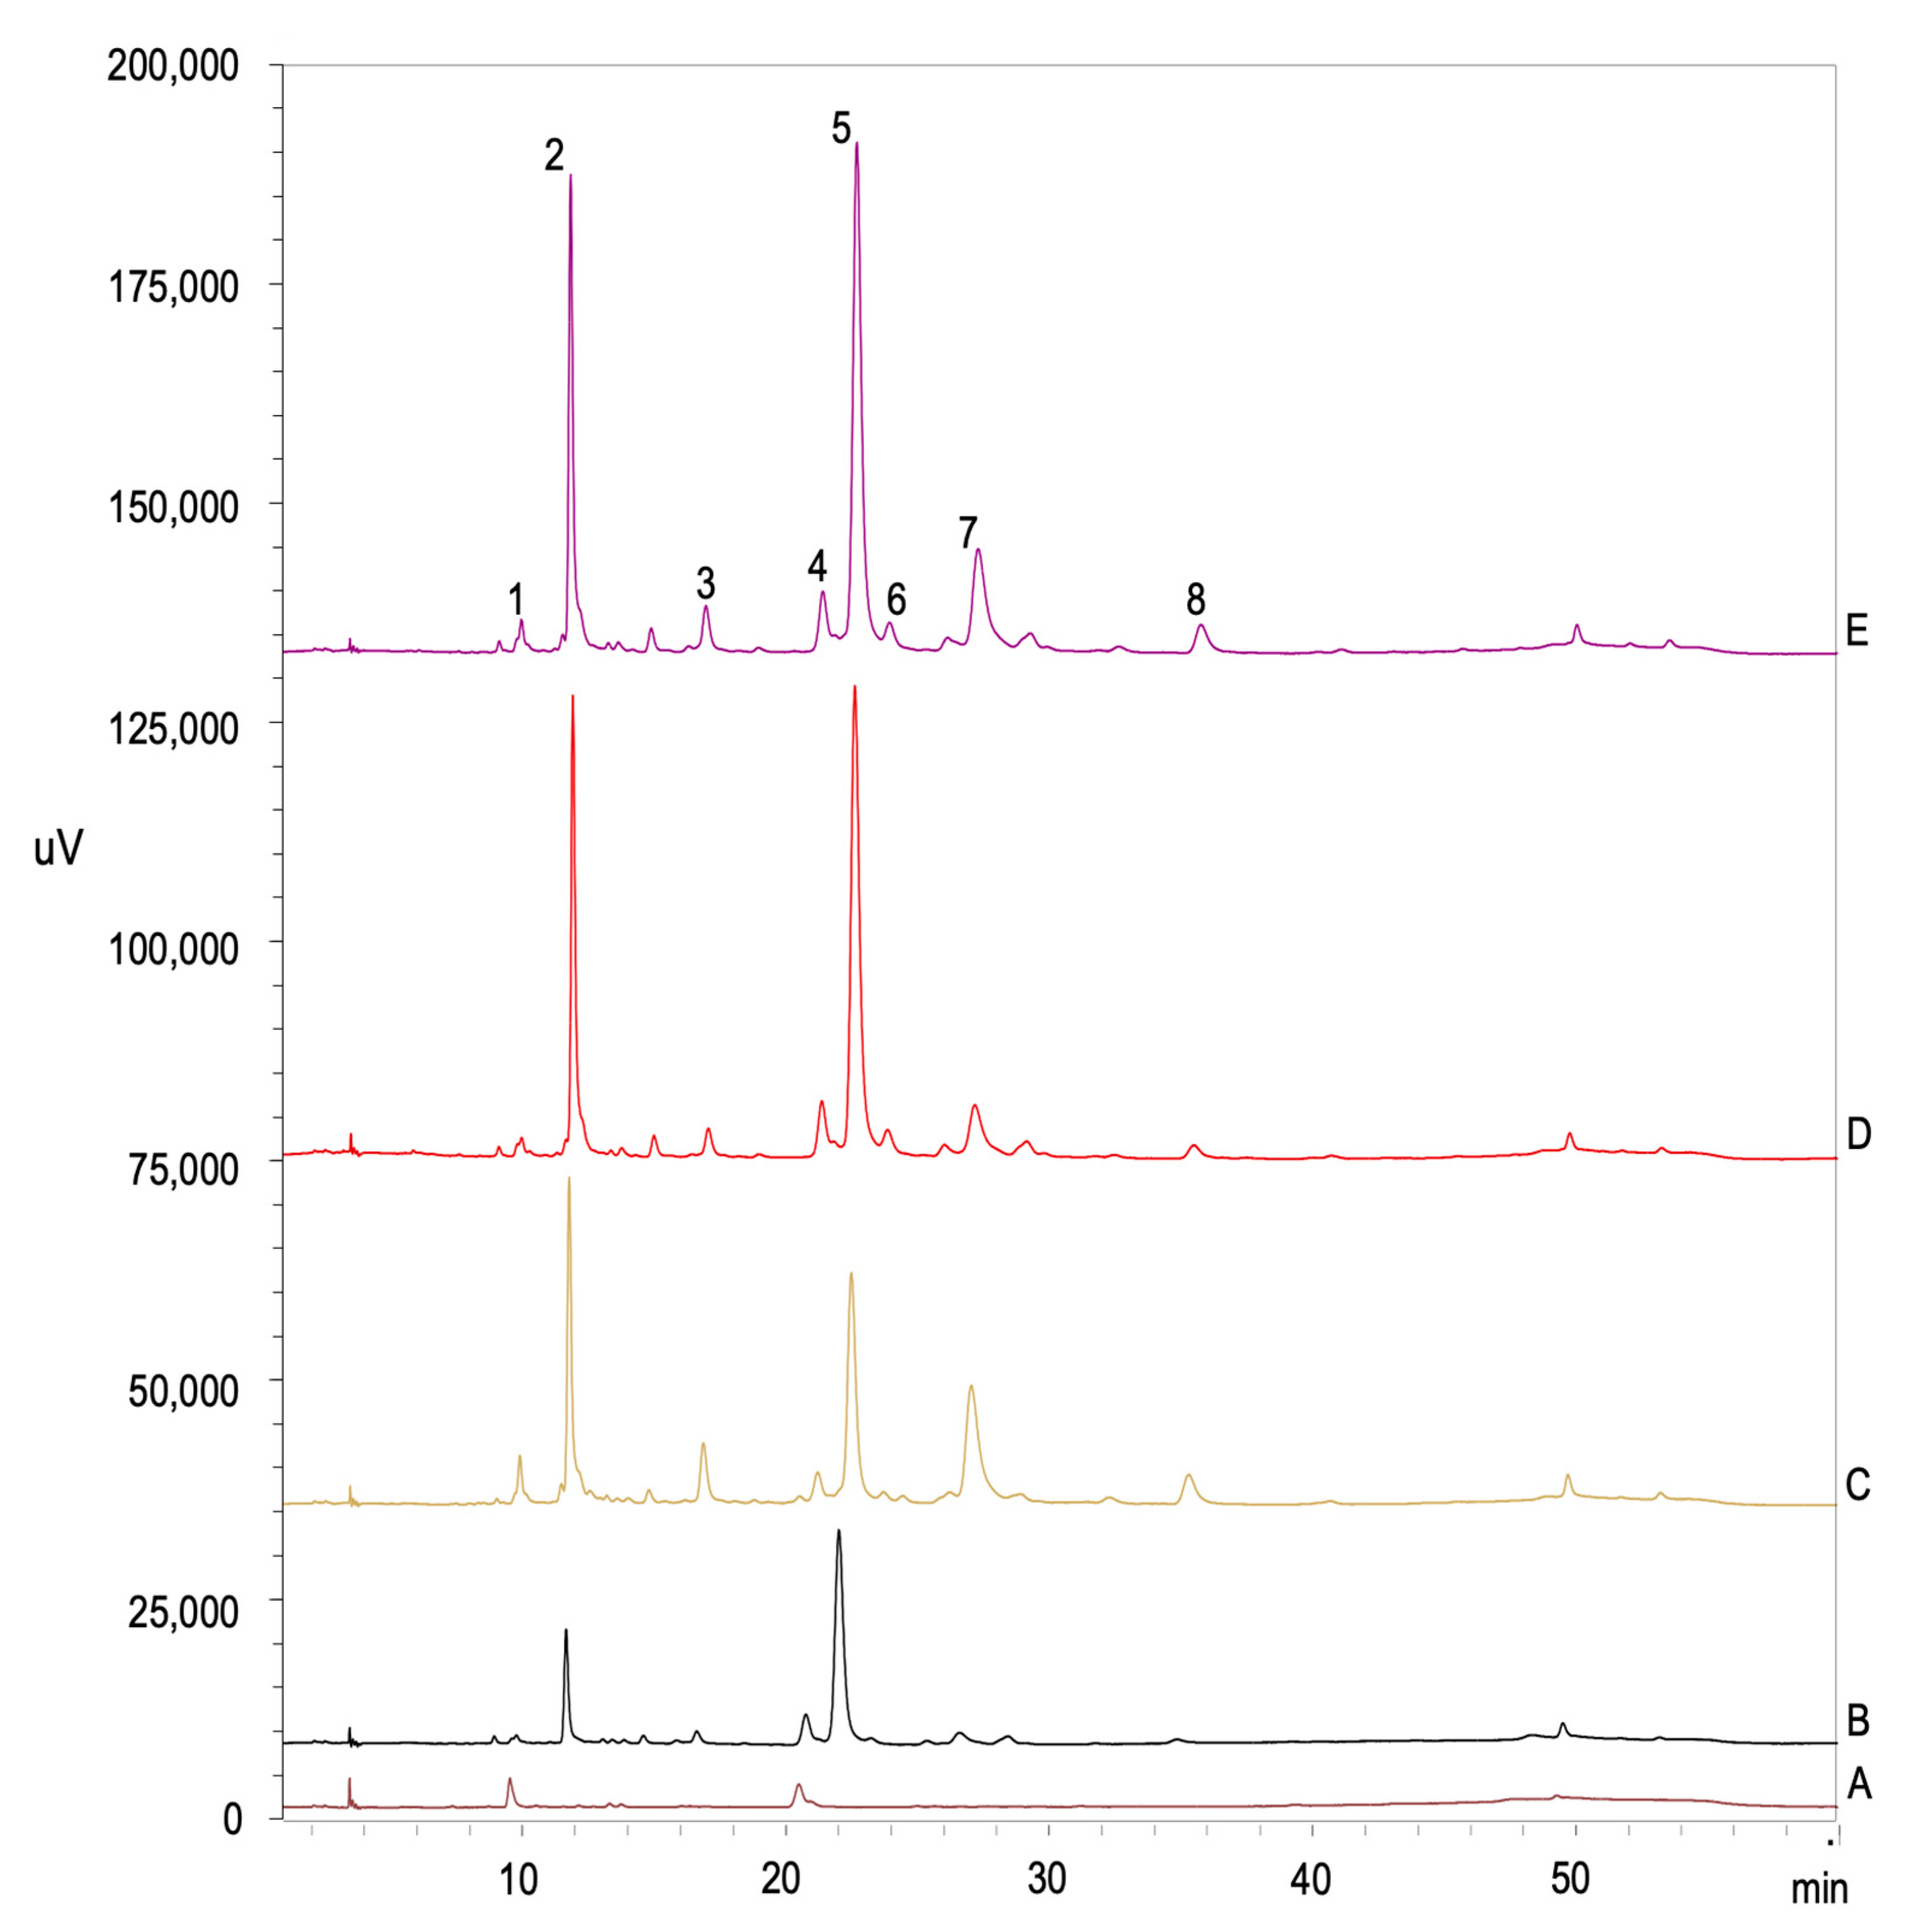
3.4. Individual Phenolic Content
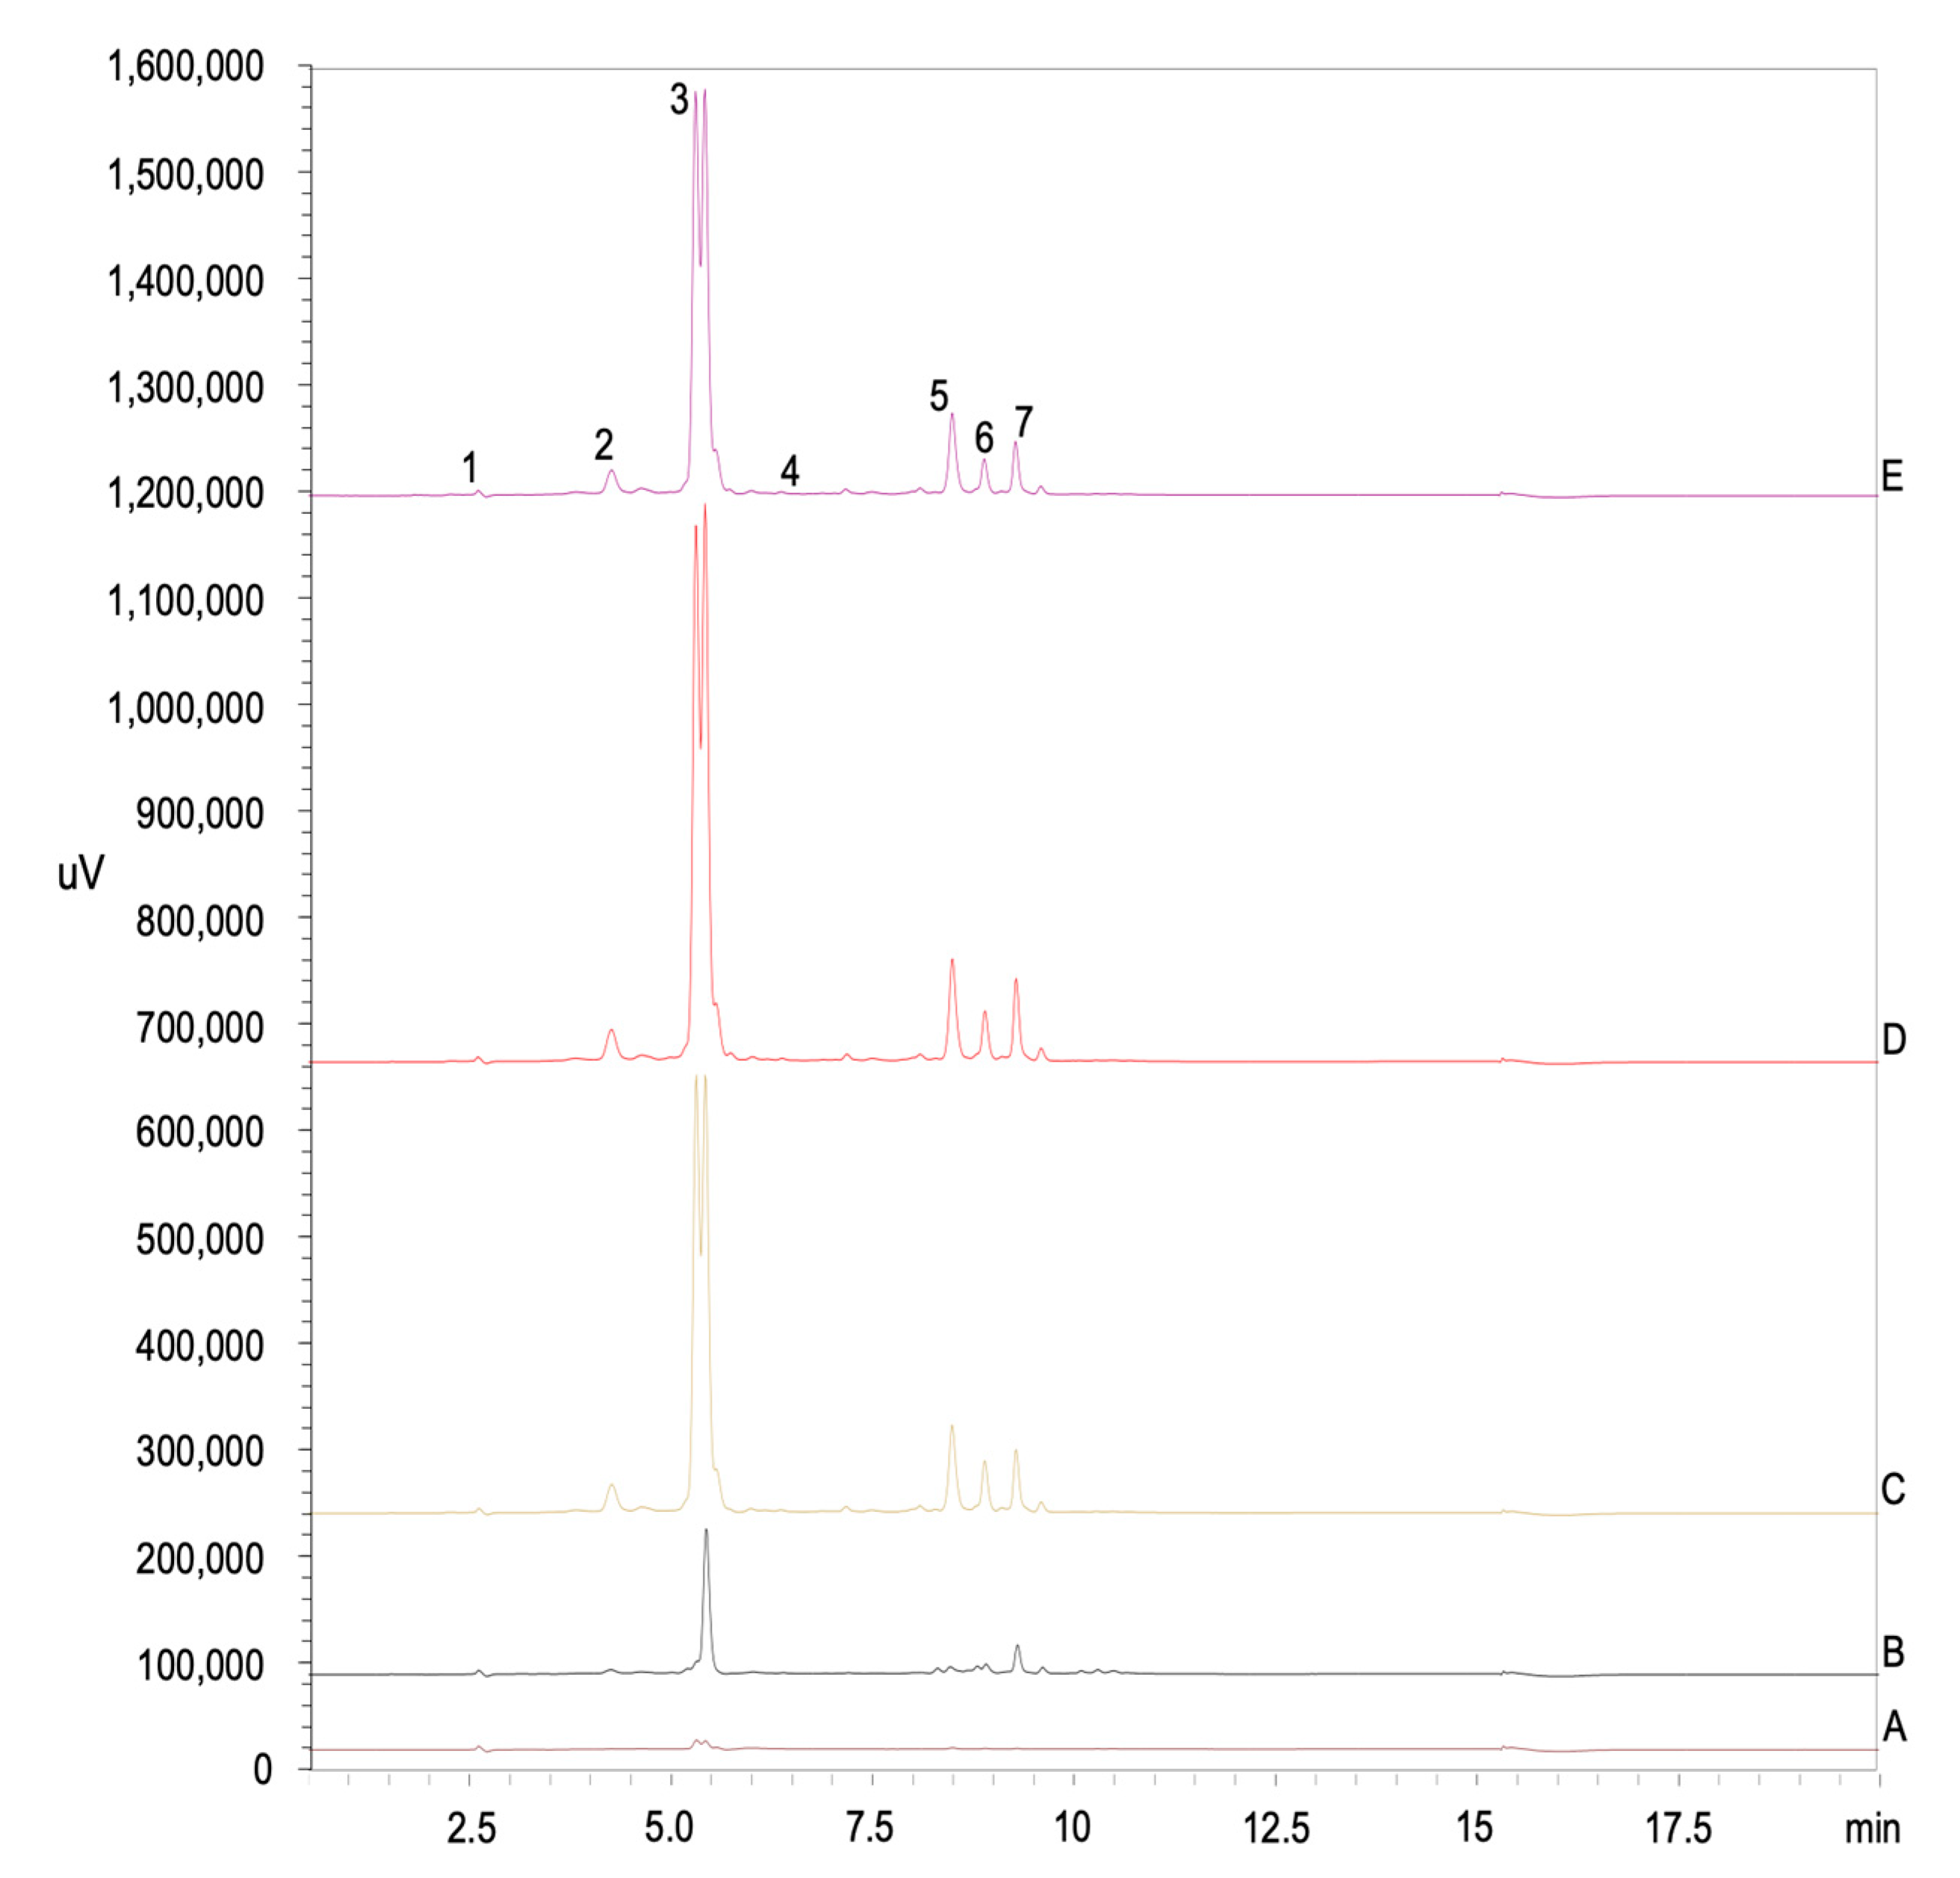
Seven phenolic acids (neochlorogenic, chlorogenic, caffeic, p-coumaric, ferulic, hydroxycinnamic acid, and 1,2-disinapoyl-1′-ferulolylgentiobiose) and one flavonoid (rutin) were identified (Figure 2) in carrot sprouts grown during 17 days at 20 °C under different light treatments (Table 3). Values found for total individual phenolic content differ from those of total phenolic content (Figure 4). Although the same trend was observed, this variation can be explained by the method specificity [22,23], the equipment, and the fact that peaks with very reduced area were not identified.
Actually, carrot sprouts under darkness conditions reported at least 35% less phenolic content than all the studied light treatments, even though the p-coumaric acid and the hydroxycinnamic acid content showed values 20% lower. For that, it can be accepted that applied doses of lighting (168–197 μmol m−2 s−1), either Fl or LED, enhanced the individual phenolic content by 45–65% in carrot sprouts.
On average, B+R+FR treatment reported the highest phenolic content followed by B+R and Fl. In fact, after collecting carrot sprouts, on 3rd (7 dD+3 dP), 7th (7 dD+7 dP), or 10th days (7 dD+10 dP) under B+R+FR photoperiod treatment, the total phenolic content (obtained by adding all peaks) increased by 64% regarding darkness treatment. Besides that, it seems that the incorporation of FR LED lighting intensified the biosynthesis of individual phenolic content by 11% compared to B+R. Moreover, Fl treatment showed 32% less phenolic content than B+R+FR, which can also be related to Folin-Ciocalteau results (Figure 4).
Specifically, the main phenolic compounds identified (neochlorogenic, chlorogenic, caffeic acid, rutin, and 1,2-disinapoyl-1′-ferulolylgentiobiose) were increased (≥10%) by the incorporation of FR to the LED treatment, while some phenolic acids (p-coumaric, ferulic, and hydroxycinnamic acid) did not report significant differences among B+R and B+R+FR treatments. Therefore, it is possible to conclude that FR LED lighting during sprouting is able to enhance the biosynthesis of some phenolic compounds by 10% in carrot sprouts.
B+R and B+R+FR have shown the highest concentrations of phenolic compounds. Moreover, 3 days under LED lighting is enough to increase the concentration of phenolic compounds. Indeed, no great differences can be observed among different collecting days under these conditions. However, darkness treatment showed a slight rise through sprouting period (from 7 dD+3 dP to 7 dD+10 dP) without reaching the concentration of bioactive compounds shown by Fl, B+R, or/and B+R+FR. For this reason, and thanks to the application of light during growth, the optimum time for harvesting carrot sprouts has been reduced by 7 days (to 7 dD+3 dP), in terms of phenolic compound content, antioxidant capacity, and morphological characteristics, which would mean effective economic savings in industries dedicated to the cultivation of sprouts.

3.5. Carotenoids

The carotenoids found in carrot sprouts grown up to 7 dD+10 dP under different lighting treatments were all-trans neoxanthin, lutein, β-carotene, and their cis-isomers (Table 4). All the identified carotenoids are shown in Figure 3. The total carotenoid content in carrot seeds was 7.3 ± 0.2 mg kg−1, from which all-trans lutein and β-carotene cis-isomers were the main carotenoids found (60%). The carotenoid synthesis increased when sprouts were moved from darkness to light photoperiod. After a 3-day light stimulus (Fl and both B+R and B+R+FR LED treatments), an increase in the total carotenoid content by 237%, 290%, and 153% was respectively found on 7 dD+3dP, which was higher for B+R LED related to the other treatments. However, no significant differences were found between Fl and B+R LED treatments after 7 dD+10 dP. A higher proportion of red and blue LED light (B+R) increased the all-trans β-carotene and its cis-isomers in carrot sprouts after 7 dD+10 dP of germination compared to B+R+FR. While the FR spectra supplementation (B+R+FR) did not show significant differences over the rest of the individual carotenoids compared to B+R.
In addition, the yellowish pigmentation of the roots and the green coloring of the first leaves of carrot sprouts under light conditions show an increase in carotene and lutein content, respectively. The sprouts under dark conditions had colorless and thinner roots, as well as a white hypocotyl and yellowish leaves. These effects of B, R, and FR light on carrot sprouts have not been previously published in the bibliography.

4. Discussion

Darkness conditions favored a rapid growth of the hypocotyl in order to reach the soil (etiolation), depleting seed reserves [6]. Phytochromes and cryptochromes are responsible for promoting the appearance of cotyledons in order to start the photosynthetic cycle [6]. These results can be explained by different behaviors of LED application during plant growing, which several authors have already studied. For instance, red and far-red LED lighting showed a decrease in the elongation of the hypocotyl, acting through the phytochromes phyB and phyA, respectively [24,25]. Furthermore, blue light strongly inhibits stem elongation under high light rates [26]. This inhibition is mainly caused by cryptochromes, and it is maintained as long as blue light is present during the plant growth [27]. In this sense, Ohtake et al. [10] and Kuno et al. [28] reported that alternation of preharvest blue and red LED lighting in lettuce showed better results than combination of those lights.
Besides, similar values shown by carrot sprouts under a Fl photoperiod for 10 days can also be justified by the spectral composition of this light (Figure 1), with no significant differences. In fact, the high content of blue, green, and red in the Fl light spectrum is shown in Figure 1, which may also be related to that mentioned above [24,25,26,27].
There are some previous studies which reported that light has the ability to increase the phenolic compounds content in sprouts. For instance, Park et al. [29] showed an increase of 10–30% phenolic compounds after growing canola sprouts for 14 days under a 16 h blue photoperiod (flux rate of 50 µmol s−1 m−2) at 25 °C compared to white and red treatments. Also, Kwack et al. [11] showed an increase of the total phenolic content after 3 days of blue, red, and green lighting compared to control treatment (darkness) before harvesting (on the 5th day) in alfalfa, broccoli, clover, kohlrabi, radish, and red radish sprouts. Similarly, Liu et al. [30] has also shown a 25% increase of the total phenolic content in pea sprouts grown under blue, red, and white lighting (2 mg GAE g−1 dw) compared to darkness and yellow lighting (1.5 mg GAE g−1 dw). Hence, the increase of the total phenolic content of carrot sprouts exposed to alternating blue and red LED lighting and fluorescent lamps can be considered adequate for sprouts’ quality.
Previous studies found that the combination of blue and red lights, both simultaneously [31] and separately [32], increased the total phenolic content by improving photosynthesis, as well as the malonyl-CoA production, which is associated with the synthesis of phenolic compounds. In this sense, our results demonstrate for the first time that the application of blue and red LED lighting in separate phases of the light cycle during carrot sprouting improved the total phenolic content.
Described results of individual phenolic content can be justified by the normal behavior of young plants exposed to lighting from different wavelengths. As previously described, B and R lights selectively activate different photoreceptors related to photosynthesis, plant development, and synthesis of bioactive compounds like cryptochromes [7], phototropins [6], Zeitlupe family proteins [8], and phytochromes [9]. According to Hossen [33], rutin biosynthesis in buckwheat sprouts has also been influenced by the different combinations of LEDs and lighting cycles (B+R+FR and B+R+G) simultaneously applied. Results obtained from that study indicated that 12 h photoperiod and B+R+FR and B+R+G simultaneous combination of LEDs produced significantly higher amounts of rutin in buckwheat sprouts. Also, our last findings in minimally processed broccoli sprouts showed an increase of phenolic content (individual and total phenolic content) and TAC after the application of postharvest FR LED illumination during 15 days at 5 °C compared to Fl, B, and R lights, individually applied [20].
In addition, other authors have also reported that supplemental FR lighting to B+R LEDs during growth of Crepidiastrum denticulatum improved the concentration of chlorogenic, caffeic, and chicoric acid phenolic compounds 2-fold compared to the B+R illumination [34], simultaneously applied, which can explain the obtained results in the present study.
Rodríguez-Concepción and Stange [35] reported a higher accumulation of β-carotene after root thickening (2-month carrot) in darkness. However, the chloroplasts are differentiated when the carrot roots are illuminated, and the carotenoid profile was like that of leaves with an increase of lutein content. In fact, Frede et al. [36] reported a higher ratio of lutein and β-carotene in pak choi sprouts under different light qualities compared to dark-grown sprouts. Roots under lighting conditions of 4-week carrot sprouts showed similar total carotenoid content to that of our 17-day sprouts under photoperiod (16/8 h). In this way, similarly to our results, the total carotenoids content of roots under darkness conditions was lower than under light conditions [35].
Carotenoids play a fundamental role in protecting the photosynthetic mechanism of plants against photooxidative damage caused by excessive light energy [35]. The increase in carotenoids after the change of sprout conditions from darkness to light shows the beginning of the de-etiolation process [36]. In addition, carotene cis-isomers concentration increased with respect to trans-isomers amount during the germination in light conditions. This behavior is due to the photoisomerization of trans-isomers under light [21].
The effect of LED light on carotenoid content depends on the species, varieties, or irradiance levels (PPF). Brazaitytė et al. [37] reported that supplemental blue, red, and green LED light increase the content of α-carotene and β-carotene of Brassicaceae microgreens. In general terms, red light promotes photosynthesis and improves vegetative growth by increasing the chlorophyll content, and blue light is absorbed by carotenoid pigments, favoring the opening of the stomas [9]. In this sense, also, Huang et al. [32] have recently shown that a 4 h interval of supplemental red and blue lights (16 h in total: 1250 kJ m−2), alternatively applied, improves the accumulation of phenolic compounds and carotenoids in green-leaf and red-leaf pak choi. However, the ratio of red and blue light must be optimized for each species [38].

5. Conclusions

We have reported an initial overview of how carrot sprouts’ germination and growth are affected by several alternating LED light treatments. Darkness conditions improved morphological growth regarding Fl and LED lighting. However, B+R and B+R+FR treatments stimulated the phenolic and carotenoid synthesis (total and individual), subsequently increasing the total antioxidant capacity. Indeed, the phenolic content was increased by 45% and 65% after LED lighting (B+R and B+R+FR), while the carotenoids content increased by 279% and 220% respectively, during the 10 days of the photoperiod assayed, compared to darkness treatment. Besides that, B+R and B+R+FR treatments were able to maintain the increased total antioxidant capacity and the biosynthesis of bioactive compounds from 7 dD+3 dP to 7 dD+10 dP compared to Fl and darkness treatments. Then, the optimum moment to harvest carrot sprouts would be after 7 dD+3 dP, applying B+R LEDs during the 16 h lighting/8 h darkness photoperiod, in which the best overall quality is reached. Nevertheless, if the objective is to reach an enhanced concentration of phenolic acids (neochlorogenic, chlorogenic, caffeic acid, rutin, and 1,2-disinapoyl-1′-ferulolylgentiobiose), it would be recommended to add 15% FR to B+R LED lighting during the last three days of sprouting, although this treatment tends to decrease the carotenoid content by 59% compared to B+R. However, a high concentration of carotenoids would be more interesting since carrots are especially rich in those pigments, being a more important source when compared to other vegetable sprouts.

Supplementary Materials

The following are available online at https://0-www-mdpi-com.brum.beds.ac.uk/2073-4395/11/2/304/s1, Figure S1: PDA spectra of identified carotenoid peaks of carrot sprouts. (1) all-trans neoxanthin, (2) 13 or 13´-cis lutein, (3) all-trans lutein, (4) 9-cis lutein, (5) 15-cis β-carotene, (6) all-trans β-carotene, and (7) 9-cis β-carotene.

Author Contributions

Conceptualization and methodology: F.A.-H., L.M.-Z. and N.C.; performed the experiments: L.M.-Z. and N.C.; investigation: F.A.-H., L.M.-Z. and N.C.; software: L.M.-Z. and N.C.; validation: F.A.-H., L.M.-Z. and N.C.; resources: F.A.-H.; data curation: L.M.-Z. and N.C.; writing—original draft preparation+review and editing: F.A.-H., L.M.-Z., N.C. and P.A.G.; visualization: F.A.-H.; supervision: F.A.-H.; project administration: F.A.-H.; funding acquisition: F.A.-H. All authors have read and agreed to the published version of the manuscript.

Funding

Project financed by the Autonomous Community of the Region of Murcia n ° 20849/PI/18 through the grant call for projects for the development of scientific and technical research by competitive groups, included in the Regional Programme for the Promotion of Scientific and Technical Research (Action Plan 2018) of the Seneca Foundation—Science and Technology Agency of the Region of Murcia (Spain).

Institutional Review Board Statement

Not applicable.

Informed Consent Statement

Not applicable.

Data Availability Statement

Not applicable.

Acknowledgments

Noelia Castillejo was funded by a predoctoral grant (FPU16/04763) from the Spanish Ministry of Education. Lorena Martínez-Zamora’s contract has been co-financed by the European Social Fund (ESF) and the Youth European Initiative (YEI) under the Spanish Seneca Foundation (21322/PDGI/19). The technical assistance of Francisca Andreo is highly appreciated.

Conflicts of Interest

The authors declare no conflict of interest.

References

  1. Cisneros-Zevallos, L.; Jacobo-Velázquez, D.A. Controlled Abiotic Stresses Revisited: From Homeostasis through Hormesis to Extreme Stresses and the Impact on Nutraceuticals and Quality during Pre- and Postharvest Applications in Horticultural Crops. J. Agric. Food Chem. 2020, 11877–11879. [Google Scholar] [CrossRef] [PubMed]
  2. Pennisi, G.; Blasioli, S.; Cellini, A.; Maia, L.; Crepaldi, A.; Braschi, I.; Spinelli, F.; Nicola, S.; Fernandez, J.A.; Stanghellini, C.; et al. Unraveling the role of red:Blue LED lights on resource use efficiency and nutritional properties of indoor grown sweet basil. Front. Plant Sci. 2019, 10, 305. [Google Scholar] [CrossRef] [PubMed] [Green Version]
  3. Pennisi, G.; Orsini, F.; Blasioli, S.; Cellini, A.; Crepaldi, A.; Braschi, I.; Spinelli, F.; Nicola, S.; Fernandez, J.A.; Stanghellini, C.; et al. Resource use efficiency of indoor lettuce (Lactuca sativa L.) cultivation as affected by red:blue ratio provided by LED lighting. Nat. Sci. Rep. 2019, 9, 14127. [Google Scholar] [CrossRef]
  4. Cisneros-Zevallos, L. The use of controlled postharvest abiotic stresses as a tool for enhancing the nutraceutical content and adding-value of fresh fruits and vegetables. J. Food Sci. 2003, 68, 1560–1565. [Google Scholar] [CrossRef]
  5. Bliznikas, Z.; Žukauskas, A.; Samuoliene, G.; Viršile, A.; Brazaityte, A.; Jankauskiene, J.; Duchovskis, P.; Novičkovas, A. Effect of supplementary pre-harvest LED lighting on the antioxidant and nutritional properties of green vegetables. Acta Hortic. 2012, 939, 85–91. [Google Scholar] [CrossRef]
  6. Chen, M.; Chory, J.; Fankhauser, C. Light signal transduction in higher plants. Annu. Rev. Genet. 2004, 38, 88–117. [Google Scholar] [CrossRef] [Green Version]
  7. Chen, M.; Chory, J. Phytochrome signaling mechanisms and the control of plant development. Trends Cell Biol. 2011, 21, 664–671. [Google Scholar] [CrossRef] [Green Version]
  8. Chen, M.; Blankenship, R.E. Expanding the solar spectrum used by photosynthesis. Trends Plant Sci. 2011, 16, 426–431. [Google Scholar] [CrossRef]
  9. Huché-Thélier, L.; Crespel, L.; Le Gourrierec, J.; Morel, P.; Sakr, S.; Leduc, N. Light signaling and plant responses to blue and UV radiations-Perspectives for applications in horticulture. Environ. Exp. Bot. 2016, 121, 22–38. [Google Scholar] [CrossRef]
  10. Ohtake, N.; Ishikura, M.; Suzuki, H.; Yamori, W.; Goto, E. Continuous irradiation with alternating red and blue light enhances plant growth while keeping nutritional quality in lettuce. HortScience 2018, 53, 1804–1809. [Google Scholar] [CrossRef] [Green Version]
  11. Kwack, Y.; Kim, K.K.; Hwang, H.; Chun, C. Growth and quality of sprouts of six vegetables cultivated under different light intensity and quality. Hortic. Environ. Biotechnol. 2015, 56, 437–443. [Google Scholar] [CrossRef]
  12. Galieni, A.; Falcinelli, B.; Stagnari, F.; Datti, A.; Benincasa, P. Sprouts and microgreens: Trends, opportunities, and horizons for novel research. Agronomy 2020, 10, 1424. [Google Scholar] [CrossRef]
  13. Nam, T.G.; Kim, D.O.; Eom, S.H. Effects of light sources on major flavonoids and antioxidant activity in common buckwheat sprouts. Food Sci. Biotechnol. 2018, 27, 169–176. [Google Scholar] [CrossRef]
  14. Seo, J.M.; Arasu, M.V.; Kim, Y.B.; Park, S.U.; Kim, S.J. Phenylalanine and LED lights enhance phenolic compound production in Tartary buckwheat sprouts. Food Chem. 2015, 117, 204–213. [Google Scholar] [CrossRef]
  15. Arscott, S.A.; Tanumihardjo, S.A. Carrots of many colors provide basic nutrition and bioavailable phytochemicals acting as a functional food. Compr. Rev. Food Sci. Food Saf. 2010, 9, 223–239. [Google Scholar] [CrossRef]
  16. Que, F.; Hou, X.L.; Wang, G.L.; Xu, Z.S.; Tan, G.F.; Li, T.; Wang, Y.H.; Khadr, A.; Xiong, A.S. Advances in research on the carrot, an important root vegetable in the Apiaceae family. Hortic. Res. 2019, 6, 1–15. [Google Scholar] [CrossRef] [Green Version]
  17. Singleton, V.L.; Rossi, J.A.J. Colorimetry of total phenolics with phosphomolybdic-phosphotungstic acid reagents. Am. J. Enol. Vitic. 1965, 16, 144–158. [Google Scholar]
  18. Moreira-Rodríguez, M.; Nair, V.; Benavides, J.; Cisneros-Zevallos, L.; Jacobo-Velázquez, D.A. UVA, UVB light, and methyl jasmonate, alone or combined, redirect the biosynthesis of glucosinolates, phenolics, carotenoids, and chlorophylls in broccoli sprouts. Int. J. Mol. Sci. 2017, 18, 2330. [Google Scholar] [CrossRef] [Green Version]
  19. Castillejo, N.; Martínez-Hernández, G.B.; Monaco, K.; Gómez, P.A.; Aguayo, E.; Artés, F.; Artés-Hernández, F. Preservation of bioactive compounds of a green vegetable smoothie using short time-high temperature mild thermal treatment. Food Sci. Technol. Int. 2017, 23, 46–60. [Google Scholar] [CrossRef] [PubMed] [Green Version]
  20. Castillejo, N.; Martínez-Zamora, L.; Gómez, P.A.; Pennisi, G.; Crepaldi, A.; Fernández, J.A.; Orsini, F.; Artés–Hernández, F. Postharvest Led Lighting: Effect of Red, Blue, and Far Red on Quality Of Minimally Processed Broccoli Sprouts. J. Sci. Food Agric. 2020, 101, 44–53. [Google Scholar] [CrossRef] [PubMed]
  21. Gupta, P.; Sreelakshmi, Y.; Sharma, R. A rapid and sensitive method for determination of carotenoids in plant tissues by high performance liquid chromatography. Plant Methods 2015, 11, 1–12. [Google Scholar] [CrossRef] [Green Version]
  22. Ainsworth, E.A.; Gillespie, K.M. Estimation of total phenolic content and other oxidation substrates in plant tissues using Folin-Ciocalteu reagent. Nat. Protoc. 2007, 2, 875–877. [Google Scholar] [CrossRef]
  23. Georgé, S.; Brat, P.; Alter, P.; Amiot, M.J. Rapid determination of polyphenols and vitamin C in plant-derived products. J. Agric. Food Chem. 2005, 53, 1370–1373. [Google Scholar] [CrossRef] [PubMed]
  24. Parks, B.M.; Hoecker, U.; Spalding, E.P. Light-induced growth promotion by SPA1 counteracts phytochrome-mediated growth inhibition during de-etiolation. Plant Physiol. 2001, 126, 1291–1298. [Google Scholar] [CrossRef] [Green Version]
  25. Parks, B.M.; Spalding, E.P. Sequential and coordinated action of phytochromes A and B during Arabidopsis stem growth revealed by kinetic analysis. Proc. Natl. Acad. Sci. USA 1999, 96, 14142–14146. [Google Scholar] [CrossRef] [Green Version]
  26. Folta, K.M.; Spalding, E.P. Unexpected roles for cryptochrome 2 and phototropin revealed by high-resolution analysis of blue light-mediated hypocotyl growth inhibition. Plant J. 2001, 26, 471–478. [Google Scholar] [CrossRef] [PubMed]
  27. Wang, Y.; Folta, K.M. Contributions of green light to plant growth and development. Am. J. Bot. 2013, 100, 70–78. [Google Scholar] [CrossRef] [PubMed]
  28. Kuno, Y.; Shimizu, H.; Nakashima, H.; Miyasaka, J.; Ohdoi, K. Effects of irradiation patterns and light quality of red and blue light-emitting diodes on growth of leaf lettuce (Lactuca sativa L.”Greenwave”). Environ. Control Biol. 2017, 55, 129–135. [Google Scholar] [CrossRef] [Green Version]
  29. Park, C.H.; Kim, N.S.; Park, J.S.; Lee, S.Y.; Lee, J.W.; Park, S.U. Effects of light-emitting diodes on the accumulation of glucosinolates and phenolic compounds in sprouting canola (Brassica napus L.). Foods 2019, 8, 76. [Google Scholar] [CrossRef] [Green Version]
  30. Liu, H.K.; Chen, Y.Y.; Hu, T.T.; Zhang, S.J.; Zhang, Y.H.; Zhao, T.Y.; Yu, H.E.; Kang, Y.F. The influence of light-emitting diodes on the phenolic compounds and antioxidant activities in pea sprouts. J. Funct. Foods 2016, 25, 459–465. [Google Scholar] [CrossRef]
  31. Qian, H.; Liu, T.; Deng, M.; Miao, H.; Cai, C.; Shen, W.; Wang, Q. Effects of light quality on main health-promoting compounds and antioxidant capacity of Chinese kale sprouts. Food Chem. 2016, 196, 1232–1238. [Google Scholar] [CrossRef] [PubMed]
  32. Huang, J.; Xu, Y.; Duan, F.; Du, X.; Yang, Q.; Zheng, Y. Improvement of the Growth and Nutritional Quality of Two-leaf-color Pak Choi by Supplemental Alternating Red and Blue Light. HortScience 2020, 1, 118–125. [Google Scholar] [CrossRef]
  33. Hossen, M.Z. Light emitting diodes increase phenolics of buckwheat (Fagopyrum esculentum) sprouts. J. Plant Interact. 2007, 2, 71–78. [Google Scholar] [CrossRef]
  34. Bae, J.H.; Park, S.Y.; Oh, M.M. Growth and phenolic compounds of Crepidiastrum denticulatum under various blue light intensities with a fixed phytochrome photostationary state using far-red light. Hortic. Environ. Biotechnol. 2019, 60, 199–206. [Google Scholar] [CrossRef]
  35. Rodriguez-Concepcion, M.; Stange, C. Biosynthesis of carotenoids in carrot: An underground story comes to light. Arch. Biochem. Biophys. 2013, 539, 110–116. [Google Scholar] [CrossRef]
  36. Frede, K.; Schreiner, M.; Baldermann, S. Light quality-induced changes of carotenoid composition in pak choi Brassica rapa ssp. chinensis. J. Photochem. Photobiol. B Biol. 2019, 193, 18–30. [Google Scholar] [CrossRef]
  37. Brazaitytė, A.; Sakalauskienė, S.; Samuolienė, G.; Jankauskienė, J.; Viršilė, A.; Novičkovas, A.; Sirtautas, R.; Miliauskienė, J.; Vaštakaitė, V.; Dabašinskas, L.; et al. The effects of LED illumination spectra and intensity on carotenoid content in Brassicaceae microgreens. Food Chem. 2015, 173, 600–606. [Google Scholar] [CrossRef]
  38. Zhang, X.; Bian, Z.; Yuan, X.; Chen, X.; Lu, C. A review on the effects of light-emitting diode (LED) light on the nutrients of sprouts and microgreens. Trends Food Sci. Technol. 2020, 99, 203–216. [Google Scholar] [CrossRef]
Figure 1. Spectral composition of the Blue (B), Red (R), and Far-Red (FR) light-emitting diodes (LEDs) and fluorescent light (Fl) used during carrot sprouts’ growing.
Agronomy 11 00304 g001
Figure 2. Ultra High Performance Liquid Cromatography (U-HPLC) chromatograms (shown at 320 nm) of identified phenolic compounds from methanol/water (80:20, v/v) extracts of carrot seed (A) and carrot sprouts on 7 days in darkness+3 days of a light/darkness photoperiod under several light treatments at 20 °C: Darkness (B), Fluorescent (C), Blue+Red LEDs (D), and Blue+Red+Far-Red LEDs (E). Identified peaks are: Neochlorogenic Acid (1), Chlorogenic Acid (2), Caffeic Acid (3), p-coumaric Acid (4), Ferulic Acid (5), Hydroxycinnamic Acid (6), Rutin (7), and 1,2-disinapoyl-1’-ferulolylgentiobiose (8).
Agronomy 11 00304 g002
Figure 3. U-HPLC chromatograms (shown at 476 nm) of identified carotenoids from methanol/MTBE (60:40, v/v) extracts of carrot seed (A) and carrot sprouts on 7 days in darkness+3 days of a light/darkness photoperiod under several light treatments at 20 °C: Darkness (B), Fluorescent (C), Blue+Red LEDs (D), and Blue+Red+Far-Red LEDs (E). Identified peaks are: All-trans neoxanthin (1), 13-cis or 13′-cis lutein (2), All-trans lutein (3), 9-cis or 9′-cis lutein (4), 15-cis β-carotene (5), All-trans β-carotene (6), and 9-cis β-carotene (7).
Agronomy 11 00304 g003
Figure 4. Total phenolic content of carrot sprouts grown at 20 °C during 7 days in darkness (dD)+3 or 7 or 10 days of a 16 h/8 h photoperiod (dP) under several light treatments. B+R: Blue+Red; B+R+FR: Blue+Red+Far-Red LEDs. Different capital letters indicate significant differences among treatments at p < 0.05 based on Tukey’s test. Different lowercase letters indicate significant differences among time of analysis of the same treatment at p < 0.05 based on Tukey’s test.
Agronomy 11 00304 g004
Figure 5. Total antioxidant capacity index (A) and total scavenging activity Index (B) of carrot sprouts grown at 20 °C during 7 days in darkness (dD) +3 or 7 or 10 days of a 16 h/8 h photoperiod (dP) under several light treatments. B+R: Blue+Red; B+R+FR: Blue+Red+Far-Red LEDs. Different capital letters indicate significant differences among treatments at p < 0.05 based on Tukey’s test. Different lowercase letters indicate significant differences among time of analysis of the same treatment at p < 0.05 based on Tukey’s test.
Agronomy 11 00304 g005
Table 1. Morphological development of carrot sprouts grown at 20 °C during 7 days in darkness (dD)+10 days of a light/darkness photoperiod (dP) under several light treatments.
Days at 20 °CTreatmentHypocotyl Length (cm)Root Length
(cm)
Sprout Length (cm)H/R Ratio
Growing under darkness conditions
3 dDDarkness-0.24 ± 0.030.24 ± 0.03-
7 dDDarkness1.10 ± 0.041.52 ± 0.182.61 ± 0.160.83 ± 0.08
+ days under a 16 h light/8 h darkness photoperiod
7 dD+3 dPDarkness2.51 ± 0.22 A b1.17 ± 0.21 B b3.43 ± 0.58 b3.51 ± 0.88 A
Fl1.17 ± 0.09 B2.17 ± 0.49 A3.34 ± 0.440.64 ± 0.22 B
B+R1.00 ± 0.10 B b2.20 ± 0.33 A3.01 ± 0.640.50 ± 0.08 B b
B+R+FR1.20 ± 0.14 B b1.65 ± 0.24 AB b2.85 ± 0.30 b0.95 ± 0.27 B
7 dD+7 dPDarkness4.51 ± 0.77 A a2.41 ± 0.32 AB a6.92 ± 1.04 A a2.64 ± 0.80 A
Fl1.64 ± 0.56 B2.08 ± 0.27 B3.72 ± 0.83 B1.14 ± 0.31 B
B+R1.22 ± 0.10 B b2.10 ± 0.25 B3.32 ± 0.28 B0.63 ± 0.08 BC b
B+R+FR1.21 ± 0.07 B b3.09 ± 0.43 A a4.30 ± 0.50 B a0.43 ± 0.00 BC
7 dD+10 dPDarkness5.68 ± 0.67 A a1.23 ± 0.34 b6.91 ± 0.68 A a4.86 ± 0.63 A
Fl2.04 ± 0.08 B2.31 ± 0.114.35 ± 0.18 B0.89 ± 0.03 B
B+R1.86 ± 0.16 B a2.38 ± 0.584.24 ± 0.74 B1.07 ± 0.14 B a
B+R+FR1.80 ± 0.16 B b2.03 ± 0.75 ab3.84 ± 0.62 B ab1.06 ± 0.44 B
Fl: Fluorescence: B: Blue; R: Red; FR: Far-Red; H/R: Hypocotyl/Root. dD+dP: growth at 20 °C during 7 days under darkness conditions+3 or 7 or 10 days under a 16 h/8 h photoperiod. Different capital letters denote significant differences (p < 0.05) among different treatments for the same sampling time. Different lowercase letters denote significant differences (p < 0.05) among different sampling times for the same treatment. Absence of letters indicates that there are no significant differences (p < 0.05).
Table 2. Total antioxidant activity (mg TE kg−1 dw) of carrot sprouts grown at 20 °C during 7 days in darkness (dD)+3 or 7 or 10 days of a 16 h/8 h photoperiod (dP) under several light treatments.
Days at 20 °C
TreatmentSeed3 dD7 dD7 dD+3 dP7 dD+7 dP7 dD+10 dP
DPPH
Darkness834.7 ± 39.6 d1508.6 ± 81.0 c4351.8 ± 366.6 b7579.4 ± 179.8 B a4324.5 ± 25.6 B b8403.3 ± 888.4 C a
Fl 10916.7 ± 58.9 A a11921.9 ± 1278.3 A a11803.7 ± 234.5 B a
B+R 11352.7 ± 919.3 A b13019.6 ± 1065.8 A ab13877.1 ± 371.8 A a
B+R+FR 11737.9 ± 817.4 A a11390.6 ± 1338.7 A a12920.9 ± 563.2 AB a
FRAP
Darkness3230.7 ± 194.0 d2720.3 ± 261.2 d5106.3 ± 377.6 c7292.7 ± 357.7 C b7149.8 ± 449.5 C b8653.2 ± 247.6 C a
Fl 11425.9 ± 451.6 B b13421.7 ± 705.6 A a10182.2 ± 742.4 C b
B+R 12035.0 ± 561.4 AB b11005.4 ± 1267.0 B b18148.6 ± 563.4 A a
B+R+FR 12983.3 ± 449.5 A b12050.6 ± 841.9 AB b15121.1 ± 683.9 B a
ABTS
Darkness1944.8 ± 144.4 d1722.3 ± 158.3 d5522 ± 395.4 c7944.5 ± 636.3 B b6862.6 ± 123.2 B b11400.4 ± 1152.5 C a
Fl 13378.2 ± 982.2 A b16069.7 ± 1257.9 A a13825.3 ± 669.9 B ab
B+R 13853.0 ± 796.1 A a14766.9 ± 890.4 A a15253.6 ± 295.4 A a
B+R+FR 13633.0 ± 812.0 A a14775.8 ± 1085.1 A a15529.4 ± 518.8 A a
TE: Trolox Equivalents. Mean ± standard deviation (SD). Fl: Fluorescence: B: Blue; R: Red; FR: Far-Red. dD+dP: days under darkness conditions + days under a 16 h/8 h photoperiod. Different capital letters denote significant differences (p < 0.05) among different treatments for the same sampling time. Different lowercase letters denote significant differences (p < 0.05) among different sampling times for the same treatment. Absence of letters indicates that there are no significant differences (p < 0.05).
Table 3. Individual phenolic content (mg kg−1 dw) of carrot sprouts grown at 20 °C during 7 days in darkness (dD)+3 or 7 or 10 days of a 16 h/8 h photoperiod (dP) under several light treatments.
TreatmentDay of AnalysisNeochlorogenic AcidChlorogenic AcidCaffeic Acidp-Coumaric AcidFerulic AcidHydroxycinnamic AcidRutin1,2-Disinapoyl-1′-FerulolylgentiobioseTotal Individual Phenols
Seed0dD131.9 ± 16.6 ab7.0 ± 0.17 c0.2 ± 0.02 c207.8 ± 17.8 c0.2 ± 0.0 c0.5 ± 0.0 c6.2 ± 0.5 c0.4 ± 0.0 d354.1 ± 33.4 e
Growing under darkness conditions
3dD99.0 ± 11.7 bc8.9 ± 4.6 c5.4 ± 2.4 c129.5 ± 11.0 d12.3 ± 2.8 c1.1 ± 0.0 c7.7 ± 0.7 c4.1 ± 0.7 d268.1 ± 34.8 e
7dD127.5 ± 8.6 ab420.5 ± 20.9 b42.7 ± 8.6 b246.5 ± 23.3 bc1396.8 ± 45.1 b37.5 ± 3.6 c141.0 ± 17.3 b20.8 ± 6.4 c2433.3 ± 110.6 d
+ days under a 16h light/8h darkness photoperiod
Darkness7 dD+3 dP68.7 ± 8.2 C c506.1 ± 52.6 D b77.7 ± 4.7 B a282.9 ± 29.1 B b1841.7 ± 111.4 D a85.9 ± 22.7 B b158.3 ± 0.8 C ab53.6 ± 7.9 C b3074.9 ± 164.4 D c
7 dD +7 dP129.2 ± 1.9 C ab444.5 ± 31.5 C b77.7 ± 20.7 B a400.7 ± 40.1 B a1972.2 ± 142.4 C a358.3 ± 18.0 C a126.2 ± 18.4 C b38.7 ± 6.8 C b3547.5 ± 269.3 C b
7 dD+10 dP134.9 ± 1.5 C a943.2 ± 52.0 C a102.7 ± 13.9 B a418.5 ± 7.1 B a1852.5 ± 135.4 C a366.1 ± 20.3 A a182.5 ± 12.3 B a81.8 ± 7.0 C a4082.2 ± 151.5 C a
Fl7 dD+3 dP211.6 ± 1.4 A a1800.7 ± 135.3 C a212.5 ± 2.9 A a470.7 ± 41.3 A2654.9 ± 53.5 C b149.7 ± 15.2 B b909.2 ± 9.3 B a158.1 ± 14.2 B b6567.5 ± 220.8 C b
7 dD+7 dP194.4 ± 5.9 A b1886.7 ± 91.3 B a191.7 ± 19.1 A a526.2 ± 36.6 AB3226.6 ± 262.9 B a460.1 ± 46.7 B a804.9 ± 51.9 A a194.2 ± 13.7 B a7484.8 ± 303.8 B a
7 dD+10 dP168.1 ± 4.1 B c1437.4 ± 131.0 B b110.8 ± 3.7 B b424.0 ± 45.2 B2816.6 ± 172.2 B ab398.2 ± 28.0 A a506.5 ± 55.5 A b157.6 ± 11.8 B b6019.3 ± 384.5 B b
B+R7 dD+3 dP150.7 ± 15.8 B b2202.3 ± 31.3 B ab197.0 ± 15.4 A a524.6 ± 30.1 A3968.8 ± 144.1 B279.3 ± 35.8 A b949.3 ± 63.7 B a159.2 ± 6.5 B b8431.1 ± 171.1 B
7 dD+7 dP170.0 ± 16.2 B b1985.1 ± 128.0 B b132.1 ± 11.5 AB b613.0 ± 54.7 A4423.9 ± 327.4 A615.0 ± 24.0 A a550.2 ± 14.8 B b231.9 ± 23.2 AB a8721.1 ± 567.7 AB
7 dD+10 dP217.6 ± 17.4 A a2489.8 ± 202.5 A a206.3 ± 5.8 A a602.6 ± 18.4 A4205.2 ± 403.3 A569.3 ± 16.9 A a601.4 ± 58.6 A b262.0 ± 15.1 A a9154.2 ± 835.5 A
B+R+FR7 dD+3 dP194.9 ± 22.5 A2967.2 ± 126.1 A a227.9 ± 17.3 A a547.3 ± 69.6 A4677.7 ± 281.2 A322.4 ± 25.9 A b1213.1 ± 69.5 A a337.2 ± 29.2 A a10487.7 ± 390.7 A
7 dD+7 dP206.8 ± 1.8 A2601.3 ± 155.6 A b162.6 ± 9.0 A b618.7 ± 71.9 A4385.5 ± 440.1 A537.3 ± 9.4 AB a616.5 ± 12.7 B b272.9 ± 18.1 A b9401.7 ± 648.1 A
7 dD +10 dP201.2 ± 12.5 A2492.4 ± 89.3 A b220.4 ± 8.6 A a657.9 ± 38.0 A4631.0 ± 164.4 A512.0 ± 10.7 A a632.9 ± 23.9 A b296.7 ± 20.7 A ab9644.4 ± 114.2 A
Mean ± SD. dD+dP: days under darkness conditions + days under a 16 h light/8 h darkness photoperiod. Fl: Fluorescence: B: Blue; R: Red; FR: Far-Red. Different capital letters denote significant differences (p < 0.05) among different treatments for the same sampling time. Different lowercase letters denote significant differences (p < 0.05) among different sampling times for the same treatment. Absence of letters indicates that there are no significant differences (p < 0.05).
Table 4. Carotenoid content (mg kg−1 dw) of carrot sprouts grown at 20 °C during 7 days in darkness (dD)+3 or 7 or 10 days of a 16 h/8 h photoperiod (dP) under several light treatments.
TreatmentDay of AnalysisAll-Trans Neoxanthin13-cis or 13′-cis LuteinAll-Trans Lutein9-cis or 9′-cis Lutein15-cis β-CaroteneAll-trans β-Carotene9-cis β-CaroteneTotal Carotenoids
Seed0 dD 0.3 ± 0.0 d2.4 ± 0.12.0 ± 0.1 d0.00 ± 0.00 c2.4 ± 0.1 c0.3 ± 0.0 c0.0 ± 0.0 c7.3 ± 0.2 d
Growing under darkness conditions
3 dD0.7 ± 0.1 cd2.5 ± 0.12.0 ± 0.4 d0.00 ± 0.00 c2.3 ± 0.1 c0.3 ± 0.1 c0.0 ± 0.0 c7.8 ± 0.8 d
7 dD1.6 ± 0.1 b2.5 ± 0.212.1 ± 2.1 c0.18 ± 0.05 b11.1 ± 1.8 c1.4 ± 0.2 c2.0 ± 0.4 c30.8 ± 4.7 c
+ days under 16h light/8h darkness photoperiod
Darkness7 dD+3 dP2.0 ± 0.3 C ab2.4 ± 0.3 C15.6 ± 0.3 B c0.39 ± 0.02 B b25.8 ± 9.9 D b7.8 ± 1.2 D b14.7 ± 1.9 C b68.6 ± 11.7 D b
7 dD+7 dP1.3 ± 0.1 C bc2.2 ± 0.1 C22.0 ± 0.1 C b0.23 ± 0.03 C a31.9 ± 7.6 D ab7.7 ± 0.7 C b13.0 ± 1.8 C b78.4 ± 9.8 D b
7 dD+10 dP2.5 ± 0.6 C a2.5 ± 0.1 B37.6 ± 4.0 B a0.24 ± 0.02 B b41.1 ± 1.5 D a12.2 ± 0.9 C a18.2 ± 1.4 B a114.3 ± 7.9 C a
Fl7 dD+3 dP8.1 ± 0.7 A c9.4 ± 0.4 A c53.0 ± 7.6 A b0.54 ± 0.05 A118.7 ± 1.6 B b17.7 ± 1.1 B b23.6 ± 1.2 B b231.2 ± 11.0 B b
7 dD+7 dP15.8 ± 1.2 A b18.5 ± 2.2 A b119.0 ± 6.0 A a0.46 ± 0.03 B138.5 ± 5.5 A a35.6 ± 3.0 A a41.8 ± 2.2 A a369.6 ± 17.8 A a
7 dD+10 dP20.9 ± 0.3 A a26.0 ± 0.7 A a132.5 ± 5.3 A a0.50 ± 0.01 A134.7 ± 6.6 B a36.7 ± 2.4 AB a46.0 ± 2.9 A a397.2 ± 12.4 A a
B+R7 dD+3 dP5.1 ± 1.0 B c6.3 ± 1.3 B c55.6 ± 5.0 A c0.49 ± 0.02 A b139.7 ± 1.9 A a26.7 ± 0.7 A b33.9 ± 1.7 A b267.8 ± 11.6 A b
7 dD+7 dP11.6 ± 1.5 B b14.3 ± 0.9 B b93.7 ± 9.8 B b0.43 ± 0.02 B b110.7 ± 10.2 B b30.0 ± 3.1 AB b36.2 ± 2.8 B b297.0 ± 27.0 B b
7 dD+10 dP17.6 ± 1.1 B a23.8 ± 1.6 A a127.3 ± 12.0 A a0.56 ± 0.03 A a149.4 ± 5.0 A a42.7 ± 1.7 A a47.1 ± 3.1 A a408.5 ± 13.5 A a
B+R+FR7 dD+3 dP5.1 ± 0.8 B c6.4 ± 1.8 B c50.5 ± 9.7 A c0.46 ± 0.05 AB b78.7 ± 1.6 C13.4 ± 1.3 C b19.2 ± 3.0 BC b173.9 ± 13.2 C c
7 dD+7 dP11.9 ± 0.6 B b16.2 ± 1.5 AB b83.3 ± 8.6 B b0.55 ± 0.02 A a80.4 ± 7.4 C27.8 ± 2.3 B a30.8 ± 1.2 B a251.0 ± 5.9 C b
7 dD+10 dP18.9 ± 0.9 AB a25.2 ± 1.2 A a120.7 ± 9.2 A a0.53 ± 0.02 A ab86.0 ± 4.5 C32.9 ± 3.4 B a41.3 ± 2.8 A a325.5 ± 13.7 B a
Mean ± SD. dD+dP: days under darkness conditions + days under a 16 h light/8 h darkness photoperiod. Fl: Fluorescence: B: Blue; R: Red; FR: Far-Red. Different capital letters denote significant differences (p < 0.05) among different treatments for the same sampling time. Different lowercase letters denote significant differences (p < 0.05) among different sampling times for the same treatment. Absence of letters indicates that there are no significant differences (p < 0.05).
Publisher’s Note: MDPI stays neutral with regard to jurisdictional claims in published maps and institutional affiliations.

