
Acidified Biogas Residues Improve Nutrient Uptake and Growth of Young Maize


Institute of Plant Nutrition and Soil Science, Kiel University, 24118 Kiel, Germany
*
Authors to whom correspondence should be addressed.
Agronomy 2021, 11(2), 344; https://0-doi-org.brum.beds.ac.uk/10.3390/agronomy11020344
Submission received: 29 December 2020
/
Revised: 8 February 2021
/
Accepted: 11 February 2021
/
Published: 15 February 2021
(This article belongs to the Special Issue Organic Wastes as a Source of Innovative Fertilizers, a Down-to-Earth Principle for Sustainable Agriculture)
Abstract
:Biogas residues (BGR) contain a variety of plant nutrients and are, therefore, valuable fertilizers. However, ammonia (NH3) emissions occur during slurry and BGR application. These emissions can be reduced by lowering the pH of the BGR. Acidification technology works well for slurry, but little is known about the effects on fertilizer properties of acidified BGR (ABGR). This study aimed to examine the impact of acidification on the chemical composition of BGR and its influence on plant growth of juvenile maize and the soil pH, as well as the soluble soil phosphorous (P) and manganese (Mn), after application of ABGR. The soluble amount of nutrients in BGR was compared with that in ABGR. In an outdoor pot experiment, BGR and ABGR were incorporated in soil, and maize was grown for 8 weeks. Two different BGR P levels were compared with (NH4)2HPO4 and a control treatment without additional P. BGR acidification increased dissolved amounts of P from 15% to 44%, calcium from 6% to 59%, magnesium from 7% to 37%, and Mn from 2% to 15%. The dry matter of ABGR-fertilized maize was 34%, 45% higher than that of BGR-fertilized maize. The soluble Mn content in the soil was 74% higher with the low ABGR dose and 222% higher with the higher ABGR dose than the BGR treatments. The fertilizer efficiency of ABGR was higher than that of BGR, indicating that the absolute amount of applied fertilizer could be reduced in systems using ABGR.
1. Introduction
Acidification of slurry has long been known to be an effective technique for reducing ammonia (NH3) emissions in agriculture and improving the N utilization efficiency [1,2,3]. Nevertheless, the use of this technique has so far been limited to a few countries such as Denmark and the United Kingdom (UK). However, this changed in 2016, when European Union (EU) member states became legally obliged to significantly reduce their air pollutant emissions [4]. In order to achieve these reduction goals, the EU included slurry acidification in its catalog of measures as one of the best available technologies [5].
The emission reduction works on the principle that acid addition lowers the pH of the slurry, thereby shifting the dissociation equilibrium between NH3 and ammonium (NH4) toward NH4, which is not volatile. The reduction of NH3 emissions can range from 15% to 98% depending on the type of slurry, the acid used, and the acidification technique [2,3]. This provides more N for plant nutrition in the field. Sulfuric acid (H2SO4) is usually used for acidification, which has a double purpose according to Eriksen et al. [6]: reducing NH3 emissions and providing the crops with sulfur (S). The acidification of pig slurry in Denmark requires ~5 kg H2SO4·t−1 of slurry to reduce the pH value to 5.5. For the usual amount of slurry of 30–40 m3, this corresponds to a S quantity of 48–64 kg S·ha−1 [6], in addition to the quantity of S that is already contained in the slurry. However, considerably larger S quantities have also been reported. For example, Pedersen et al. [7] reported that 382 kg S·ha−1 was applied as acidified cattle slurry that had been stored for long periods of time. Seidel et al. [8] reported S application rates of >100 kg S·ha−1 by H2SO4, which were applied in addition to the slurry. These S levels exceed the S requirements of crops, leaving excess S in the agricultural ecosystem.
Acidification of slurry also has further effects on slurry composition. While total nutrient concentrations of phosphorous (P), calcium (Ca), and magnesium (Mg) remain the same [9], the dissolved contents of these nutrients are increased by slurry acidification [10], thereby increasing nutrient availability. Yield-increasing effects after fertilization with acidified pig slurry, as well as cattle slurry, have been shown in previous research [11,12].
Biogas residues (BGR) are particularly well suited to acidification, as they have an increased NH3 loss potential because of their high pH values. During anaerobic digestion, the pH of slurry increases by 0.5–2 units because of the formation of ammonium carbonate ((NH4)2CO3) and the conversion of CO32− and 2 H+ to H2O and CO2 [13]. Furthermore, the solubility of some nutrients, especially P, changes during anaerobic digestion. Güngör et al. [14] found that, in anaerobic digestion of dairy cattle slurry, the proportion of struvite increased from 43% to 78% of total P. In addition, they found that there was a simultaneous shift within the Ca–P fractions from the poorly water-soluble brushite (CaHPO4·2H2O) to the water-insoluble hydroxylapatite (Ca5(PO4)3OH) [14]. Wastewater research has shown that, during the formation of P, Mg, and Ca crystals, at least seven different crystalline phases can precipitate [15]. The acidification of BGR is particularly favorable to reduce this precipitation. However, the effects of acidification on the nutrient pool of BGR and how this affects the nutrient availability for maize remain unknown. It can be assumed that the acidification of BGR leads to similar effects as the acidification of slurry, whereby the required amount of acid is likely to be larger than that for slurry. Stevens et al. [16] demonstrated that the acid demand correlates positively with the NH4 content in slurry. Furthermore, the amount of acid required to lower the pH value depends on the complex buffer system in the slurry and BGR. In experiments with pig and cattle slurry and BGR, Sommer and Husted [17] showed that the buffer system mainly consists of NH4-N, carbonates, phosphates, and volatile fatty acids.
The aim of the current study was to investigate the effects of BGR acidification on macro- and micronutrient solubility in BGR and the effects on plant growth, as well as the nutrient acquisition, in young maize plants fertilized with acidified biogas residues (ABGR). Two fertilization levels were examined to check whether the increased use of sulfuric acid (H2SO4) has negative effects on plant growth. We hypothesized the following: (1) acidification of BGR leads to an increase of the dissolved P-fraction in ABGR; (2) this leads to a concomitant increase of the dissolved conjugates of P, namely Ca, Mg, manganese (Mn), iron (Fe), and zinc (Zn); (3) application of ABGR will decrease soil pH; (4) fertilization leads to a higher biomass production of young maize plants compared with untreated BGR because of the improved nutrient solubility in ABGR. The results of this study can help to dispel uncertainties regarding the effects of BGR acidification and, thus, promote this ammonia emission-reducing technology for practical applications in agriculture, especially since previous studies always focused on N and/or P. In this study, the effects of acidification on all essential nutrients are highlighted, because acidification of BGR creates a new multi-element fertilizer.
2. Materials and Methods
2.1. Digestate Treatment and Analysis
BGR was sampled from an agricultural biogas plant in the federal state of Schleswig-Holstein, Northern Germany. Substrates of the biogas plant were maize silage, pig slurry, dry chicken feces, and forage winter rye, which were anaerobically digested for 70 days under mesophilic conditions (41 °C). After sampling, BGR was homogenized with a mixer and the pH was measured potentiometrically with a pH meter (Orion Model 520A Orion Research, Boston, MA, USA). Subsamples were acidified from initial pH 8.3 to pH 5.5 by adding 18 M H2SO4 dropwise under continuous stirring with pH control. Octanol (C8H18O) was used as a defoaming agent with an application rate of 1 mL·kg−1 ABGR. BGR was also treated with octanol to compensate for possible effects. For the analyses of nutrients in (A)BGR, the method of Dou [18] was modified. After reaching the target pH of 5.5, samples were freeze-dried (Gamma 1–20 (LMC–2), Martin Christ Gefriertrocknungsanlagen GmbH, Osterode am Harz, Germany) and then milled to a fine powder (MM2, Retsch, Haare, Germany). For total nutrient determination, a digestion with aqua regia was performed in a microwave oven at 180 °C for 20 min (1.800 W, MARS 6, Xpress, CEM, Matthews, MC, USA). Water-soluble nutrient concentrations were determined after shaking 0.3 g of the freeze-dried ABGR or BGR samples in 30 mL of distilled water for 16 h. Samples were centrifuged at 2970× g for 25 min (Suprafuge 22/20, Heraeus Sepatech GmbH, Osterode, Germany) and the supernatant was decanted. The P concentrations of all extracts were determined photometrically with a continuous flow analyzer (Skalar Analytical B.V., Breda, the Netherlands) by using the modified molybdenum–ascorbic acid blue method [19]. The Ca2+, copper (Cu2+), Fe2+, potassium (K+), Mg2+, Mn2+, and Zn2+ contents were quantified with an atomic absorption spectrometer (AAS 5EA Thermo Electron S, Carl Zeiss, Jena, Germany). All extractions were performed and analyzed at least in duplicate.
2.2. Experimental Design of the Pot Experiment
An outdoor pot experiment (covered by a wire cage) was carried out at the experimental station of the Institute of Plant Nutrition and Soil Science, Kiel University, Kiel (54°20′50″ north (N), 10°6′55″ east (E)). Mitscherlich pots were filled with 6 kg of air-dried and <4 mm sieved soil, which had a loamy sand texture with 74.7% sand, 16.5% silt, and 8.8% clay. The soil used for the experiment had calcium acetate lactate-extractable P and K [20] contents of 8.7 and 9.3 mg·100 g−1 soil, respectively, and a CaCl2-extactable Mg content [21] of 5 mg·100 g−1 soil. The diethylenetriaminepentaacetic acid-extractable micronutrient contents of boron (B), Cu, Mn, Fe, and Zn, analyzed according to the method described in Blume [21], were 0.14, 2.1, 65.1, 166.6, and 1.7 mg·kg−1 soil, respectively. Soil pH measured in CaCl2 solution [21] was 6.6.
The experiment was designed for P because, during the early growth stages of maize, P can be growth-limiting [22]. The experiment was based on total P (TP) and included two P application rates of 200 and 400 mg P per pot for NPK treatments, as well as for BGR and ABGR treatments and a control (NK treatment) without additional P (Table 1). These P fertilizer rates have been proven in previous studies using 6 kg Mitscherlich pots to study the fertilizer effects of biobased fertilizers [23,24,25]. According to the TP concentration in the BGR, 155 and 310 g of fresh matter (FM) BGR was required for fertilization.
Mineral fertilizers were applied before filling the pots by mixing the soil and fertilizer in a mixer. Acidification of BGR was carried out 2 days before sowing by slowly adding 18 M H2SO4 while stirring until the intended pH reached 5.5. Before application, ABGR pH was readjusted because the pH increased overnight. A total of 17.33 mL H2SO4·kg−1 BGR was used for acidification. One day before sowing, BGR and ABGR were applied to the soil surface and immediately incorporated into the upper 7 cm of soil.
The pot treatments were set up in a randomized complete block design to consider possible position effects. Each treatment was carried out in five replicates. Two maize seeds (Zea mays L. var. Keops) were sown per pot at 3 cm depth. Five days after germination, the poorly developed seedlings in each pot were removed, leaving one plant per pot for the remainder of the trial. The plants were exposed to natural weather conditions. Irrigation was carried out on demand. Surplus irrigation water and rain could freely drain through the Mitscherlich pots. Leached water was collected and returned to the plants. Temperatures during the experiment were monitored with a LogTag Data Logger (Trix-16, CiK Solutions GmbH, Karlsruhe, Germany). Temperatures ranged from 8.3 to 38 °C and had an average of 20.6 °C.
2.3. Plant Sampling and Analysis
Eight weeks after germination, the plants were cut above ground and weighed to determine the fresh weight. The dry weight (DM) was determined after oven-drying at 65 °C until the weight became constant. Afterward, samples were milled to a fine powder (Cyclotec 1093, Foss Tecator, Höganäs, Sweden) and stored for further analysis.
To determine the total N and S concentrations, 5–10 mg of plant powder was weighed into tin capsules and measured in duplicate with a CNS elemental analyzer (Flash EA 1112 NCS, Thermo Fisher Scientific, Waltham, MA, USA).
For mineral analysis, 200 mg of plant material was digested with 10 mL of 65% HNO3 (ROTIPURAN® p.a., ISO) in a microwave oven at 190 °C for 45 min (1800 W, MARS 6, Xpress, CEM, Matthews, MC, USA). The Ca2+, Cu2+, Fe2+, K+, Mg2+, Mn2+, and Zn2+ contents were quantified by AAS and the P content was quantified using inductively coupled plasma-mass spectrometry (Agilent Technologies 7700 Series, Böblingen, Germany). The reliability of the procedure was checked by analysis of the reference material (NCS DC 73350). The relative effectiveness (RPE, %) was calculated to rank the P fertilization with BGR/ABGR compared with NPK as follows:
2.4. Soil Sampling and Analysis
To take a homogeneous soil sample, the entire soil volume of each pot was mixed in a mixer at the end of the experiment. For analysis of soil pH and all other chemical soil parameters, the soil samples were sieved (<2 mm) and then air-dried. Soil pH (1:2.5 CaCl2) [21] was measured with an Orion Model 520A pH meter (Orion Research, Boston, MA, USA). The soluble Mn and P compounds of the soil were extracted using the method described by Houba et al. [26]. For the extraction with 0.01 M CaCl2, 5 g samples of air-dried soil were shaken for 2 h with 50 mL of CaCl2 solution. The extracts were then filtered through P-free filter papers (Machery-Nagel, MN 619 G). The Mn content in the extracts was quantified with AAS (AAS 5EA Thermo Electron S). The P content in the soil extract was measured photometrically at a wavelength of 880 nm (Skalar Analytical B.V., Breda, the Netherlands) using the molybdenum blue method described by Murphy and Riley [19].
2.5. Statistics
The statistical software R Version 3.6.0 [27] was used to evaluate the data. The evaluation started with the definition of an appropriate statistical mixed model [28,29] for plant and soil samples and a linear model for BGR. The data were assumed to be normally distributed and to be heteroscedastic according to a graphical residual analysis. The statistical model for plant and soil samples included the fertilizer variable as the fixed factor, and the blocks were regarded as random factors. For ABGR, the H2SO4 treatments were regarded as fixed factors. On the basis of these models, a pseudo R2 was calculated [30] and an analysis of variance (ANOVA) was conducted, followed by multiple contrast tests (e.g., [31]) to separately compare the different levels of the influencing factors. Differences between means were considered statistically significant at the p ≤ 0.05 level.
3. Results
3.1. Effects of Acidification on BGR Composition
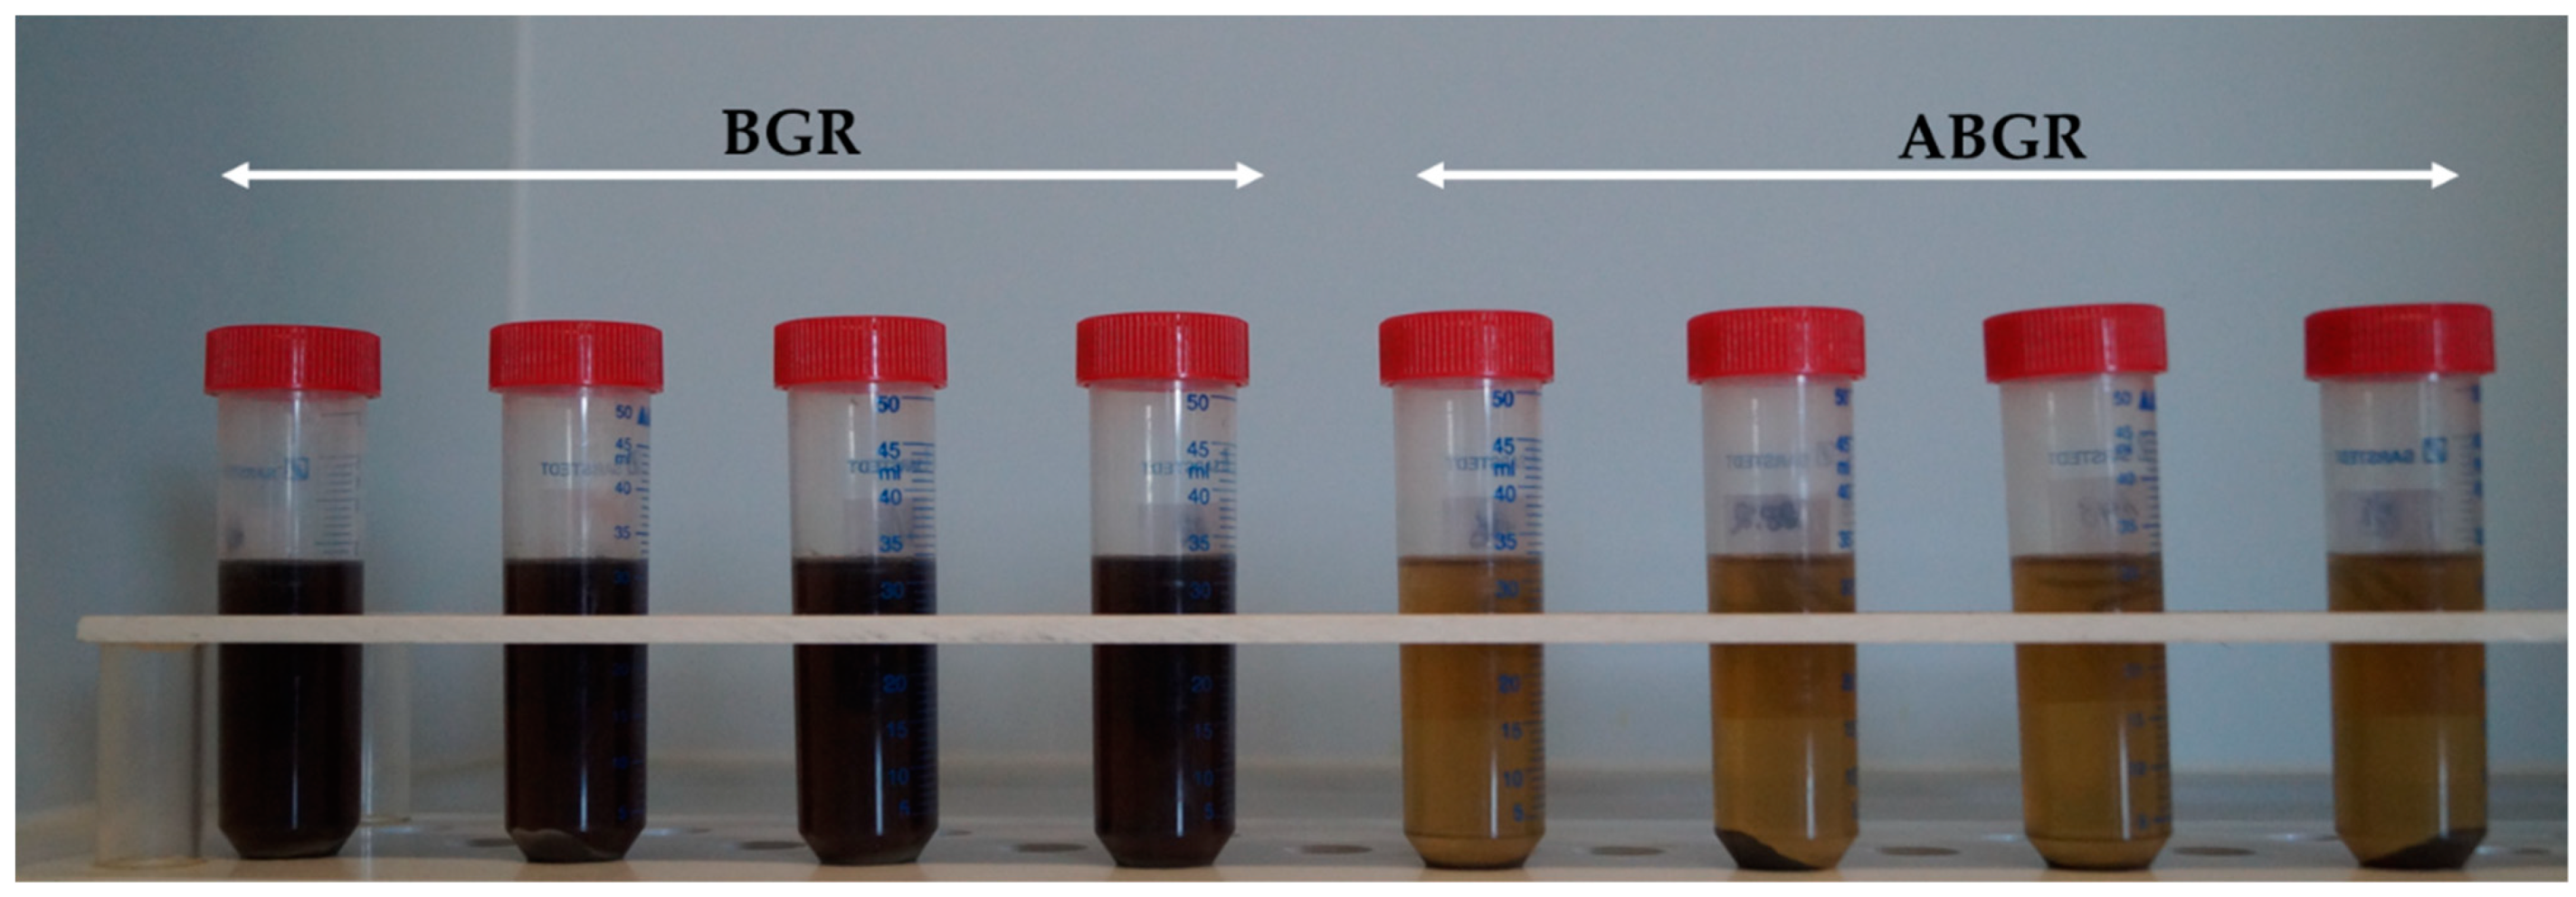
Acidification led to a significant increase of the H2O-soluble macronutrients P, Ca, and Mg; however, the solubility of K was not affected by acidification (Table 2). In the case of the analyzed micronutrients, only the Mn solubility was significantly increased. A significant reduction in H2O-solubility was found in Cu, Fe, and Zn. In addition, the acidification led to a significant change in the color of the ABGR (Appendix A, Figure A1).
3.2. Effects of the Fertilizers on Soil pH and Soluble Mn and P
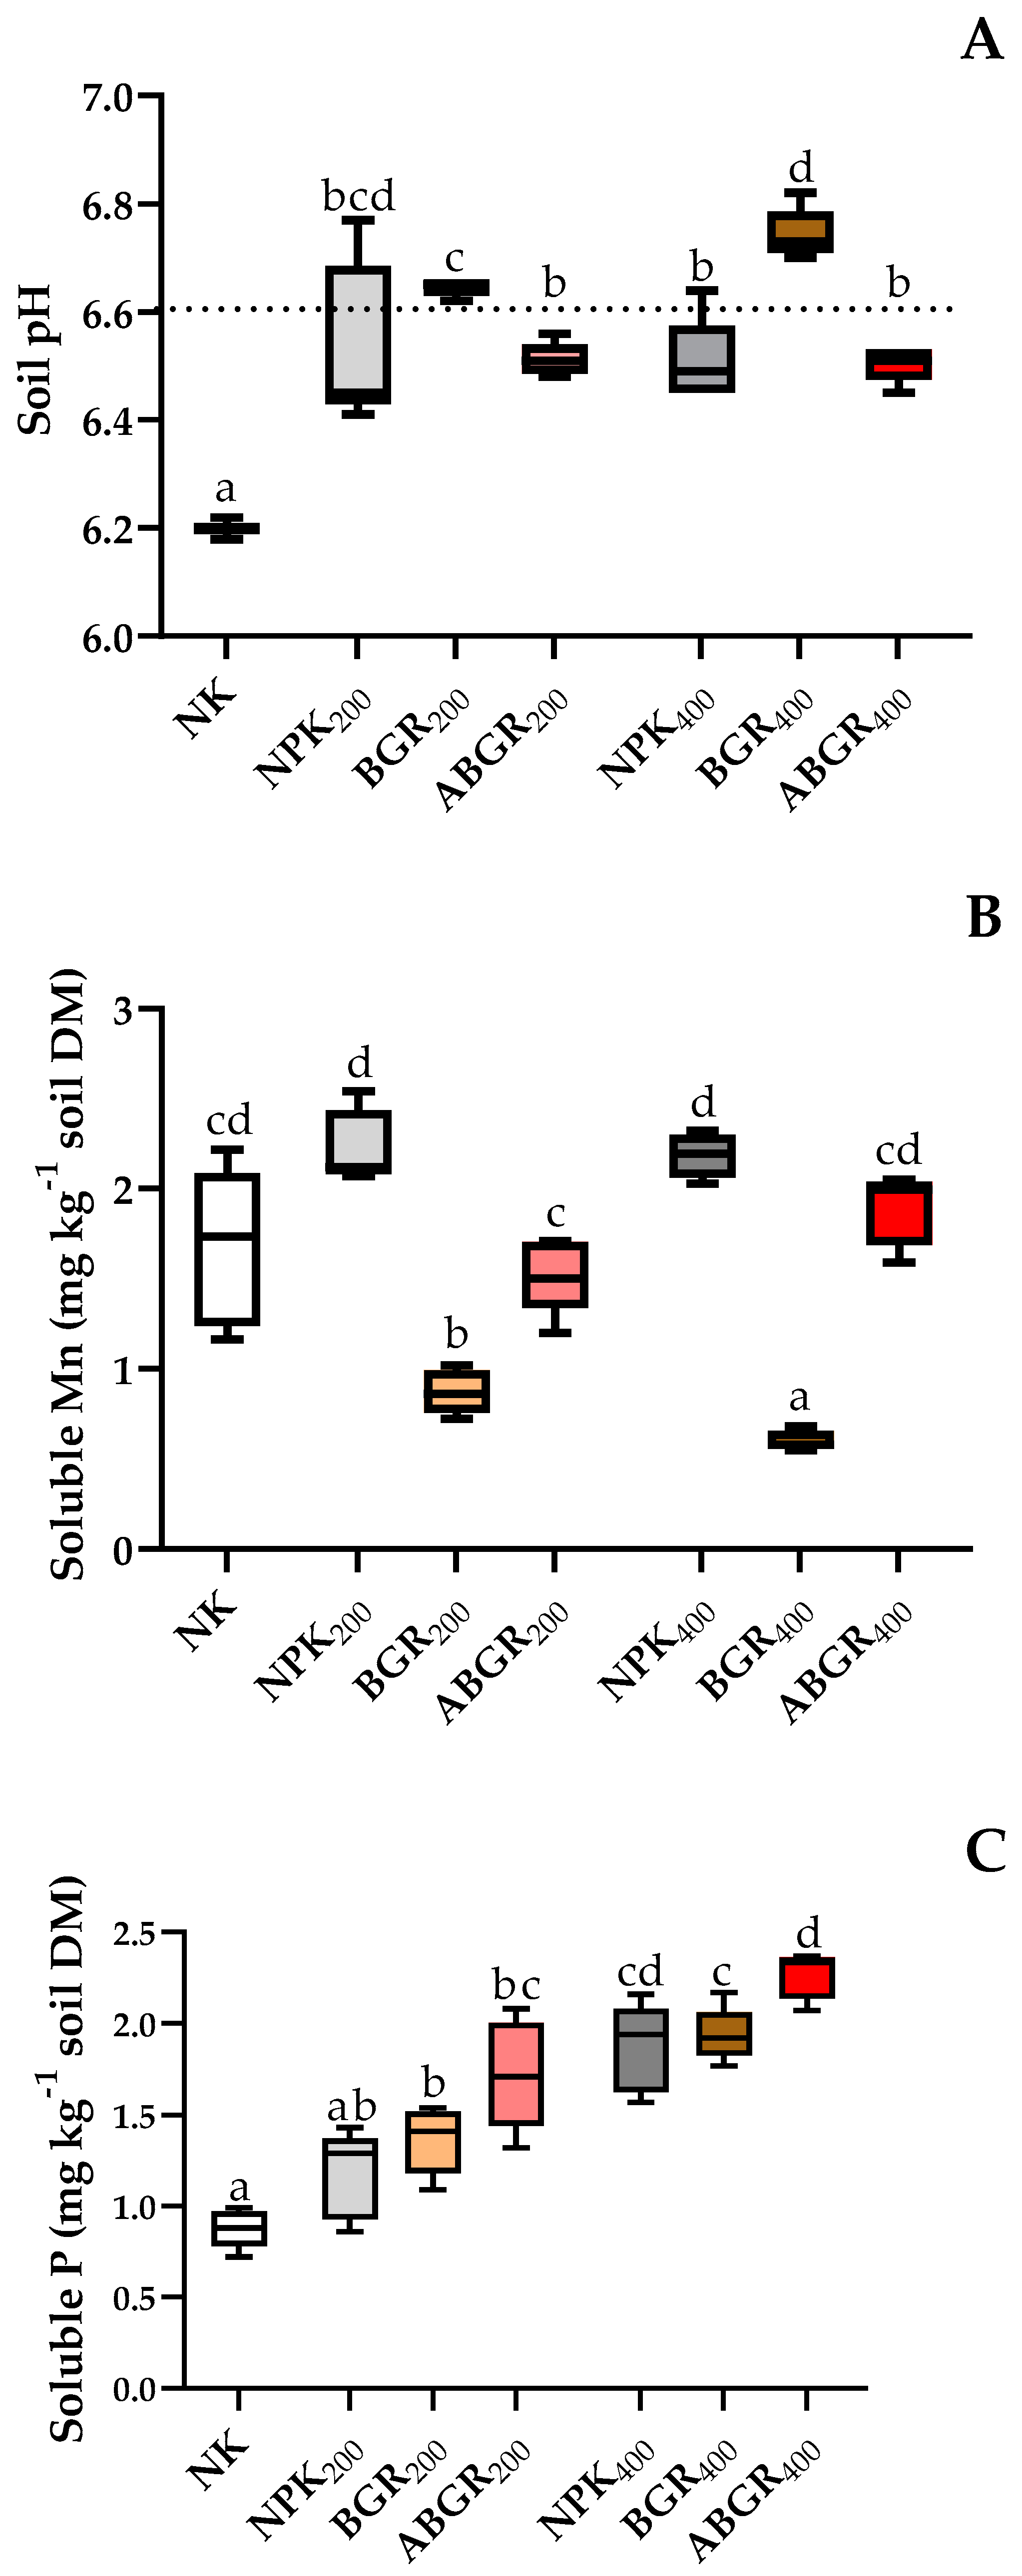
The application of ABGR caused a pH reduction of approximately 0.1 units in both fertilization doses in relation to the initial soil pH (Figure 1A). A similar effect was observed with mineral fertilization. The NPK treatments and ABGR treatments were in the range of 6.5 at the same soil pH level. Significant increases were found in the BGR treatments in relation to the initial soil pH. The highest pH increase was shown in BGR400, which was 0.14 units higher than the initial soil pH and 0.24 higher than ABGR400. Throughout the experiment, the pH of the NK treatment was by far the lowest at 6.2, which corresponds to a reduction of 0.4 units compared with the initial soil pH.
At the end of the experiment, it was shown that BGR400 and BGR200 in particular led to a considerable decrease in the soluble Mn content of the soil (Figure 1B). BGR400 had the lowest concentration with 0.6 mg·kg soil−1, followed by BGR200 with 0.87 mg·kg soil−1. Fertilization with ABGR increased the soluble soil Mn to 1.5 mg·kg soil−1 in ABGR200 and 1.9 mg·kg soil−1 in ABGR400. However, the soluble soil Mn of ABGR200 was significantly reduced by 0.69 mg·kg soil−1 compared with NPK200 and by 0.67 mg·kg soil−1 compared with NPK400.
Post harvest, the soluble P concentration in the soil of the NK treatment was 0.88 mg·kg soil−1, and significantly lower than all treatments fertilized with P, with the exception of NPK200 (Figure 1C). In both fertilizer rates, the P concentration of the acidified treatments was higher than in the mineral-fertilized treatments. However, whereas it was only weakly significant (p = 0.05), it showed a clear trend in each case. Acidification only caused a significant increase in the soluble P fraction in ABGR400 compared with the nonacidified BGR400.
3.3. Plant Biomass
Eight weeks after sowing, the biomass values of all P-receiving treatments were significantly higher than those of the NK treatment (Figure 2). In addition, the DM value of ABGR200 was significantly higher than that of NPK200 and BGR200. Fertilization with ABGR200 resulted in a DM value that was 5 g higher than that of BGR200. The same pattern was also found in maize plants that were fertilized with 400 mg P·pot−1. The DM value of ABGR400 was 28 g·pot−1 and was significantly higher than the DM values for other treatments.
3.4. Maize Tissue Nutrient Concentrations
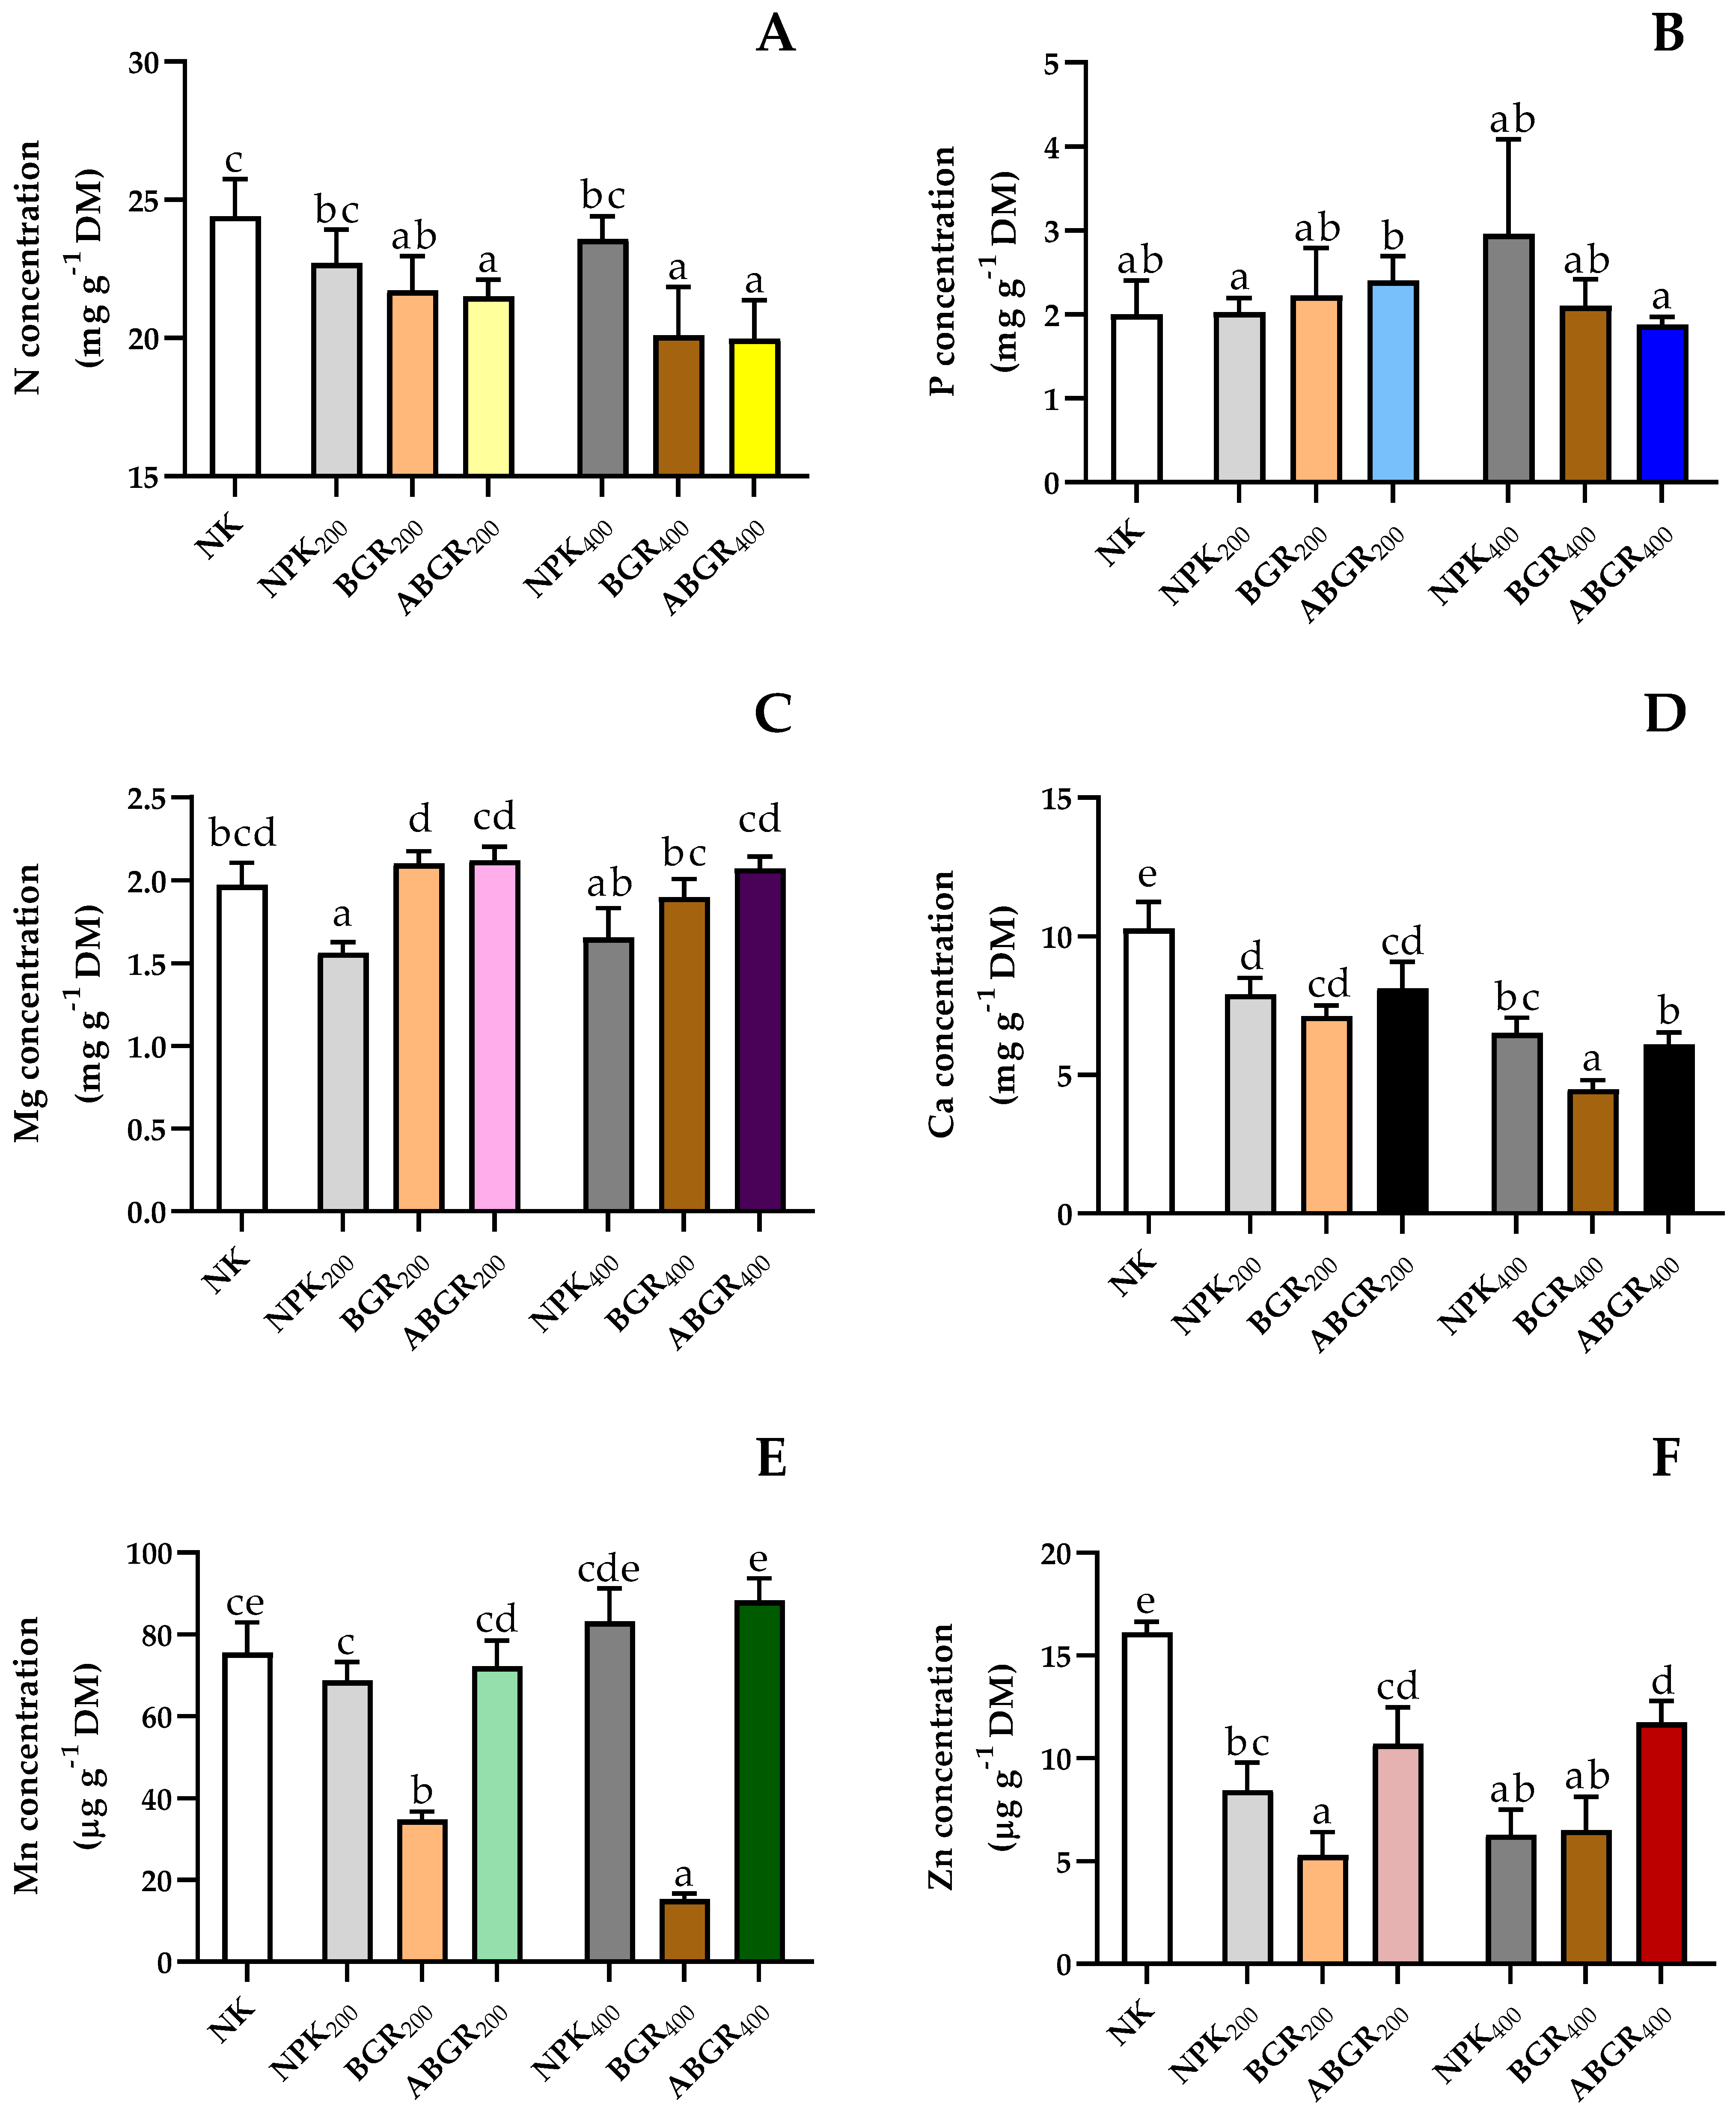
Maize plants that were fertilized with BGR400 and ABGR400 had significantly lower N concentrations than those fertilized with NK, NPK200, and NPK400 (Figure 3A). The P concentration was influenced neither by mineral fertilization (NPK200, NPK400) nor by BGR or ABGR fertilization (Figure 3B). All plants fertilized with P had a similar P concentration level to that of NK (2 mg·g−1). The P concentration was significantly higher than with NPK200 in the ABGR200 treatment only. Fertilization with ABGR had no significant effect on K and S concentrations of maize tissue (data not shown).
The NPK200 treatment had the lowest Mg concentration at 1.6 mg·g−1 (Figure 3C). In the BGR treatments, the acidification had no significant effect on the Mg concentration of the maize plants. However, the acidification of the BGR resulted in a significantly higher Mg concentration in both fertilization stages compared with the NPK treatments. Maize plants grown in the control (NK) treatment had a Ca concentration of 10.3 mg·g−1 DM, which was significantly higher than those of all other treatments (Figure 3D). Fertilization with 200 mg P reduced Ca concentration regardless of whether the fertilization was NPK200, BGR200, or ABGR200. The Ca concentrations of BGR400 and ABGR400 were significantly reduced compared with those of BGR200 and ABGR200. The BGR400 treatment had the lowest Ca concentration at 4.5 mg·g−1 DM, which was less than half that of the NK treatment.
Fertilization with BGR had the highest impact on the Mn concentration of maize tissues (Figure 3E); while the Mn concentration in the NK and NPK200 treatments was around 70 µg·g−1 DM, it was only 35 µg·g−1 in the BGR200 treatment. The ABGR200 treatment had an Mn concentration of 72 µg·g−1, which was similar to the Mn concentrations of NK and NPK200. The Mn concentration of BGR400 was 15 µg·g−1, less than half that of BGR200 and significantly lower than that of all other treatments. Maize plants fertilized with ABGR400 had an Mn concentration of 88 µg·g−1, which was significantly higher than that of all other treatments except NK and NPK400.
Significant differences in the Zn concentration of maize tissue were also detected among treatments (Figure 3F). The Zn concentration of NK was 16 µg·g−1, which was significantly higher than that of all other treatments. In contrast, the lowest Zn concentrations were observed in BGR200 (5.3 µg·g−1) and BGR400 (6.5 µg·g−1). Acidification of BGR led to an increased Zn concentration. Zinc concentrations of ABGR200 and ABGR400 were at a similar level, with values of 10.7, and 11.7 µg·g−1, respectively. This corresponds to a doubling of the Zn concentration compared with BGR200 and BGR400.
3.5. Nutrient Uptake and Relative Effectiveness of P Fertilization
Acidification increased N uptake at both fertilizer levels (Table 3). In ABGR200, N uptake was increased by 93 mg N compared with BGR200; however, this was not statistically significant (p = 0.07). In ABGR400, acidification led to a significant increase of 183 mg N compared with BGR400. Compared with NPK, the N uptake was significantly increased by acidification in both ABGR200 and ABGR400.
The RPE (%) P uptake values of BGR and ABGR were then compared with the NPK treatments. The RPE of the fertilizer treatments decreased in the following order: ABGR200 (212%) > ABGR400 (146%) > BGR400 (122%) > BGR200 (115%). The P uptake of ABGR200 was significantly higher than that of NK, NPK200, and BGR200 and reached the same level as the 400 mg P treatments.
Fertilization with P had increasing effects on Ca uptake. The Ca uptake of NK was significantly lower than that of all other treatments, at 48 mg·pot−1 (Table 3). The Ca uptake values were highest in the ABGR treatments. The increase was especially evident for ABGR400, where Ca uptake was 172 mg·pot−1, twice as high as that of BGR400. In addition, Ca uptake was increased in ABGR200 compared with BGR200, but this increase was not significant (p = 0.06).
The Mg uptake was significantly lower in the NK than that of all other treatments, at 8.9 mg·pot−1 (Table 3). The Mg uptake of the ABGR200 treatment (35.9 mg·pot−1) was significantly higher than that of NPK200 (22.6 mg·pot−1). A similar increasing effect was also observed in ABGR400, where the Mg uptake was 58.4 mg·pot−1 compared with 29 mg·pot−1 for NPK400. The Mg uptake was also significantly lower in BGR400 compared with ABGR400.
When maize was fertilized with BGR400, Mn uptake was 72 µg·pot−1 lower than that of NK and 233 µg·pot−1 lower than that of BGR200 (Table 3). The Mn uptake in ABGR200 was 406 µg·pot−1 higher than that of NPK200 and 812 µg·pot−1 higher than that of BGR200. These effects were even more pronounced in the 400 mg P fertilizer treatments. The Mn uptake of ABGR400 was almost doubled (+1288 µg·pot−1) compared with NPK400 and 10 times higher than that of BGR400 (+2363 µg·pot−1). In addition, the Mn uptake of ABGR400 was almost double that of ABGR200.
The values of Zn uptake were almost the same among the NK, BGR200, and BGR400 treatments (Table 3). Acidification led to significant increases in Zn uptake in ABGR200 and ABGR400. The Zn uptake was 86 µg·pot−1 higher in ABGR200 than that of NPK200 and 135 µg·pot−1 higher than that of BGR200. The Zn uptake of ABGR400 was 312 µg·pot−1, three times higher than the values observed for NPK400 and BGR400.
4. Discussion
4.1. Effects of Acidification on BGR Composition
Acidification of BGR increased H2O-soluble P and Ca, suggesting that minerals that are present under alkaline conditions (e.g., brushite and hydroxylapatite [14]) were decomposed as a result of lowering the pH to 5.5. We observed an increase of H2O-soluble P from 15% to 44% of TP. These results correspond well with Regueiro et al. [9], who found an H2O-soluble P content of 36% in acidified pig slurry, while the dissolved P in the untreated slurry (pH 7.4) was below the detection limit. Very similar results were obtained by Pedersen et al. [12] with acidified cattle slurry. In their study, the H2O-soluble P in raw slurry at pH 6.5 (32%) increased by acidification to pH 5.5 to 69%.
Our results confirm the link between P and Mg. It is known that the mineral struvite (MgNH4PO4·6 H2O) precipitates in BGR at pH values between 8 and 9 [32], resulting in a decrease in direct plant availability of P. In turn, as the pH value decreases, these minerals dissolve again. This was confirmed by the increased H2O-solubilities of Mg, which amounted to 37% for ABGR and only 7% for BGR. Similar effects on soluble P, Mg, and Ca in acidified pig slurry were also demonstrated by Hjorth et al. [10]. The results of our study confirmed our first hypothesis. However, it is important to note that the increased P solubility of ABGR is only a snapshot. Since the pH increases again during storage, the solubility would then decrease once more. Regueiro et al. [33] examined the impact of acidification on slurry composition of pig and dairy slurry and reported that pH and P solubility returned to the level of untreated slurry after less than 20 days. It can be assumed that this effect can be transferred to ABGR.
Our second hypothesis can only partially be confirmed. While the proportions of H2O soluble Ca, Mg, and Mn significantly increased, those of dissolved Cu, Zn, and Fe were reduced. Hjorth et al. [10] showed that the particle size of pig slurry increased as result of acidification. Both Cu and Zn are particularly well known for their high affinity to bind to particles [34]. It can, therefore, be assumed that the reduced solubility of Cu and Zn was due to an accumulation on bigger particles, which were then removed from the liquid phase. Comparable effects were also described by Cocolo et al. [35] in acidified pig slurry. However, this effect appears to be much more pronounced with BGR, because the particle size is already increased during the anaerobic digestion [36].
4.2. Acid Demand and Effects of the Fertilizers on Soil
Compared with studies on acidified pig or cattle slurry, the required acid amount was highest in the present investigation at 17.3 mL of H2SO4 per kg BGR. This is because BGR has a much higher initial pH and puffer capacity than raw slurries. In a study investigating acidification of pig and cattle slurry, Stevens et al. [16] reported a significant positive linear relationship between NH4+ content and acid demand, and it is well known that the NH4+ content increases under anaerobic digestion [13]. Sigurnjak et al. [37] reported that 14.7 mL of H2SO4 was needed per L of codigested waste from the food industry. Hjorth et al. [10] used 10.6 mL of H2SO4 per kg pig slurry (9.5 L/m3 (recalculated)) for acidification from pH 7.1 to 5.3, and Pedersen et al. [12] reported that 1.7 mL of H2SO4 was needed per kg cattle slurry in their experiment, which is only 10% of the acid demand of our experiment.
Our third hypothesis was that the application of ABGR will decrease soil pH. Our results confirmed this hypothesis. The application of ABGR decreased soil pH to the same extent as NPK, whereas BGR caused increased soil pH compared with the initial value (Figure 1A). The pH-increasing effect of BGR reflected the results of Bachmann et al. [38], who also found an increased soil pH after application of codigested dairy slurry. Chen et al. [39] demonstrated that applied BGR acts as a buffer in the soil, thereby neutralizing the soil pH depending on the initial value. In contrast, Prays and Kaupenjohann [40] showed that soil pH decreased even under fertilization with alkaline BGR. Sigurnjak et al. [37] showed that the application of a BGR with pH 8.1 to a soil with pH of 4.9 had no pH-increasing effect. This differs from our findings, but Sigurnjak et al. [37] were also able to show a pH reduction by ABGR; however, acidified pig slurry had no effect on soil pH in their study. Berg et al. [41] also showed that the application of pig slurry acidified to pH 4.5 and cattle slurry acidified to pH 5 had no effect on soil pH. In our experiment, we explained the pH-lowering effect of ABGR on soil as the sum of the direct impact of the applied sulfate and the increased NH4+ supplied to the soil. Regueiro et al. [33] showed that, through acidification with H2SO4, the NH4+ concentrations of both cattle slurry and pig slurry were still significantly higher than those in the raw slurry after 60 days. Higher soil NH4+ concentrations in turn lead to two proton-releasing processes in soils: (1) nitrification and (2) proton extrusion of roots in exchange for NH4+ uptake. It should be noted, however, that the soil in our experiment was loamy sand with high initial pH of 6.6. Another soil with a high buffer capacity is likely to have reacted differently to fertilization. It should also be considered that this was a pot trial conducted only over the first 8 weeks of maize development. How these results can be transferred to a field situation over an entire growing season is, therefore, difficult to transfer.
Fertilization with BGR led to an increase in soil pH and, thus, to a reduction in the solubility of soil Mn. In northern Germany, the arable soils normally contain considerably higher Mn than the crop demand; however, unfortunately, most of the Mn is not in a plant-available form. The amount of Mn available to plants is controlled by, among other things, the acidity and redox potential of the soil, which has long been known [42]. It can be surmised that, with decreasing pH value, the amount of available Mn increases. However, in our case, the treatment with the significantly lowest soil pH (NK) did not have the highest plant-available quantity of Mn. This can be explained, on the one hand, by the fact that the organically fertilized treatments also contain Mn (5 mg Mn for BGR/ABGR200 and 10 mg for BGR/ABGR400). On the other hand, Mn could not be classified as a yield-limiting factor in this experiment, as the available soil Mn concentrations in both NPK treatments were at the same level or even higher than in the ABGR treatments, although NPK did not receive additional Mn. However, the NK treatment received the highest mineral NH4SO4 fertilization, and it is known that this fertilizer increases the availability of Mn in the soil [43].
4.3. Effects on Plant Growth, Nutrient Concentration, and Nutrient Uptake
Our results show that BGR acidification improved the nutrient supply for maize plants during the early growth phases, which generates a higher biomass. This is particularly important because, due to a high nutrient requirement and a relatively weak developed root system, maize plants place the highest demands on nutrient supply during the early stages of their development. This is especially important for P, because P moves in the soil via diffusion to the plant roots [44]. An increase in the root development of the plants increases the P uptake. Therefore, at the beginning of P deficiency, root growth is initially increased until further P deficiency decreases both root and shoot growth [45]. In our study, we generated comparable DM biomass with 200 mg P from ABGR and with 400 mg P from untreated BGR. Acidification had no negative effects in the growth of young maize plants. This outcome is contrary to that of Sigurnjak et al. [37], who found decreased FM yield of lettuce (Lactuca sativa L.) after fertilization with ABGR.
A dilution effect can clearly be seen in the N concentrations in plant tissue. Our results show that the plants with the highest biomass growth also had the lowest N concentrations, although N was conserved in the soil as a result of the acidification. However, acidification increased N uptake at both fertilizer levels. A very similar effect, although not as pronounced as that for N, was observed for P concentration. Although P was much more soluble in ABGR as a result of acidification, and the soluble P in the acidified treatments was also increased in the soil at the end of the experiment, no increased P concentrations were found in the maize plant tissues. These results are consistent with those of Pedersen et al. [12], who found no differences in P concentration in maize plants at the seven-leaf stage fertilized with cattle slurry or acidified cattle slurry.
Since the Mg concentrations and Mg uptake were both significantly higher at both acidified application rates than in NPK fertilization, it can be assumed that there is an Mg fertilization effect of struvite in ABGR treatments. Fertilization with struvite can increase the Mg uptake of crops [46]. The most striking result to emerge from the current study is that the Mn concentration and Mn uptake of maize fertilized with BGR dramatically decreased, and the Mn uptake of BGR400 was even lower than that of the unfertilized control plants. This effect was eliminated efficiently by the acidification of BGR. For maize, Mn supply tends to play a minor role; however, for wheat and barley, for example, improving the availability of Mn by acidifying BGR or slurry will be an enormous advantage. This will be a fruitful area for further research, especially under field conditions in northern Europe, where Mn deficiency could be a yield-limiting problem.
The very low Ca concentrations and low Ca uptake of the plants can be explained by the fact that BGR treatments were fertilized with a considerably lower proportion of soluble Ca compared with ABGR treatments (Table 2). This is because calcite (CaCO3) precipitation occurs in BGR, since carbonates are present in excess as a result of anaerobic digestion, and these precipitation processes are mainly controlled by the pH value and Ca [17]. Bachmann [23] was also able to show that the Ca uptake of 8 week old maize and amaranth plants fertilized with anaerobic digested cattle slurry was lower than that of NK and NPK on both sandy and loamy soils. However, in her study, the NPK treatment was triple superphosphate, whereby additional Ca was applied, whereas the NPK in our experiment was Ca-free (NH4)2HPO4. It can be assumed, however, that acute Ca deficiency in the BGR treatments was not the cause of the lower biomass production, as the typical Ca deficiency symptoms for maize (“buggy-whipping”) were not noticeable.
The results showed that the Zn concentration of ABGR plants at both application rates was significantly higher than the Zn concentration of BGR. On the one hand, this is no surprise, because Zn, like most micronutrients, is better available to plants at low soil pH. On the other hand, Zn was one of the micronutrients whose solubility decreased when H2SO4 was added to the BGR. It can, therefore, be assumed that the Zn absorbed by the plants is more likely to come from the soil than from the applied BGR. This is also supported by the fact that the Zn concentrations were significantly higher in NK than in all treatments. Sigurnjak et al. [37] observed similar results with acidified pig slurry and ABGR, which led to higher Zn concentrations in lettuce compared with those in lettuce grown under untreated slurry or BGR.
As the S concentration in the maize plants was the same for all treatments (data not shown), it can be assumed that S did not limit the yield in the pot experiment. Although S was applied in excess as a result of acidification, the plants did not engage in overconsumption of S. Furthermore, no negative effect on the plants was observed because of the high application rate of S.
It can be assumed that this effect is not solely based on the increased N efficiency or increased P availability. Thus, because BGR are mixtures of substances and multiple nutrient fertilizers, it is difficult to isolate one single yield-promoting effect. Rather, multiple factors together led to improved plant growth, which confirms our fourth hypothesis.
5. Conclusions
In the future, farmers in the EU will be increasingly forced by law to reduce the application of slurry and BGR. For example, in some regions in northern Germany, farmers will have to reduce their average fertilizer requirements by 20% from 2021 onward. Therefore, techniques have to be identified to generate consistent or increasing yields with reduced fertilizer application rates. According to our results, ABGR is a good starter fertilizer for maize. In both tested fertilization rates, ABGR increased the plant biomass of maize after 8 weeks. Moreover, fertilization with ABGR even exceeded the effect of the tested mineral P fertilizer, which implies that mineral P fertilizer could potentially be replaced by ABGR. This can improve the P balance of a forage farm. To decrease the pH of BGR to 5.5, a significantly larger quantity of H2SO4 is required as for pig or cattle slurry. Although more H2SO4 was used, no damage to the maize seedlings was observed. However, the pH of the soil was lowered below its initial value after the application of ABGR, whereas the pH was not decreased lower than in the mineral P fertilized treatments. Furthermore, Mn and Zn nutrition of the maize plants was also significantly increased by ABGR application. In addition to the increasing biomass growth, acidification could also contribute to an improvement in feed quality of maize silage, as demonstrated by the increased Ca, Mg, and P uptake. Our results also highlight that fertilization with BGR decreased both Mn concentration and Mn uptake by maize, which was prevented by ABGR.
Author Contributions
Conceptualization, visualization, investigation, laboratory work, data collection, data analysis, and writing—original draft, J.T.M.; investigation, B.M.G.; conceptualization, project administration, supervision, and review, K.-H.M. All authors have read and agreed to the published version of the manuscript.
Funding
The project was funded by the Stiftung Schleswig-Holsteinische Landschaft, Kiel.
Acknowledgments
The statistical advice of M. Hasler is gratefully acknowledged. We acknowledge financial support by Land Schleswig-Holstein within the funding program Open Access Publikationsfonds.
Conflicts of Interest
The authors declare no conflict of interest.
Appendix A
Figure A1.
BGR and ABGR after centrifugation before determination of dissolved nutrients.

References
- Husted, S.; Jensen, L.S.; Jørgensen, S.S. Reducing ammonia loss from cattle slurry by the use of acidifying additives: The role of the buffer system. J. Sci. Food Agric. 1991, 57, 335–349. [Google Scholar] [CrossRef]
- Fangueiro, D.; Hjorth, M.; Gioelli, F. Acidification of animal slurry—A review. J. Environ. Manag. 2015, 149, 46–56. [Google Scholar] [CrossRef]
- Ndegwa, P.M.; Hristov, A.N.; Arogo, J.; Sheffield, R.E. A review of ammonia emission mitigation techniques for concentrated animal feeding operations. Biosyst. Eng. 2008, 100, 453–469. [Google Scholar] [CrossRef]
- IRECTIVE (EU) 2016/2284 of the European Parliament and of the Council—Of 14 December 2016—On the Reduction of National Emissions of Certain Atmospheric Pollutants, Amending Directive 2003/35/EC and Repealing Directive 2001/81/EC. DIRECTIVE (EU) 2016/2284; European Parliament: Strasbourg, France, 2016.
- Commission Implementing DECISION (EU) 2017/302 of 15 February 2017 Establishing Best Available Techniques (BAT) Conclusions, under Directive 2010/75/EU of the European Parliament and of the Council, for the Intensive Rearing of Poultry or Pigs. Directive 2010/75/EU; European Parliament: Strasbourg, France, 2017.
- Eriksen, J.; Sørensen, P.; Elsgaard, L. The fate of sulfate in acidified pig slurry during storage and following application to cropped soil. J. Environ. Qual. 2008, 37, 280–286. [Google Scholar] [CrossRef] [Green Version]
- Pedersen, I.F.; Rubæk, G.H.; Nyord, T.; Sørensen, P. Row-injected cattle slurry can replace mineral P starter fertiliser and reduce P surpluses without compromising final yields of silage maize. Eur. J. Agron. 2020, 116, 126057. [Google Scholar] [CrossRef]
- Seidel, A.; Pacholski, A.; Nyord, T.; Vestergaard, A.; Pahlmann, I.; Herrmann, A.; Kage, H. Effects of acidification and injection of pasture applied cattle slurry on ammonia losses, N2O emissions and crop N uptake. Agric. Ecosyst. Environ. 2017, 247, 23–32. [Google Scholar] [CrossRef]
- Regueiro, I.; Coutinho, J.; Balsari, P.; Popovic, O.; Fangueiro, D. Acidification of pig slurry before separation to improve slurry management on farms. Environ. Technol. 2016, 37, 1906–1913. [Google Scholar] [CrossRef] [PubMed]
- Hjorth, M.; Cocolo, G.; Jonassen, K.; Abildgaard, L.; Sommer, S.G. Continuous in-house acidification affecting animal slurry composition. Biosyst. Eng. 2015, 132, 56–60. [Google Scholar] [CrossRef]
- Fangueiro, D.; Pereira, J.L.S.; Fraga, I.; Surgy, S.; Vasconcelos, E.; Coutinho, J. Band application of acidified slurry as an alternative to slurry injection in a Mediterranean double cropping system: Agronomic effect and gaseous emissions. Agric. Ecosyst. Environ. 2018, 267, 87–99. [Google Scholar] [CrossRef]
- Pedersen, I.F.; Rubæk, G.H.; Sørensen, P. Cattle slurry acidification and application method can improve initial phosphorus availability for maize. Plant Soil 2017, 414, 143–158. [Google Scholar] [CrossRef] [Green Version]
- Möller, K.; Müller, T. Effects of anaerobic digestion on digestate nutrient availability and crop growth: A review. Eng. Life Sci. 2012, 12, 242–257. [Google Scholar] [CrossRef]
- Güngör, K.; Jürgensen, A.; Karthikeyan, K.G. Determination of phosphorus speciation in dairy manure using XRD and XANES spectroscopy. J. Environ. Qual. 2007, 36, 1856–1863. [Google Scholar] [CrossRef] [PubMed]
- Muster, T.H.; Douglas, G.B.; Sherman, N.; Seeber, A.; Wright, N.; Güzükara, Y. Towards effective phosphorus recycling from wastewater: Quantity and quality. Chemosphere 2013, 91, 676–684. [Google Scholar] [CrossRef]
- Stevens, R.J.; Laughlin, R.J.; Frost, J.P. Effect of acidification with sulphuric acid on the volatilization of ammonia from cow and pig slurries. J. Agric. Sci. 1989, 113, 389–395. [Google Scholar] [CrossRef]
- Sommer, S.G.; Husted, S. The chemical buffer system in raw and digested animal slurry. J. Agric. Sci. 1995, 124, 45–53. [Google Scholar] [CrossRef]
- Dou, Z.; Toth, J.D.; Galligan, D.T.; Ramberg, C.F.; Ferguson, J.D. Laboratory Procedures for Characterizing Manure Phosphorus. J. Environ. Qual. 2000, 29, 508. [Google Scholar] [CrossRef]
- Murphy, J.; Riley, J.P. A modified single solution method for the determination of phosphate in natural waters. Anal. Chim. Acta 1962, 27, 31–36. [Google Scholar] [CrossRef]
- Schüller, H. Die CAL-Methode, eine neue Methode zur Bestimmung des pflanzenverfügbaren Phosphates in Böden. Z. Pflanz. Bodenkde 1969, 123, 48–63. [Google Scholar] [CrossRef]
- Blume, H.-P. (Ed.) Handbuch der Bodenuntersuchung. Terminologie, Verfahrensvorschriften und Datenblätter; Physikalische, Chemische, Biologische Untersuchungsverfahren; Gesetzliche Regelwerke; Wiley-VCH, Beuth: Weinheim/Berlin, Germany; Wien, Austria; Zürich, Switzerland, 2000; ISBN 978-3-527-19080-5. [Google Scholar]
- Barry, D.A.J.; Miller, M.H. Phosphorus Nutritional Requirement of Maize Seedlings for Maximum Yield. Agron. J. 1989, 81, 95–99. [Google Scholar] [CrossRef]
- Bachmann, S. Phosphor-Düngewirkung von Biogasgüllen: Ein Beitrag zur Sicherung Einer Nachhaltigen Bioenergieproduktion. Ph.D. Thesis, University of Rostock, Rostock, Germany, 2012. [Google Scholar]
- Schiemenz, K.; Eichler-Löbermann, B. Biomass ashes and their phosphorus fertilizing effect on different crops. Nutr. Cycl. Agroecosyst. 2010, 87, 471–482. [Google Scholar] [CrossRef] [Green Version]
- Vogel, T.; Nelles, M.; Eichler-Löbermann, B. Phosphorus application with recycled products from municipal waste water to different crop species. Ecol. Eng. 2015, 83, 466–475. [Google Scholar] [CrossRef]
- Houba, V.J.G.; Novozamsky, I.; Huybregts, A.W.M.; van der Lee, J.J. Comparison of soil extractions by 0.01 M CaCl2, by EUF and by some conventional extraction procedures. Plant Soil 1986, 96, 433–437. [Google Scholar] [CrossRef]
- R Core Team. R: A Language and Environment for Statistical Computing; R Foundation for Statistical Computing: Vienna, Austria, 2020. [Google Scholar]
- Laird, N.M.; Ware, J.H. Random-Effects Models for Longitudinal Data. Biometrics 1982, 38, 963. [Google Scholar] [CrossRef] [PubMed]
- Verbeke, G.; Molenberghs, G. Linear Mixed Models for Longitudinal Data; Springer: New York, NY, USA, 2000; ISBN 978-1-4419-0300-6. [Google Scholar]
- Nakagawa, S.; Schielzeth, H.; O’Hara, R.B. A general and simple method for obtaining R2 from generalized linear mixed-effects models. Methods Ecol. Evol. 2013, 4, 133–142. [Google Scholar] [CrossRef]
- Bretz, F.; Hothorn, T.; Westfall, P.H. Multiple Comparisons Using R; Chapman & Hall/CRC Press: Boca Raton, FL, USA, 2011; ISBN 9781584885740. [Google Scholar]
- Münch, E.V.; Barr, K. Controlled struvite crystallisation for removing phosphorus from anaerobic digester sidestreams. Water Res. 2001, 35, 151–159. [Google Scholar] [CrossRef]
- Regueiro, I.; Coutinho, J.; Fangueiro, D. Alternatives to sulfuric acid for slurry acidification: Impact on slurry composition and ammonia emissions during storage. J. Clean. Prod. 2016, 131, 296–307. [Google Scholar] [CrossRef]
- Popovic, O.; Hjorth, M.; Jensen, L.S. Phosphorus, copper and zinc in solid and liquid fractions from full-scale and laboratory-separated pig slurry. Environ. Technol. 2012, 33, 2119–2131. [Google Scholar] [CrossRef]
- Cocolo, G.; Hjorth, M.; Zarebska, A.; Provolo, G. Effect of acidification on solid–liquid separation of pig slurry. Biosyst. Eng. 2016, 143, 20–27. [Google Scholar] [CrossRef]
- Marcato, C.E.; Pinelli, E.; Pouech, P.; Winterton, P.; Guiresse, M. Particle size and metal distributions in anaerobically digested pig slurry. Bioresour. Technol. 2008, 99, 2340–2348. [Google Scholar] [CrossRef] [Green Version]
- Sigurnjak, I.; Michels, E.; Crappé, S.; Buysens, S.; Biswas, J.K.; Tack, F.M.G.; Neve, S.D.; Meers, E. Does acidification increase the nitrogen fertilizer replacement value of bio-based fertilizers? J. Plant Nutr. Soil Sci. 2017, 180, 800–810. [Google Scholar] [CrossRef]
- Bachmann, S.; Wentzel, S.; Eichler-Löbermann, B. Codigested dairy slurry as a phosphorus and nitrogen source for Zea mays L. and Amaranthus cruentus L. Z. Pflanz. Bodenk. 2011, 174, 908–915. [Google Scholar] [CrossRef]
- Chen, M.; Cui, Y.; Bai, F.; Wang, J. Effect of two biogas residues’ application on copper and zinc fractionation and release in different soils. J. Environ. Sci. 2013, 25, 1865–1873. [Google Scholar] [CrossRef]
- Prays, N.; Kaupenjohann, M. Initial Effects of Differently Treated Biogas Residues from Municipal and Industrial Wastes on Spring Barley Yield Formation. PLoS ONE 2016, 11, e0154232. [Google Scholar] [CrossRef] [PubMed]
- Berg, W.; Hörnig, G.; Türk, M. Güllebehandlung mit Milchsäure. Landtechnik 1998, 53, 378–379. [Google Scholar]
- Rengel, Z. Handbook of Plant Growth pH as the Master Variable, 1st ed.; CRC Press: Boca Raton, FL, USA, 2002; ISBN 978-0-367-44707-6. [Google Scholar]
- Husted, S.; Thomsen, M.U.; Mattsson, M.; Schjoerring, J.K. Influence of nitrogen and sulphur form on manganese acquisition by barley (shape Hordeum vulgare). Plant Soil 2005, 268, 309–317. [Google Scholar] [CrossRef]
- Olsen, S.R.; Kemper, W.D.; Jackson, R.D. Phosphate Diffusion to Plant Roots. Soil Sci. Soc. Am. J. 1962, 26, 222–227. [Google Scholar]
- Mollier, A.; Pellerin, S. Maize root system growth and development as influenced by phosphorus deficiency. J. Exp. Bot. 1999, 50, 487–497. [Google Scholar] [CrossRef]
- Vogel, T.; Nelles, M.; Eichler-Löbermann, B. Phosphorus effects of recycled products from municipal wastewater on crops in a field experiment. Plant Soil Environ. 2017, 63, 475–482. [Google Scholar] [CrossRef] [Green Version]
Figure 1.
(A) Soil pH (CaCl2) at the end of the experiment. The dashed line corresponds to the initial soil pH. (B) Soluble Mn. (C) Soluble P. For treatment abbreviations, see Table 1. Different letters above the box plots indicate significant differences (p ≤ 0.05) between treatments.
Figure 1.
(A) Soil pH (CaCl2) at the end of the experiment. The dashed line corresponds to the initial soil pH. (B) Soluble Mn. (C) Soluble P. For treatment abbreviations, see Table 1. Different letters above the box plots indicate significant differences (p ≤ 0.05) between treatments.

Figure 2.
Shoot biomass of maize plants 8 weeks after germination. Values are means (n = 5) ± SD (bars). Different letters above the bars indicate significant differences (p ≤ 0.05) between treatments. For treatment abbreviations, see Table 1.
Figure 2.
Shoot biomass of maize plants 8 weeks after germination. Values are means (n = 5) ± SD (bars). Different letters above the bars indicate significant differences (p ≤ 0.05) between treatments. For treatment abbreviations, see Table 1.

Figure 3.
Concentrations of (A) N, (B) P, (C) Mg, (D) Ca, (E) Mn, and (F) Zn of 8 week old maize shoots. Values are the means (n = 5) ± SD (bars). For treatment abbreviations, see Table 1. Different letters above the bars indicate significant differences (p ≤ 0.05) between treatments.
Figure 3.
Concentrations of (A) N, (B) P, (C) Mg, (D) Ca, (E) Mn, and (F) Zn of 8 week old maize shoots. Values are the means (n = 5) ± SD (bars). For treatment abbreviations, see Table 1. Different letters above the bars indicate significant differences (p ≤ 0.05) between treatments.


Table 1.
Treatment codes and application rates of the applied fertilizers a.
| Treatment Code | Total P | FM BGR or ABGR | DAP | NH4SO4 | KCl | K2SO4 |
|---|---|---|---|---|---|---|
| (mg·pot−1) | (g·pot−1) | |||||
| NK | 0 | 0 | 0 | 4.76 | 2.29 | 2.48 |
| NPK200 | 200 | 0 | 1 | 3.92 | 2.29 | 2.29 |
| BGR200 | 200 | 155 | 0 | 2.38 | 1.77 | 2.07 |
| ABGR200 | 200 | 155 | 0 | 2.38 | 1.77 | 2.07 |
| NPK400 | 400 | 0 | 2 | 3.07 | 2.29 | 2.29 |
| BGR400 | 400 | 310 | 0 | 0.00 | 1.25 | 1.25 |
| ABGR400 | 400 | 310 | 0 | 0.00 | 1.25 | 1.25 |
a BGR = biogas residue; ABGR = acidified biogas residue; FM = fresh matter; DAP = (NH4)2HPO4.
Table 2.
Total and H2O-soluble nutrient contents of the analyzed biogas residue (BGR). Values of macronutrients are given as g·kg DM−1 (dry matter) and micronutrients as µg·g DM−1. Values in parentheses represent the percentage of H2O-soluble nutrients of total. Asterisks (*** p ≤ 0.001) indicate significant differences between acidified biogas residue (ABGR) and BGR. n.s, not significant; n.d, not detected. Values are the means of at least two replicates. The standard deviation is not indicated to improve the readability of the table.
| Parameter | BGR Total Nutrient Content | BGR | ABGR |
|---|---|---|---|
| H2O-Soluble Nutrient Content | |||
| DM (%) | 8.13 | n.d | n.d |
| pH | 8.3 | 8.3 | 5.5 |
| Total N (g·kg DM−1) | 82 | n.d | n.d |
| NH4-N (g·kg DM−1) | 51.7 | n.d | n.d |
| P (g·kg DM−1) | 15.9 | 2.4 (15) | 7.1 (44) *** |
| K (g·kg DM−1) | 42.75 | 40.33 (94) | 36.84 (86) n.s |
| S (g·kg DM−1) | 6.06 | n.d | n.d |
| Ca (g·kg DM−1) | 52.52 | 3.23 (6) | 31.21 (59) *** |
| Mg (g·kg DM−1) | 5.87 | 0.39 (7) | 2.16 (37) *** |
| Cu (µg·g DM−1) | 115.6 | 47.24 (41) | 10.99 (10) *** |
| Fe (µg·g DM−1) | 2637 | 324 (12) | 29 (1) *** |
| Mn (µg·g DM−1) | 405.46 | 6.5 (2) | 60.19 (15) *** |
| Zn (µg·g DM−1) | 353.43 | 41.49 (12) | 9.54 (3) *** |
Table 3.
Nutrient uptake of selected elements of 8 week old maize shoots (n = 5) and ANOVA results for each element. Different letters in a column indicate significant differences (p ≤ 0.05) between treatments. For treatment abbreviations, see Table 1.
Table 3.
Nutrient uptake of selected elements of 8 week old maize shoots (n = 5) and ANOVA results for each element. Different letters in a column indicate significant differences (p ≤ 0.05) between treatments. For treatment abbreviations, see Table 1.
| Treatment | Macronutrient Uptake | Micronutrient Uptake | |||||||
|---|---|---|---|---|---|---|---|---|---|
| N | P | K | Ca | S | Mg | Mn | Fe | Zn | |
| (mg·pot−1) | (µg·pot−1) | ||||||||
| NK | 113.8 a | 8.3 a | 282.2 a | 48.4 a | 7.8 a | 8.9 a | 334.9 a | 286.5 a | 69.8 a |
| NPK200 | 269.7 b | 26.9 b | 788.7 b | 105.6 bc | 18.7 b | 22.6 b | 906.1 c | 572.5 ab | 123.6 b |
| BGR200 | 320.5 bc | 29.6 bc | 973.8 bc | 105.3 bc | 24.6 bc | 30.6 bc | 495.6 b | 1108.9 c | 74.4 a |
| ABGR200 | 413.3 cd | 47.8 d | 1042 bc | 146.3 cd | 31.8 c | 35.9 c | 1311.8 cd | 1100.8 bcd | 209.8 c |
| NPK400 | 370.0 bc | 38.5 bcd | 846.4 b | 115.7 c | 28.6 c | 28.5 bc | 1338.3 d | 987.3 c | 94.3 ab |
| BGR400 | 380.2 bc | 42.5 cd | 1018.5 bc | 85.3 b | 29.0 bc | 36.4 bc | 262.8 a | 1146.7 bcd | 105.9 ab |
| ABGR400 | 563.5 d | 52.4 d | 1526.7 c | 172.4 d | 45.0 d | 58.4 d | 2625.9 e | 1729.2 d | 312.1 d |
Publisher’s Note: MDPI stays neutral with regard to jurisdictional claims in published maps and institutional affiliations. |
© 2021 by the authors. Licensee MDPI, Basel, Switzerland. This article is an open access article distributed under the terms and conditions of the Creative Commons Attribution (CC BY) license (http://creativecommons.org/licenses/by/4.0/).
Share and Cite
MDPI and ACS Style
Mackens, J.T.; Görlach, B.M.; Mühling, K.-H. Acidified Biogas Residues Improve Nutrient Uptake and Growth of Young Maize. Agronomy 2021, 11, 344. https://0-doi-org.brum.beds.ac.uk/10.3390/agronomy11020344
AMA Style
Mackens JT, Görlach BM, Mühling K-H. Acidified Biogas Residues Improve Nutrient Uptake and Growth of Young Maize. Agronomy. 2021; 11(2):344. https://0-doi-org.brum.beds.ac.uk/10.3390/agronomy11020344
Chicago/Turabian StyleMackens, Jens Torsten, Bruno Maximilian Görlach, and Karl-Hermann Mühling. 2021. "Acidified Biogas Residues Improve Nutrient Uptake and Growth of Young Maize" Agronomy 11, no. 2: 344. https://0-doi-org.brum.beds.ac.uk/10.3390/agronomy11020344
Note that from the first issue of 2016, this journal uses article numbers instead of page numbers. See further details here.