Article

Cycling Phosphorus and Nitrogen through Cropping Systems in an Intensive Dairy Production Region

1
United States Department of Agriculture, Agricultural Research Service, Kimberly, ID 83341, USA
2
Center for Resilient Communities, University of Idaho, Moscow, ID 83844, USA
3
Water Systems Analysis Group, Earth Systems Research Center, University of New Hampshire, Durham, NH 03824, USA
4
Department of Natural Resources and Society, University of Idaho, Moscow, ID 83844, USA
*
Author to whom correspondence should be addressed.
Submission received: 24 March 2021 / Revised: 10 May 2021 / Accepted: 12 May 2021 / Published: 19 May 2021

Abstract

:
As pressure on the dairy industry to reduce its environmental impact increases, efficient recycling of manure nutrients through local cropping systems becomes crucial. The aim of this study was to calculate annual nitrogen (N) and phosphorus (P) budgets in six counties located in the Magic Valley, Idaho and estimate what distance manure would need to be transported to be in balance with crop nutrient demand given current dairy cattle populations and cropping systems. Our analysis suggests that crop N needs will not be met solely by manure, and synthetic fertilizer will need to be applied. However, to balance P with crop production, manure would need to be transported a minimum of 12.9 km from dairies and would have to replace synthetic fertilizer P on 91% of regional cropland. Education of producers and technical specialists would be necessary to improve the management of manure use in regional cropping systems. Technical solutions such as alternative diets for cattle and nutrient capture from manure streams will also likely be necessary to bring regional P into balance to protect environmental quality and improve the sustainability of the regional dairy industry.

1. Introduction

As livestock production has shifted from small farms to larger-scale confined operations, there is a greater disparity in distribution patterns of manure nutrients. This has increased localized nitrogen (N) and phosphorus (P) loads to soil and generated concern over the environmental impact of these practices. In 2011, global excretion of P in manure was estimated to exceed the amount of fertilizer P produced [1,2]. Even though the availability of manure P sources is often similar to fertilizer P, it is not always efficiently used in crop production. Due to the high moisture content and bulky nature of manures, it is often applied to cropland near livestock farms, resulting in P surpluses that can impair water quality. Unlike P, N in manure is volatile and much of this valuable N can be lost during manure handling and storage, particularly as ammonia (NH3), which can have negative impacts on air quality and ecosystem health [3]. By the time manure is land applied, much of the remaining N may be in an organic form, which will have to undergo mineralization before it can be utilized for plant growth. Manure mineralization rates vary greatly depending on the manure source and climate, which makes it difficult to determine appropriate application rates and timing to maximize efficiency. There are benefits to applying livestock manures as they can provide large amounts of N and P as well as a variety of additional macro- and micro-nutrients to growing crops. In addition, livestock manure adds carbon to soils which can enhance soil health by improving soil structure, water holding capacity, and water infiltration [4]. However, if manure nutrients are to be sustainably recycled through agricultural production, cost-effective methods for redistribution will need to be developed.
In the US, the dairy industry is a major driver of the national economy [5]. The International Dairy Foods Association [6] estimates that the US dairy industry generates USD 620 billion in economic impact, or 3% of US GDP. Pressure from consumers to produce dairy products in a sustainable manner has led to national commitments from the dairy industry to reduce its environmental footprint, including reducing nutrient losses. As production systems and climate vary across the US, environmental priorities also vary, but overall, the greatest concerns have been related to air quality degradation due to emissions of NH3, water quality impacts from nitrate (NO3) leaching and P runoff, and climate impacts from emissions of nitrous oxide (N2O) [7]. Three quarters of the largest dairy farms in the US are in western and southwestern states (Arizona, California, Colorado, Idaho, New Mexico, Oregon, Texas, Utah, and Washington). In these states, 11% of US farms produce 47% of the milk with 46% of the cows, while only 26% of the US forage is produced here [8,9]. In addition to the shift to larger farms, dairy production tends to concentrate near processors to reduce milk shipping costs. The trend towards a large-scale concentrated dairy production model across the western US is consequently associated with regional accumulation of nutrients due to importation of feed nutrients and low nutrient use efficiency at the farm level [10]. There is currently little published data examining these nutrient balances at both the farmgate (includes all nutrient imports/exports and balance for a given farm) and regional scale to better understand the extent of these nutrient accumulations and potential solutions to improve nutrient recycling through cropping systems in dairy-dominated regions.
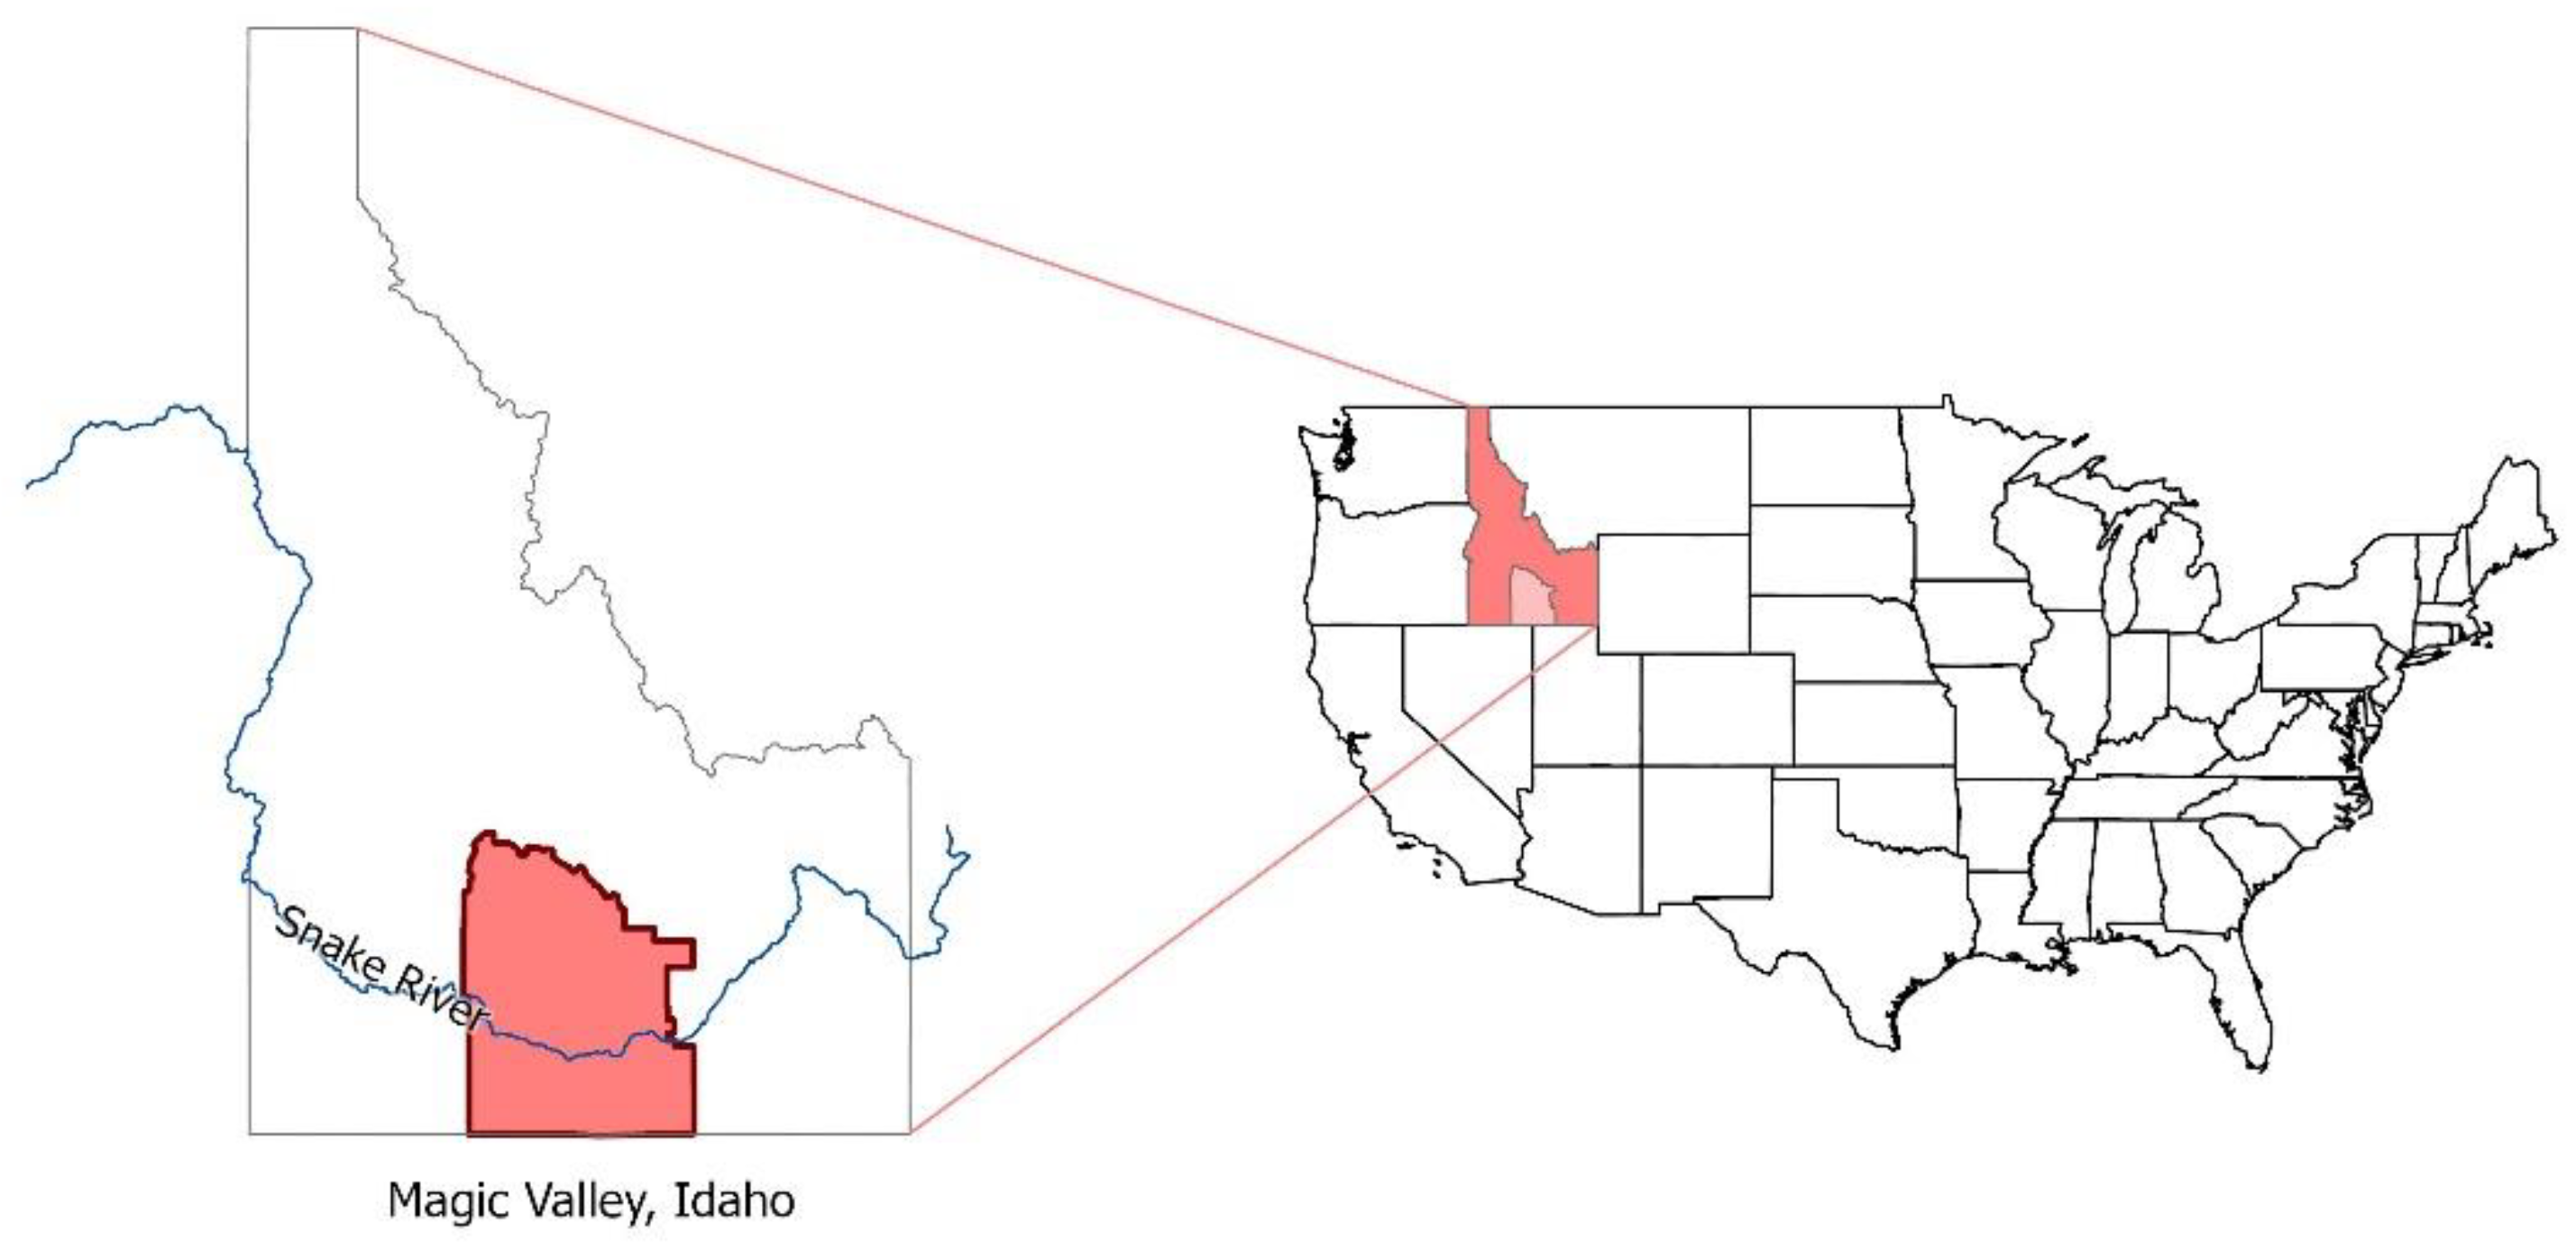
Idaho is representative of large-scale dairy production in the arid western US and is the third largest dairy producing state in the nation [11]. Most of the state’s dairy production (74.8% of total milk herd) is located in southcentral Idaho, known as the Magic Valley, covering six counties (Cassia, Gooding, Jerome, Lincoln, Minidoka, and Twin Falls, Figure 1). Concentration of nutrients via feed import (nutrients from feed imported, not produced, in the region) has led to a surplus of nutrients at the farm gate. Hristov et al. [12] found significant excesses of P on large dairy farms in the Magic Valley region with average whole-farm P imports in the form of feed and fertilizer of 73.9 metric tons year−1 and exports in the form of milk and meat of 44.9 metric tons year−1, leaving an overall surplus of 28.9 metric tons and a surplus per cow of 12 kg yr1. Spears et al. [13] reported a positive farmgate P balance of 10.7 kg cow−1 yr−1 and surplus/unaccounted for N of 174 kg cow−1 yr−1 on average. Modeling of representative dairy farms in the region has indicated that 70% of farms cannot meet crop N needs with manure only and need to import fertilizer N, while 80% of dairies produced more P on-farm than can be used by growing crops [14]. As a result of these P surpluses at the farm gate, there has been a buildup of soil P in many of the crop acres surrounding dairy operations. In response, the Idaho State Department of Agriculture (ISDA) has required dairies in the state to develop a nutrient management plan to regulate, in particular, the amount of P being land-applied and evaluate the risk of potential P losses to both surface and groundwater via use of a P Site Index [15].
While farmgate nutrient surpluses occur, there is an opportunity to utilize manure nutrients on a variety of crops in the region, thereby bringing manure nutrients more in balance with regional crop demands and potentially ameliorating negative environmental impacts. The aim of this study was to (1) calculate N and P (both manure and fertilizer) balances at the regional level, (2) determine whether sustainable use of manure N and P could be obtained within the region, and (3) what distance manure would need to be transported to be in balance with crop removal. We focused on the Magic Valley of southern Idaho because it is representative of Western dairy practices, and is contained within a common environmental, economic and political setting which reduces the assumptions needed to evaluate the efficacy of nutrient transport within the region. In addition, we assessed critical factors related to nutrient management decision making at the farm level in order to better understand how best to achieve regional nutrient balance goals to both maximize crop production and minimize nutrient surplus within the soil and agroecosystem.

2. Materials and Methods

2.1. Nutrient Budget Calculations

Nutrient budgets associated with dairy production in the six-county Magic Valley region in southern Idaho were calculated for both N and P. While there are other livestock operations in the region, dairy cattle comprise approximately 77% of livestock animal units (AU) [8] and represent the largest manure nutrient source that is recycled back through cropping systems. Beef cattle comprise approximately 21% of AU; however, the majority are raised on rangeland while a smaller number winter on agricultural fields or are housed in feedlots. There is no accurate way to predict how much manure may be generated by the cattle feeding on residue in agricultural fields during the winter and what the net nutrient input might be on these fields, or the contribution of manure from feedlots, but compared to dairy manure nutrients applied to cropland, we expect it to be a small input. Sheep and lambs represent 1.3% of AU, while poultry and swine are <1% of AU in the valley. Sheep are also typically raised on rangeland and therefore their manure is not a significant input to cropland in the region.
Budgets for both N and P were calculated on a county basis and then summed across counties to represent regional budgets. Two nutrient budgets were calculated: one based on the total ha of cropland in each county and a second “manure only” nutrient budget calculated on total ha of cropland on which manure was reported to be applied [8].
The N budget for each county was calculated as follows:
N = MNe + FN + BNF − MNv − FNv − CN
where N is the total N budget (MT yr−1), MNe is the total amount of N excreted by dairy cattle, FN is the total amount of fertilizer N applied, BNF is biologically fixed N, MNv is the amount of manure N lost through volatilization, FNv is the amount of fertilizer N lost through volatilization, and CN is crop N removal. We did not calculate N deposition from lightning, aquaculture, cattle grazing, waste treatment facilities, burning of fossil fuels, and biological N fixation by plants other than alfalfa and beans.
The P budget for each county was calculated as follows:
P = MPe + FP − CP
where P is the total P budget (MT yr−1), MPe is the total amount of P excreted by dairy cattle, FP is the total amount of fertilizer P applied, and CP is crop P removal.

2.1.1. Cattle Populations and Nutrient Excretion

Mature dairy cattle populations (lactating and dry) by county were obtained from the Idaho State Department of Agriculture [personal communication]. These numbers are considered to be the most accurate, as ISDA obtains cattle numbers during required on-farm visits. For mature cattle, 84% were assumed to be lactating and 16% dry, according to regional on-farm practices. Based on the United States Department of Agriculture National Agricultural Statistics Service (USDA-NASS) statistics and knowledge of on-farm practices, a one-to-one replacement rate was assumed and equally split between heifers and calves. Total cattle population for each county by type are reported in Table 1.
The total amount of N and P excreted for each dairy cattle class were calculated using the most recent excretion equations available, along with knowledge of local diet composition (Table 2) [12, personal communication Idaho Dairymen’s Association]. The N excretion by lactating dairy cattle was calculated as an average of four excretion equations [16,17,18,19]. The N excretion for dry cows was calculated using the equation from Reed et al. [16]. The N excretion for heifers was calculated using an average of two equations [16,19]. The N excretion for calves was calculated using the equation from Nennich et al. [19]. The P excretion from lactating cattle was calculated using the equation by Nennich et al. [19]. The P excretion from dry cows was calculated using the equation from Weiss [20]. The P excretion for heifers was calculated using the equation from Hill et al. [21]. The P excretion from calves was calculated using the equation from Nennich et al. [19].
The majority of dairy cattle in the Magic Valley are Holsteins, although there has been an increasing number of Jersey cattle included as part of a mixed herd or as the sole breed on some farms. To account for the size difference (therefore affecting DMI and nutrient excretion) and percentage of Jersey cows, a 0.93 adjustment factor was used to reduce total regional excretion rates based on the average weight of the two breeds (635 kg for Holstein and 454 kg for Jersey), assuming 25% of the current herd is Jersey [personal communication Idaho Dairymen’s Association].

2.1.2. Cropland Area and Crop Nutrient Removal

We obtained cropland area and yields for the 10 most prevalent crops grown in the Magic Valley: alfalfa, silage corn, barley, winter and spring wheat, potatoes, sugarbeets, hay and haylage (not alfalfa), dry beans, and triticale, from the 2017 USDA-NASS [8]. When data for individual crops were not available for a county, we used Cropscape to determine area [22]. The amount of cropland receiving manure nutrients by county was obtained from the 2017 US Census of Agriculture [8]. We obtained values for the amount of N and P removal by each crop from the USDA Natural Resources Conservation Service (USDA-NRCS) [23]. Using the yield and nutrient removal values, average N and P removal by harvested crops was calculated.

2.1.3. Fertilizer Nitrogen and Phosphorus Inputs and Biological Nitrogen Fixation

The total on-farm N and P fertilizer use per county was obtained from the United States Geological Survey (USGS) [24]. The N fertilizer amounts reported by the USGS were compared with calculations performed using cropland area and N application rates determined from a regional survey of producer practices (details in Section 2.3 below). The two estimates were highly correlated (r2 = 0.99) with the USGS N fertilizer values being 13.6% higher than those calculated from the regional survey data. The discrepancy is likely because the calculations based on the survey data only included cropland for the 10 most prevalent crops, while the USGS data includes all fertilizer N use. As regional P application data were not available, the USGS fertilizer rates for both N and P were used for consistency.
Alfalfa and dry beans, leguminous crops that convert atmospheric N into NH3 to meet all or part of their N requirements, represent another potentially large input of N through biological nitrogen fixation (BNF). To determine the BNF of these two crops we first determined the average crop area harvested over a 5-year period for alfalfa and the area harvested in 2017 for dry beans in the six counties, and then used a BNF value for each crop to determine the total BNF in each county. Alfalfa is a perennial crop that is kept in production from 4 to 7 years in the Magic Valley. In order to avoid capturing a year in which alfalfa production was high or low, we averaged hectares planted from 2014 through 2018.
Fixation of N by legumes in the Magic Valley is not well studied, and varies among species, soil conditions, amount of water available, soil N available, N additions, and other seasonal factors, ranging from as little as 22 to more than 336 kgs N ha−1 yr−1 [25]. Yost et al. [26] measured an N credit for first-year corn after alfalfa of 168 kg N ha–1 on medium- to fine-textured soils. A study in Utah found that an N credit of 225 kgs ha−1 for corn silage planted following alfalfa was reasonable the first year of planting, with an additional 112 kgs ha−1 the second year [27]. In the current study, we used an intermediate value of 168 kg ha−1 BNF for alfalfa. Studies suggest that the amount of N fixed by beans varies widely. One study with similar soil conditions to Southern Idaho calculated fixation rates from 19 to 72 kg ha−1. We used a conservative estimate of 30 kg BNF ha−1 [28,29]. Research has demonstrated that BNF is inhibited with addition of N, as plants do not need to expend as much energy fixing N from the atmosphere if there is a readily available soil N pool [30,31]. However, it was not possible to determine which acreage may or may not have received fertilizer or manure N or how these N additions may have impacted overall BNF; therefore, we did not account for this affect.

2.1.4. Volatilization of N from Manure and Fertilizer

Reactive N is lost from manures during handling, storage, and land application, while N from fertilizer can be lost following land application. The most common reactive N losses occur as NH3, N2O, and N oxides (NOx). While there are currently no regional studies quantifying NOx emissions from manure and fertilizer, field research quantifying N2O emissions from land application of manure and fertilizer has indicated that less than 1% of total N applied is lost as N2O [32,33]. There is very limited regional on-farm data estimating N2O emissions from dairy production facilities. As N2O emissions will be dependent on both housing and how manure is managed on farm, it is difficult to determine an accurate regional rate, but it has been reported to be ~10% of the N lost as NH3 [34]. Therefore, we only estimated losses of NH3 from both manure and fertilizer. There have been several on-farm studies conducted within the Magic Valley quantifying NH3 losses from dairy production facilities [34,35,36]. Based on these studies, we used a value of 37% of total N excreted being volatilized on-farm from housing, manure handling, and storage. Field research evaluating the loss of NH3-N following manure application indicates a loss of 6 to 10% total N depending on how quickly manure is incorporated [Leytem unpublished data]. To account for losses of NH3 from manure in housing through land application, a value of 43% of total N excreted was used.
Loss of reactive N, in the form of NH3, from fertilizer application varies widely, with measured losses ranging from 3% to >65% depending on soil type, type of fertilizer, wind conditions, fertilizer application method, and other factors [37,38,39,40]. Studies have reported that N applied to damp or wet soils without immediate irrigation or rainfall of more than 5 mm experience the greatest loss of N, ranging from 30 to 67% of N applied [38,39]. Whereas, application to dry fields immediately followed by 7.6 mm or more of irrigation or rainfall experience the lowest losses of fertilizer N [38]. Studies also suggest that application to crop residue rather than to bare ground can increase loss of N [41]. We assumed a loss of 20% of total fertilizer N through NH3 volatilization as the Magic Valley is arid and we assumed most fertilizer applications would take place on dry rather than moist or wet soils and would be tilled in or irrigated in shortly after application.

2.2. Available Cropland by Distance from Dairies

The amount of cropland needed to utilize manure P to be in balance with crop P removal within the Magic Valley region was calculated using ESRI’s ArcGIS Pro 10.7. A crop data layer, compiled by the USDA-NASS, was downloaded from the USDA-NRCS [42]. This layer contained areas for individual crops which was filtered down to the crops included in the nutrient balance and then further down to 8 crops (excluding sugarbeet and potato).
Another data layer contained dairy locations and estimates of dairy cattle numbers throughout the valley. This data layer was compiled using two available maps of dairies in the region: a map available from Idaho Power and Idaho Department of Environmental Quality [43,44]. These were cross-validated with a shapefile containing cow numbers correlated with water rights holders’ names [45] and an ISDA Excel spreadsheet containing dairy cattle numbers and dairy names but no locations [46]. We verified locations of dairies visually using aerial photography available through Google Earth. Where aerial imagery did not clearly indicate the presence of a dairy at a provisional location, a visual inspection confirmed or eliminated the candidate point. Considering the potential for inaccuracies in exact locations of these dairies, considering the provenance of original sources, and the sensitivity of identifying individual operators, we are not releasing the exact locations with this manuscript. For the purposes of this analysis, the reader can assume that the locations of dairy operations in this analysis are hypothetical, yet reasonable.
We represented each dairy as a point with an attribute for herd size in a geographic information system. All geographic calculations were performed in ESRI’s ArcGIS Pro 10.7. Collections of polygons representing a range of maximum driving distances from dairy operations were calculated with the “Generate Drive Time Trade Areas” in ArcGIS which uses the road networks [47] to determine areas accessible by driving a specified maximum distance from starting points (dairy operations) in the shortest amount of time. Tested maximum driving distances from dairy operations ranged from 10–35 km at 1 km increments. We selected “trucking” as the method of transportation to ensure calculated routes could handle truck traffic. The collection of polygons for each maximum travel distance were merged, intersecting crop areas [22] were selected, and the total amount of P removal calculated within each region, as well at the total area required for allocation. We then identified the travel distance needed for P inputs to equal P removal by intersected crops. The calculation used the top 10 crops from the cropland data layer [22] and was then repeated while excluding sugarbeets and potatoes, because manure application may be less likely for these high-value commodity crops. All crops within the Magic Valley were intersected at a driving distance of 12.9 (top 10 cropland classes) and 24.1 km (top 8 cropland classes), and no change in intersected crop removal occurred for longer driving distances.

2.3. Assessment of Producer Practices and Perspectives Regarding Nutrient Management

One of the keys to successfully improving nutrient management at a regional scale is to understand producer practices and perspectives regarding on-farm nutrient management. To better understand how producers view nutrient management in the region, a survey was conducted in 2017. The Social Science Research Unit (SSRU) at the University of Idaho constructed a sampling frame for the survey from lists provided by the Idaho Dairymen Association, Idaho Forage and Hay Association, Idaho Barley Commission, and the Soil & Water Conservation District in Gooding County. These lists include dairy producers as well as row crop producers. A total of 1642 records were compiled for the sampling frame. The survey instrument was created jointly by the USDA Agricultural Research Service Northwest Irrigation & Soils Research Laboratory and researchers at the University of Idaho. This study was reviewed by the University of Idaho’s Institutional Review Board and verified to meet human subjects research criteria under federal regulations and university policy (University of Idaho IRB approval#15-1047) and informed consent was obtained from all survey respondents. The Tailored Design Method for mail surveys was used [48]. The first mailing was sent on 9 January 2017, followed by a postcard on 17 January 2017, and a final mailing sent on 1 February 2017. Final survey dispositions included 237 completed surveys, yielding a response rate of 21.6% after accounting for ineligible respondents within the sampling frame.

3. Results

3.1. Nutrient Balances

The major inputs of N and P into cropland in the Magic Valley are shown in Figure 2. Manure N inputs were the greatest at 45% of total N, followed by fertilizer N at 40%, and BNF at 15%. For P, manure P comprised the greatest input at 55% of total P and fertilizer P represented 45% of regional P inputs.

3.1.1. Nitrogen Balances

The overall N balances for the six counties comprising the Magic Valley are shown in Table 3. Manure N excretion ranged from 2528 to 20,222 MT N yr−1 per county, with a total of 72,078 MT N yr−1 for the region. A 43% loss of N, via NH3 volatilization from manure, resulted in 30,994 MT N yr−1 being lost to the atmosphere. This loss was equivalent to 33% of the total crop N removal for the region (93,725 MT N yr−1). Total fertilizer N additions ranged from 4079 to 17,004 MT N yr−1, with a total of 64,973 MT N yr−1 for the region. The loss of fertilizer N as NH3 was approximately 13.9% of crop removal for the region. Overall, NH3-N losses from manure and fertilizer were equivalent to 47% of N removed by crops each year. The BNF ranged from 2592 to 6189 MT of N yr−1, representing the smallest input of N. Five out of the six counties had positive N balances ranging from 2386 to 7234 MT N yr−1, with Gooding county having the highest positive balance, while Minidoka had a negative N balance of 424 MT N yr−1. There was a positive linear relationship between cattle population and county N balance with r2 = 0.92 (data not shown). The overall N surplus for the Magic Valley was 24,172 MT N yr−1.
The N balances in Table 3 were calculated assuming all nutrients are being distributed equally across all cropland, which is not a realistic scenario. When all N inputs are averaged across all cropland, the application rate is 273 kg N ha−1 yr−1 compared to average crop removal of 214 kg N ha−1 yr−1 (Table 4). The land area receiving manure application as reported by the USDA-NASS is only 16% of the total cropland in the region and falls within a 4 km buffer surrounding current dairy operations, which is consistent with maximum transport distances (6–7 km) reported by many regional dairies (Williams, unpublished data) and in other regions [49]. Using the hectares reportedly receiving manure, the average application rate was 596 kg N ha−1 yr−1 for manure N alone (Table 4). Average crop N removal was then only 36% of total manure N applied. Many of these fields also receive fertilizer N inputs, therefore N is being over-applied on fields in the region that are receiving manure.

3.1.2. Phosphorus Balances

The overall P balances for the six Magic Valley counties are shown in Table 5. Manure P inputs were the largest source of P in the valley, ranging from 423 to 3382 MT P yr−1 per county, with a total of 12,154 MT P yr−1 for the region. Fertilizer P inputs ranged from 638 to 2569 MT P yr−1, with a total of 9917 MT P yr1. The total amount of P removed with crops was 13,159 MT P yr−1, leaving a P surplus of 8913 MT P yr−1 across the valley. All counties had P surpluses and there was a positive linear relationship between P surplus and dairy cattle populations with an r2 = 0.99 (data not shown).
When assessing P application per ha of cropland reported as receiving manure, the average was 176 kg P ha−1 yr−1, while average crop removal rates are only 30 kg P ha−1 yr−1, leaving a large surplus of P to accumulate in soils (Table 6). If manure and fertilizer P were applied across all cropland, the application rate would be 51 kg P ha−1 yr−1, leaving an average surplus of 21 kg P ha−1 yr−1.

3.1.3. Distance Calculation to Balance Phosphorus

Using available roads, the average distance needed to move manure to effectively recycle it through the regional cropping system is 12.9 km, assuming that manure P is applied to all cropland (Figure 3). However, the necessary distance is likely greater as there are fields that already have excessive soil test P and therefore would not be suitable for further manure P application, or that are required by their nutrient management plan to apply P at less than crop removal rates. In addition, producers growing high value commodity crops, such as potato and sugarbeet, may be reluctant to utilize manure due to concerns over crop quality and disease. If we exclude the acreage of these two crops, manure will have to be transported 24.1 km in order to utilize manure P nutrients effectively, as shown in Figure 3 below. At present, average maximum manure transport distances are roughly 6 to 7 km from the dairy, therefore cost-effective methods for redistribution of manure P from areas of surplus to areas of deficit will need to be developed.

3.2. Production Practices and Producer Perspectives toward Nutrient Management

Sustainable nutrient management is based on the 4R principles: understanding the right type of nutrient to apply, the right rate, at the right time, and with the right application method [50]. While commercial fertilizer N and P contents are known, manure nutrient composition can be quite variable. Our survey of producers indicates a large discrepancy in how they perceive the value of manure nutrients, particularly with regard to determining nutrient application rates, with 23% of respondents stating that the value of manure nutrients was not important for determining fertilizer application rates and only 33% feeling it was very important (Table 7). Only 28% of respondents reported that they analyze manure annually, while 38% never analyze their manure. This suggests that not only are manure nutrients undervalued but they are not likely included in calculating nutrient budgets, which can lead to overapplication of N and P, particularly on fields receiving manure.
Education of the parties responsible for making on-farm nutrient management decisions is crucial. Survey results indicated that 76% of respondents had been managing their land for more than 10 years; however, only 18% of these landowners made their own nutrient application decisions. This varied somewhat with crop: 20% of corn, alfalfa, and small grain producers made their own nutrient application decisions, but only 14% of potato and sugarbeet producers did. Most nutrient management decisions were being made by private consultants (17%), fertilizer representatives (37%), or crop consultants (agronomy consultants associated with specific crops; 24%). When asked how important these professionals were for determining nutrient application rates, 88% of respondents said they were very or moderately important.
Two important aspects of effective nutrient management are understanding how much N and P crops need to optimize yield and quality, and how much N and P are available in soils and the nutrient amendments necessary to make up any deficiencies. When asked how important yield goals were to determine nutrient application rates, 69% of respondents said they were very important, 25% said they were moderately important and 7% said they were either not important or somewhat important. The majority of producers reported that soil sample results were either moderately (21%) or very important (70%), while fewer felt that plant sample results were moderately (23%) or very important (33%). A little over half of the respondents (56%) felt that accounting for crop removal of nutrients was important for making nutrient application decisions. Recognizing the importance of soil sampling for making nutrient management decisions, 74% of producers reported that they soil sampled annually, while 19% sampled occasionally.
Understanding the factors that influence decision making related to nutrient management practices is very valuable to develop strategies that might entice producers to make changes on-farm (Table 8). The three factors considered very important by respondents were economic returns (75%), yield goals (72%), and cost of implementation (54%). Ease of adoption (47%) and regulation (35%) ranked highest in the moderately important category while support from the community (32%) and cost-share availability (26%) were considered to be “not important.” It is surprising that although the cost of practices and return on yield were major driving factors for making management decisions, incentives such as cost-share were not deemed to be important. There was a large spread in response to how important water quality was in changing management practices, with forty-one percent (41%) of respondents ranking it as very important, while the distribution between not important, somewhat important, and moderately important was similar (15 to 22%). Our survey, however, suggests that only about 18% of producers make their own nutrient application decisions.

4. Discussion

4.1. Regional N Balance and Reactive N Losses

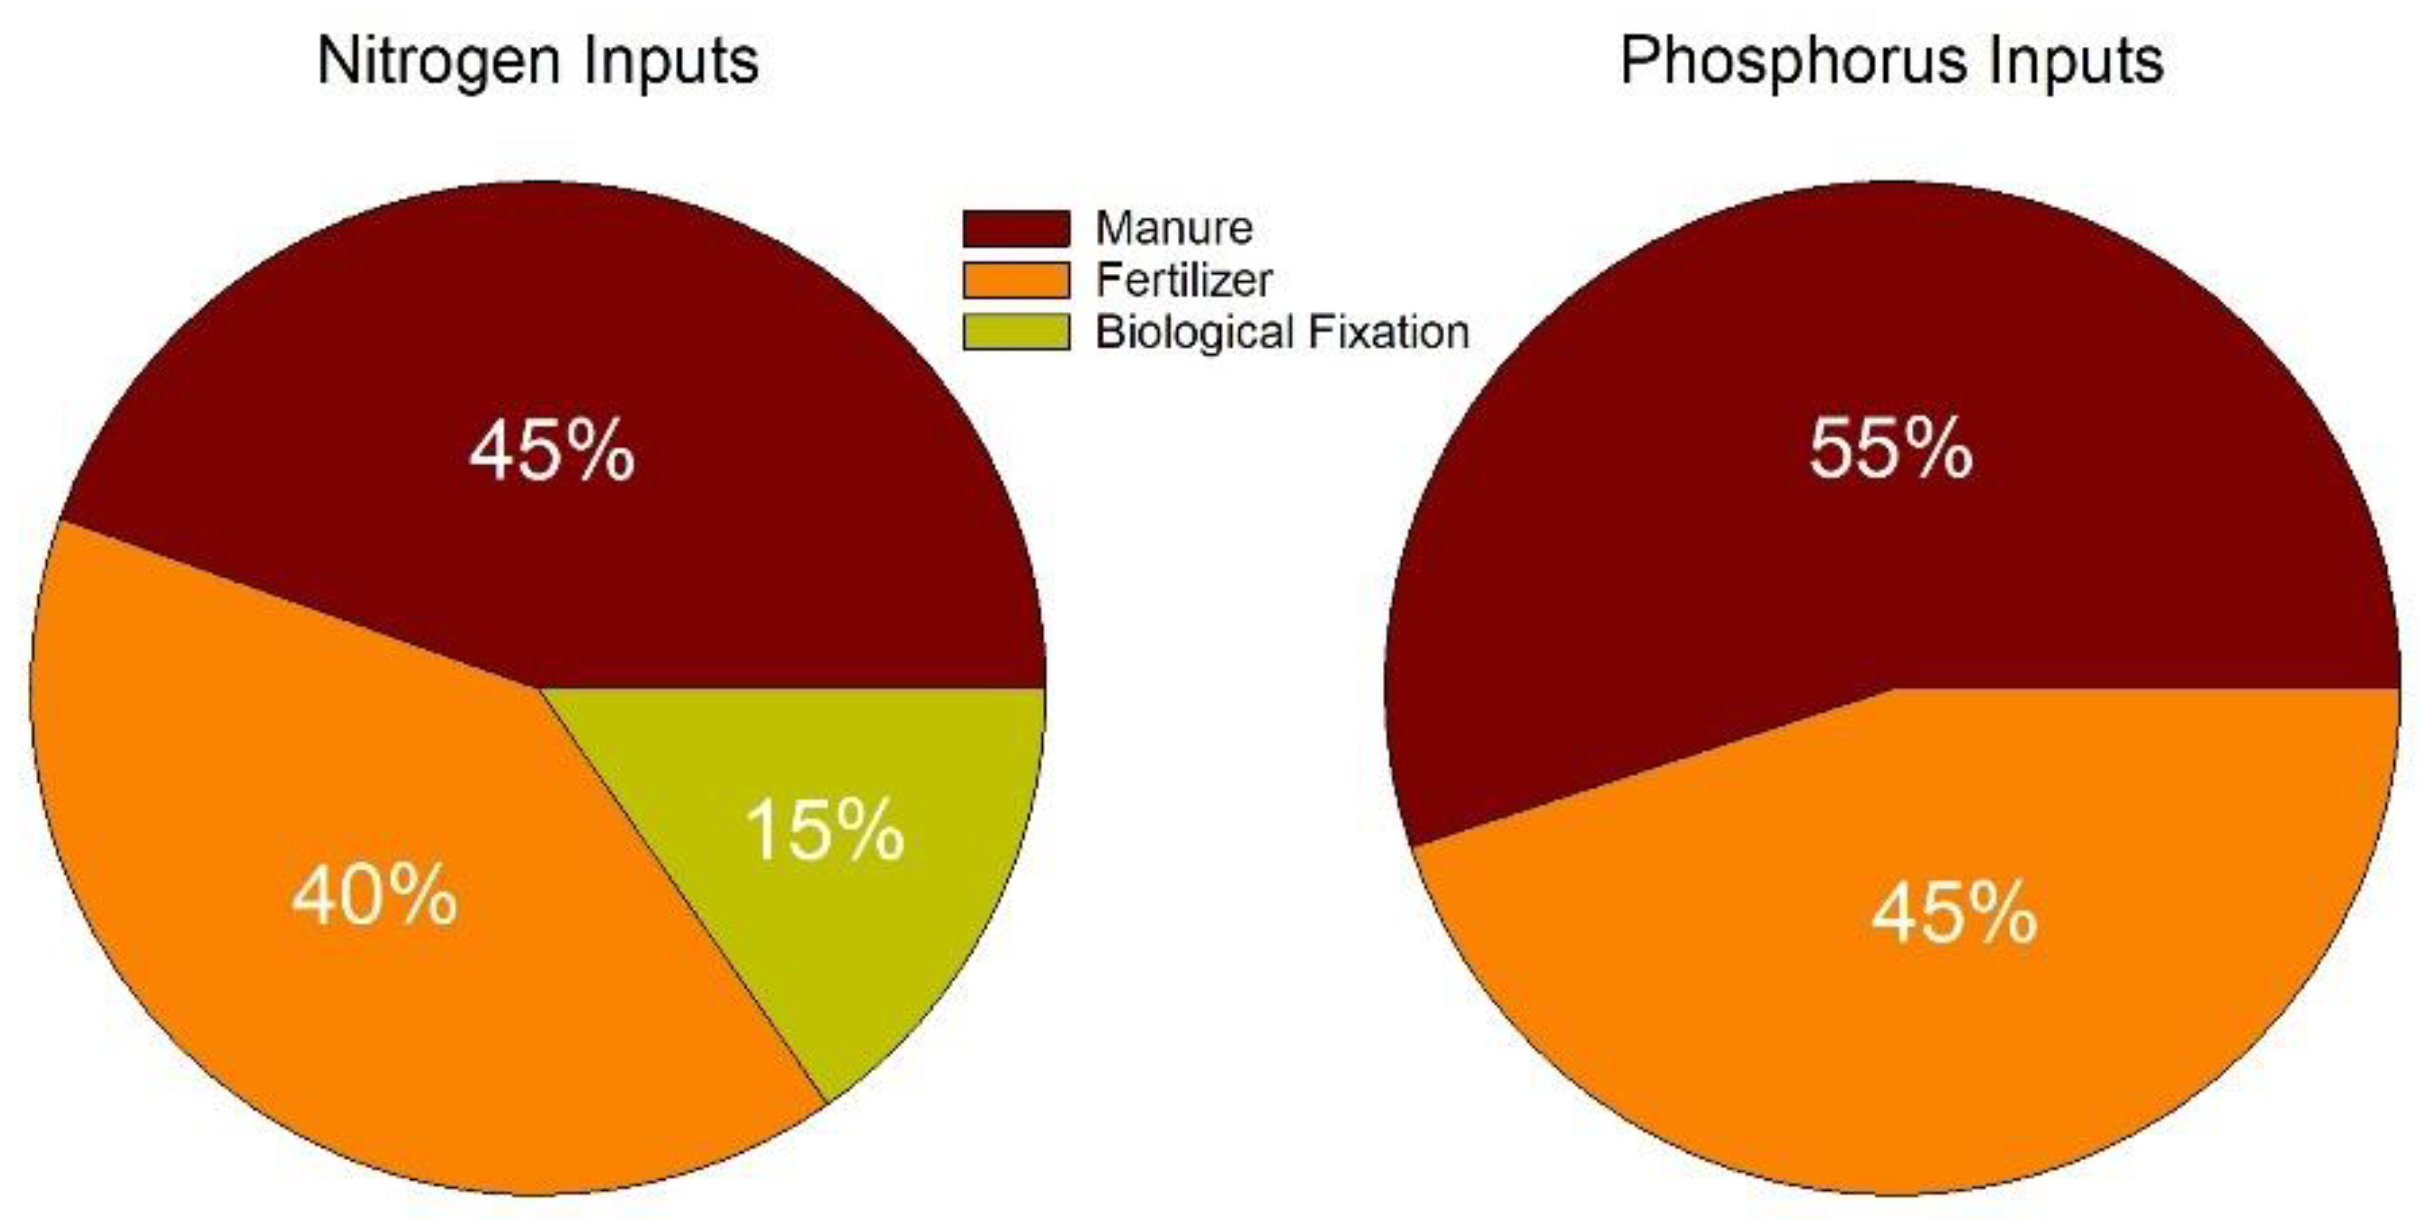
Structural shifts in the dairy industry in developed counties have favored larger scale confined operations as opposed to smaller farms dispersed across a larger land base. This move towards consolidation of the industry has resulted in concentration of manure N and P loads to soil near dairy operations. This trend is clearly seen in the Magic Valley region of Idaho, one of the largest milk-producing regions in the US. Calculations suggest that manure N inputs were slightly larger than synthetic fertilizer N inputs, and five out of six counties had an overall N surplus. However, it is important to keep in mind that 100% of the manure N is not available the year it is applied and can vary substantially due to manure type, soils, and climate. Average N mineralization rates for this region for solid manure (which represents roughly 80% of total manure) range between 15 and 30% [51,52] (Leytem unpublished data). If we include a 15–30% mineralization rate for manure N, this reduces the average available manure N ha−1 to 89–179 kg N ha−1 yr−1 for land receiving manure, which is well under crop removal rates. Assuming all manure and fertilizer are evenly distributed across all acres, the available N ha−1 yr−1 results in, on average, a deficit of 10–25 kg N ha−1 yr−1. Our calculation does not account for inherent N mineralization from soils each year, which is approximately 89 kg ha−1 yr−1, which would exceed this deficit.
When taking into consideration that only 16% of regional cropland is reported to receive manure, it becomes clear that large amounts of N are being applied to limited cropland surrounding dairies. Over extended periods of time, this could become a concern from a water quality perspective as it is unknown how these high N loadings may affect N mineralization in the future. If N mineralization accelerates over time and occurs when there are no growing crops, there is the potential of N losses due to leaching which could negatively impact regional groundwater quality. Additional pathways of N loss include leachate of mobile N species such as NO3. Within the Magic Valley, NO3 leachate to the Eastern Snake Plain Aquifer has led to the localized identification of Nitrate Priority Areas in the region [53]. Our study did not include estimates of NO3 leaching, nor is crop fertilization the only source of N contamination of groundwater. Future studies could evaluate the potential for reduced NO3 leaching from a wider distribution of manures, as presented here.
Large losses of NH3 from manure and fertilizer to the atmosphere are of concern from an air quality perspective. When combined, these losses were equivalent to 47% of N removal by regional crops. In the atmosphere, NH3 reacts with ammonium sulfate and ammonium nitrate aerosols to form fine particulate matter < 2.5 μm in diameter, which is a human health concern [54]. N deposition into terrestrial systems can also impact water quality, plant communities, and aquatic wildlife [55]. There has been little work done in the region to determine how far this NH3 is being transported, how much N is deposited within the Magic Valley, and the implications of the deposition of this N in both croplands and natural ecosystems. Having a better understanding of the transport and deposition of regional NH3 is a critical research gap that needs to be addressed.

4.2. Regional P Balance and Regulatory Environment

Regional manure P inputs to cropland exceed fertilizer P inputs. When both fertilizer and manure P are accounted for, they exceed crop removal of P within the region, leaving an annual surplus of 8913 MT P yr−1 or 21 kg P ha−1 yr−1. Unlike N, the majority of P found in dairy manure is inorganic (60–90%) [56,57] and therefore does not need to undergo mineralization to become plant available. This surplus P application has resulted in high soil test P concentrations throughout the region, having negative implications for regional water quality. Transport of P from agricultural fields to the Snake River has resulted in water quality concerns, with many sections of the river being impaired with respect to total P [58].
Liu et al. [1] reported that P surpluses increase with greater livestock density at the national scale, especially at densities above 2 AU ha−1. The main drivers of these surpluses are the large amount of feed P imported, coupled with low P use efficiency of most livestock. Within the Magic Valley, the annual average excretion rate for a lactating dairy cow is 20 kg AU−1 yr−1 (assuming a 60-day dry period), suggesting a density of 1.5 AU ha−1 would be in balance with average crop P removal. This equates to approximately 1 lactating cow per ha−1 with current crop and feed P management practices. In contrast, many dairies in the region have been permitted to densities up to 4 AU per ha−1, leading to both farm-level and regional P surpluses.
In several countries such as the US, the Netherlands, Norway, Denmark, and Finland, manure P can meet or even exceed the amount needed to achieve sustainable crop productivity [59,60,61,62,63,64]. At the local scale, movement and recycling of manure P coupled with reduced fertilizer P use may result in balancing P with crop removal. However, balancing is not achieved in this and other regions due to manure transport costs, thereby reducing manure P recycling on cropland and favoring use of fertilizer P [63]. We estimated that 91% of current cropland in the Magic Valley region would be needed to absorb the regional manure P generated each year. With only 35% of producers reporting that they receive manure, a large expansion of producers willing to utilize manure (to replace fertilizer P) in their cropping rotations is needed in order to bring regional P into better balance.
Currently, nutrient management of dairy operators in the region is regulated by the ISDA based on the amount of P that is land applied. Dairy producers can perform P Site Index evaluations on their fields to determine the risk of P loss given current management practices. The level of risk associated with current field conditions and practices will determine the amount of P that can be land applied. Alternatively, producers can use a soil P threshold value based on bicarbonate extractable P (Olsen P) in the top 30 cm, which is currently set at 40 ppm. When soil P levels exceed the threshold, producers must develop a plan in conjunction with ISDA to reduce these levels over time. Currently, there are many fields that have exceeded the soil test P threshold and are either not allowed to apply manure or are applying less than crop P removal in order to reduce these soil P levels [16]. It is important to note that P application (fertilizer and manure) by non-dairy farmers is currently not regulated.

4.3. Modifying Nutrient Management Practices to Improve Manure Nutrient Recycling

Manures are a valuable source of nutrients for growing crops as well as providing additional soil health benefits when effectively managed. However, it is difficult to assign a value to manure nutrients and in many cases is it undervalued as a nutrient source, as shown by our survey results. Due to its bulky nature, high moisture content, difficulty in spreading (without the proper equipment), potential or perceived issues with crop quality, weeds and disease, and a difficult to predict N mineralization rate, many producers are hesitant to use manure in their cropping rotations. As only 35% of survey respondents indicated that they receive manure it is clear that a majority of producers do not put a high value on this source of nutrients. Only 33% of respondents felt that the value of manure nutrients was important when making nutrient application decisions and only 28% of respondents analyzed manure annually. These findings indicate a need for education regarding the value of manure nutrients, the importance of regularly testing manure, and including those values in nutrient budget calculations.
Enabling the adaptive capacity of producers to modify practices is likely a key component towards getting wider acceptance of manures as a nutrient source and improving distribution of manure P throughout the region. To increase adaptive capacity among producers, greater awareness of these integrated results is needed in addition to how such changes affect the individual and industry-level agricultural economies. It is also important to recognize that since producers themselves are not making nutrient management decisions in isolation but consider input from consultants, education and extension activities should include these important decision makers. We also need to be aware that, in some instances, there may be competing interests, as fertilizer representatives will likely be reluctant to suggest utilizing manure P as a replacement for fertilizer P, and one-third of producers utilize them to make nutrient management decisions. Regulations, economic incentives, and technical solutions for enhanced transport of dairy manure P from areas with surplus to areas with deficit will be crucial.
Demonstrating value added with utilization of manure nutrients versus fertilizer may enhance the attractiveness of utilizing manure on a greater land base. Studies have shown that use of manure on cropland can improve yields, crop quality, soil health, and soil fertility beyond that achieved using inorganic fertilizers alone [65]. As producers considered yield and economic returns as two of the main drivers of nutrient management decisions, showing a benefit of manure additions over fertilizer may entice producers to utilize it more in cropping rotations. Although cost-share availability was not ranked high for determining changes in nutrient management decisions, offering some sort of payment for moving nutrients from areas of surplus to deficit may also prove important.

4.4. Alternative Strategies for Improving Regional P Balances

Additional strategies such as changes in dairy diets to enhance P use efficiency may be needed to decrease P surpluses in the region. Typical P inclusion rates in regional diets of lactating cows are 0.45%, while it has been shown that dietary P needs can be met at 0.32 to 0.36% [65]. Reducing dietary P to 0.35% would reduce total P excretion by 16% (calculated utilizing the equations cited here to predict P excretion). However, other studies have reported that decreasing dietary P from 0.45 to 0.35% reduced P excretion by 29% [66]. Reducing P excretion would reduce the acreage needed to absorb manure P as well as reduce transportation distance, making it more feasible to achieve regional P balances.
Technologies for capturing P from manure streams and concentrating it into more easily transportable forms will also be essential for long-range redistribution. Several technologies are currently available that will extract P from liquid manure streams and concentrate it for easier transport off-farm; however, there are no available technologies to economically condense solid manure nutrients, which is the most common form of manure managed throughout this region. Research to improve extraction/processing of solid manure nutrients will also be critical to help improve P distribution and sustainably recycle manure P through the regional cropping system.
At the broadest level, this study highlights a series of connections among nutrient balance for P and N in dairy landscapes involving dairy manure, producer attitudes with respect to manure as a nutrient source, and the potential for integrated approaches in-volving producer education, amended nutrient management strategies, and potential technologies for recovering P. These connections at the regional or landscape level con-tribute to an improved understanding of system-level interactions governing food–energy–water systems [67].

5. Conclusions

Our study suggests that a more sustainable system could be attained in this region by wider distribution of manures to meet crop nutrient needs and maintain nutrient balance. Assuming that N is distributed across all cropland, our results suggest that volatilization and slow rates of mineralization result in a slight deficit in N for crop production. However, N, as well as P, are concentrated around dairies due to the cost and inconvenience of transporting manures away from the facility. Phosphorus is in surplus in all counties in this region which has led to regulation of the dairy industry by the state. Many dairies do not have enough cropland for manure application, while staying within the bounds of their nutrient management plans, therefore forcing them to transport manure further distances or stockpile for future use. Dairy and crop producers consider economic returns and crop yields as the two most important factors in decisions about nutrient application. Although transporting manures farther could reduce economic returns, crop yields may improve from application of manures. Motivating wider transport could involve both monetary incentives to do so, combined with educating producers, and the people they employ to make nutrient application decisions, of the benefits of manure application. It is also important to address the potential conflicts of interest of those making nutrient application decisions, as well as to address the regulatory gap between dairy producers and crop farmers.

Author Contributions

Conceptualization, A.B.L., P.W., A.K., J.D.W., L.A., and D.B.; Data curation, A.B.L., P.W., and D.C.; Formal analysis, A.B.L. and P.W.; Funding acquisition, A.B.L., A.K., J.D.W., and D.B.; Investigation, A.B.L. and Y.L.C.; Methodology, A.B.L., P.W., S.Z., A.K., J.D.W., and D.B.; Project administration, A.B.L., A.K., and D.B.; Resources, A.K.; Software, A.M., A.V. (Alyssa Vincent), A.V. (Aaron Vincent), and D.C.; Supervision, A.B.L., P.W., D.C., and J.D.W.; Validation, A.B.L., P.W., and D.C.; Visualization, A.M., A.V. (Alyssa Vincent), and A.V. (Aaron Vincent); Writing—original draft, A.B.L. and P.W.; Writing—review and editing, A.B.L., P.W., S.Z., A.M., Y.L.C., A.V. (Alyssa Vincent), A.V. (Aaron Vincent), D.C., A.K., J.D.W., and D.B. All authors have read and agreed to the published version of the manuscript.

Funding

This research was funded in part by US National Science Foundation (NSF) awards 1639524 and 1856059 through the Innovations at the Nexus of Food, Energy, and Water Systems program. This research was also supported in part by the US Department of Agriculture, Agricultural Research Service. USDA is an equal opportunity provider and employer.

Institutional Review Board Statement

Both human subjects studies referred to in this manuscript were conducted according to the guidelines of the Declaration of Helsinki, and approved by the Institutional Review Board of the University of Idaho (UI-IRB Approval# 15-1047, approved 20 April 2016).

Informed Consent Statement

Informed consent was obtained from all subjects involved in the study.

Data Availability Statement

The data presented in this study are available on request from the corresponding author.

Conflicts of Interest

The authors declare no conflict of interest.

References

  1. Liu, Q.; Wang, J.; Bai, Z.; Ma, L.; Oenema, O. Global animal production and nitrogen and phosphorus flows. Soil Res. 2017, 55, 451–462. [Google Scholar] [CrossRef] [Green Version]
  2. International Fertilizer Association. Fertilizer Statistics. Available online: https://www.fertilizer.org (accessed on 24 February 2021).
  3. Rotz, C.A.; Leytem, A.B. Reactive nitrogen emissions from agricultural operations. EM Mag. 2015, September Issue, 12–17. [Google Scholar]
  4. Leytem, A.; Mutegi, J. Manure Phosphorus Management from a Global Perspective. Better Crops Plant Food 2019, 103, 26–28. [Google Scholar] [CrossRef]
  5. Njuki, E.; Bravo-Ureta, B.E. The economic costs of environmental regulation in U.S. dairy farming: A directional distance function approach. Am. J. Agric. Econ. 2015, 97, 1087–1106. [Google Scholar] [CrossRef] [Green Version]
  6. International Dairy Foods Association. Dairy Delivers. Available online: https://www.idfa.org/dairydelivers (accessed on 24 February 2021).
  7. Holly, M.A.; Kleinman, P.J.; Bryant, R.B.; Bjorneberg, D.L.; Rotz, C.A.; Baker, J.M.; Boggess, M.V.; Brauer, D.K.; Chintala, R.; Feyereisen, G.W.; et al. Short communication: Identifying challenges and opportunities for improved nutrient management through the USDA’s Dairy Agroecosystem Working Group. J. Dairy Sci. 2018, 101, 6632–6641. [Google Scholar] [CrossRef] [PubMed] [Green Version]
  8. USDA-NASS. 2017 Census of Agriculture. Available online: https://www.nass.usda.gov/Publications/AgCensus/2017/Full_Report/Census_by_State/Idaho/index.php (accessed on 24 February 2021).
  9. USDA-NASS. Milk Production; USDA-NASS: Washington DC, USA, 2018.
  10. Spiegal, S.; Kleinman, P.J.A.; Endale, D.M.; Bryant, R.B.; Dell, C.; Goslee, S.; Meinen, R.J.; Flynn, K.C.; Baker, J.M.; Browning, D.M.; et al. Manuresheds: Advancing nutrient recycling in US agriculture. Agric. Syst. 2020, 182, 1–13. [Google Scholar] [CrossRef]
  11. USDA-NASS, 2017 Milk Production. Available online: https://usda.library.cornell.edu/concern/publications/h989r321c?locale=en (accessed on 24 February 2021).
  12. Hristov, A.N.; Hazen, W.; Ellsworth, J.W. Efficiency of use of imported nitrogen, phosphorus, and potassium and potential for reducing phosphorus imports on Idaho dairy farms. J. Dairy Sci. 2006, 89, 3702–3713. [Google Scholar] [CrossRef]
  13. Spears, R.A.; Kohn, R.A.; Young, A.J. Whole-farm nitrogen balance on western dairy farms. J. Dairy Sci. 2003, 86, 4178–4187. [Google Scholar] [CrossRef]
  14. Dell, C.J.; Baker, J.; Spiegal, S.; Porter, S.; Leytem, A.; Flynn, K.C.; Rotz, C.A.; Bjorneberg, D.; Bryant, R.B.; Hagevoort, R.; et al. Challenges and opportunities for manureshed management across U.S. dairy systems. J. Environ. Qual. under revision.
  15. Idaho State Department of Agriculture, Rules Governing Dairy Byproduct. Available online: https://agri.idaho.gov/main/i-need-to/see-lawsrules/isda-rulemaking-2017-2018/rules-governing-dairy-byproduct-phosphorus-idapa-02-04-14/020414_phos_site_index_ref_2017/ (accessed on 10 May 2021).
  16. Reed, K.F.; Moraes, L.E.; Casper, D.P.; Kebreab, E. Predicting nitrogen excretion from cattle. J. Dairy Sci. 2015, 98, 3025–3035. [Google Scholar] [CrossRef] [PubMed]
  17. Yan, T.; Frost, J.P.; Agnew, R.E.; Binnie, R.C.; Mayne, C.S. Relationships among manure nitrogen output and dietary and animal factors in lactating dairy cows. J. Dairy Sci. 2006, 89, 3981–3991. [Google Scholar] [CrossRef]
  18. Kebreab, E.; Strathe, A.B.; Dijkstra, J.; Mills, J.A.N.; Reynolds, C.K.; Crompton, L.A.; Yan, T.; France, J. Energy and protein interactions and their effect on nitrogen excretion in dairy cows. In Energy and Protein Metabolism and Nutrition, Proceedings of the 3rd EAAP International Symposium on Energy and Protein Metabolism and Nutrition, Parma, Italy 6–10 September 2010; EAAP Scientific Series; Crovetto, G.M., Ed.; Wageningen Academic Publishers: Wageningen, The Netherlands, 2010; Volume 127, pp. 417–426. [Google Scholar]
  19. Nennich, T.D.; Harrison, J.H.; VanWieringen, L.M.; Meyer, D.; Heinrichs, A.J.; Weiss, W.P.; St-Pierre, N.R.; Kincaid, R.L.; Davidson, D.L.; Block, E. Prediction of manure and nutrient excretion from dairy cattle. J. Dairy Sci. 2005, 88, 3721–3733. [Google Scholar] [CrossRef] [Green Version]
  20. Weiss, B. Estimating Manure Phosphorus Excretion by Dairy Cows; Ohio State University Extension; Ohio State University: Columbus, OH, USA, 2003. [Google Scholar]
  21. Hill, S.R.; Knowlton, K.F.; James, R.E.; Pearson, R.E.; Bethard, G.L.; Pence, K.J. Nitrogen and phosphorus retention and excretion in late-gestation dairy heifers. J. Dairy Sci. 2007, 90, 5634–5642. [Google Scholar] [CrossRef] [PubMed]
  22. United States Department of Agriculture. National Agricultural Statistics Service. Cropscape Data Layer. Web Portal. Available online: https://nassgeodata.gmu.edu/CropScape/ (accessed on 22 March 2019).
  23. USDA-NRCS. Field Office Technical Guideline. Available online: https://efotg.sc.egov.usda.gov/references/public/ID/CropRemovalRatesandFertilizerGuides_11132019.pdf (accessed on 24 February 2021).
  24. Falcone, J.A. Estimates of County-Level Nitrogen and Phosphorus from Fertilizer and Manure from 1950 through 2017 in the Conterminous United States: U.S. Geological Survey; Open-File Report 2020-1153; USGS: Washington DC, USA, 2021; p. 20.
  25. Caddell, J.; Redfearn, D.; Zhang, H.; Edwards, J.; Deng, S. Forage Legumes and Nitrogen Production; Oklahoma State University Extension Service Publication PSS-2590; Oklahoma State University: Stillwater, OK, USA, 2017. [Google Scholar]
  26. Yost, M.A.; Coulter, J.A.; Russelle, M.P.; Sheaffer, C.C.; Kaiser, D.E. Alfalfa nitrogen credit to first-year corn: Potassium, regrowth, and tillage timing effects. Agron. J. 2012, 104, 953–962. [Google Scholar] [CrossRef] [Green Version]
  27. Shaffer, B.; Cardon, G.; Creech, E.; Banks, J.; Barnhill, J.; Despain, D.; Gale, J.; Israelsen, C.; Kitchen, B.; Nelson, M.; et al. Revisiting past recommendations for alfalfa nitrogen crediting for corn silage following alfalfa in Utah. Crops Soils 2019, 52, 20–22. [Google Scholar] [CrossRef]
  28. Akter, Z.; Pageni, B.B.; Lupwayi, N.Z.; Balasubramanian, P.M.; Willenborg, C. Biological nitrogen fixation by irrigated dry bean (Phaseolus vulgaris L.) genotypes. Can. J. Plant Sci. 2018, 98, 1159–1167. [Google Scholar] [CrossRef]
  29. Franzen, D.W. Fertilizing Pinto, Navy and Other Dry Edible Bean; SF720; North Dakota State University Extension Service: Fargo, ND, USA, 2017; pp. 1–4. [Google Scholar]
  30. Xie, K.; Li, X.; He, F.; Zhang, Y.; Wan, L.; Hannaway, D.B.; Wang, D.; Qin, Y.; Fadul, G.M.A. Effect of nitrogen fertilization on yield, N content, and nitrogen fixation on alfalfa and smooth bromegrass grown alone or in a mixture in greenhouse pots. J. Integr. Agric. 2015, 14, 1864–1876. [Google Scholar] [CrossRef]
  31. Zhao, Y.; Liu, X.; Tong, C.; Wu, Y. Effect of root interaction on nodulation and nitrogen fixation ability of alflalfa in the simulated alfalfa/triticale intercropping in pots. Sci. Rep. 2020, 10, 4269–4280. [Google Scholar] [CrossRef] [Green Version]
  32. Dungan, R.S.; Leytem, A.B.; Tarkalson, D.D.; Ippolito, J.A.; Bjorneberg, D.L. Greenhouse gas emissions from an irrigated dairy forage rotation as influenced by fertilizer and manure applications. Soil Sci. Soc. Am. J. 2017, 81, 537–545. [Google Scholar] [CrossRef] [Green Version]
  33. Leytem, A.B.; Moore, A.D.; Dungan, R.S. Greenhouse gas emissions from an irrigated crop rotation utilizing dairy manure. Soil Sci. Soc. Am. J. 2019, 83, 137–152. [Google Scholar] [CrossRef] [Green Version]
  34. Leytem, A.B.; Dungan, R.S.; Bjorneberg, D.L.; Koehn, A.C. Emissions of ammonia, methane, carbon dioxide, and nitrous oxide from dairy cattle housing and manure management systems. J. Environ. Qual. 2011, 40, 1383–1394. [Google Scholar] [CrossRef] [Green Version]
  35. Bjorneberg, D.L.; Leytem, A.B.; Westermann, D.T.; Griffiths, P.R.; Shao, L.; Pollard, M.J. Measurement of atmospheric ammonia, methane, and nitrous oxide at a concentrated dairy production facility in Southern Idaho using open-path FTIR spectrometry. Trans. ASABE 2009, 52, 1749–1757. [Google Scholar] [CrossRef]
  36. Leytem, A.B.; Dungan, R.S.; Bjorneberg, D.L.; Koehn, A.C. Greenhouse gas and ammonia emissions from an open-freestall dairy in southern Idaho. J. Environ. Qual. 2013, 42, 10–20. [Google Scholar] [CrossRef] [PubMed] [Green Version]
  37. Del Moro, S.K.; Sullivan, D.M.; Horneck, D.A. Ammonia volatilization from broadcast urea and alternative dry nitrogen fertilizers. Soil Sci. Soc. Am. J. 2017, 81, 1629–1639. [Google Scholar] [CrossRef] [Green Version]
  38. Holcomb, J.C.; Sullivan, D.M.; Horneck, D.A.; Clough, G.H. Effect of irrigation rate on ammonia volatilization. Soil Sci. Soc. Am. J. 2011, 75, 2341–2347. [Google Scholar] [CrossRef]
  39. Jones, C.; Brown, B.D.; Engel, R.; Horneck, D.; Olson-Rutz, K. Factors Affecting Nitrogen Fertilizer Volatilization; Montana State Extension Service: Bozeman, MT, USA, 2013. [Google Scholar]
  40. Engel, R.; Jones, C.; Wallander, R. Ammonia volatilization from urea and mitigation by NBPT following surface application to cold soils. Soil Sci. Soc. Am. J. 2011, 75, 2348–2357. [Google Scholar] [CrossRef]
  41. Pan, B.; Lam, S.K.; Mosier, A.; Luo, Y.; Chen, D. Ammonia volatilization from synthetic fertilizers and its mitigation strategies: A global synthesis. Agric. Ecosyst. Environ. 2016, 232, 283–289. [Google Scholar] [CrossRef]
  42. USDA-NRCS. Available online: https://nrcs.app.box.com/v/gateway/folder/22218925171 (accessed on 10 May 2021).
  43. Idaho Power. IdaStream Web Portal. Available online: https://idastream.idahopower.com/ (accessed on 10 March 2021).
  44. Idaho Department of Environmental Quality. Issued Permits and Water Quality Certification. Available online: https://www.deq.idaho.gov/permits/issued-permits-and-water-quality-certifications/ (accessed on 10 March 2021).
  45. Idaho Department of Water Resources. Water Rights Data: Place of Use, Water Rights. Available online: https://data-idwr.opendata.arcgis.com/pages/gis-data (accessed on 10 March 2021).
  46. Idaho State Department of Agriculture. Available online: https://agri.idaho.gov/main/animals/dairy-bureau/ (accessed on 10 March 2021).
  47. U.S. Bureau of the Census. TIGER/Line: Redistricting Census 2010; Bureau of the Census: Washington, DC, USA, 2001. Available online: https://datagateway.nrcs.usda.gov/ (accessed on 10 March 2021).
  48. Dillman, D.; Smyth, J.; Christian, L.M. Internet, Phone, Mail, and Mixed-Mode Surveys: The Tailored Design Method, 4th ed.; John Wiley & Sons: Hoboken, NJ, USA, 2014; p. 528. [Google Scholar]
  49. Hadrich, J.C.H.T.M.; Wolf, C.A. Economic Comparison of Liquid Manure Transport and Land Application. Appl. Eng. Agric. 2010, 26, 734–758. [Google Scholar] [CrossRef]
  50. USDA-NRCS. Conservation Choices: Nutrient Management. Available online: https://www.nrcs.usda.gov/wps/portal/nrcs/detail/null/?cid=nrcseprd415416 (accessed on 24 February 2021).
  51. Lehrsch, G.A.; Brown, B.; Lentz, R.D.; Johnson-Maynard, J.L.; Leytem, A.B. Winter and growing season nitrogen mineralization from fall-applied composted or stockpiled solid dairy manure. Nutr. Cycl. Agroecosys. 2016, 104, 125–142. [Google Scholar] [CrossRef]
  52. Lentz, R.D.; Lehrsch, G.A. Net nitrogen mineralization from past years’ manure and fertilizer applications. Soil Sci. Soc. Am. J. 2012, 76, 1005–1015. [Google Scholar] [CrossRef] [Green Version]
  53. Idaho Department of Environmental Quality 2014 Nitrate Priority Area Delineation and Ranking Process; Idaho Department of Environmental Quality, Water Quality Division: Boise, ID, USA, 2014; p. 132. Available online: https://www.arcgis.com/home/item.html?id=81c54516f0a6492fbcf28ca942b3f7b5 (accessed on 10 May 2021).
  54. Bittman, S.; Brook, J.; Bleeker, A.; Bruulsema, T. Air Quality, Health Effects and Management of Ammonia Emissions from Fertilizers. In Air Quality Management; Taylor, E., McMillan, A., Eds.; Springer: New York, NY, USA, 2014; pp. 261–277. [Google Scholar]
  55. Stevens, C.J.; David, T.I.; Storkey, J. Atmospheric nitrogen deposition in terrestrial ecosystems: Its impact on plant communities and consequences across trophic levels. Funct. Ecol. 2018, 32, 1757–1769. [Google Scholar] [CrossRef] [Green Version]
  56. Hansen, J.C.; Cade-Menum, B.J.; Strawn, D.G. Phosphorus speciation in manure-ammended alkaline soils. J. Environ. Qual. 2004, 33, 1521–1527. [Google Scholar] [CrossRef]
  57. Leytem, A.B.; Westermann, D.T. Phosphorus availability to barley from manures and fertilizers on a calcareous soil. Soil Sci. 2005, 170, 401–412. [Google Scholar] [CrossRef] [Green Version]
  58. Idaho Department of Environmental Quality. Upper Snake Rock/Middle Snake TMDLs: 5-Year TMDL Review; Idaho Department of Environmental Quality, Water Quality Division: Boise, ID, USA, 2010.
  59. Hanserud, O.S.; Brod, E.; Øgaard, A.F.; Müller, D.B.; Brattebø, H. A multi-regional soil phosphorus balance for exploring secondary fertilizer potential: The case of Norway. Nut. Cycl. Agroecosys. 2016, 104, 307–320. [Google Scholar] [CrossRef] [Green Version]
  60. Parchomenko, A.; Borsky, S. Identifying phosphorus hot spots: A spatial analysis of the phosphorusbalance as a result of manure application. J. Environ. Manag. 2018, 214, 137–148. [Google Scholar] [CrossRef] [PubMed] [Green Version]
  61. Smit, A.L.; van Middelkoop, J.C.; van Dijk, W.; van Reuler, H. A substance flow analysis of phosphorus in the food production, processing and consumption system of the Netherlands. Nut. Cycl. Agroecosys. 2015, 103, 1–13. [Google Scholar] [CrossRef] [Green Version]
  62. Svanbäck, A.; McCrackin, M.L.; Swaney, D.P.; Linefur, H.; Gustafsson, B.G.; Howarth, R.W.; Humborg, C. Reducing agricultural nutrient surpluses in a large catchment–Links tolivestock density. Sci. Total Environ. 2019, 648, 1549–1559. [Google Scholar] [CrossRef]
  63. Nesme, T.; Senthilkumar, K.; Mollier, A.; Pellerin, S. Effects of crop and livestock segregation on phosphorus resource use: A systematic, regional analysis. Eur. J. Agron. 2015, 71, 88–95. [Google Scholar] [CrossRef]
  64. Risse, L.M.; Cabrera, M.L.; Fanzluebber, A.K.; Gaskin, J.W.; Gilley, J.E.; Kilhorn, R.; Radcliffe, D.E.; Tollner, W.E.; Zhang, H. Land application of manure for beneficial reuse. In USDA Fund for Rural America Grant; USDA: Washington, DC, USA, 2006; pp. 1–52. [Google Scholar]
  65. National Research Council. Nutrient Requirements of Dairy Cattle, 7th ed.; National Academy of Science: Washington, DC, USA, 2001; 381p. [Google Scholar]
  66. Wu, Z.; Satter, L.D.; Blohowiak, A.J.; Stauffacher, R.H.; Wilson, J.H. Milk production, phosphorus excretion, and bone characteristics of dairy cows fed different amounts of phosphorus for two or three years. J. Dairy Sci. 2001, 84, 1738–1748. [Google Scholar] [CrossRef]
  67. D’Odorico, P.D.K.F.; Rosa, L.; Carr, J.A.; Chiarelli, D.; Dell’ Angelo, J.; Gephart, J.; MacDonald, G.K.; Seekell, D.A.; Suweis, S.; Rulli, M.C. The Global Food-Energy-Water Nexus. Rev. Geophys. 2018, 56, 456–531. [Google Scholar] [CrossRef]
Figure 1. Location of the Magic Valley, located in southcentral ID.
Agronomy 11 01005 g001
Figure 2. Inputs of nitrogen and phosphorus from manure, fertilizer, and biological nitrogen fixation in the Magic Valley, Idaho. (Source data: USGS N and P fertilizer data, calculated manure N and P excretion, and calculated BNF).
Agronomy 11 01005 g002
Figure 3. Distance from dairies to cropland needed to balance manure P generated with crop P removal: map on left excludes sugarbeet and potato hectarage; map on right includes all top 10 crop hectarage.
Agronomy 11 01005 g003
Table 1. Estimated total dairy cattle (head of cattle) populations by county and animal class in the Magic Valley in 2017.
CountyLactatingDryHeiferCalvesTotal Per County
Cassia94,18217,94056,06156,061224,244
Gooding105,34620,06662,70662,706250,824
Jerome64,27012,24238,25638,256153,024
Lincoln29,349559017,47017,47069,879
Minidoka13,17225097841784131,362
Twin Falls69,17013,17541,17341,173164,691
Total375,48971,522223,506223,506894,023
Source: Idaho State Department of Agriculture and USDA-NASS.
Table 2. Dietary assumptions used for calculation of N and P excretion by cattle class, and calculated excretion rates used for nutrient budget calculations.
Cattle ClassDMI * kg d−1CP ** %P + %Ne ++ g d−1Pe ǂ g d−1
Lactating21.017.00.45409.274.1
Dry11.215.50.29176.624.1
Heifer8.114.40.26144.520.9
Calves3.416.60.3563.07.3
* DMI = dry matter intake, ** CP = crude protein of ration, + P = %P in ration; ++ Ne is nitrogen excreted, ǂ Pe is phosphorus excreted.
Table 3. Nitrogen inputs, losses, crop removal, and overall balance for the 6 Magic Valley counties.
ManureNH3-N * ManureFertilizerNH3-N ** FertilizerBiological N FixationCrop RemovalBalance
CountyMT N yr−1
Cassia18,079777417,0043401593322,6077234
Gooding20,222869570411408259213,5716180
Jerome12,337530573981480373112,6184064
Lincoln563324234079816315472422386
Minidoka2528108714,8302966323516,965−424
Twin Falls13,278570914,6202924618920,7224732
Total72,07830,99464,97312,99524,83493,72524,172
* Nitrogen lost as ammonia from manure including housing, manure storage, and land application. ** Nitrogen lost as ammonia from fertilizer land application.
Table 4. Application of total nitrogen (N fertilizer + N manure spread evenly across all cropland), manure nitrogen (on land reported to receive manure), and crop nitrogen removal on an area basis.
Total N *Manure N/Manure Land **Crop Removal +
Countykg N ha−1
Cassia254649193
Gooding299852206
Jerome309398234
Lincoln319817240
Minidoka188413193
Twin Falls267447218
* Total manure N plus fertilizer N divided by total cropland area, ** manure N divided by the total cropland area reported to receive manure, + total crop N removal divided by total cropland area.
Table 5. Total phosphorus inputs from manure and fertilizer, phosphorus removal by crops, and the overall phosphorus balance.
ManureFertilizerCrop RemovalBalance
CountyMT P yr−1
Cassia3024256932372356
Gooding3382110820232466
Jerome2063116817511481
Lincoln942638865715
Minidoka42323222590155
Twin Falls2221211226931640
Total12,154991713,1598913
Table 6. Application of total phosphorus (P fertilizer + P manure spread evenly across all cropland), manure phosphorus (on land reported to receive manure), and crop phosphorus removal on an area basis.
Total P *Manure P/Manure Land **Crop Removal +
Countykg P ha−1
Cassia4819228
Gooding6825231
Jerome6011832
Lincoln5324229
Minidoka3112229
Twin Falls4613228
* Total manure P plus fertilizer P divided by total cropland area, ** manure P divided by the total cropland area reported to receive manure, + total crop P removal divided by total cropland area.
Table 7. Respondents’ ratings of each factor according to their level of importance for determining fertilizer application rates, n = 237.
Not ImportantSomewhat ImportantModerately ImportantVery Important
%
Soil sample results372170
Plant sample results25192333
Crop removal13313026
Consultant recommendations2113553
Yield goal162569
Nutrient value of manure application23202433
Table 8. Respondents’ rating of factors according to their level of importance when considering changing nutrient management practices, n = 237.
Not ImportantSomewhat ImportantModerately ImportantVery Important
%
Economic returns142075
Yield goals162272
Ease of adoption6194729
Cost of implementation2133254
Adequate information about alternative practices8253136
Water quality15222241
Support from community32312413
Regulation11213532
Cost-share availability26282720
Publisher’s Note: MDPI stays neutral with regard to jurisdictional claims in published maps and institutional affiliations.

