Article

Transcriptomic and Metabolomic Studies Reveal Mechanisms of Effects of CPPU-Mediated Fruit-Setting on Attenuating Volatile Attributes of Melon Fruit

1
Horticultural Research Institute, Shanghai Academy of Agricultural Sciences, Shanghai Key Laboratory of Protected Horticultural Technology, Shanghai 201106, China
2
School of Life Science, East China Normal University, Shanghai 200241, China
*
Authors to whom correspondence should be addressed.
Submission received: 19 April 2021 / Revised: 15 May 2021 / Accepted: 17 May 2021 / Published: 19 May 2021

Abstract

:
N1-(2-chloro-4-pyridyl)-N3-phenylurea (CPPU), a synthetic cytokinin-active compound, is widely applied to induce parthenocarpic fruit set and enhance melon fruit enlargement (Cucumis melo L.). CPPU may also influence fruit quality; however, the mechanisms through which this occurs remain unknown. We investigated the differences in volatile emissions between parthenocarpic fruit set by CPPU (C) and seeded fruit set by artificial pollination (P). Gas chromatography–mass spectrometry (GC–MS) analysis revealed that six volatile organic compounds (VOCs) emitted by the P-group fruits were not detected in C-group fruits. The relative abundances of another 14 VOCs emitted by the CPPU-treated fruits were less than those in the P-group fruits. RNA sequencing analysis indicated that a total of 1027, 994, and 743 differentially expressed genes (DEGs) were detected in the C20 (treatment with 20 mg·L–1 CPPU) vs. P, P-C20 (pollination followed by 20 mg·L−1 CPPU treatment) vs. P, and P-C20 vs. C20 treatments, respectively. Compared with the Gene Ontology (GO) and Kyoto Encyclopedia of Genes and Genomes (KEGG) databases, the DEGs related to fatty acid degradation and metabolism, which contribute to volatile production, were enriched. In particular, DEGs such as carotenoid cleavage dioxygenase (CCD)-, lipoxygenase (LOX)-, alcohol dehydrogenase (ADH)-, and alcohol acyltransferase (ATT)-related genes were closely related to the formation of volatiles. In summary, our study provides a metabolic and transcriptomic atlas, reveals the impact of CPPU on VOCs, and enhances our understanding of the mechanisms of CPPU that contribute towards generally reducing the quality of melon fruit.

1. Introduction

Melon (Cucumis melo L.), which belongs to the Cucurbitaceae family, is an important horticultural crop, with 27 million tons of melon fruit produced worldwide each year (www.fao.org/faostat, 21 December 2020). Melon is particularly important in China, where hybrid varieties have significant and growing economic value and account for over 49% of global production. As melon is a pseudo-berry or pepo, melon quality is determined by the combination of soluble sugars, organic acids, volatile aromatic compounds, and pigments [1,2,3], and is complicated by the variable ripening physiology of its wide-ranging genotype and its crosses, as well as by culturing, environmental, and ecophysiological factors [4]. Since fruit quality is what mainly influences consumer behavior and formulates recurring purchasing habits and brand loyalty, it is of vital importance to understand the regulatory mechanisms of the effects of culturing and processing operations on melon fruit quality development.
In production practices, melon yield is largely dependent on fruit set and development, which are triggered by pollination and subsequent fertilization [5]. In natural conditions, melon flowers are mainly pollinated by insects, but the activity of such insects is inconsistent due to fluctuating weather conditions [6]. Artificial pollination is a traditional method used for melon fruit setting for commercial production; however, the labor cost of this practice is increasingly unaffordable for melon producers [7]. Plant growth regulators can be used as alternatives to artificial pollination to reduce labor costs. The cytokinin-active compound N1-(2-chloro-4-pyridyl)-N3-phenylurea (CPPU), which is known to effectively induce parthenocarpic fruit set and enhance fruit enlargement by stimulating cell division and/or cell expansion [8], is applied in many kinds of fruits, including kiwifruit [9,10], blueberry [11], apples [12], pears [13], cherry [14], grape [15], and melon [16]. Although CPPU can promote the growth of fruit during the early stage, fruit quality might be different from the pollinated fruit during the later stage.
As for melon production, with the fast development of protected cultivation, CPPU has been commonly applied due to its easy operation and high-efficiency parthenocarpic fruit setting, which not only reduces the labor cost of artificial pollination, but also solves problems due to limited or no pollination conditions, such as low temperature or low light in the early spring. As a result, CPPU application is becoming a dominant culturing operation for inducing fruit set and development to ensure melon yield. However, with the increasing prevalence of CPPU application, studies have found that it can influence melon fruit quality traits.
The results regarding CPPU effects on fruit quality are inconsistent in different studies with variable melon cultivars. For example, Hou et al. [17] found that with CPPU application, the contents of sugar and vitamin C in unpollinated muskmelon fruits were significantly lower than those of the control fruit (seeded fruit set by hand pollination), but CPPU application to pollinated fruit significantly increased sucrose content in melons compared with the control. Hayata et al. [16] reported that treatment with CPPU caused a negligible effect on soluble solids (SSs) levels in seeded fruit, but the SSs content was significantly lower in seedless than in seeded fruit. Huang et al. [18] found that the contents of sucrose and amino acids (17 kinds) were lower in parthenocarpic melon induced by CPPU than in fruits resulting from artificial pollination, whereas no significant difference in total SSs content was observed between them. The accumulation of volatile organic compounds (VOCs) is another important factor affecting the organoleptic quality of melons, which plays a key role in determining the perception of products by consumers [19,20,21]. The aroma VOCs vary among different melon varieties. So far, 291 VOCs have been identified from melon fruits [22,23]. In general, despite the large scale of CPPU application in melon production, little is known about the molecular mechanisms of the influence of CPPU treatment on the fruit quality of melon.
One of the most efficient approaches to the identification of genes related to the process of physiological regulation is transcriptomics combined with metabolic analyses after treatment with exogenous elicitors. In this study, fruits resulting from artificial pollination, CPPU treatment, or artificial pollination plus CPPU treatment were analyzed. Headspace solid-phase microextraction (HS-SPME) combined with gas chromatography–mass spectrometry (GC–MS) was applied to identify the VOCs’ composition and content when the melon fruits were harvested after maturation. Transcriptome analysis was performed using high-throughput Illumina sequencing. The aim of this study was to explore the molecular mechanisms underlying the impact of CPPU treatment on the melon quality, with emphasis on VOCs. Our results clarified the previously presented speculation [16,18,24] that CPPU treatment contributes to a general lowering of melon fruit quality.

2. Materials and Methods

2.1. Plant Materials and Treatment for Fruit Set

In this study, the Hami melon cultivar Dongfangmi 3 (Cucumis melo L.) was grown in a greenhouse covered with polyvinyl film at the experimental farm of the Shanghai Academy of Agricultural Sciences located in Minhang district, Shanghai, China. Before plant broadcast, 1000 kg·ha−1 of 15N–15P–15K compound fertilizer was applied to the field. Seedlings with two true leaves were planted 40 cm apart within rows and 120 cm apart between rows. The vines (main shoots) were trained vertically. Two lateral shoots between the 15th and 18th nodes of the vines were cut above the 2nd node and other lateral shoots were removed. Fruits were set on the first nodes of the lateral shoots and two fruits were kept on each plant. The plant materials were divided into five groups. In group one, the ovaries at anthesis were artificially pollinated to let fruit set as a control (P). In the second and third groups, solutions of 10 and 20 mg·L−1 CPPU (Chengdu Shiteyou Chemical Plant Company, Chengdu, China) were sprayed on the ovaries at anthesis to induce parthenocarpic fruit set (C10 and C20). In the fourth and fifth groups, the artificially pollinated ovaries were additionally sprayed with 10 and 20 mg·L−1 CPPU solutions at two hours after pollination (P-C10 and P-C20, respectively). Twenty randomly selected seedlings were included in each treatment group. All the experiments were performed with three biological replicates.

2.2. Analysis of Fruit Quality

The fruits achieved full ripening at about 40 days after anthesis. Subsequently, the ripe fruits were harvested for the following analysis of melon physiological parameters: the number of plump seeds was counted; soluble solid (SS) content was measured with a pocket digital refractometer (N1, Atago, Tokyo, Japan); titratable acids (TA), which are expressed as tartaric acid in grams per 100 g of fresh weight, were determined by titration with 0.1 N NaOH to a final pH of 8.1 using an automatic titration system according to previously described methods [25]. The flesh color of the melon fruits was measured with a colorimeter (Shenzhen 3nh Technology Co. Ltd., Shenzhen, China) and recorded as CIE L*, a*, and b*, which represent lightness, red (+)/green (−), and yellow (+)/blue (−) scale values, respectively.

2.3. Identification of VOCs by GC–MS

The harvested melon fruits were peeled and the seeds were removed. Fruit flesh samples were cut from six randomly selected melons for each treatment group at the equator zone. The resulting samples were subsequently homogenized into pulp juice, which was immediately frozen in liquid nitrogen and stored at −80 °C before analysis. Headspace solid-phase micro-extraction (HP-SPME) was used for isolation and measuring volatiles in the experiment. Briefly, 6 mL of pulp juice was transferred to a 20 mL glass vial. After the addition of 2-octanol internal standard solution (4 μL, 53.84 mg/L), the vial was capped with a poly tetra fluoroethylene septum and an aluminum cap (Chromacol, Hertfordshire, U.K.). The CTC autosampler was operated in the SPME mode with a Divinylbenzene/Carboxen/Polydimethylsiloxane (50/30 µm) fiber. Volatile compounds were equilibrated by agitating the sample (250 rpm) for 15 min at 50 °C and then extracted for 30 min at the same temperature and agitation. After the extraction, the fiber was immediately inserted into the gas chromatography (GC) injection port to desorb volatiles at 260 °C for 3 min.
A 7890B-5977B gas chromatograph–mass spectrometer (GC–MS; Agilent, Santa Clara, CA, USA) was used to detect the composition and relative contents of volatile compounds. GC was performed under the following conditions: chromatographic column, DB-WAX (30 m × 0.25 mm× 0.25 µm); carrier gas, helium (99.999%); chromatographic column, constant flow mode and flow rate 1 mL·min−1; injection at 260 °C, splitless; and oven initial temperature was maintained at 40 °C for 5 min, then increased to 220 °C at 5 °C·min−1, and finally, ramped at 20 °C·min−1 to 250 °C and held for 2.5 min. Mass spectrometry (MS) was performed under the following conditions: connector temperature, 260 °C; ion source at 230 °C; quadrupole at 150 °C; electron ionization (EI); electron energy, 70 eV. The acquisitions were performed in full-scan mode (20–400 m/z). After the raw data were collected, the compounds were identified by the comparison of the mass spectra and retention indices of all the detected compounds in the National Institute of Standards and Technology (NIST) and Wiley libraries [26]. The data processing and multivariate analysis were conducted as previously described by Gao et al. [27].

2.4. RNA Extraction, Library Construction, and RNA Sequencing

The samples for RNA extraction were obtained by cutting the flesh tissues from the equator zone of three randomly selected melons for each group. The samples were immediately frozen in liquid nitrogen, followed by lyophilization for 12 h. The freeze-dried samples were homogenized into a fine powder via shaking thoroughly with glass beads in a Tissuelyser (Shanghai Jingxin Industrial Development Co., Ltd., Shanghai, China). The powdered samples were subsequently subjected to RNA extraction using the RNeasy Plant Mini Kit (QIAGEN, Hilden, Germany) according to the manufacturer’s instructions, and genomic DNA contamination was removed using DNase I digestion (Takara, Dalian, China). The purity of the extracted RNA was evaluated on a NanoPhotometer spectrophotometer (IMPLEN, Westlake Village, CA, USA), and its integrity was assessed using the RNA Nano 6000 Assay Kit of the Bioanalyzer 2100 system (Agilent Technologies, Santa Clara, CA, USA).
A total amount of 1 μg RNA per sample was used as the input material for the RNA sample preparations. Sequencing libraries were generated using the NEBNext® UltraTM RNA Library Prep Kit for Illumina® (NEB, Ipswich, MA, USA) following the manufacturer’s recommendations. mRNA was purified from total RNA using poly-T oligo-attached magnetic beads, and mRNA was fragmented using a fragmentation buffer. The first strand of cDNA was synthesized using random hexamer primer and M-MuLV Reverse Transcriptase (RNase H). Then, buffer, dNTPs, RNase H, and DNA polymerase I were added to the mixture to synthesize the second strand of cDNA. This double-stranded cDNA was then purified and subjected to end repair, the addition of poly-(A) tails, and the ligation of sequence adapters. Fragments of 250~300 bp were selected using AMPure XP beads, and the cDNA library was constructed by PCR-based enrichment.
The library quality was assessed on the Agilent Bioanalyzer 2100 system (Agilent Technologies, Santa Clara, CA, USA), and the library insert size was determined. Subsequent experiments were only performed if the insert size was consistent with expectations. After passing quality tests, the library preparations were sequenced on an Illumina Novaseq platform and 150 bp paired-end reads were generated. Raw data (raw reads) of FASTQ format were firstly processed through in-house PERL scripts. In this step, clean data (clean reads) were obtained by removing reads containing adapters, reads containing poly-N, and low-quality reads from raw data. At the same time, Q20, Q30, and GC content of the clean data were calculated. All the downstream analyses were based on high-quality clean data.

2.5. Mapping of Reads to the Reference Genome and Differential Gene Expression Analysis

Hisat2 v2.0.5 was used for building the index of the CM3.5.1 melon (DHL92) genome (http://cucurbitgenomics.org/organism/3, 15 August 2020) [28] and aligning clean reads to the reference genome rapidly and accurately [29]. DEGseq2 [30] was used to detect the differentially expressed genes (DEGs) and the resulting p-values were adjusted using the Benjamini and Hochberg’s approach for controlling the false discovery rate [31]. Gene Ontology (GO) enrichment analysis of DEGs and the statistical enrichment of DEGs in the Kyoto Encyclopedia of Genes and Genomes (KEGG) pathways were implemented using the clusterProfiler R package. For the GO terms, a corrected p-value < 0.05 was considered significantly enriched by DEGs. The gene expression map viewer (http://melonet-db.dna.affrc.go.jp/ap/top, 30 December 2020), which is based on the genome of the muskmelon cultivar Earl’s favorite Harukei-3 and aims to intuitively analyze the spatiotemporal expression patterns of individual genes, was used to determine the expression levels of the DEGs at various stages of fruit development and maturation.

2.6. Validation of Gene Expression by qRT-PCR

To verify the reliability of the transcriptome data, expression levels obtained by RNA-Seq for twelve selected DEGs were confirmed by a qRT-PCR experiment [32]. Using the PrimeScript RT Master Mix (Takara, Dalian, China), cDNA was synthesized as described in the kit instructions, and real-time fluorescent quantitative PCR was conducted on a CFX96 Touch™ Real-Time PCR Detection System (Bio-rad, Hercules, CA, USA). Actin (LOC100246825) was used as the endogenous control. Gene-specific primer sequences were designed using SnapGene software and are listed in Supplementary Table S1. All reactions and non-template controls were performed in triplicate. Relative transcription levels were calculated using the 2−ΔΔCt method [33].

3. Results

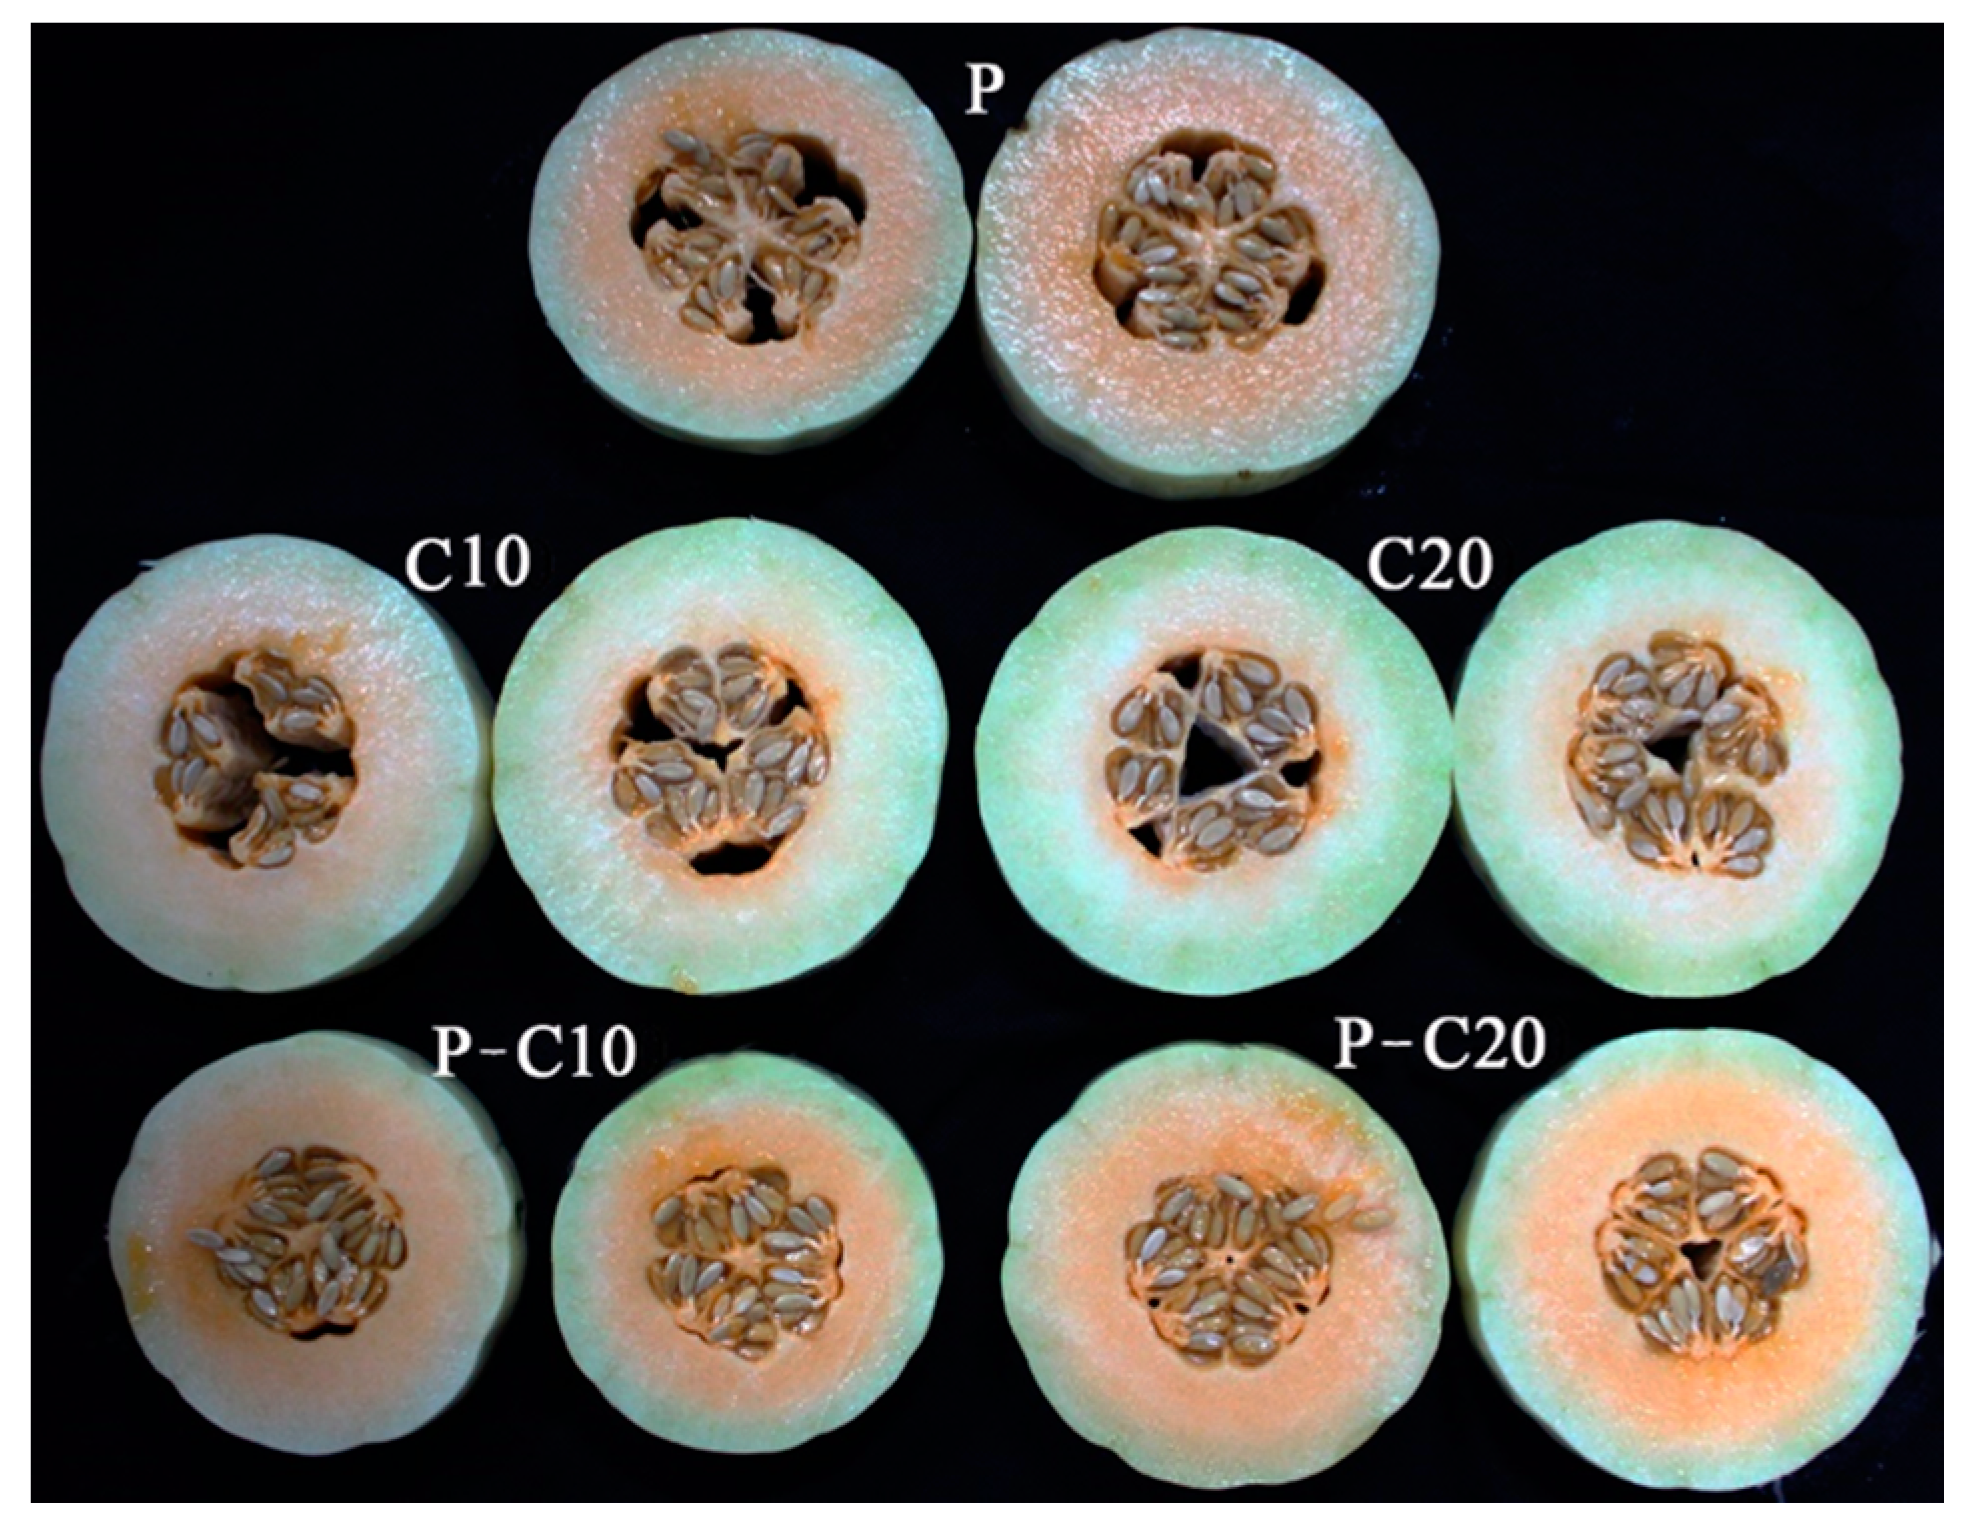
3.1. Effect of CPPU on the Sensorial Qualities of Different Treatments

The fruit induced by CPPU treatment without pollination should result in parthenocarpic fruit; thus, the plump seeds in the fruits of each sample group were counted. The average number of plump seeds in the pollinated melon fruit was 712 (93.07% of the total number). In contrast, seeds in the fruit treated with 10 and 20 mg·L−1 CPPU without pollination were all empty. However, in the fruits induced by 10 and 20 mg·L−1 CPPU treatment supplemented with pollination, the numbers of plump seeds were 516 (67.98%) and 543 (63.88%), respectively (Table 1).
All the treatments had a negligible effect on the SS contents of the center (values ranging from 12.00% to 13.83%) and edge (values ranging from 5.51% to 7.17%) pulp. The parthenocarpic fruits solely induced by CPPU (either 10 or 20 mg·L−1) contained slightly elevated levels of TA and slightly depressed levels of SS/TA in comparison with the seeded fruit induced by pollination; however, CPPU treatment of pollinated ovaries resulted in the fruits containing significantly lower levels of TA and significantly higher levels of SS/TA (Table 1).
The pulp color represents another important melon fruit parameter that is linked to consumer preference. As shown in this study, the seeded melon fruits in the pollination (P) and pollination plus CPPU treatment (P-C10 and P-C20) clearly accumulated orange-colored pigment around the central pulp; by contrast, the flesh of parthenocarpic fruits induced by CPPU (C10 and C20 groups) demonstrated a pale-green to light-orange color (Figure 1). Colorimetric analysis revealed no significant difference among the L* values of the tested groups; however, the a* and b* values of the fruits in the C10 and C20 groups were significantly lower than those for the seeded fruits in the P, P-C10, and P-C20 groups, suggesting that fruit parthenocarpy may impair the accumulation of orange-to-red pigments in maturing melons.

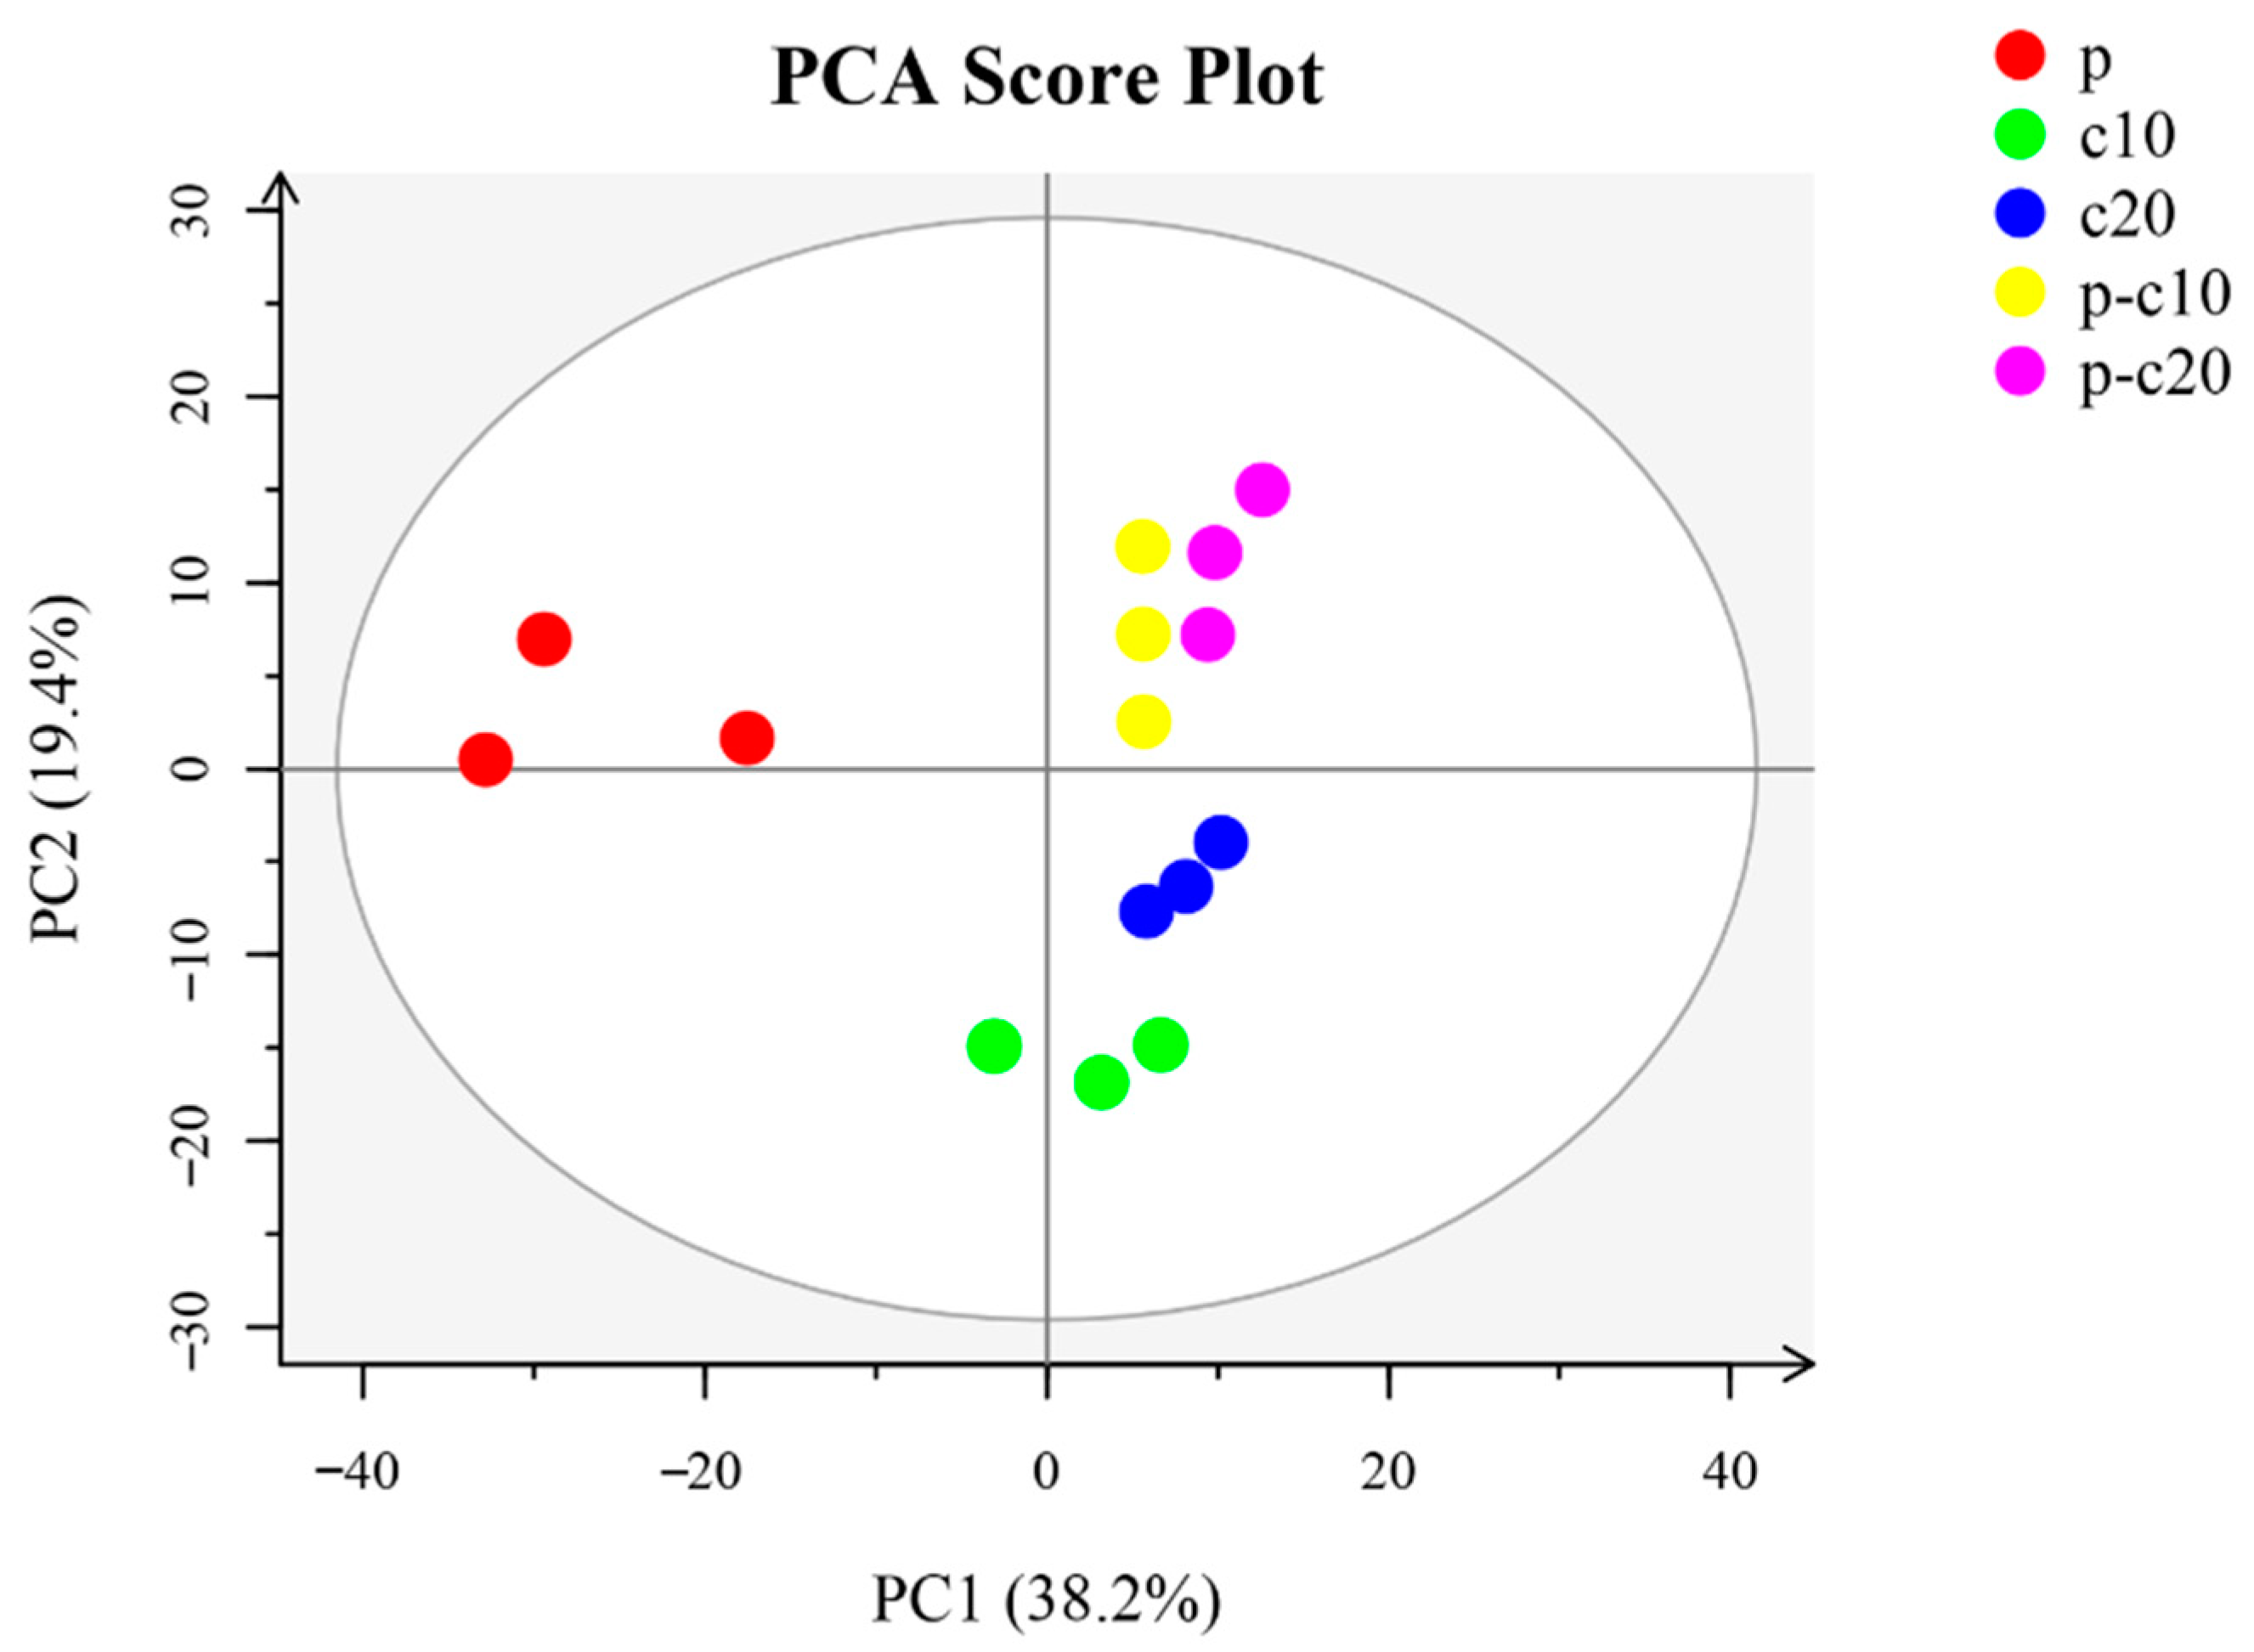
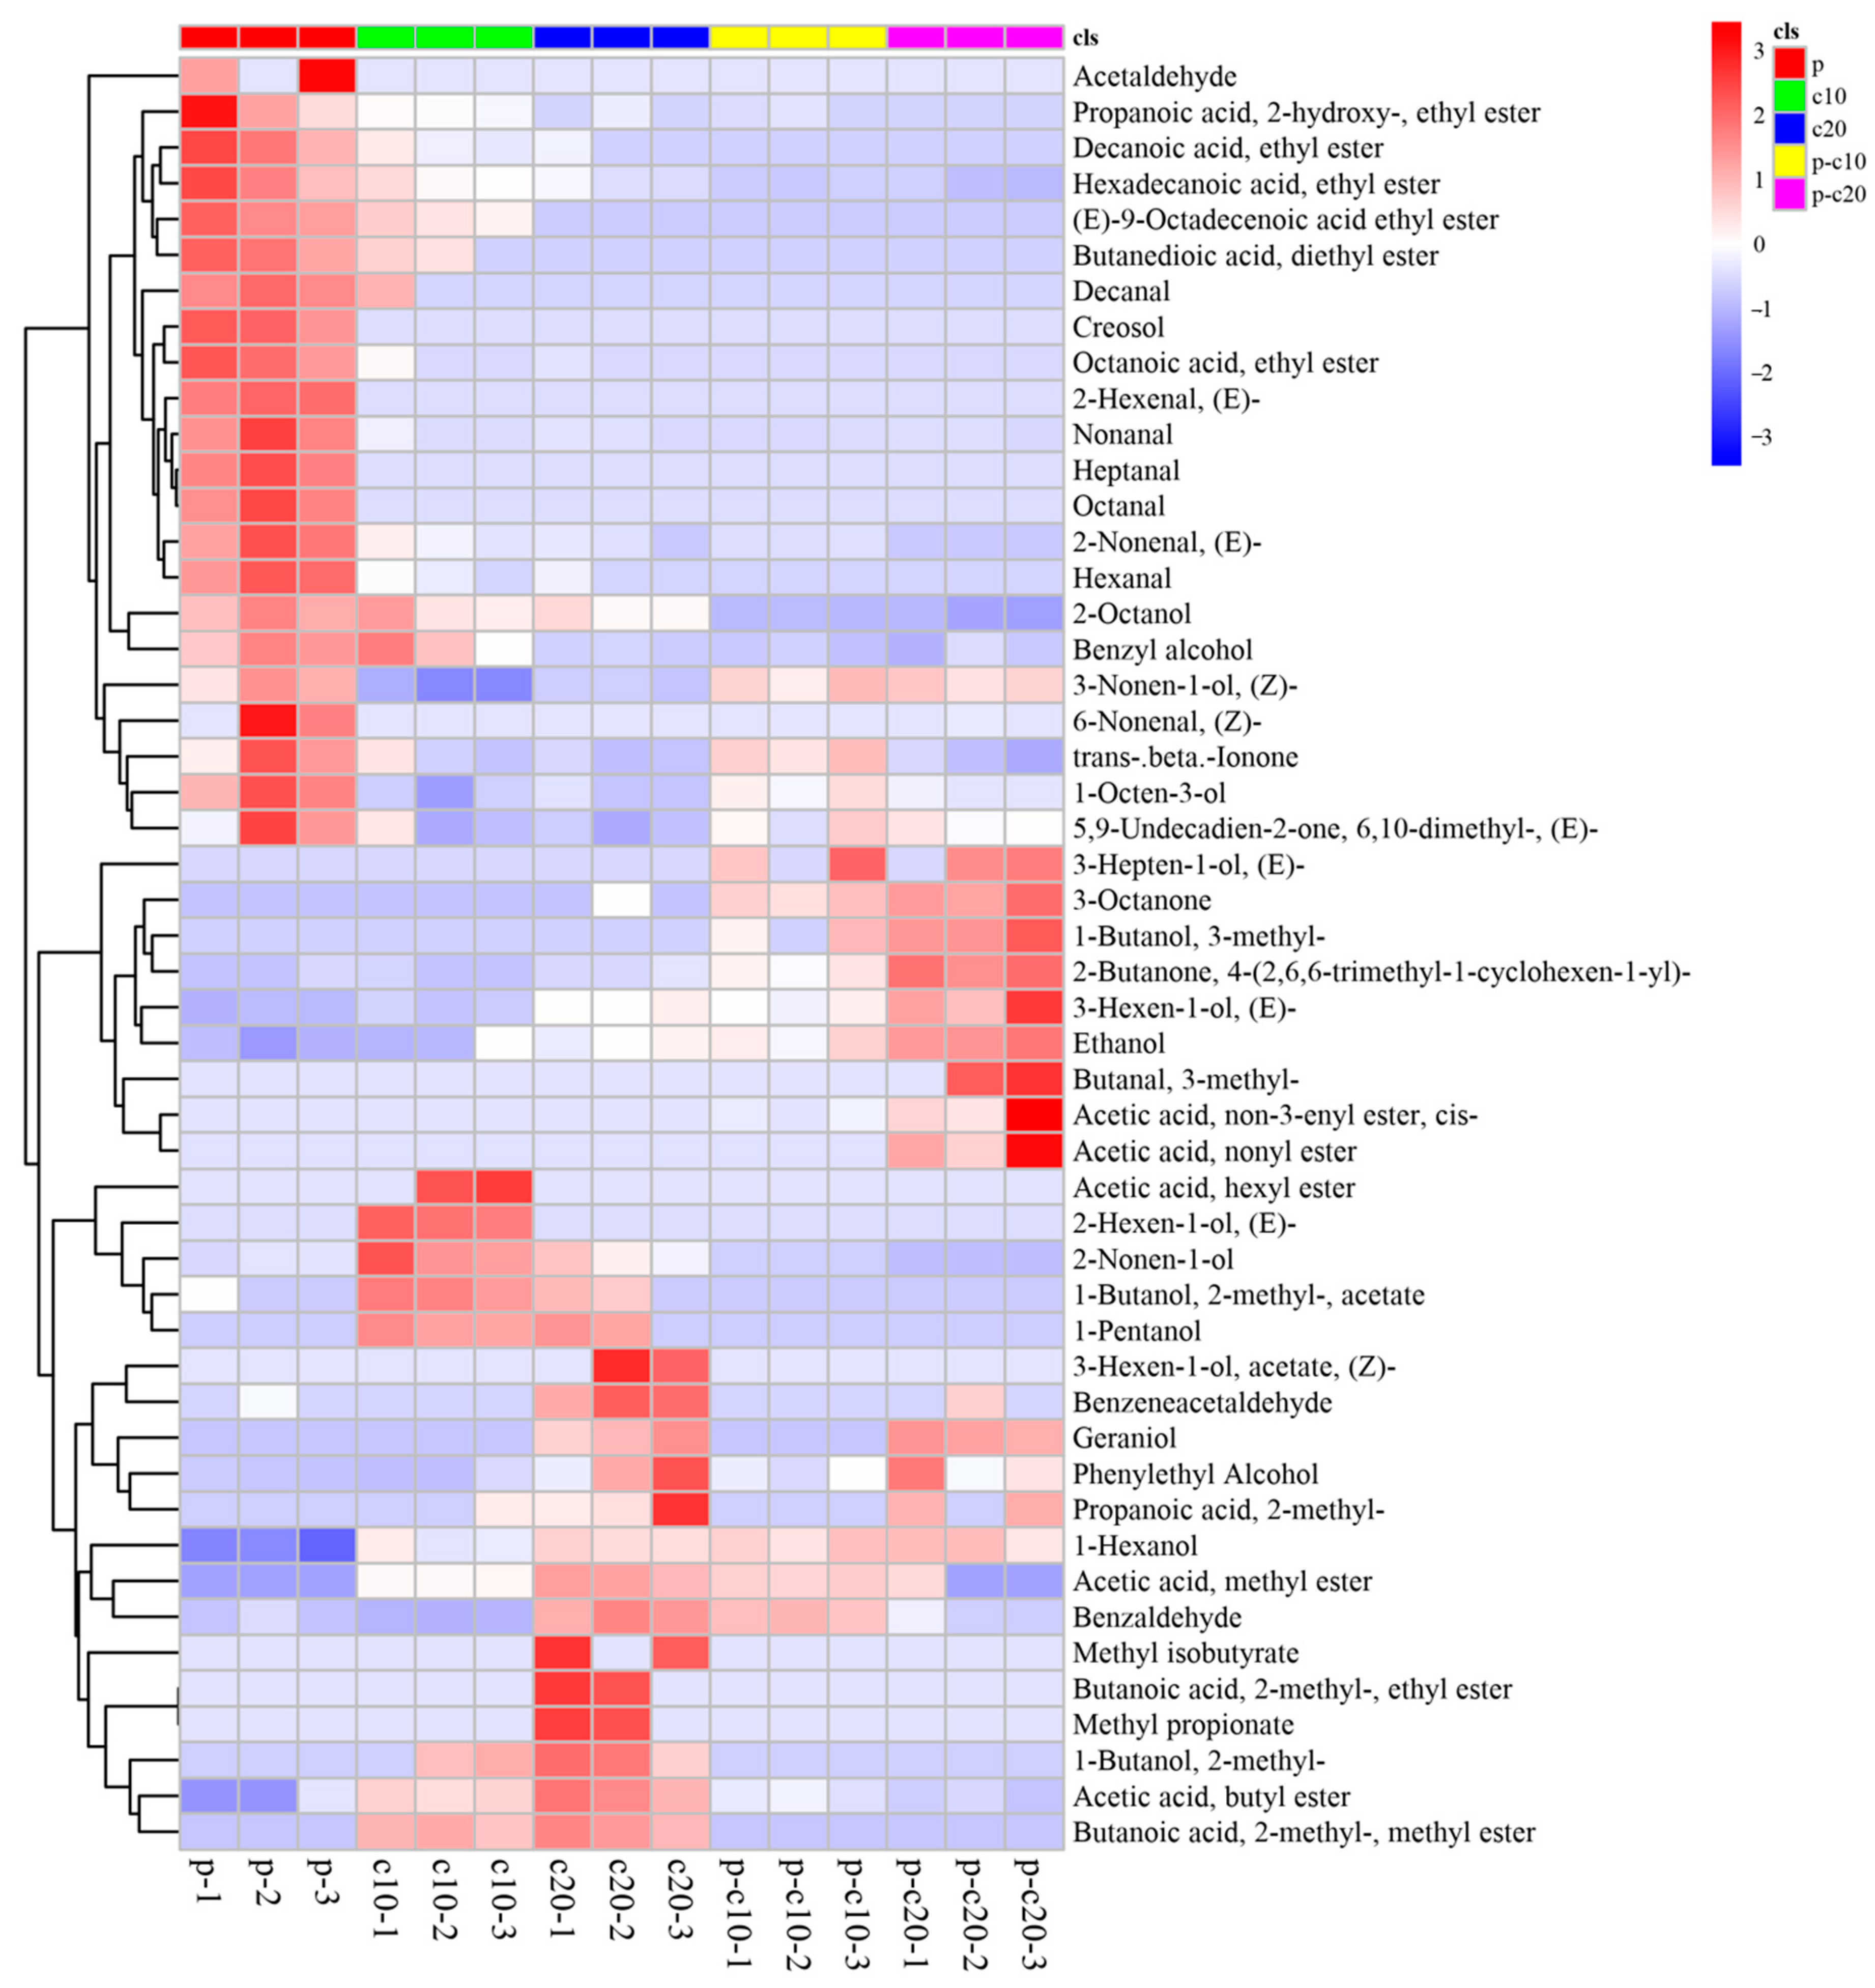
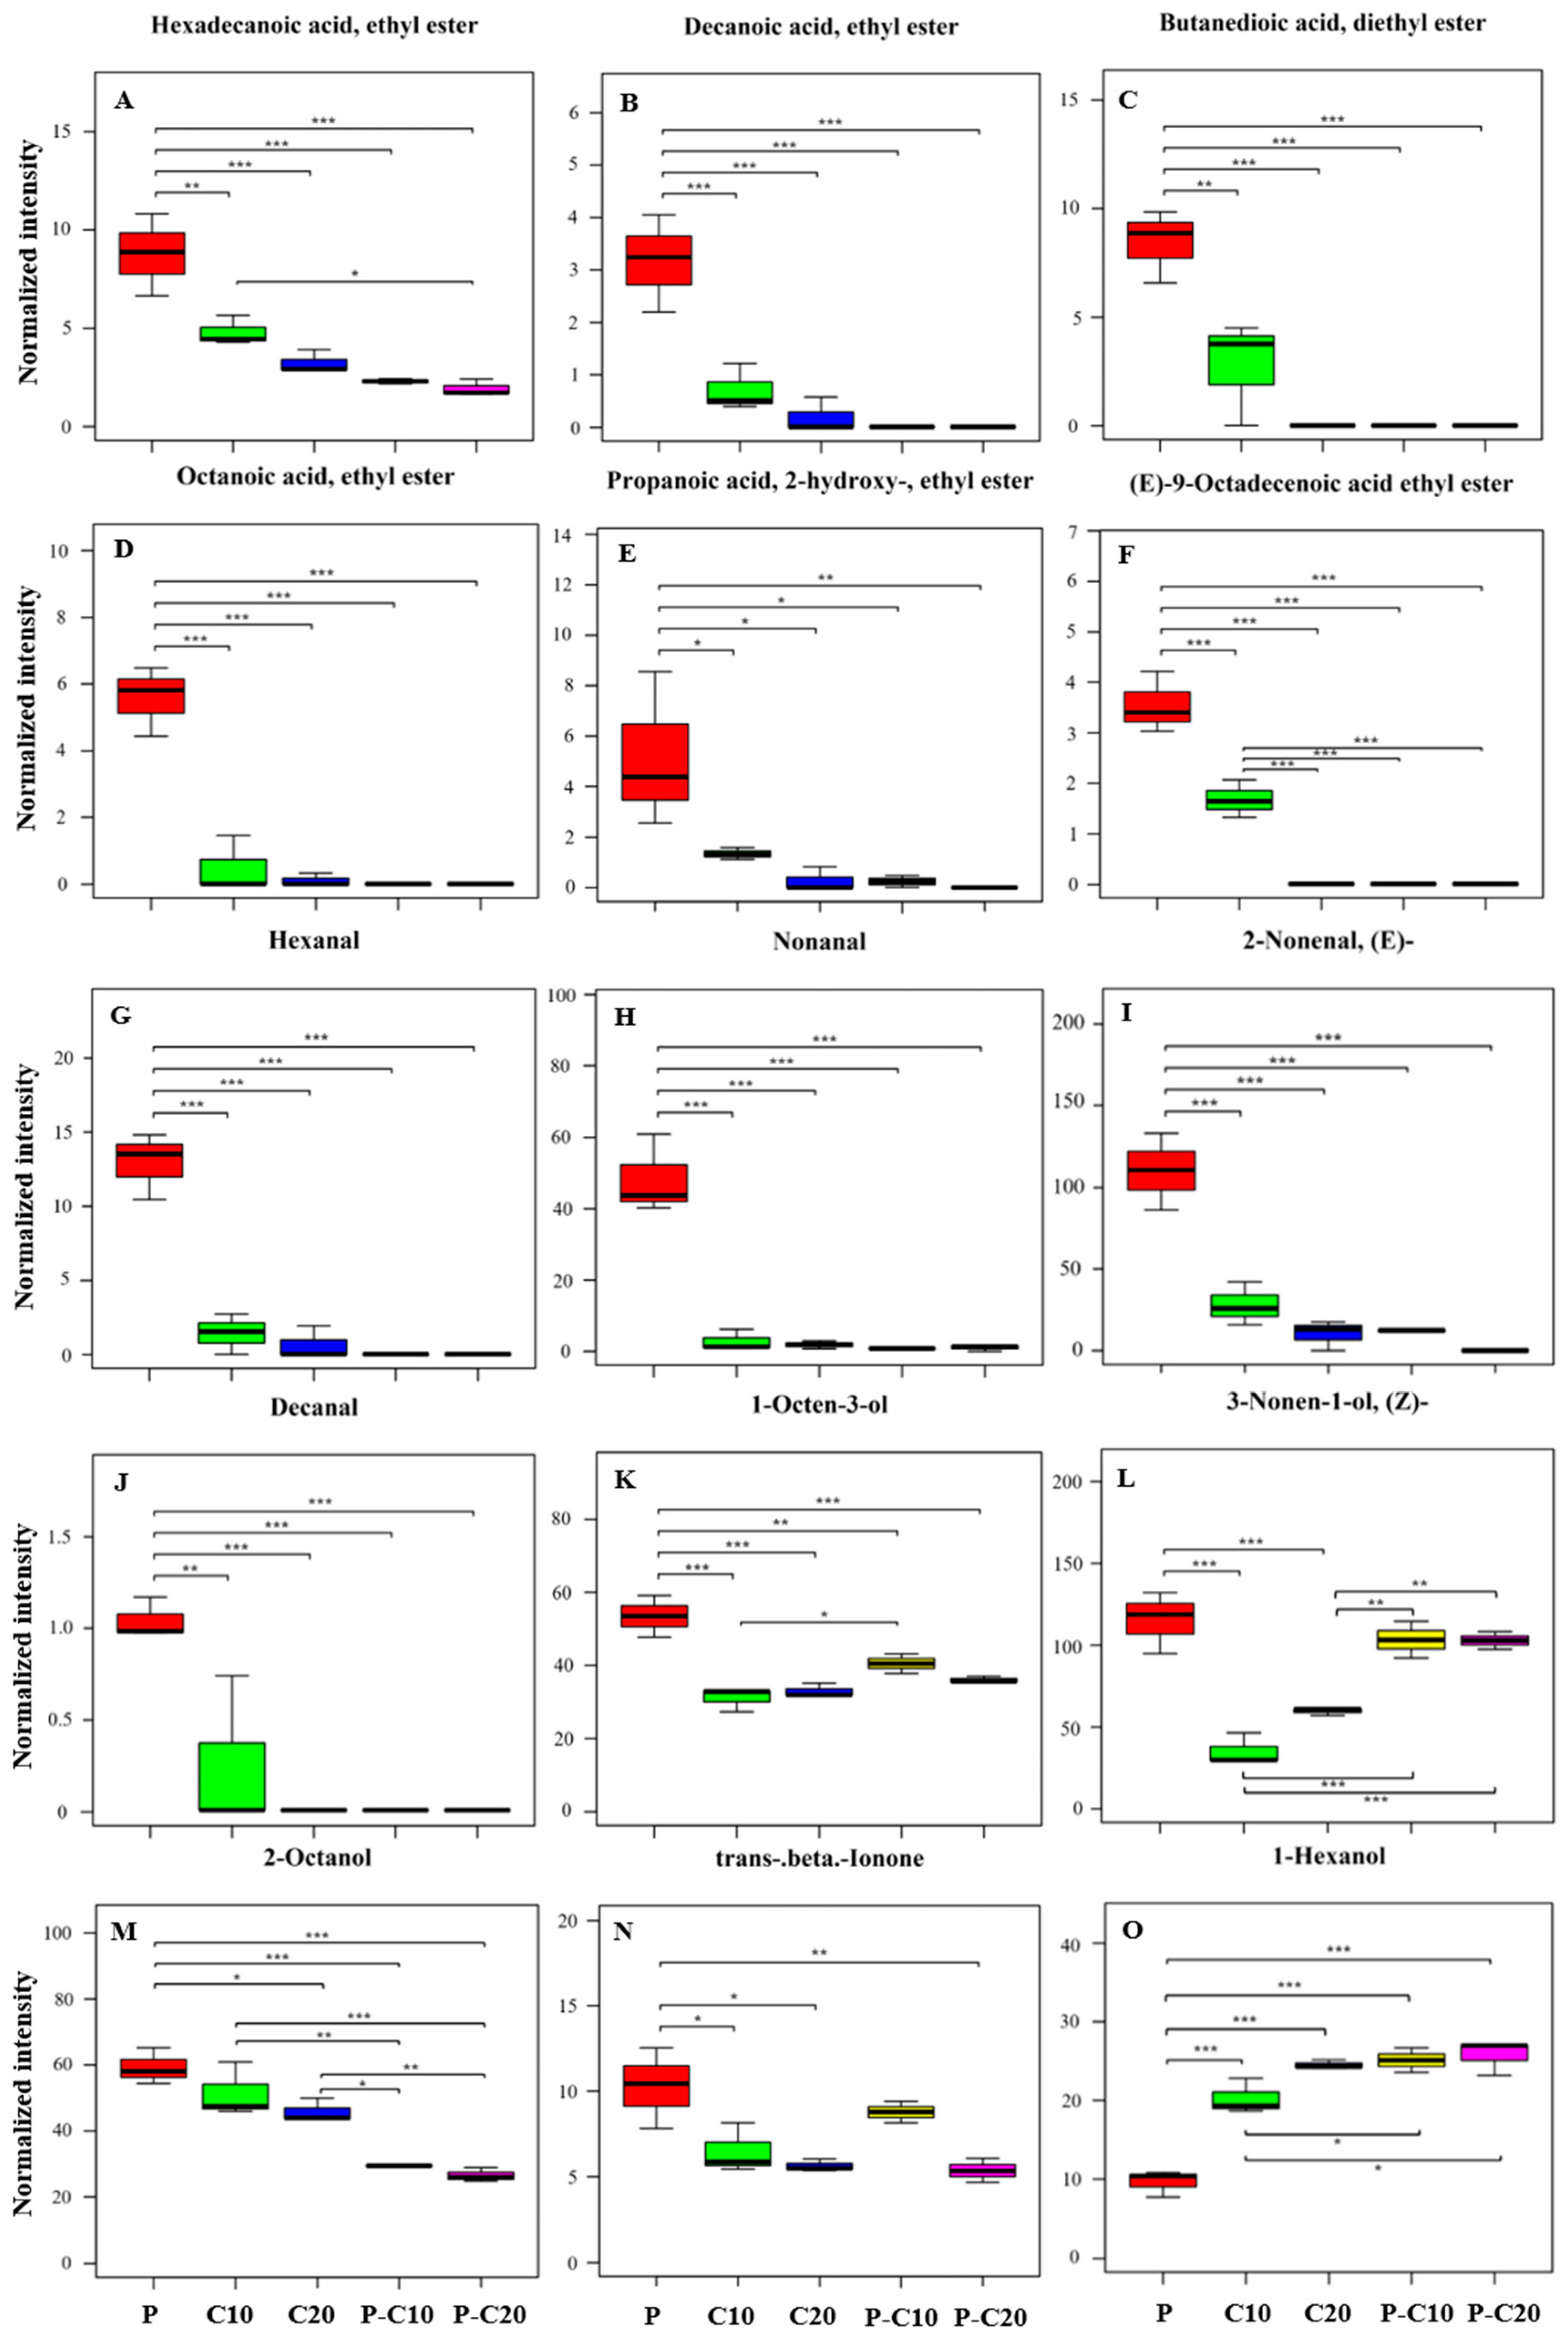
3.2. CPPU Treatment of Ovaries Influences VOCs of Mature Melon Fruits

Volatiles are recognized as one of the most important traits determining the fruit quality level and strongly influence consumer preferences. A total of 98 VOCs were identified. The type and quantity of VOCs were detected by GC–MS in different treatments. As shown in Table 2, a total of 67 VOCs were identified in the P group fruits, including 12 aldehydes, 18 alcohols, 6 alkanes, 10 esters, 2 terpenes, 2 acids, 9 ketones, and 8 others. The number of VOCs emitted by the melon fruits of C20 was the highest, whereas that emitted by the P-C10 melon fruits was the lowest. Compared with the P group, the numbers of aldehydes and alcohols were decreased and slightly increased, respectively, due to CPPU treatment. The ester numbers in C10 and C20 fruits increased too. However, the P-C10 and P-C20 fruits showed reduced ester numbers to five and six, respectively.
Principal component analysis (PCA) was applied to view the metabolomics data and reveal intrinsic treatment-related clusters. As shown in Figure 2, the data of three replicates for each treatment were clustered tightly together in the PCA score plot, being indicative of good reproducibility and reliability. The control samples (P) were obviously separated from the four CPPU-treated groups in the PCA score plot. In addition, the score plot of the PCA showed that the C10 and C20 samples were clustered tightly together, but they were differentiated from P-C10 and P-C20, indicating that fruit setting by CPPU treatment could significantly influence the volatile constituents of the resulting fruits.
The CPPU treatments changed not only the volatile compositions but also the relative contents of some VOCs in comparison with the P group. The main compounds that were obviously altered are shown in the heatmap in Figure 3. Compared with the fruits of the P group, six VOCs were not detected in all the CPPU-treated fruits: acetaldehyde, (E)-2-hexenal, octanal, (Z)-6-nonenal, heptanal, and creosol. The results also demonstrated that the CPPU-treated fruits emitted some unique VOCs: for instance, acetic acid hexyl ester, and (E)-2-hexen-1-ol were only detected in the C10 fruits; and (Z)-3-hexen-1-ol acetate, methyl propionate, methyl isobutyrate, and 2-methyl-butanoic acid ethyl ester were only detected in the C20 groups. The P-C20 fruits emitted two unique VOCs (acetic acid nonyl ester and 3-methyl-butanal). The relative abundances of six VOCs derived from C10 and C20 were significantly higher than those in the other treatments and the control. The relative abundances of seven VOCs detected in the P-C10 and P-C20 groups increased in comparison with the other treatments and the control.
The relative abundances of 14 VOCs emitted by the CPPU-treated fruits clearly declined compared to non-CPPU-treated fruits, including six ethyl esters ((E)-9-octadecenoic acid ethyl ester; butanedioic acid diethyl ester; decanoic acid ethyl ester; hexadecanoic acid ethyl ester; octanoic acid ethyl ester; and propanoic acid, 2-hydroxy-, ethyl ester; Figure 4A–F), four aldehydes (hexanal, nonanal, decanal, and (E)-2-nonenal; Figure 4G–J), three alcohols (2-octanol, 1-octen-3-ol, and (Z)-3-nonen-1-ol; Figure 4K–M), and one ketone (trans beta ionone; Figure 4N). Among them, the relative abundance of (Z)-3-nonen-1-ol in the P, P-C10, and P-C20 fruits was significantly higher than that in the C10 and C20 fruits. By contrast, the relative abundance of 1-hexanol was on average higher in all the CPPU-treated fruits than in the P group. (Figure 4O).

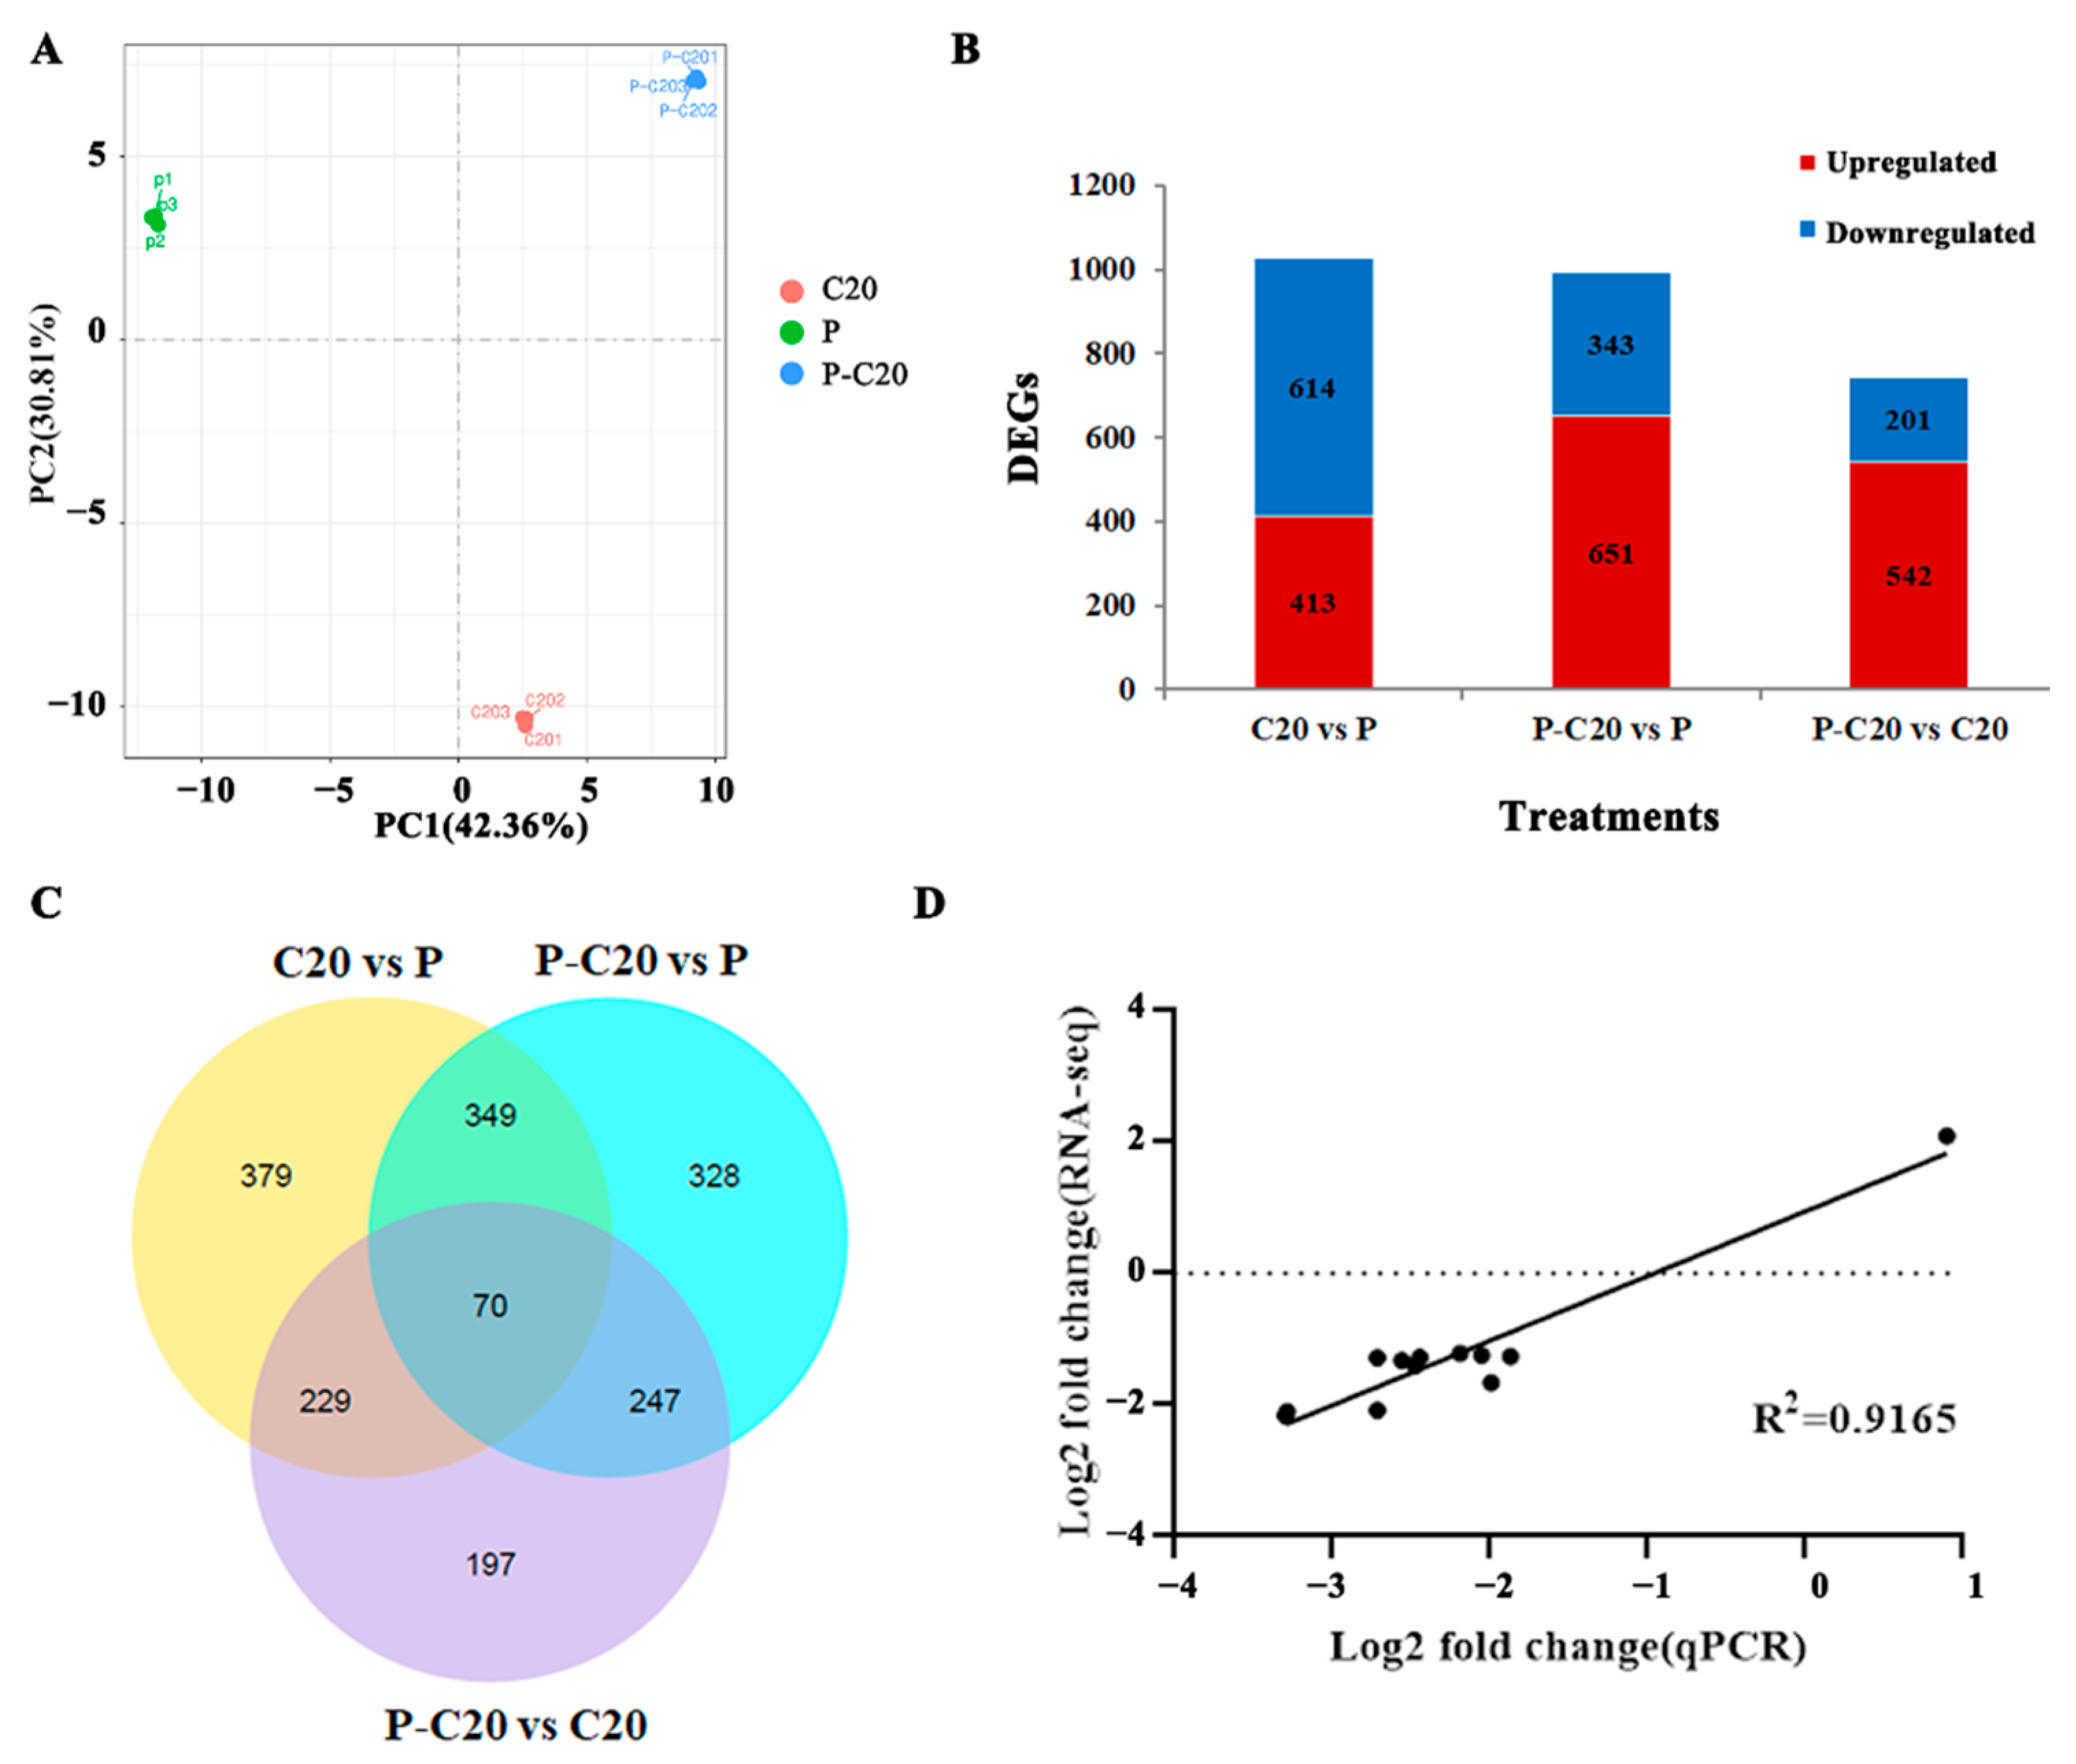
3.3. DEG Analysis between Different Treatments

In order to obtain global gene expression profile information about the effect of CPPU treatment on the quality development of melon fruit at harvest, RNA-Seq analysis was conducted in pulp tissues of three groups of fruit samples: the seeded fruits set by hand pollination (P), parthenocarpic fruits induced by 20 mg·L−1 CPPU (C20), and the seeded fruits with CPPU treatment (P-C20). Using the Illumina HiSeq sequencing platform, a total of 63.44 Gb of paired-end short read data (after quality control and removal of microbial contamination reads) were obtained. The CM3.5.1 melon genome information [27] was used as a reference, and the sequencing reads were mapped to the reference at an average rate of 90.3% (Table 3). Of the 27,427 annotated genes, 22,739 genes exhibited fragments per kilobase of transcript per million fragments sequenced (FPKM) > 1 for at least one sample group. When the expression dataset of 2764 genes was subjected to principal component analysis (PCA), the three sample groups were evidently distinguished on the PCA plot (Figure 5A), indicating that CPPU treatment caused transcript changes at the global level.
DEGSeq2 software identified 743 to 1027 DEGs (p < 0.05 and fold change > 1) among the three different libraries (P, C20, and P-C20). The greatest numbers of DEGs (614 down- and 413 upregulated genes) were found between C20 and P. A total of 651 up- and 343 downregulated DEGs were identified between the P-C20 and P libraries. Lastly, 542 up- and 201 downregulated DEGs were obtained between the P-C20 and C20 libraries (Figure 5B). Only a small number of common genes (70) was found among the three treatments (Figure 5C). The reliability of the RNA-Seq analysis was confirmed by a qRT-PCR assay with twelve randomly selected DEGs; the qRT-PCR analysis showed high consistency with the DEG data resulting from the RNA-Seq assay (Figure S1), and a strong correlation (R2 = 0.9165) was observed between the results obtained with the two techniques (Figure 5D).

3.4. GO Enrichment and KEGG Pathway Analysis of DEGs

To analyze the major biological functions of the DEGs, Gene Ontology (GO) enrichment analysis was performed using a threshold p-value of <0.05. Based on this analysis, all genes were grouped into three major GO categories: biological process (BP), molecular function (MF), and cellular component (CC). As shown in Table 4, within cellular components, the DEGs in C20 vs. P and P-C20 vs. P shared common enrichment in proteasome complex, endopeptidase complex, proteasome core complex, 1,3-beta-D-glucan synthase complex, cytoplasmic vesicle part, and coated membrane. In C20 vs. P, the DEGs were also enriched in membrane protein complex, organelle membrane, proton-transporting two-sector ATPase complex, and protein heterodimerization activity. Within the P-C20 vs. P dataset, the DEGs were additionally enriched in the cellular carbohydrate metabolic process and Golgi apparatus. However, different from the C20 vs. P and P-C20 vs. P datasets, the DEGs of P-C20 vs. C20 were only enriched in protein heterodimerization activity and oxidoreductase activity, acting on the CH-OH group of donors, with NAD or NADP as the acceptor. These results suggest that CPPU treatment on flowering ovaries mainly caused significant changes in the cellular component in mature melon fruit, and these effects were not likely dependent on the presence of seed development.
As various genes are coordinated to perform their different biological functions, pathway analysis of the DEGs was conducted to understand the biological functions of the DEGs associated with melon fruit quality. Based on the KEGG database, the DEGs in C20 vs. P were allocated to 114 pathways (Table 5). The majority of DEGs fell into five main pathways: carbon metabolism, glycolysis/gluconeogenesis, proteasome, citrate cycle, and carbon fixation in photosynthetic organisms. In P-C20 vs. C20, the DEGs were annotated and were most enriched in the biosynthesis of amino acids; carbon fixation in photosynthetic organisms; valine, leucine, and isoleucine degradation; fatty acid metabolism, and carbon metabolism. Additionally, the DEGs in the P-C20 vs. P comparison were mainly enriched in beta-alanine metabolism, carbon metabolism, endocytosis, valine, leucine and isoleucine degradation, and proteasome. Notably, several pathways that could be associated with aroma volatiles in melon, such as the biosynthesis of amino acids, fatty acid metabolism, carotenoid biosynthesis, terpenoid backbone biosynthesis, and alpha-linolenic acid metabolism, were also found in the enrichment of the C20 vs. P, P-C20 vs. C20, and P-C20 vs. P datasets. It is plausible that these enriched DEGs may represent genes that are relevant to the alteration of quality and volatiles in melon that occur in response to CPPU treatment.

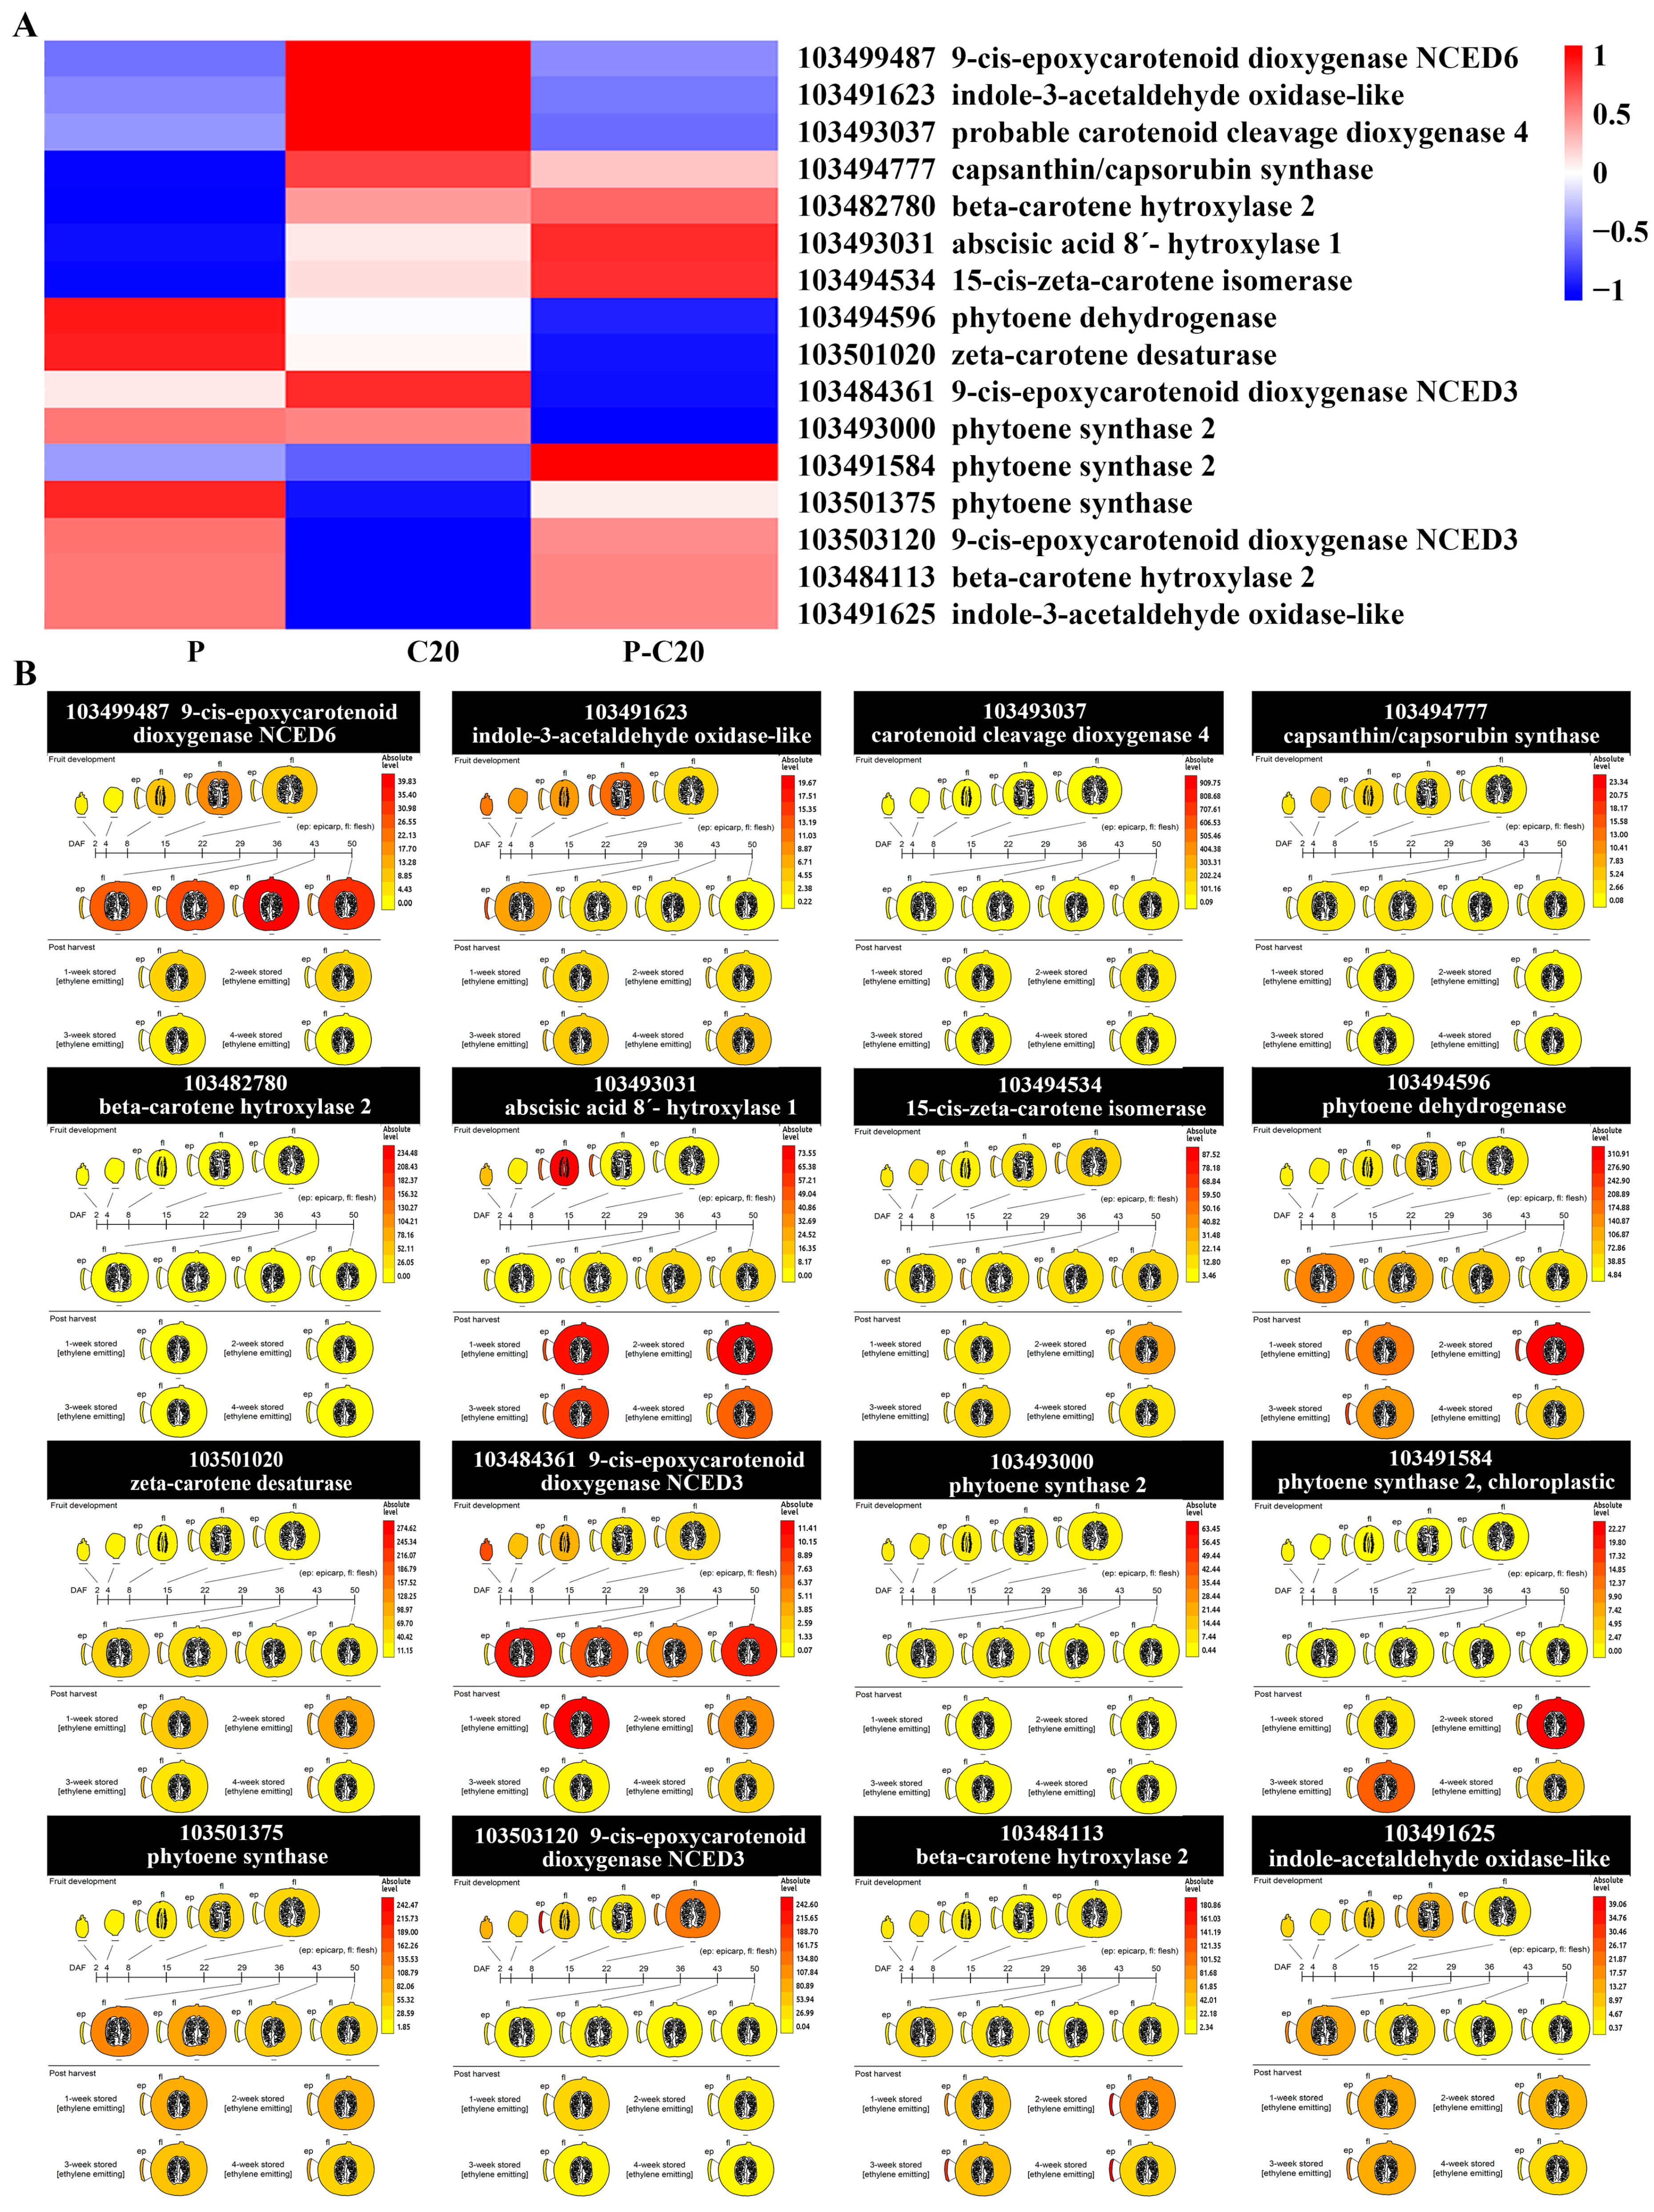
3.5. Expression Pattern of DEGs Involved in Carotenoid Biosynthesis Pathways

Since the sensorial quality parameters significantly altered by CPPU treatment included the accumulation of carotenoid-like pigment, the expression pattern of DEGs that were potentially associated with biosynthesis of these compounds were analyzed in detail. As shown in Figure 6A, the DEGs related to carotenoid synthesis, such as indole-3-acetaldehyde oxidase-like (ID: 103491625), beta-carotene hydroxylase 2 (ID: 103484113), phytoene synthase (ID: 103501375), and phytoene synthase 2 (ID: 103491584), were downregulated in the C20 group on average in comparison with the P and P-C20 groups. Additionally, some of the genes in this cluster were upregulated during melon fruit development maturation stages, as analyzed using the Melonet-DB tool based on the RNA-Seq data of the Earl’s favorite Harukei-3 melon cultivar (Figure 6B).
In contrast, another cluster of several carotenoid catabolism-related genes, including 9-cis-epoxycarotenoid dioxygenase NCED6 (ID: 103499487), indole-3-acetaldehyde oxidase-like (ID: 103491623), and probable carotenoid cleavage dioxygenase 4 (ID: 103493037), were highly expressed in the melon fruit of the C20 group, but their expression levels were relatively lower in the P and P-C20 groups (Figure 6A). In the Melonet-DB analysis, these C20-induced genes are not highly expressed during fruit development or maturation of the Earl’s favorite Harukei-3 melon cultivar, with the exception that the 9-cis-epoxycarotenoid dioxygenase NCED6 gene is abundantly expressed 29 to 50 days after flowering (Figure 6B). There were clusters of carotenoid metabolism-related DEGs that showed expression patterns including downregulation in the P group but upregulation in the C20 and P-C20 groups (ID: 103494777, 103482780, 103493031, and 103494534); upregulation in the P and C20 groups but downregulation in the P-C20 group (ID: 103494596, 103501020, 103484361, and 103493000). These data generally suggest that the defects in the flesh pigment of the seedless parthenocarpic fruit induced by CPPU in comparison with the seeded fruits caused by pollination could be partially due to the altered expression levels of the genes involved in carotenoid metabolism.

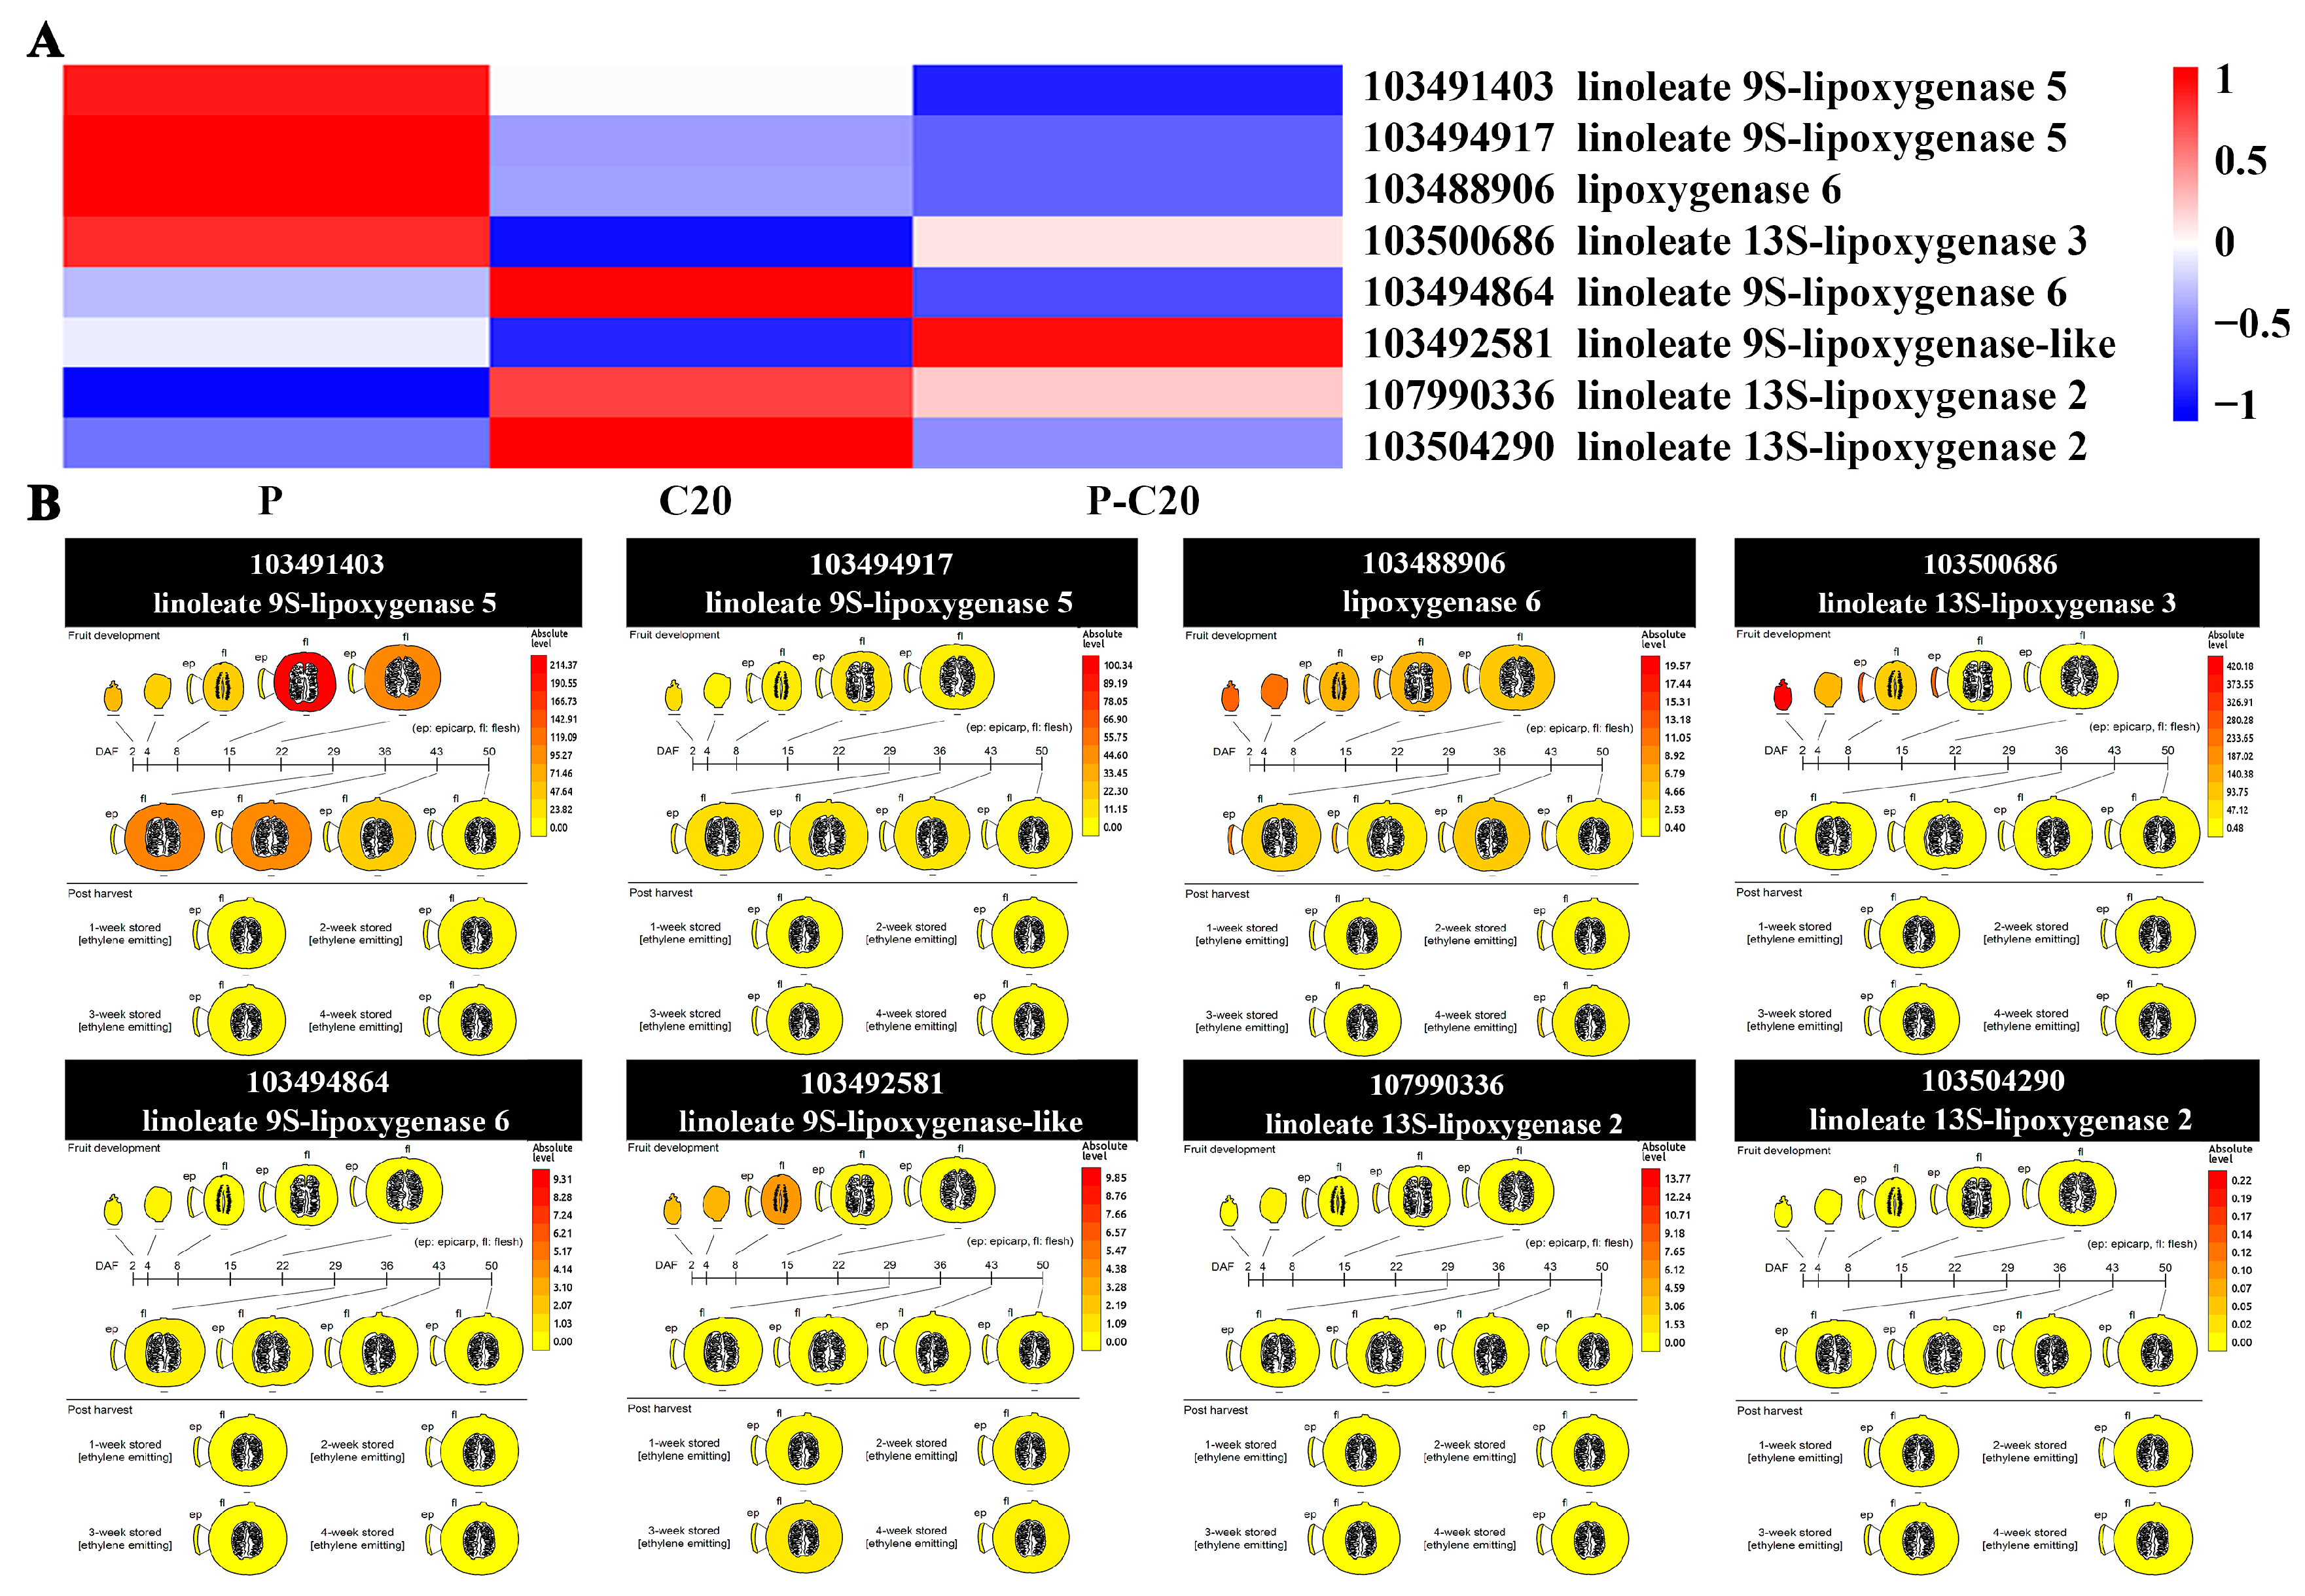
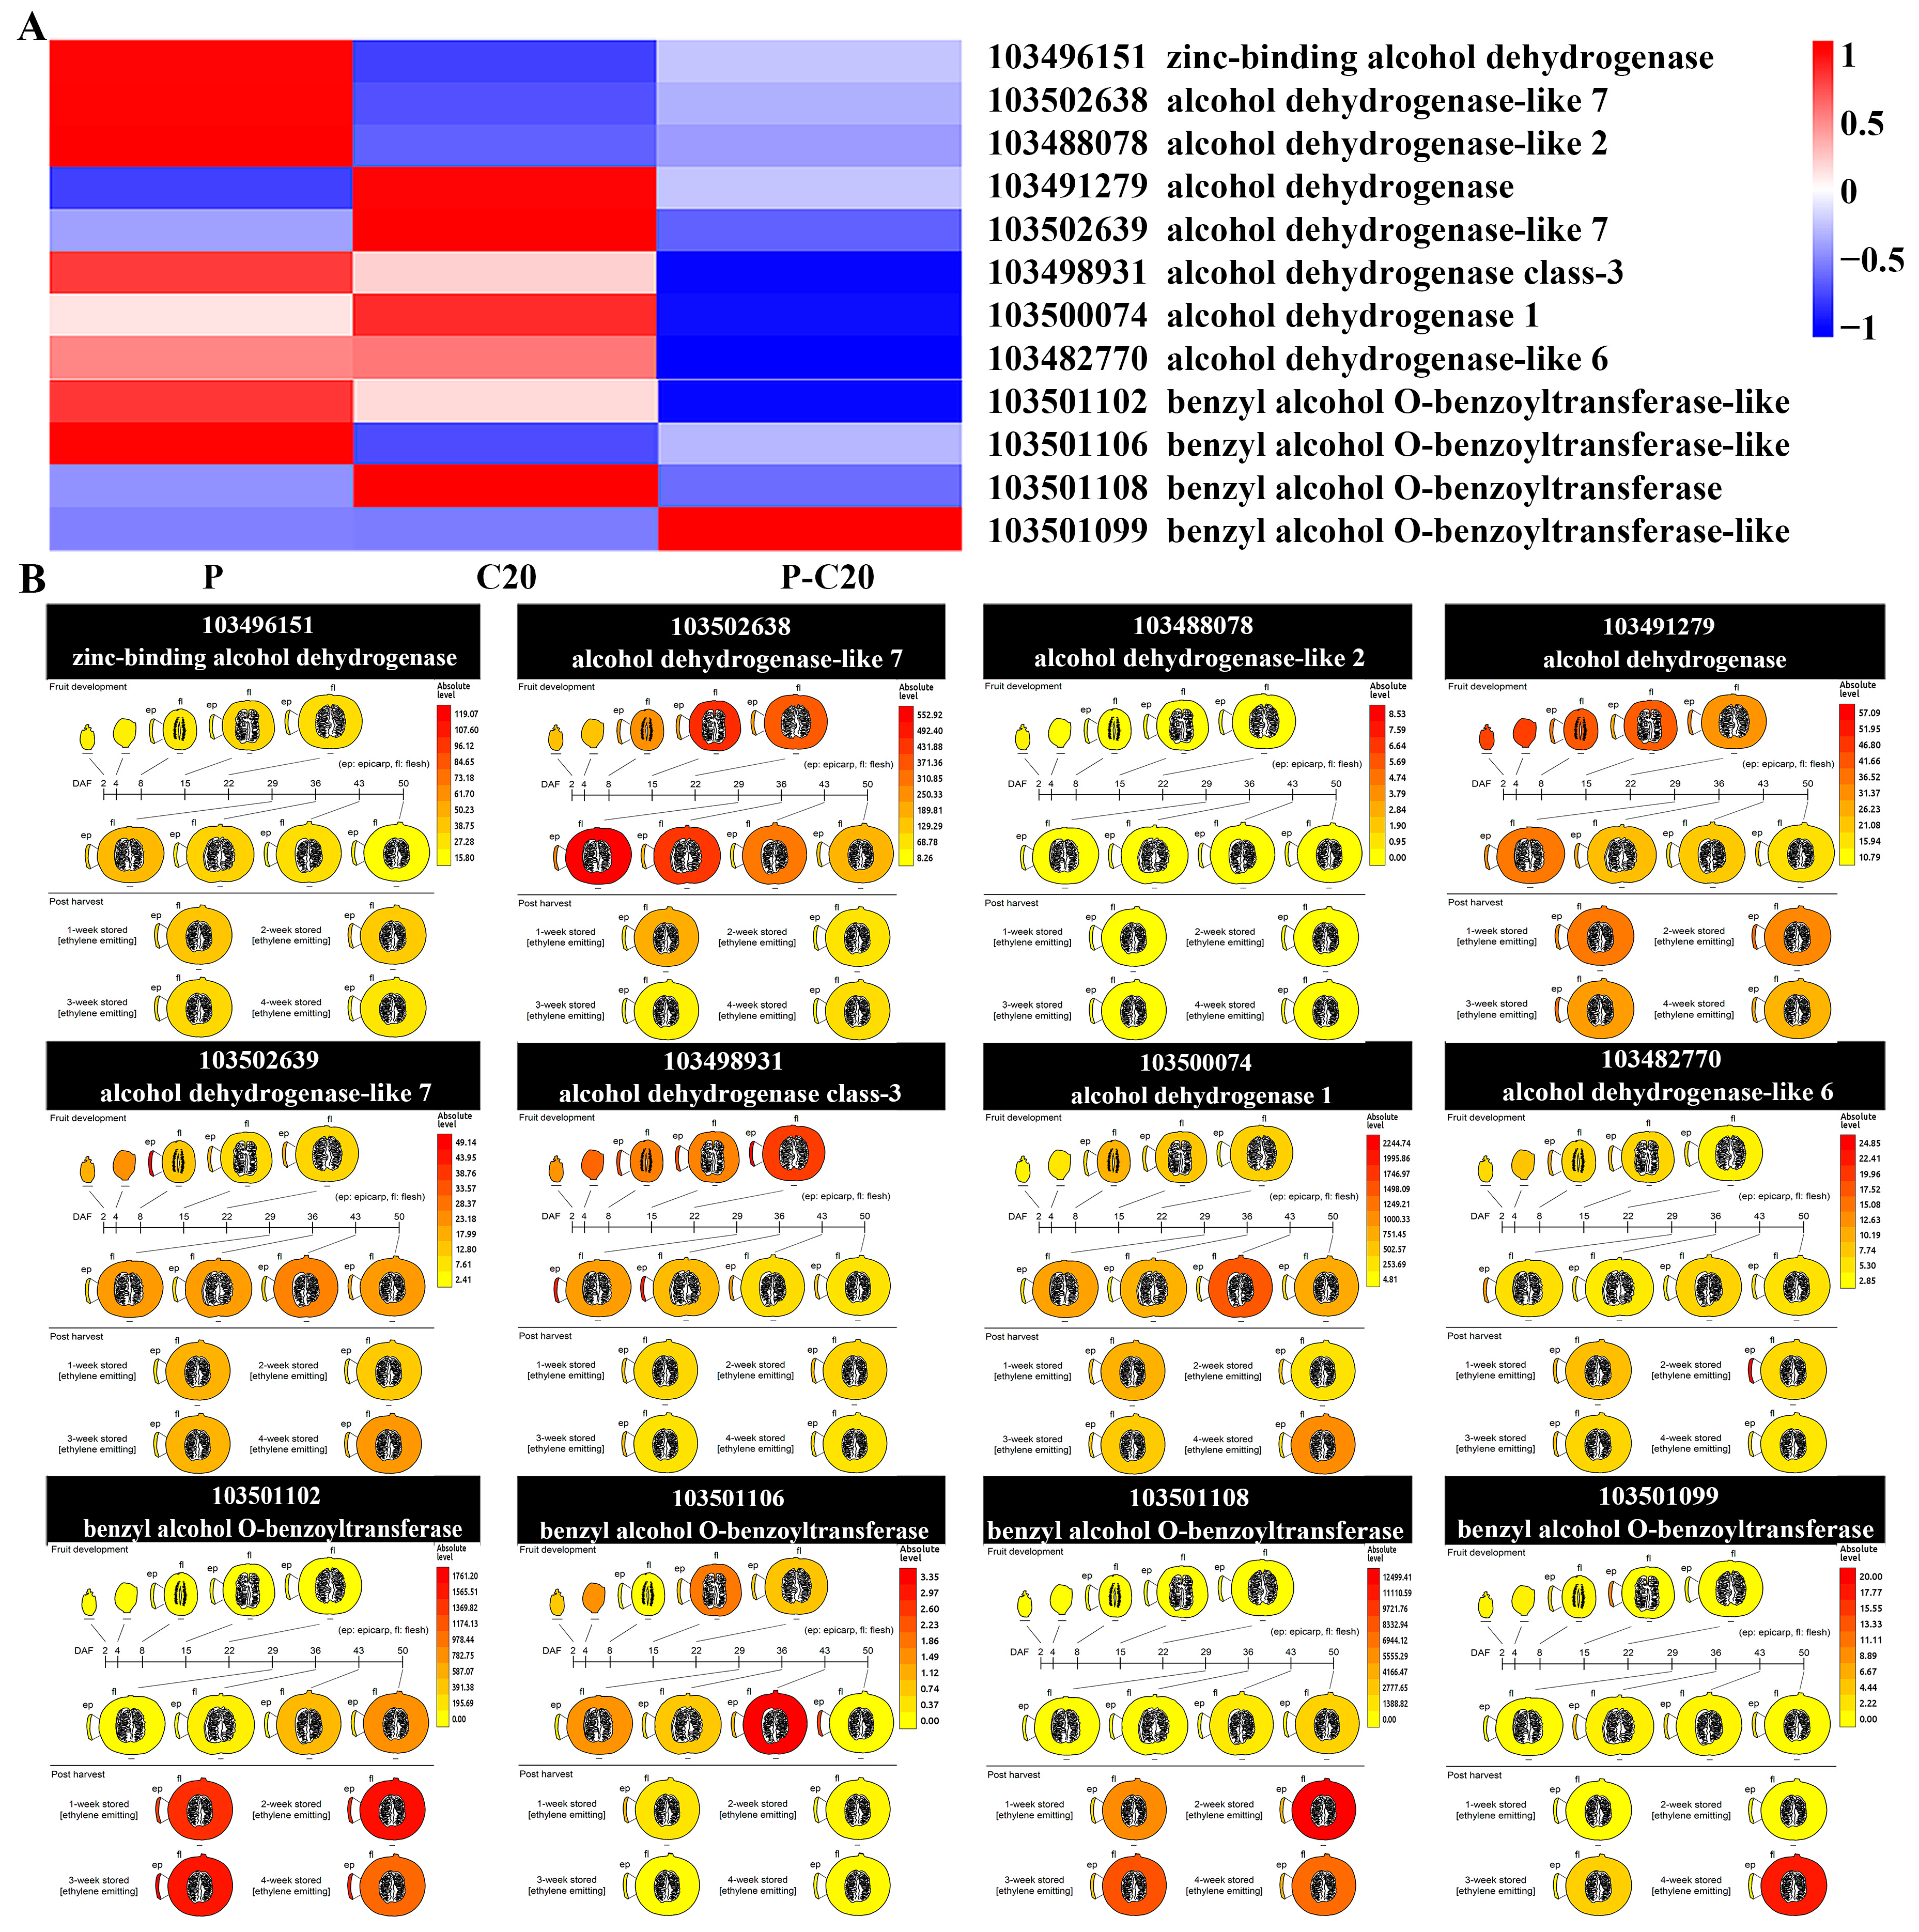
3.6. Expression Pattern of DEGs Involved in Fatty Acid Metabolism Pathways

Fatty acid metabolism is one of the main pathways for the synthesis of aroma volatiles in most fruits, and lipoxygenase (LOX), alcohol dehydrogenase (ADH), and alcohol acyltransferase (AAT) are regarded as the primary enzymes in this process [34,35]. To illustrate the link between volatile compounds and related genes, we analyzed the DEGs related to the crucial enzymes (LOX, ADH, and AAT) in detail. As shown in Figure 7A, the DEGs related to LOX in the fatty acid metabolism pathway such as linoleate 9S-lipoxygenase 5 (103491403 and 103494917), lipoxygenase 6 (103488906), and linoleate 13S-lipoxygenase 3 (103500686) were upregulated in the P group compared with the C20 and P-C20 groups. Linoleate 9S-lipoxygenase 6 (103494864), and linoleate 13S-lipoxygenase 2 (107990336 and 103504290) were upregulated in the C20 group compared with the P and P-C20 groups. Linoleate 9S-lipoxygenase-like (103492581) was upregulated in the P-C20 group compared with the other two groups. In the Melonet-DB analysis, the LOX genes (103491403, 103494917, and 103488906), being upregulated in the P group, are highly expressed during fruit development and maturity of Earl’s favorite Harukei-3 melon cultivar, except gene 103500686. However, those LOX genes induced by C20 or P-C20 groups were not highly expressed during fruit development and maturity (103494864, 103492581, 107990336, and 103504290; Figure 7B).
As shown in Figure 8A, the DEGs related to ADH in the fatty acid metabolism pathway, such as zinc-binding alcohol dehydrogenase (103496151), alcohol dehydrogenase-like 7 (103502638), and alcohol dehydrogenase-like 2 (103488078), were highly upregulated in the P group compared with the C20 and P-C20 groups. Alcohol dehydrogenase (103491279) and alcohol dehydrogenase-like 7 (103502639) were upregulated in the C20 group, but their expression levels were relatively lower in the P and P-C20 groups. Moreover, alcohol dehydrogenase class-3 (103498931), alcohol dehydrogenase 1 (103500074), and alcohol dehydrogenase-like 6 (103482770) were highly expressed in the melon fruit of the P and C20 groups, but downregulated in the P-C20 group. In the Melonet-DB analysis, all the induced ADH-related genes are highly expressed during fruit development or maturation of the Earl’s favorite Harukei-3 melon cultivar, with the exception of the alcohol dehydrogenase-like 2 (103488078) gene (Figure 8B).
From Figure 8A, the ATT-related DEGs in the fatty acid metabolism pathway were up- or downregulated in different groups: benzyl alcohol O-benzoyltransferase-like (10351106), benzyl alcohol O-benzoyltransferase (103501108), and benzyl alcohol O-benzoyltransferase-like (103501099) were highly upregulated in the P, C20, and P-C20 groups, respectively. In addition, benzyl alcohol O-benzoyltransferase (103501102) was downregulated in the P-C20 group, but its expression levels were relatively higher in the P and C20 groups. In the Melonet-DB analysis, except for benzyl alcohol O-benzoyltransferase-like (103501099), the other three ATT-related genes are all highly expressed at or near the maturation stage of the Earl’s favorite Harukei-3 melon cultivar fruit (Figure 8B).

4. Discussion

Parthenocarpy induced by CPPU and the promotive effect of CPPU on fruit set are widely applied in fruit production. The promotive effect of CPPU application to the ovaries on fruit set and growth is due to its cytokinin activity. Although the direct effect of CPPU on fruit set is temporary, occurring only at the time of treatment, the resulting parthenocarpic fruit can also be affected indirectly compared with seeded fruit via pollination. In this context, rather than focus on already studied melon characteristics such as size, shape, total soluble solids, acidity, and firmness, we aimed to determine the impact of CPPU on others not extensively or not explored at all, such as aroma volatile profiles, carotenoid accumulation, and whole-genome transcript profiles.
Dongfangmi 3 is a newly issued Hami melon cultivar [36], and because of its highly ranked organoleptic qualities including a sweet and juicy taste and a unique aroma, the planting area of this cultivar has increased rapidly in recent years. This cultivar has been bred to adapt well to rainy and cloudy weather during growth seasons in Southern China, and the fruit set of Dongfangmi 3 is mostly dependent on the application of CPPU in real production. Therefore, this melon cultivar represents an ideal model to elucidate the action modes through which CPPU influences fruit quality, not only for basic understanding purposes, but also for practical benefits in crop production.
As with most horticultural products, melon fruit has a sweet and juicy taste and a unique aroma, which are supposed to be the consequence of the balanced accumulation of many compounds. During the cultivation of melon, high concentrations of CPPU or excessive CPPU may lead to undesirable side effects on fruit quality [16]. High CPPU concentrations may also promote cucurbitacin B biosynthesis and accumulation in melon fruit, leading to increased bitterness, which is among the important traits that negatively affects fruit quality and consumer acceptance [24].
In the present study on the Dongfangmi 3 melon cultivar, when CPPU was applied to non-pollinated flowers, the fruit sets were promoted in the seedless fruits. Thus, the parthenocarpy-inducing ability of CPPU was well-confirmed in this melon cultivar. The parthenocarpic and seeded fruits showed no significant differences in soluble solid contents; however, the pulp color and aroma volatile profiles of the melon fruit were apparently different between the parthenocarpic and seeded fruits, suggesting that CPPU can extensively affect fruit quality likely via some indirect effects, which still remain obscure.
The aroma volatiles evolved by melons are mainly composed of a complex mixture of esters, saturated and unsaturated aldehydes and alcohols, and sulfur compounds [37,38,39]. The GC–MS analysis in this study elucidated that CPPU treatment caused overall changes in compositions and relative contents of some volatile compounds compared with the pollinated control fruit. The most convenient and efficient approach to identification of the genes related to secondary metabolic pathways is transcriptomics combined with metabolic analysis after treatment with exogenous elicitors. Therefore, we subsequently conducted RNA-Seq-based transcriptome analysis, finding that CPPU treatment on the ovaries can lead to substantial changes in expression levels of the genes that are widely associated with the cellular component. Moreover, the DEGs caused by CPPU treatment can be enriched in several pathways that are associated with aroma volatiles and carotenoid biosynthesis.
Carotenoid metabolism in fruit development can be related with coloration as well as volatile development. Color changes during the ripening of melons from green to yellow-orange should result from chlorophyll degradation during development and the formation of β-carotene, which is recognized as a health-promoting component in melons for human consumption [40]. The steady-state level of carotenoids is dependent on the metabolic equilibrium between the biosynthesis and degradation of carotenoids, along with storage [41]. The catalytic activity of carotenoid cleavage dioxygenases (CCDs), which lead to the enzymatic turnover of carotenoids into apocarotenoids, is critical in regulating carotenoid accumulation. Carotenoid accumulation in various plant species and tissues is negatively correlated with the expression of CCD1 or CCD4, suggesting their roles in carotenoid turnover [41]. Enhanced expression of CCD4 in chrysanthemums resulted in white petal flowers and loss of yellow carotenoid pigments [42]. CCD4 has also been shown to control peach flesh pigmentation, with high CCD4 transcript abundance in white-flesh peach, which is associated with the emission of carotenoid-derived volatiles [43,44]. As shown in the transcriptome data, the expression levels of the genes associated with carotenoid biosynthesis were downregulated in the parthenocarpic fruits compared with the seeded fruits, whereas several genes associated with carotenoid degradation were highly expressed in the parthenocarpic fruits but not in the seeded fruits. These results support the findings of organoleptic quality analysis, which showed that parthenocarpic fruit induced by CPPU impaired the accumulation of carotenoid pigments in maturing melons. More interestingly, the cleavage of the beta-carotene branch by CCDs may produce various volatiles and phytohormones [45]. Volatile examples include beta-ionone and all other cleavage products, which are vital components of many flavors [46,47]. The analysis of VOCs in this study showed that trans-beta-ionone was generally less detected in all the CPPU-treated samples, irrespective of pollination.
According to the GC–MS analysis, the number of aldehydes in the P group was the highest compared with the CPPU treatment groups (Table 2). In addition, five of the six unique volatile compounds in the P group were aldehydes, amongst which (Z)-6-nonenal, as a C9 aldehyde, is described as having strong melon-like flavor [21,22,48]. (E)-2-hexenal as a C6 aldehyde was identified as one of the primary odorants in muskmelon [49]. The relative abundances of aldehydes (C6 or C9) in the P group, such as hexanal, nonanal, and (E)-2-nonenal, were significantly higher than in the other four CPPU-treated groups with or without pollination (Figure 4G–I), and all of them were detected in melon fruits as major aroma volatiles [22,38,49,50]. The Hami melon Dongfangmi 3 is a non-climacteric-type of melon cultivar. Obando-Ulloa et al. [51] found that aldehydes were the predominant volatiles in the non-climacteric reference cultivars, particularly hexanal, which was regarded as the characteristic compound. Thus, taken together, we concluded that aldehydes, especially C6 and C9 aldehydes, are the main aroma volatiles in the artificially pollinated fruits of the Dongfangmi 3 melon.
In plants, C6 and C9 aldehydes and alcohols, which mainly contribute to the green note of melon fruits, are synthesized from fatty acid metabolism, mainly linolenic and linoleic acids [52]. They are deoxygenated by lipoxygenase (LOX) to form 13- or 9-hydroperoxy-linole(n)ic acids. The 13-hydroperoxy fatty acids can subsequently be cleaved by hydroperoxide lyase (HPL) into C6 aldehydes, such as hexanal or (3Z)-hexenal, whereas the 9-hydroperoxy fatty acids can be cleaved into C9 aldehydes, such as (3Z)-nonenal or (3Z,6E)-nonadienal [53,54]. Zhang et al. [55] reported that transgenic tomato fruits expressing the melon13-lipoxygenase CmLOX18 exhibited increases in the content of C6 volatiles, namely hexanal, (Z)-3-hexanal, and (Z)-3-hexen-1-ol, indicating that melon13-lipoxygenase CmLOX18 likely plays an important role in the synthesis of C6 compounds in fruits. The (3Z)-aldehydes easily isomerize to form (2E)-enal isomers because of their instability; thus, (Z)-3-hexanal could easily isomerize to (E)-2-hexenal [53,54,56]. In this study, we found that the homologue of CmLOX18, linoleate 13S-lipoxygenase 3 (103500686), was significantly upregulated in the P group compared with the CPPU treatments. This transcript pattern corresponds well with the metabolic analysis, showing that the content of C6 aldehydes (hexanal and (E)-2-hexenal) in the P group was much higher than in the CPPU-treated samples.
Similarly, linoleic acids can be catalyzed by 9-LOX/HPL into (3Z)-nonenal, which can easily isomerize to (E)-2-nonenal [53,54]. In the present study, we found that the linoleate 9S-lipoxygenase 5 (103491403 and 103494917) genes were upregulated in the P group compared with the CPPU-treated groups. Furthermore, the GC–MS analysis showed that C9 aldehydes, such as (E)-2-nonenal, (Z)-6-nonenal, and nonanal, were all highly expressed in the P group, whereas their relative abundances were lower or undetectable in the C20 and P-C20 groups. Therefore, we speculated that the relatively higher content of C9 aldehydes, particularly (E)-2-nonenal, in the P group fruits might be due to the upregulation of linoleate 9S-lipoxygenase 5 (103491403 and 103494917) genes.
Alcohol acetyl transferase (AAT) plays an important role in the process of ester formation and can catalyze the transfer of an acetyl moiety from acetyl-coenzyme A (CoA) into the corresponding alcohol, forming an ester and free CoA [57,58]. In our study, the Melonet-DB analysis indicated that except for benzyl alcohol O-benzoyltransferase-like (103501099), the other three ATT-related genes were all highly expressed at or near the maturation stage of the Earl’s favorite Harukei-3 melon fruit (Figure 8B). In addition, benzyl alcohol O-benzoyltransferase-like (103501106) and benzyl alcohol O-benzoyltransferase (103501108) genes were highly upregulated in the P and C20 groups, respectively. The benzyl alcohol O-benzoyltransferase (103501102) gene was upregulated in the P and C20 groups compared with the P-C20 group. In the GC–MS analysis, the ester number detected in the melon fruit of the C20 group was higher than P-C20. However, the P-C20 group had a lower ester number, at six. The relative abundances of the six ethyl esters emitted by the P group fruits were clearly higher compared with the CPPU-treated groups. Therefore, the increase in the relative contents and kinds of esters in the P and C20 groups, respectively, might be related to the upregulation of 103501106, 103501108, and 103501102 genes.
Alcohols represent another group of volatile flavors of melon, among which 2-octanol was reported to be one of the main aromatic compounds of Hami melon [59] and 1-octen-3-ol was reported to be a volatile component in melon [60]. Aldehydes can be converted to alcohols via alcohol dehydrogenase (ADH). RNA-Seq data revealed that three ADH-encoding DEGs (103496151, 103502638, and 103488078) were relatively highly expressed in the P groups compared with the CPPU-treated groups, and the Melonet-DB analysis indicated that except for alcohol dehydrogenase-like 2 (103488078), the other two genes were both highly expressed at or near the maturation stage of the Earl’s favorite Harukei-3 melon fruit (Figure 8). From GC–MS analysis, we found that the relative abundances of 2-octanol and 1-octen-3-ol decreased significantly in the CPPU-treated groups compared with the P group (Figure 4K,M). Therefore, we speculated that the reduction in relative abundance of 2-octanol and 1-octen-3-ol in the CPPU-treated groups might be related to the low expression of the DEGs 103496151 and 103502638, whereas the alcohol numbers detected in the CPPU-treated groups were not less than in the P group. The reason for this finding may be related to the degradation of amino acids, which is another mechanism through which alcohol is formed [52,57].
Taken together, these results indicated that the CPPU treatment of melon fruits can significantly affect the expression levels of the genes related to LOX, ADH, AAT, and CCDs, which are involved in the carotenoid and fatty acid metabolism pathways, eventually leading to the variation in volatile profiles and pulp color in CPPU-treated fruits (Figure 9).

5. Conclusions

The study’s findings provide extensively updated information about the changes in fruit volatiles and transcriptome in mature melons that are caused by CPPU treatment. GC–MS analysis indicated that the CPPU significantly alters the volatile profiles of the melon cultivar Dongfangmi 3′. The RNA-Seq data revealed significant changes in expression levels of the genes related to carotenoid biosynthesis and fatty acid metabolism pathways, which are associated with the variation in flesh pigment and volatile emissions. Although further studies are necessary to clarify these mechanisms, this study is the first to connect the effects of CPPU on sensory qualities with the transcriptome patterns in melon fruits, and reveals that the mechanism of CPPU treatment generally lowers melon fruit quality.

Supplementary Materials

The following are available online at https://0-www-mdpi-com.brum.beds.ac.uk/article/10.3390/agronomy11051007/s1, Figure S1: Verification of relative expression levels of DEGs by qRT-PCR. Table S1: Gene expression level detection related primers.

Author Contributions

Conceptualization, J.L. and G.M.; methodology, T.L. and Y.T.; software, D.R. and T.W.; data curation, Y.W. and T.L.; writing—review and editing, J.L., P.Z., and G.M.; visualization, D.R.; supervision, L.X. and P.Z.; funding acquisition, G.M. All authors have read and agreed to the published version of the manuscript.

Funding

This research was funded by the Shanghai Association for Science and Technology (20312420400).

Institutional Review Board Statement

Not applicable.

Informed Consent Statement

Not applicable.

Data Availability Statement

RNA-sequence data are available at NCBI BioProject database ID: PRJNA729587.

Conflicts of Interest

The authors declare no conflict of interest.

References

  1. Burger, Y.; Sa’ar, U.; Paris, H.; Lewinsohn, E.; Katzir, N.; Tadmor, Y.; Schaffer, A. Genetic variability for valuable fruit quality traits in Cucumis melo. Israel J. Plant Sci. 2006, 54, 233–242. [Google Scholar] [CrossRef]
  2. Burger, Y.; Paris, H.S.; Cohen, R.; Katzir, N.; Tadmor, Y.; Lewinsohn, E.; Schaffer, A.A. Genetic Diversity of Cucumis Melo. In Horticultural Reviews; Janick, J., Ed.; John Wiley & Sons, Inc.: Hoboken, NJ, USA, 2009; pp. 165–198. ISBN 9780470527238. [Google Scholar]
  3. Lester, G.E.; Arias, L.S.; Gomez-Lim, M. Muskmelon Fruit Soluble Acid Invertase and Sucrose Phosphate Synthase Activity and Polypeptide Profiles during Growth and Maturation. J. Am. Soc. Hortic. Sci. 2001, 126, 33–36. [Google Scholar] [CrossRef] [Green Version]
  4. Kyriacou, M.C.; Leskovar, D.I.; Colla, G.; Rouphael, Y. Watermelon and melon fruit quality: The genotypic and agro-environmental factors implicated. Sci. Hortic. 2018, 234, 393–408. [Google Scholar] [CrossRef]
  5. Fenn, M.A.; Giovannoni, J.J. Phytohormones in fruit development and maturation. Plant J. 2021, 105, 446–458. [Google Scholar] [CrossRef] [PubMed]
  6. Hayata, Y.; Li, X.-X.; Osajima, Y. Pollination and CPPU Treatment Increase Endogenous IAA and Decrease Endogenous ABA in Muskmelons during Early Development. J. Am. Soc. Hortic. Sci. 2002, 127, 908–911. [Google Scholar] [CrossRef] [Green Version]
  7. Kawasaki, Y. Fruit Set and Temperature Stress. In Abiotic Stress Biology in Horticultural Plants; Kanayama, Y., Kochetov, A., Eds.; Springer: Tokyo, Japan, 2015; pp. 87–99. ISBN 978-4-431-55250-5. [Google Scholar]
  8. Hayata, Y.; Niimi, Y.; Iwasaki, N. Synthetic Cytokinin-1-(2=chloro=4=pyridyl)-3-phenylurea (CPPU)-Promotes Fruit Set and Induces Parthenocarpy in Watermelon. J. Am. Soc. Hortic. Sci. 1995, 120, 997–1000. [Google Scholar] [CrossRef] [Green Version]
  9. Wu, L.; Lan, J.; Xiang, X.; Xiang, H.; Jin, Z.; Khan, S.; Liu, Y. Transcriptome sequencing and endogenous phytohormone analysis reveal new insights in CPPU controlling fruit development in kiwifruit (Actinidia chinensis). PLoS ONE 2020, 15, e0240355. [Google Scholar] [CrossRef]
  10. Ainalidou, A.; Karamanoli, K.; Menkissoglu-Spiroudi, U.; Diamantidis, G.; Matsi, T. CPPU treatment and pollination: Their combined effect on kiwifruit growth and quality. Sci. Hortic. 2015, 193, 147–154. [Google Scholar] [CrossRef]
  11. Williamson, J.G.; NeSmith, D.S. Effects of CPPU Applications on Southern Highbush Blueberries. HortScience 2007, 42, 1612–1615. [Google Scholar] [CrossRef] [Green Version]
  12. Greene, D.W. CPPU Influences Fruit Quality and Fruit Abscission of McIntosh’ Apples. HortScience 2001, 36, 1292–1295. [Google Scholar] [CrossRef]
  13. Flaishman, M.; Amihai Shargal, A.S.; Raphael, S. The synthetic cytokinin CPPU increases fruit size and yield of Spadona’ and Costia’ pear (Pyrus communis L.). J. Hortic. Sci. Biotechnol. 2001, 76, 145–149. [Google Scholar] [CrossRef]
  14. Zhang, C.; Whiting, M. Plant growth regulators improve sweet cherry fruit quality without reducing endocarp growth. Sci. Hortic. 2013, 150, 73–79. [Google Scholar] [CrossRef]
  15. Wang, W.; Khalil-Ur-Rehman, M.; Feng, J.; Tao, J. RNA-seq based transcriptomic analysis of CPPU treated grape berries and emission of volatile compounds. J. Plant Physiol. 2017, 218, 155–166. [Google Scholar] [CrossRef] [PubMed]
  16. Hayata, Y.; Niimi, Y.; Inoue, K.; Kondo, S. CPPU and BA, with and without Pollination, Affect Set, Growth, and Quality of Muskmelon Fruit. HortScience 2000, 35, 868–870. [Google Scholar] [CrossRef] [Green Version]
  17. Hou, L.; Hao, H.; Yu, X. Applicaiton of CPPU on muskmelon alters fruit size and quality. Fresh Prod. 2011, 5, 26–29. [Google Scholar]
  18. Huang, Y.; Li, W.; Zhao, L.; Shen, T.; Sun, J.; Chen, H.; Kong, Q.; Nawaz, M.A.; Bie, Z. Melon fruit sugar and amino acid contents are affected by fruit setting method under protected cultivation. Sci. Hortic. 2017, 214, 288–294. [Google Scholar] [CrossRef]
  19. Allwood, J.W.; Cheung, W.; Xu, Y.; Mumm, R.; De Vos, R.C.H.; Deborde, C.; Biais, B.; Maucourt, M.; Berger, Y.; Schaffer, A.A.; et al. Metabolomics in melon: A new opportunity for aroma analysis. Phytochemistry 2014, 99, 61–72. [Google Scholar] [CrossRef]
  20. Fallik, E.; Alkali-Tuvia, S.; Horev, B.; Copel, A.; Rodov, V.; Aharoni, Y.; Ulrich, D.; Schulz, H. Characterisation of Galia’ melon aroma by GC and mass spectrometric sensor measurements after prolonged storage. Postharvest Biol. Technol. 2001, 22, 85–91. [Google Scholar] [CrossRef]
  21. Buttery, R.G.; Seifert, R.M.; Ling, L.C.; Soderstrom, E.L.; Ogawa, J.M.; Turnbaugh, J.G. Additional aroma components of honeydew melon. J. Agric. Food Chem. 1982, 30, 1208–1211. [Google Scholar] [CrossRef]
  22. Shi, J.; Wu, H.; Xiong, M.; Chen, Y.; Chen, J.; Zhou, B.; Wang, H.; Li, L.; Fu, X.; Bie, Z.; et al. Comparative analysis of volatile compounds in thirty nine melon cultivars by headspace solid-phase microextraction and gas chromatography-mass spectrometry. Food Chem. 2020, 316, 126342. [Google Scholar] [CrossRef]
  23. Fredes, A.; Sales, C.; Barreda, M.; Valcárcel, M.; Roselló, S.; Beltrán, J. Quantification of prominent volatile compounds responsible for muskmelon and watermelon aroma by purge and trap extraction followed by gas chromatography-mass spectrometry determination. Food Chem. 2016, 190, 689–700. [Google Scholar] [CrossRef] [PubMed] [Green Version]
  24. Luo, F.; Li, Q.; Yu, L.; Wang, C.; Qi, H. High concentrations of CPPU promotes cucurbitacin B accumulation in melon (Cucumis melo var. makuwa Makino) fruit by inducing transcription factor CmBt. Plant Physiol. Biochem. 2020, 154, 770–781. [Google Scholar] [CrossRef] [PubMed]
  25. Steingass, C.B.; Grauwet, T.; Carle, R. Influence of harvest maturity and fruit logistics on pineapple (Ananas comosus L. Merr.) volatiles assessed by headspace solid phase microextraction and gas chromatography-mass spectrometry (HS-SPME-GC/MS). Food Chem. 2014, 150, 382–391. [Google Scholar] [CrossRef]
  26. Oberacher, H.; Whitley, G.; Berger, B. Evaluation of the sensitivity of the Wiley registry of tandem mass spectral data, MSforID’ with MS/MS data of the NIST/NIH/EPA mass spectral library’. J. Mass Spectrom. 2013, 48, 487–496. [Google Scholar] [CrossRef]
  27. Gao, H.; Li, P.; Liu, L.; Yang, K.; Xiao, B.; Zhou, G.; Tian, Z.; Luo, C.; Xia, T.; Dong, L.; et al. Perigestational low-dose BDE-47 exposure alters maternal serum metabolome and results in sex-specific weight gain in adult offspring. Chemosphere 2019, 233, 174–182. [Google Scholar] [CrossRef] [PubMed]
  28. Garcia-Mas, J.; Benjak, A.; Sanseverino, W.; Bourgeois, M.; Mir, G.; González, V.M.; Hénaff, E.; Câmara, F.; Cozzuto, L.; Lowy, E.; et al. The genome of melon (Cucumis melo L.). Proc. Natl. Acad. Sci. USA 2012, 109, 11872–11877. [Google Scholar] [CrossRef] [Green Version]
  29. Mortazavi, A.; Williams, B.A.; McCue, K.; Schaeffer, L.; Wold, B. Mapping and quantifying mammalian transcriptomes by RNA-Seq. Nat. Methods 2008, 5, 621–628. [Google Scholar] [CrossRef]
  30. Love, M.I.; Huber, W.; Anders, S. Moderated estimation of fold change and dispersion for RNA-seq data with DESeq2. Genome Biol. 2014, 15, 550. [Google Scholar] [CrossRef] [Green Version]
  31. Benjamini, Y.; Hochberg, Y. Controlling the False Discovery Rate: A Practical and Powerful Approach to Multiple Testing. J. R. Stat. Soc. 1995, 57, 289–300. [Google Scholar] [CrossRef]
  32. Martin, J.A.; Wang, Z. Next-generation transcriptome assembly. Nat. Rev. Genet. 2011, 12, 671–682. [Google Scholar] [CrossRef] [PubMed]
  33. Livak, K.J.; Schmittgen, T.D. Analysis of relative gene expression data using real-time quantitative PCR and the 2(-Delta Delta C(T)) Method. Methods 2001, 25, 402–408. [Google Scholar] [CrossRef] [PubMed]
  34. Schwab, W.; Davidovich-Rikanati, R.; Lewinsohn, E. Biosynthesis of plant-derived flavor compounds. Plant J. 2008, 54, 712–732. [Google Scholar] [CrossRef]
  35. Bhat, N.R.; Desai, B.B.; Suleiman, M.K. Flavor in Grapes: Its Characterization and Commercial Applications. In Handbook of Fruit and Vegetable Flavors; Hui, Y.H., Ed.; John Wiley & Sons, Inc.: Hoboken, NJ, USA, 2010; pp. 279–302. ISBN 9780470622834. [Google Scholar]
  36. Li, J.; Lin, T.; Ma, G. A new Hami melon cultivar ‘Dongfangmi 3’. Acta Hortic. Sin. 2020, 47, 3017–3018. (In Chinese) [Google Scholar] [CrossRef]
  37. Wyllie, S.G.; Leach, D.N. Aroma volatiles of Cucumis melo cv. Golden Crispy. J. Agric. Food Chem. 1990, 38, 2042–2044. [Google Scholar] [CrossRef]
  38. Obando-Ulloa, J.M.; Ruiz, J.; Monforte, A.J.; Fernández-Trujillo, J.P. Aroma profile of a collection of near-isogenic lines of melon (Cucumis melo L.). Food Chem. 2010, 118, 815–822. [Google Scholar] [CrossRef] [Green Version]
  39. Beaulieu, J.C.; Grimm, C.C. Identification of volatile compounds in cantaloupe at various developmental stages using solid phase microextraction. J. Agric. Food Chem. 2001, 49, 1345–1352. [Google Scholar] [CrossRef]
  40. Sun, T.; Yuan, H.; Cao, H.; Yazdani, M.; Tadmor, Y.; Li, L. Carotenoid Metabolism in Plants: The Role of Plastids. Mol. Plant 2018, 11, 58–74. [Google Scholar] [CrossRef] [Green Version]
  41. Yuan, H.; Zhang, J.; Nageswaran, D.; Li, L. Carotenoid metabolism and regulation in horticultural crops. Hortic. Res. 2015, 2, 15036. [Google Scholar] [CrossRef] [Green Version]
  42. Ohmiya, A. Diversity of Carotenoid Composition in Flower Petals. Jpn. Agric. Res. Q. JARQ 2011, 45, 163–171. [Google Scholar] [CrossRef] [Green Version]
  43. Brandi, F.; Bar, E.; Mourgues, F.; Horváth, G.; Turcsi, E.; Giuliano, G.; Liverani, A.; Tartarini, S.; Lewinsohn, E.; Rosati, C. Study of Redhaven’ peach and its white-fleshed mutant suggests a key role of CCD4 carotenoid dioxygenase in carotenoid and norisoprenoid volatile metabolism. BMC Plant Biol. 2011, 11, 24. [Google Scholar] [CrossRef] [Green Version]
  44. Falchi, R.; Vendramin, E.; Zanon, L.; Scalabrin, S.; Cipriani, G.; Verde, I.; Vizzotto, G.; Morgante, M. Three distinct mutational mechanisms acting on a single gene underpin the origin of yellow flesh in peach. Plant J. 2013, 76, 175–187. [Google Scholar] [CrossRef] [Green Version]
  45. Walter, M.H.; Strack, D. Carotenoids and their cleavage products: Biosynthesis and functions. Nat. Prod. Rep. 2011, 28, 663–692. [Google Scholar] [CrossRef]
  46. Rubio, A.; Rambla, J.L.; Santaella, M.; Gómez, M.D.; Orzaez, D.; Granell, A.; Gómez-Gómez, L. Cytosolic and plastoglobule-targeted carotenoid dioxygenases from Crocus sativus are both involved in beta-ionone release. J. Biol. Chem. 2008, 283, 24816–24825. [Google Scholar] [CrossRef] [PubMed] [Green Version]
  47. Baldermann, S.; Kato, M.; Fleischmann, P.; Watanabe, N. Biosynthesis of α- and β-ionone, prominent scent compounds, in flowers of Osmanthus fragrans. Acta Biochim. Pol. 2012, 59, 79–81. [Google Scholar] [CrossRef]
  48. Kemp, T.R.; Knavel, D.E.; Stoltz, L.P. cis-6-Nonenal: A flavor component of muskmelon fruit. Phytochemistry 1972, 11, 3321–3322. [Google Scholar] [CrossRef]
  49. Schieberle, P.; Ofner, S.; Grosch, W. Evaluation of Potent Odorants in Cucumbers (Cucumis sativus) and Muskmelons (Cucumis melo) by Aroma Extract Dilution Analysis. J. Food Sci. 1990, 55, 193–195. [Google Scholar] [CrossRef]
  50. Oh, S.H.; Lim, B.S.; Hong, S.J.; Lee, S.K. Aroma volatile changes of netted muskmelon (Cucumis melo L.) fruit during developmental stages. Hortic. Environ. Biotechnol. 2011, 52, 590–595. [Google Scholar] [CrossRef]
  51. Obando-Ulloa, J.M.; Moreno, E.; García-Mas, J.; Nicolai, B.; Lammertyn, J.; Monforte, A.J.; Fernández-Trujillo, J.P. Climacteric or non-climacteric behavior in melon fruit. Postharvest Biol. Technol. 2008, 49, 27–37. [Google Scholar] [CrossRef]
  52. Tressl, R.; Drawert, F. Biogenesis of banana volatiles. J. Agric. Food Chem. 1973, 21, 560–565. [Google Scholar] [CrossRef]
  53. Noordermeer, M.A.; van der Goot, W.; van Kooij, A.J.; Veldsink, J.W.; Veldink, G.A.; Vliegenthart, J.F.G. Development of a biocatalytic process for the production of c6-aldehydes from vegetable oils by soybean lipoxygenase and recombinant hydroperoxide lyase. J. Agric. Food Chem. 2002, 50, 4270–4274. [Google Scholar] [CrossRef] [Green Version]
  54. Kuroda, H.; Oshima, T.; Kaneda, H.; Takashio, M. Identification and functional analyses of two cDNAs that encode fatty acid 9-/13-hydroperoxide lyase (CYP74C) in rice. Biosci. Biotechnol. Biochem. 2005, 69, 1545–1554. [Google Scholar] [CrossRef] [Green Version]
  55. Zhang, C.; Cao, S.; Jin, Y.; Ju, L.; Chen, Q.; Xing, Q.; Qi, H. Melon13-lipoxygenase CmLOX18 may be involved in C6 volatiles biosynthesis in fruit. Sci. Rep. 2017, 7, 2816. [Google Scholar] [CrossRef] [PubMed] [Green Version]
  56. Howe, G.A.; Lee, G.I.; Itoh, A.; Li, L.; DeRocher, A.E. Cytochrome P450-dependent metabolism of oxylipins in tomato. Cloning and expression of allene oxide synthase and fatty acid hydroperoxide lyase. Plant Physiol. 2000, 123, 711–724. [Google Scholar] [CrossRef] [Green Version]
  57. Shalit, M.; Katzir, N.; Tadmor, Y.; Larkov, O.; Burger, Y.; Shalekhet, F.; Lastochkin, E.; Ravid, U.; Amar, O.; Edelstein, M.; et al. Acetyl-coa: Alcohol acetyltransferase activity and aroma formation in ripening melon fruits. J. Agric. Food Chem. 2001, 49, 794–799. [Google Scholar] [CrossRef]
  58. Beaulieu, J.C. Volatile Changes in Cantaloupe during Growth, Maturation, and in Stored Fresh-cuts Prepared from Fruit Harvested at Various Maturities. J. Am. Soc. Hortic. Sci. 2006, 131, 127–139. [Google Scholar] [CrossRef] [Green Version]
  59. Qian, Z.W.; Tang, X.W.; Wu, Z.; Yang, M.H.; Liu, M.C. Comparison of the aromatic compounds and nutritional quality among different types of melon fruits. Chin. Agric. Sci. Bull. 2009, 25, 165–171. (In Chinese) [Google Scholar]
  60. Kemp, T.R.; Knavel, D.E.; Stoltz, L.P. Volatile Cucumis melo components: Identification of additional compounds and effects of storage conditions. Phytochemistry 1973, 12, 2921–2924. [Google Scholar] [CrossRef]
Figure 1. Pulp color of melon fruit at harvest. C10 and C20 represent concentration (10 and 20 mg/L, respectively) of CPPU used for treatment. P shows artificial pollination as control. P-C shows the pollination followed by CPPU treatment.
Agronomy 11 01007 g001
Figure 2. PCA score plot of GC–MS of different melon fruit treatments.
Agronomy 11 01007 g002
Figure 3. The heatmap of different VOCs emitted by different melon fruit treatments. Red represents upregulation; blue represents downregulation.
Agronomy 11 01007 g003
Figure 4. Box plot visualizations of the relative abundances of the VOCs that were markedly altered after CPPU treatment. (AF) Esters, (GJ) aldehydes, (KM) alcohols, and (N) trans beta ionone markedly declined after CPPU treatment. (O) 1-Hexanol markedly increased after CPPU treatment. For each box plot, the bottom and top of box indicate the 25th and 75th percentiles, respectively; the horizontal line inside the box is the median; the bottom and top error bars indicate the 10th and 90th percentiles, respectively; *, **, and ***, different groups had significant differences at the 0.05, 0.01, and 0.001 levels, respectively.
Agronomy 11 01007 g004
Figure 5. (A) PCA score plot of the RNA-sequencing (RNA-Seq) data for three different melon fruit treatments. (B) Number of genes differentially expressed among P, C20, and P-C20 treatments. Upregulated and downregulated genes were quantified. (C) Venn diagram showing numbers of common genes among P, C20, and P-C20 treatments. (D) Correlation of gene expression values obtained by RNA-Seq and qPCR.
Agronomy 11 01007 g005
Figure 6. DEGs related to carotenoid metabolism. (A) The heatmap of carotenoid metabolism-related DEGs in different melon fruit treatments. Red represents upregulation; blue represents downregulation. (B) Gene expression map of carotenoid metabolism-related DEGs at various stages of fruit development and maturation of the muskmelon cultivar Earl’s favorite Harukei-3.
Agronomy 11 01007 g006
Figure 7. DEGs related to lipoxygenase (LOX) in fatty acid metabolism. (A) The heatmap of LOX-related DEGs in fatty acid metabolism pathway of different melon fruit treatments. Red represents upregulation; blue represents downregulation. (B) Gene expression map of LOX-related DEGs at various stages of fruit development and maturation of the muskmelon cultivar Earl’s favorite Harukei-3.
Agronomy 11 01007 g007
Figure 8. DEGs related to alcohol dehydrogenase (ADH), and alcohol acyltransferase (AAT) in fatty acid metabolism. (A) The heatmap of ADH- and AAT-related DEGs in the fatty acid metabolism pathway of different melon fruit treatments. Red represents upregulation; blue represents downregulation. (B) Gene expression map of ADH- and AAT-related DEGs at various stages of fruit development and maturation of the muskmelon cultivar Earl’s favorite Harukei-3.
Agronomy 11 01007 g008
Figure 9. Genetic model of melon fruit volatiles altered by treatment with CPPU. Red and blue colored words represent up- and downregulated gene or volatile compounds in CPPU groups (including C and P-C groups) compared with P group, respectively. The word “carotenoids” in green color indicates a significant difference between the parthenocarpic fruits (the C group) and the fruits containing plump seeds (the P and P-C groups).
Agronomy 11 01007 g009
Table 1. Effects of N1-(2-chloro-4-pyridyl)-N3-phenylurea (CPPU) on seed number and sensorial qualities of mature melon fruit.
TreatmentSeeds/FruitTA (%)SS (%)SS/TAPulp Color Analysis
NullPlumpCenterEdge L*a*b*
P53 a712 c0.023 b12.27 a6.83 a540.86 b67.79 a9.00 b22.42 b
C10550 c0 a0.026 b c12.00 a6.00 a475.47 a b67.77 a7.56 a19.78 a
C20685 d0 a0.030 c12.26 a6.27 a409.74 a68.03 a7.52 a19.89 a
P-C10243 b516 b0.015 a13.33 a5.51 a877.45 c68.17 a9.64 b23.37 b
P-C20307 b543 b0.015 a13.83 a7.17 a879.71 c68.12 a9.58 b23.99 b
Note: Different letters (a–d) in each vertical column indicate significant differences (Duncan’s multiple range test, p ≤ 0.05). SS, TA, SS/TA represent soluble solids, titratable acids and ratio of soluble solids to titratable acids, respectively. L*, a*, and b* represent lightness, red (+)/green (−), and yellow (+)/blue (−) scale values, respectively.
Table 2. Types of volatile organic compounds (VOCs).
TypesPC10C20P-C10P-C20
All volatiles6768736165
Aldehydes126655
Alcohols1821222221
Alkanes66545
Esters10131356
Terpenes23223
Acids24434
Ketones99121213
Others86988
Table 3. Number of reads based on RNA-Seq data in three melon fruit libraries.
TypePC20P-C20Total
Total clean reads47,417,42846,854,42046,704,089140,975,937
Total mapped reads (%)40,730,142 (85.9%)42,789,550 (91.32%)43,752,495 (93.68%)127,272,187
Unique mapped reads (%)40,291,259 (84.97%)42,322,747 (90.33%)43,281,516 (92.67%)125,895,522
Note: Total clean reads: number of clean reads based on a single end. Total mapped reads: number of reads aligned to reference genome and the percentage among clean reads. Unique mapped reads: number of reads aligned to a single position in the reference genome and the percentage among clean reads.
Table 4. Gene Ontology (GO) analysis for differentially expressed genes (DEGs) for different CPPU treatments.
GO DomainGO IDDescriptionp-Value (<0.05)Upregulated DEGsDownregulated DEGs
C20 vs. P
CCGO:0000502proteasome complex0.000373150
CCGO:1905369endopeptidase complex0.000373150
CCGO:0005839proteasome core complex0.001694130
CCGO:0098796membrane protein complex0.0017524617
CCGO:0031090organelle membrane0.005092244
CCGO:00001481,3-beta-D-glucan synthase complex0.00543644
CCGO:0016469proton-transporting two-sector ATPase complex0.005773143
CCGO:0044433cytoplasmic vesicle part0.007137110
CCGO:0048475coated membrane0.008665180
MFGO:0046982protein heterodimerization activity1.64 × 10−6317
P-C20 vs. P
BPGO:0044262cellular carbohydrate metabolic process0.0001122725
CCGO:0000502proteasome complex0.001535131
CCGO:1905369endopeptidase complex0.001535131
CCGO:00001481,3-beta-D-glucan synthase complex0.00490935
CCGO:0005794Golgi apparatus0.005856122
CCGO:0005839proteasome core complex0.006268111
CCGO:0044433cytoplasmic vesicle part0.0063101
CCGO:0048475coated membrane0.007316171
P-C20 vs. C20
MFGO:0046982protein heterodimerization activity0.00011624
MFGO:0016616oxidoreductase activity, acting on the CH-OH group of donors, NAD or NADP as acceptor0.00014827
MF, molecular function; CC, cellular component; BP, biological process.
Table 5. Significantly enriched pathways of DEGs regarding different CPPU treatments.
Pathway IDDescriptionp-ValueUp-DEGsDown-DEGs
C20 vs. P
cmo01200Carbon metabolism3.79 × 10−78048
cmo00010Glycolysis/gluconeogenesis4.57 × 10−54517
cmo03050Proteasome0.000106331
cmo00020Citrate cycle0.000438246
cmo00710Carbon fixation in photosynthetic organisms0.0007542612
cmo04141Protein processing in endoplasmic reticulum0.0036146226
cmo01230Biosynthesis of amino acids0.0048176436
cmo00270Cysteine and methionine metabolism0.0054172622
cmo00620Pyruvate metabolism0.0196472813
cmo00410Beta-alanine metabolism0.0258581210
cmo012102-Oxocarboxylic acid metabolism0.025864158
cmo00520Amino sugar and nucleotide sugar metabolism0.0274943619
cmo00630Glyoxylate and dicarboxylate metabolism0.0309721815
cmo00100Steroid biosynthesis0.036458123
cmo00906Carotenoid biosynthesis0.055387810
cmo00071Fatty acid degradation0.244985812
cmo01212Fatty acid metabolism0.3644231510
cmo00999Biosynthesis of secondary metabolites0.46211661
cmo00061Fatty acid biosynthesis0.741792112
cmo00592Alpha-linolenic acid metabolism0.96922756
P-C20 vs. P
cmo00410Beta-alanine metabolism0.00065520
cmo01200Carbon metabolism0.0009494760
cmo04144Endocytosis0.0018296213
cmo00280Valine, leucine and isoleucine degradation0.001919522
cmo03050Proteasome0.002888272
cmo00960Tropane, piperidine and pyridine alkaloid biosynthesis0.00356839
cmo03030DNA replication0.00469216
cmo00270Cysteine and methionine metabolism0.0051842025
cmo01230Biosynthesis of amino acids0.0123493953
cmo00020Citrate cycle 0.034884167
cmo00710Carbon fixation in photosynthetic organisms0.0495071515
cmo00071Fatty acid degradation0.153584515
cmo00592Alpha-linolenic acid metabolism0.177497612
cmo01212Fatty acid metabolism0.188288916
cmo00906Carotenoid biosynthesis0.57157439
cmo00061Fatty acid biosynthesis0.82866165
cmo00591Linoleic acid metabolism0.86451412
P-C20 vs. C20
cmo01230Biosynthesis of amino acids9.25 × 10−62766
cmo00710Carbon fixation in photosynthetic organisms1.07 × 10−51125
cmo00280Valine, leucine and isoleucine degradation2.22 × 10−5226
cmo01212Fatty acid metabolism7.77 × 10−5824
cmo01200Carbon metabolism0.0001152275
cmo00250Alanine, aspartate and glutamate metabolism0.00033721
cmo00630Glyoxylate and dicarboxylate metabolism0.0004825
cmo00640Propanoate metabolism0.000946118
cmo00400Phenylalanine, tyrosine and tryptophan biosynthesis0.000996617
cmo00270Cysteine and methionine metabolism0.0013721328
cmo00071Fatty acid degradation0.002424518
cmo00010Glycolysis/Gluconeogenesis0.007568936
cmo00410beta-Alanine metabolism0.008243416
cmo00480Glutathione metabolism0.009575530
cmo00620Pyruvate metabolism0.014003529
cmo00900Terpenoid backbone biosynthesis0.022365319
cmo00592Alpha-linolenic acid metabolism0.026348415
cmo00520Amino sugar and nucleotide sugar metabolism0.0326962222
cmo00999Biosynthesis of secondary metabolites0.04366618
cmo00061Fatty acid biosynthesis0.055871412
cmo00906Carotenoid biosynthesis0.24899357
Publisher’s Note: MDPI stays neutral with regard to jurisdictional claims in published maps and institutional affiliations.

