Article

Determination of the Elemental Composition of Aromatic Plants Cultivated Industrially in the Republic of Moldova Using Neutron Activation Analysis

1
Department of Chemistry of Natural and Biologically Active Compounds, The Institute of Chemistry, 3 Academiei Str., 2028 Chisinau, Moldova
2
Department of Nuclear Physics, Joint Institute for Nuclear Research, 6 Joliot-Curie Str., 1419890 Dubna, Russia
3
Faculty of Physics and Technology, Plovdiv University “Paisii Hilendarski”, 24 Tsar Asen Str., 2028 Plovdiv, Bulgaria
4
Department of Nuclear Physics, Horia Hulubei National Institute for R&D in Physics and Nuclear Engineering, 30 Reactorului Str. MG-6, 077125 Bucharest—Magurele, Romania
*
Author to whom correspondence should be addressed.
Submission received: 13 April 2021 / Revised: 14 May 2021 / Accepted: 17 May 2021 / Published: 20 May 2021
(This article belongs to the Special Issue Air and Soil Pollution Effects on Agroecosystems)

Abstract

:
The mineral contents of roots, leaves, stalks, and inflorescences of the aromatic plant species Anethum graveolens L., Coriandrum sativum L., Lavandula angustifolia Mill., Levisticum officinale W.D.J. Koch, and Salvia sclarea L. were studied by means of neutron activation analysis. The contents of 36 major and trace elements were determined and biological transfer coefficients were calculated. Among major and minor elements, K with a content in the range of 9230–59,600 mg/kg and Fe in the range of 69–3420 mg/kg were the most abundant elements in the studied plants. The content of the toxicant As ranged between 0.14–0.79 mg/kg; however, in the leaves (1.3 mg/kg) and inflorescences (1.0 mg/kg) of L. angustifolia there was found to be about 1 mg/kg, equal to the guideline maximal level recommended for food by the WHO. By comparing the data to Markert’s Reference Plant, “chemical fingerprints” were identified for each species. High contents of the elements Al, Hf, Se, Sc, Na, Ta, Th were determined in all studied plants. Collocated soil samples from the cultivation field were analyzed to calculate the biological accumulation coefficients for 35 of the elements determined in the plants. Considering the levels of chemical elements, the medicinal herb samples investigated are considered as relatively safe for human consumption.

1. Introduction

Medicinal aromatic plants have been used widely throughout human history, mainly due to their ease of access, affordability, and perceived therapeutic efficacy combined with absence of adverse side effects [1]. According to Fabricant and Farnsworth [2], of the 120 active compounds isolated from higher plants currently used in modern medicine, a positive correlation between modern therapeutic applications and traditional uses is found in 80%. Medicinal plants are often consumed as herbal preparations (infusions, essential oils, etc.) or spices, and are considered valuable sources of dietary supplementation.
Among the most commonly cultivated plants for essential oil production are dill (A. graveolens), coriander (C. sativum), lavender (L. angustifolia), lovage (L. officinale), and clary sage (S. sclarea). They belong to the Apiaceae (Umbelliferae) (A. graveolens, C. sativum, L. officinale) and the Lamiaceae (L. angustifolia, S. sclarea) families and are native to the Mediterranean region and/or West Asia. However, nowadays, they are grown throughout the world [3,4,5,6,7]. Lavender, lovage, and clary sage are perennial plants, whereas dill and coriander are annual.
A large body of research has been dedicated to studying the essential oils compositions of the species under discussion [8,9,10,11]. They have been popularly used in pharmaceuticals, medicine, cosmetic products, the tobacco industry, agriculture, and perfumery; for aromatherapy; food preparation, preservation, and flavoring; and as melliferous and ornamental plants [12,13,14,15,16,17,18,19,20]. In general, medicinal plants are important in pharmacological research and drug development, especially in cases where they are used as starting materials [21].
Furthermore, there has been an ever-increasing interest in determination of the elemental composition of medicinal plants [22,23], which stems from the fact that trace elements are essential for higher plants and for the human organism only in trace amounts [24,25]. Minerals at supra-optimal levels could be toxic, and information about the inorganic content of raw plant materials has been requested for the purposes of quality control of herbal supplements and preparations. Consumer protection organizations and regulatory bodies have been involved following reports of poisoning with arsenic, cadmium, lead, and mercury from traditional Indian and Chinese herbal medicines [26,27,28].
The processes of mineral transportation and accumulation are influenced by the chemical properties of the elements and compounds (e.g., solubility, bioavailability), by factors of the environment (soil characteristics, climatic conditions, distance to pollution sources, agricultural practices such as fertilization, etc.), and by the plant survival mechanisms [29,30,31]. Since the selected medicinal plants are vascular, the transfer of minerals from soil can be considered one of the main pathways of their accumulation in different compartments of the plant [32]. This merits further studies of the associations between soil content and the elemental distribution among the plant organs.
The aim of this study was (i) to investigate the elemental compositions of five popularly used medicinal plants cultivated industrially on unfertilized chernozem soil in the Republic of Moldova, using neutron activation analysis; and (ii) to evaluate element uptake from soil and accumulation in different morphological parts of plants (roots, leaves, stalks, inflorescences).

2. Materials and Methods

2.1. Study Area

The plant samples were collected during the flowering stage directly from the fields located near the towns of Causeni and Glodeni. The following plant samples were collected near Causeni: coriander (on 03 June 2019 in Cainari, geographically located at 46°40′44″ N 29°03′26″ E), clary sage (on 19 June 2019 in Misovca, 46°46′21″ N 29°00′22″ E), dill (13 June 2019, Constantinovca, 46°43′16″ N 29°06′34″ E), lavender (on 24 June 2019 in Pervomaisc, 46°42′04″ N 29°05′21″ E); and near Glodeni: lovage (on 18 June 2019 in Balatina, 47°41′33″ N 27°20′34″ E). The plants were grown in natural conditions on chernozem soil and were not fertilized. The climate in the region is continental, characterized by cold winters and warm and dry summers, with temperatures in the range from −15 °C in January to 35 °C in July. According to the State Hydrometeorological Service, in 2019, the annual average temperature was +10.6–+12.6 °C and the average precipitation was about 404 mm.

2.2. Sampling and Sample Preparation

Aromatic plants of the species C. sativum, S. sclarea, A. graveolens, L. officinale, and L. angustifolia were collected in the summer of 2019 at the full flowering stage. All analyzed plants are essential oil crops and were collected during the full flowering stage, when the volatile oil content and potential therapeutic properties are expected to be maximum. For each of the studied species, approximately 100 g of dry raw material was obtained from plants collected over the entire area of the fields. After drying, each individual plant was separated into parts: roots, leaves, stalks, and inflorescences. The sorted plant parts were used to prepare compound samples.
Two associated soil samples were collected in close proximity to the plants, at depths from 10 to 20 cm as to avoid topsoil pollution arising from the surrounding environment. In the studied area, chernozem soil of brownish grayish color predominates, with pH levels around 6.0.
The samples were dried and stored in paper bags prior to analysis. In the laboratory, the plant components (organs) were homogenized separately, in a homogenizer, to obtain average samples. The soil samples were air-dried for 24 h and sifted through a 2 mm stainless-steel sieve.
For neutron activation analysis, all samples were dried at 40 °C to constant weight, and subsamples of about 0.3 g for vegetation and 0.1 g for soil were packed in polyethylene foil bags for short-term irradiation and in aluminum cups for long-term irradiation.

2.3. Neutron Activation Analysis (NAA)

The elemental contents of the analyzed herbs were determined by means of neutron activation analysis performed in the radioanalytical laboratory REGATA, at the IBR-2 reactor of the Frank Laboratory of Neutron Physics, Joint Institute for Nuclear Research, Dubna, Russia. Descriptions of the irradiation channels and the pneumatic transport system of the REGATA installation can be found elsewhere [33]. The concentrations of elements based on short-lived radionuclides: Al, Mg, Cl, Ca, Ti, V, and Mn were determined by irradiation for 3 min at a thermal neutron flux of 1.6 × 10¹² n cm−2 s−1 and measured for 15 min. To determine the contents of elements with long-lived isotopes: Na, K, Sc, Cr, Fe, Co, Ni, Zn, As, Br, Rb, Sr, Mo, Sb, Se, Cs, Ba, La, Ce, Sm, Eu, Hf, Nd, Ta, Tb, W, Yb, Zr, Th, and U, the cadmium-screened Channel 1 were used. Samples were irradiated for 4 days at a neutron flux of 1.8 × 1011 cm−2 s−1. Gamma spectra of induced activity were obtained after 4 and 20 days using three Canberra HPGe detectors with an efficiency of 40–55% and resolution of 1.8–2.0 keV at 1332 keV 60Co total-absorption peak.
The analysis of the spectra was performed using the Genie2000 software by Canberra, with peak-fitting verification in interactive mode. Calculation of the concentration was carried out using the software “Concentration” developed in FLNP [34].
Quality control of the analytical measurements was carried out using certified reference materials: NIST SRM 1573—tomato leaves, NIST SRM 1547—peach leaves, NIST SRM 1632c—trace elements in coal (bituminous), NIST SRM 2709a—San Joaquin soil. The difference between determined and certified values was less than 10%.

3. Results and Discussion

3.1. Elemental Analysis of the Studied Plants

The contents of 36 major and trace elements determined in the plant samples are presented in Table 1, Table 2, Table 3, Table 4 and Table 5, for the species C. sativum, L. angustifolia, S. sclarea, L. officinale, and A. graveolens, respectively. Among the determined elements, 12 are either essential or beneficial to the human organism at certain concentrations (Ca, Cl, Co, Cr, Fe, K, Mg, Mn, Na, Se, V, Zn), 6 are potentially toxic (Al, As, Ba, Rb, Sb, Sr), and the rest of the elements have no biological functions [35].
The obtained results were compared with values introduced by Markert [29,35] for a generalized model of a plant, called the Reference Plant (RP) (Table 1, Table 2, Table 3, Table 4 and Table 5). This model was created with the aim of providing a base system for comparing different analytical data from plant analysis, no matter the type of plant or edaphic and climatic conditions. Data of typical accumulator or rejector plants were not used in Markert’s model; therefore, in comparison to the RP, any relatively high concentrations are considered “chemical fingerprints” of the plants under investigation. In our study, any relatively high concentrations might also be considered a factor in explaining the medical properties of the plants.
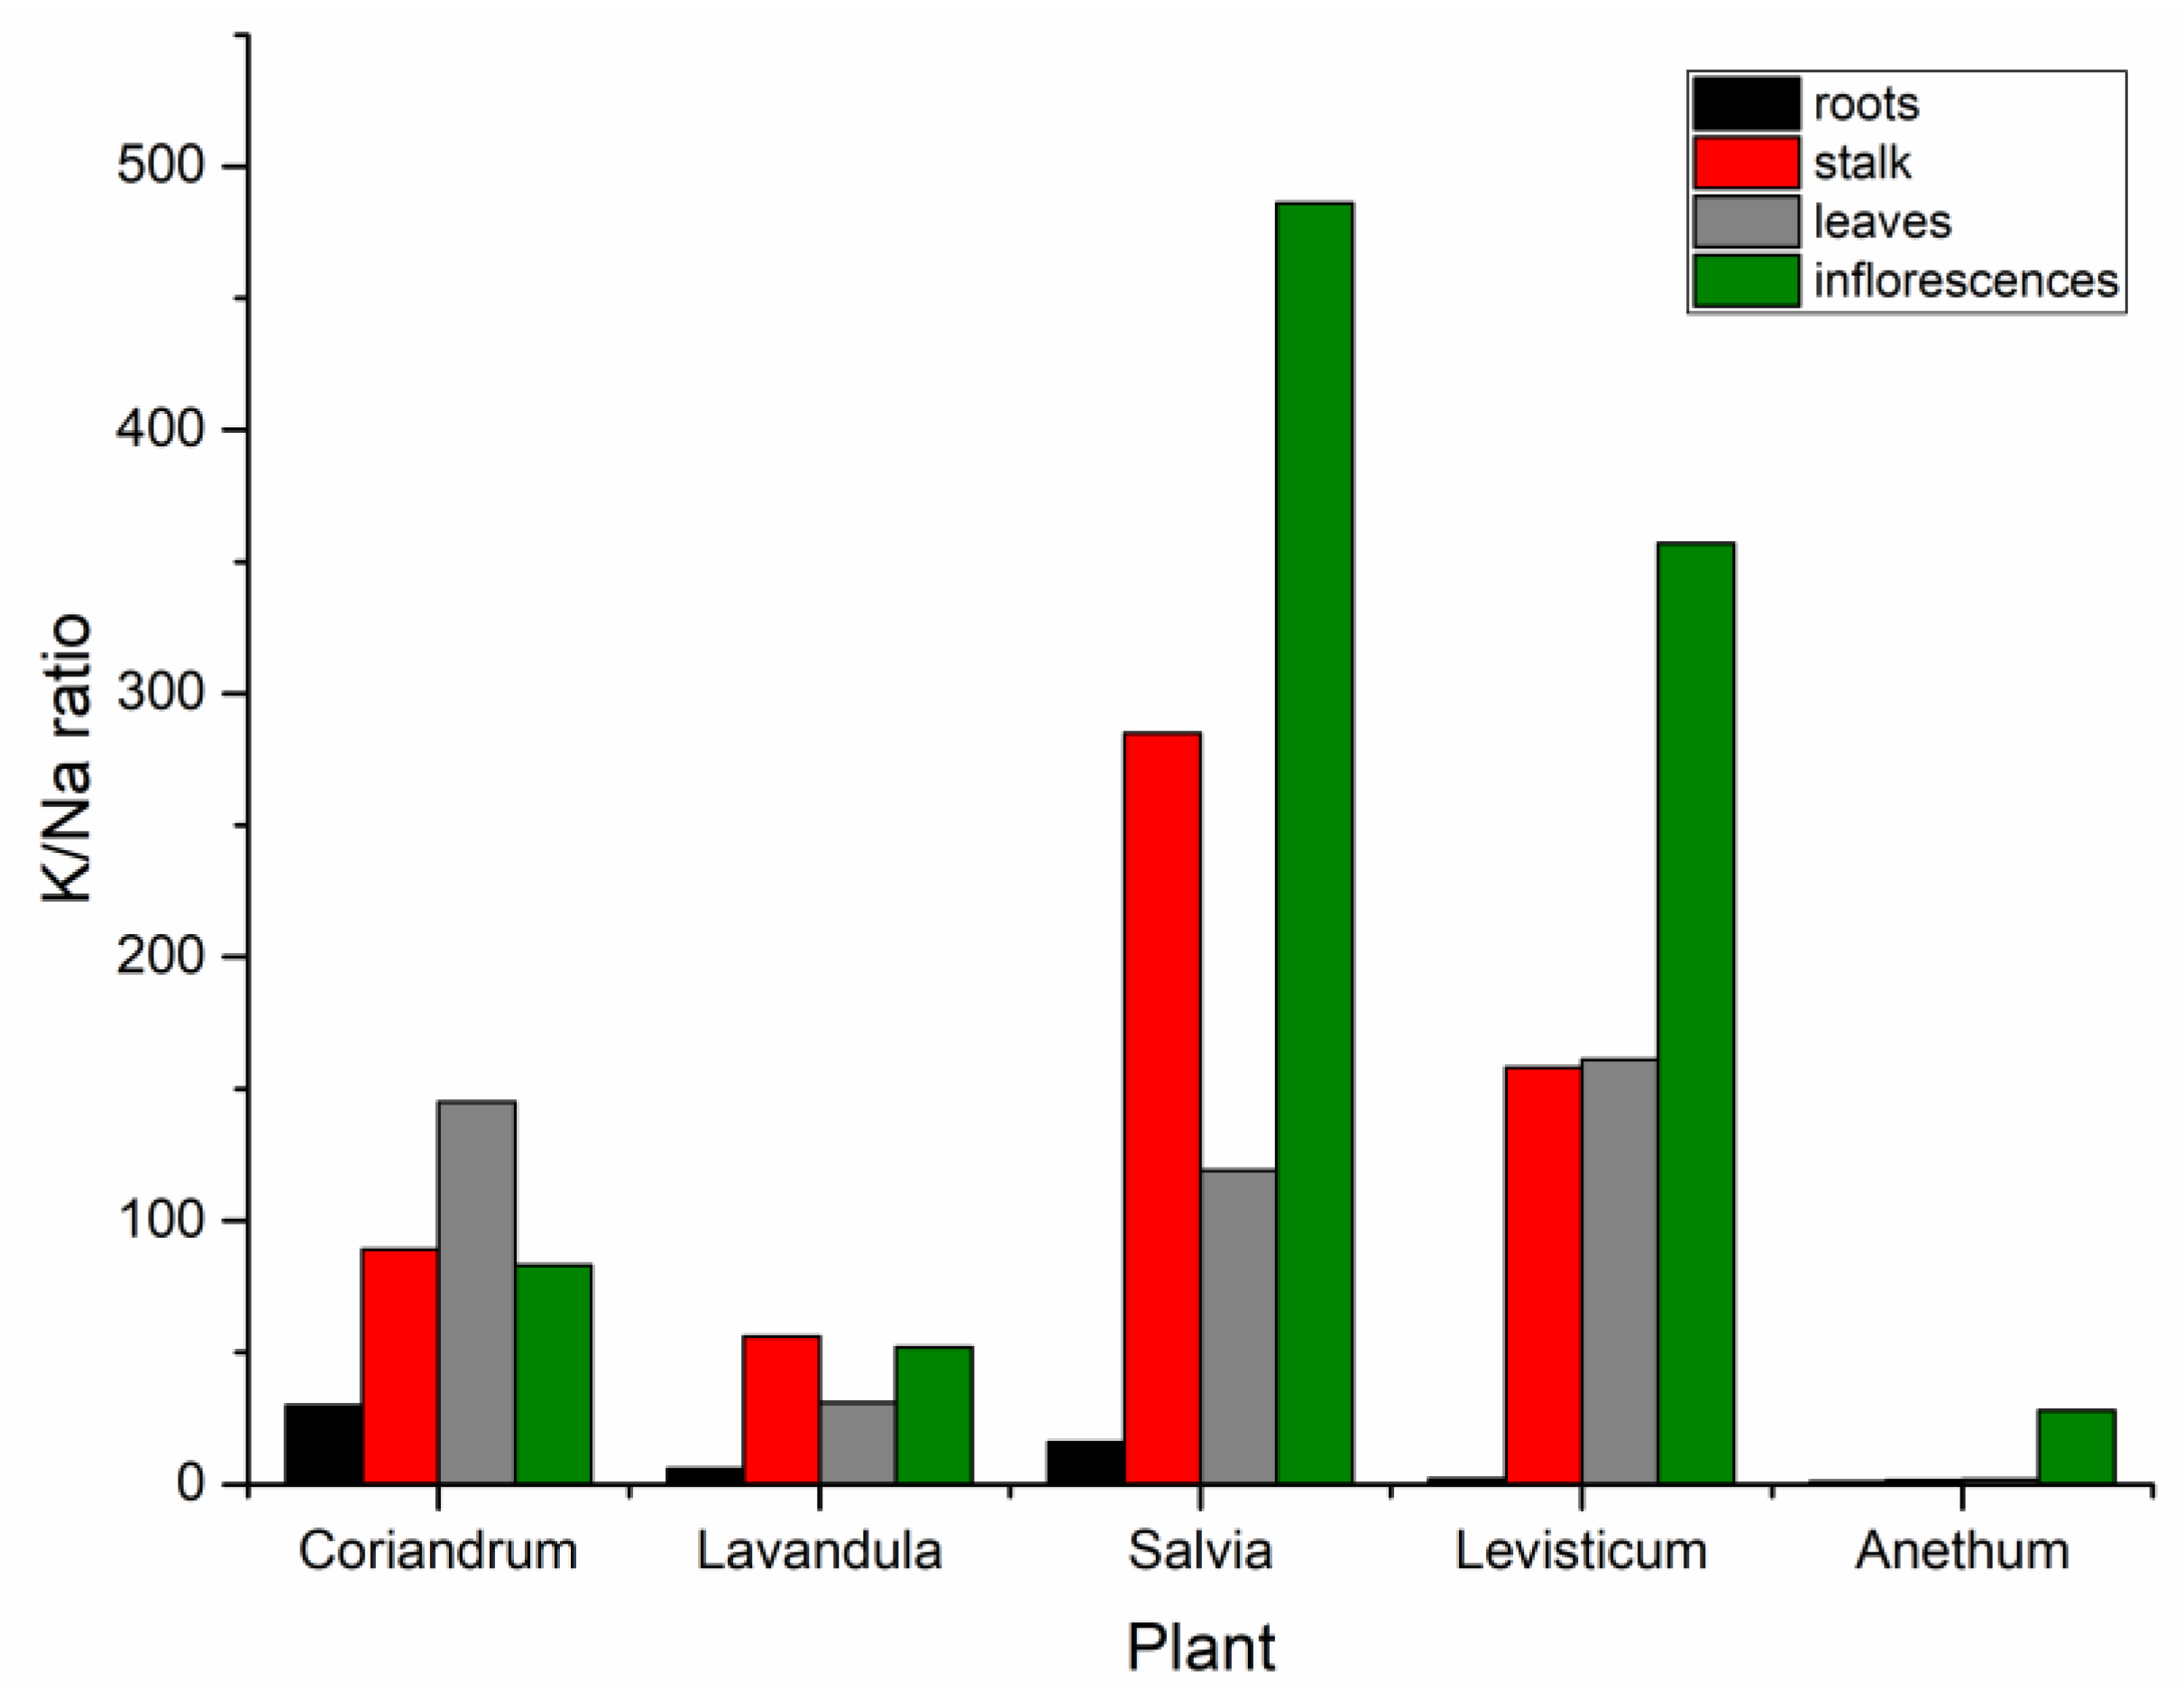
Given that in vascular plants all organs perform distinct physiological functions, the distribution patterns of the elements among the morphological parts differ. It was observed that C. sativum and L. officinale, belonging to the Apiaceae family, bioaccumulated most elements either in inflorescences or roots. In the case of plants of the Lamiaceae family the highest mineral content for almost all elements was found in the leaves and inflorescences. Generally, the mineral content of the stalk was low, which could be explained by the fact that transportation of fluids between the roots and stalk (translocation via the xylem and phloem) is one of the main functions of this organ.
It was determined that among all samples from C. sativum (Table 1), inflorescences had the highest contents of the following elements, in decreasing order of concentration: K > Ca > Mg > Al > Fe > Ti > Mn > Br > V > Ce > Nd > La > Co > Th > Sc > Hf > Sm > Cs > Yb > Sb > Eu > Ta. The roots of this plant contained the largest quantity of the following elements, listed in decreasing order of concentration: Na > Fe > Sr > Ba > Zr > V > Cr > As > Sc > W>U > Yb. However, in roots and inflorescences, the contents of the elements: Al, Co, Cs, Eu, Hf, La, Sb, Sc, Sm, Ta, V, and Yb were almost the same. The contents of Br, Cl, Ni, Rb, and Zn were the highest in the leaves, whereas the elements Sr, As, Ba, Cr, Eu, Na, Ta, U, W, and Yb had the smallest contents in this morphological part.
The stalk was characterized by low contents of almost all of the determined elements, except for As (0.32 mg/kg). It should be noted that the content of this element in inflorescences was almost the same (0.33 mg/kg) but it was the largest in roots (0.42 mg/kg).
By comparing the obtained results for C. sativum to the RP values, it was ascertained that the elements: Al (in inflorescences and roots, the content decreased in the order inflorescences > roots), Br (inflorescences > leaves), Hf (roots > inflorescences > leaves), Na (in roots), Sc (roots and inflorescences, equal amount), Se (in all investigated organs; leaves > inflorescences > stalk = roots), Ta (inflorescences > roots), Th (inflorescences > roots > leaves > stalk), Ti (inflorescences), U (roots), and Zr (roots > inflorescences) had relatively high content, by five times or more than the RP values.
Out of the 36 elements determined in the organs of L. angustifolia (Table 2), 23 were found to have their highest contents in the leaves, listed in decreasing order: K > Al > Fe > Ti > Mn > Zr > Rb > Cr > Ce > La > Nd > Hf > Th > Co > As > Sc > Sm > Yb > Cs > U> Eu > Ta > Tb. The contents of Mg, Na, Ni, Sb, V, and Zn were the highest in roots (in the order Mg > Na > Zn > V > Ni > Sb), and inflorescences had the largest amount of K > Ca > Sr > Ba > Br > W > Se. The stalk of L. angustifolia was characterized by comparatively low quantities of almost all elements, except for Cl (2260 mg/kg); but the content of this element was also high in inflorescences (2080 mg/kg). The contents of Ba, Br, Ca, Sr, in stalks and leaves were similar, whereas for Zn it was almost the same in all aboveground parts of the plant (31 mg/kg in stalks, 38 mg/kg in leaves, and 38.5 mg/kg in inflorescences). In roots and stalks, the content of Tb was on the same level.
In comparison to the RP, L. angustifolia was characterized by at least five-times-higher contents of the following elements: Al (in all investigated organs, in the order: leaves > inflorescences > stalk > roots), As (all investigated organs: leaves > inflorescences > roots > stalk), Ce (leaves > inflorescences > stalk > roots), Cr (leaves > roots), Eu (leaves > roots > inflorescences), Fe (leaves > inflorescences > roots > stalk), Hf (leaves > inflorescences > stalk > roots), La (leaves > inflorescences > stalk > roots), Na (roots > leaves), Nd (leaves > inflorescences > stalk > roots), Sc (leaves > inflorescences > stalk > roots), Se (inflorescences > roots), Sm (leaves > inflorescences > stalk > roots), Ta (leaves > inflorescences > stalk > roots), Tb (leaves > inflorescences > stalk = roots), Th (leaves > inflorescences > stalk > roots), Ti (leaves > inflorescences > stalk > roots), U (leaves > roots > inflorescences > stalk), V (roots > leaves > inflorescences > stalk), Yb (leaves > inflorescences > stem > roots), Zr (leaves > inflorescences > stem > roots).
The results for S. sclarea (Table 3) showed that, except for Ce and Na, the highest contents of almost all the determined elements were found in the leaves. However, some of the elements were found in almost equal amounts to the leaves in the inflorescences. These were: Br (6.7 mg/kg in inflorescences, 6.4 mg/kg in leaves), Mg (4180 mg/kg in inflorescences, 4120 mg/kg in leaves), Rb (16.8 mg/kg in inflorescences, 18.5 mg/kg in leaves), Se (0.294 mg/kg in inflorescences, 0.297 mg/kg in leaves), and Zn (27.3 mg/kg in inflorescences, 23 mg/kg in leaves). The mineral content of the stalk was poor in comparison to that of the other studied morphological parts but for Ba, since its content in the stalk was equal to that in the leaves (77 mg/kg). The contents of Ce and Na were the highest in the roots.
A comparison to the RP model revealed that the content of 14 of the determined elements in S. sclarea was rather high (five times or more than the RP values) in different organs of the plant: Al (in leaves and roots), As (leaves), Co (leaves), Eu (leaves), Fe (leaves), Hf (leaves > roots > inflorescences = stalk), La (leaves), Na (roots), Nd (leaves), Sc (leaves > roots), Se (leaves = inflorescences > roots = stalk), Sm (leaves), Ta (leaves > roots), Tb (leaves), Th (leaves > roots > stalk > inflorescences), U (leaves > roots), V(leaves), Yb (leaves), and Zr (leaves > roots).
The obtained data for L. officinale (Table 4) showed that of the 36 determined elements, 15 had their highest contents in the roots (Na > Al > V > Ce > La > As > Co > Sc > Th > U > Cs > Sm > Yb > Ta > Tb), and 9 in inflorescences (K > Mg > Fe > Zn > Rb > Cr > Ni > Sb > Hf). The quantity of Ba in the roots and stalks was similar (12 mg/kg and 13.2 mg/kg, respectively).
The contents of Mg, Mn, Se, and Zn in the inflorescences and leaves were almost the same. A comparison of the contents between all studied morphological parts of L. officinale showed that the leaves were the richest in Ca, Mn, Se, Sr, and Zn.
However, a comparison with the RP revealed that only the content of Se was high in all organs of L. officinale. The comparison with Markert’s model revealed that the content of the following elements was rather high: Al (in roots > inflorescences), Br (stalk > inflorescences > leaves), Fe (inflorescences), Hf (inflorescences > roots > leaves), Na (roots), Sc (roots), Se (leaves > inflorescences > roots > stalk), Ta (roots > inflorescences > stalk), Th (roots > inflorescences > leaves > stalk), and U (in roots). The contents of K > Ca > Mg > Cl > Fe > Na > Sr > Ni in the leaves were two times higher than in the RP. Compared to the other organs of the plants, the stalk was characterized by the highest contents of Ba, Br, and Cl (in the order Cl > Br > Ba). The content of Br in the stalk was 35 times higher than in the RP.
It was observed that among the studied organs of the plant A. graveolens (Table 5), roots had the highest mineral content of the following elements, listed in decreasing order: Al > Fe > Ti > Cr > V > Ce > La > As > Co > Th > Hf > Sc > Sm > Cs > Yb > Sb > Ta > Tb > Eu. The highest contents of these elements were determined in the leaves: Ca > Na > Mg > Cl > Sr > Mn > Ba. For the element Se, the content in leaves and inflorescences was almost the same (0.33 mg/kg and 0.35 mg/kg, respectively).
By comparing the determined concentrations in the roots to the RP, it was ascertained that the content of the following elements: As, Br, Fe, Hf, Na, Sc, Se, Ta, Th, Ti, and V was at least five times higher. It should be noted that the contents of Br, Na, Se, and Th were high in all the studied organs of A. graveolens. The distribution order was as follows: for Br—inflorescences > leaves > stalks > roots; Na—leaves > stalk > roots > inflorescences; Se—leaves = inflorescences > roots > stalk; Th—roots > leaves > inflorescences > stalk. In addition, it was observed that in the leaves of A. graveolens, the contents of Hf and Ta were higher than in the RP by 8 and 20 times, respectively.
The studied members of the Lamiaceae family (L. angustifolia and S. sclarea) were characterized by the following common “chemical fingerprints”: As, Eu, Fe, La, Nd, Ta, Th, Sm, Tb, U, V, Yb, Zr. As previously mentioned, C. sativum and L. officinale bioaccumulated most elements either in inflorescences or roots. Zinicovscaia et al. [23] presented the elemental composition of 45 species of medicinal plants of the Lamiaceae family and summarized available literature data on the contents of major, micro-, and rare earth elements. In the referenced study, homogenized samples of the areal parts of the plants were used, collected at the flowering stage. For the aboveground organs of L. angustifolia Mill. and S. sclarea L., it was ascertained that only the content of Sb was similar to the data reported by Zinicovscaia et al. [23] and the rest of the elements were determined to have a greater content in the aboveground organs. The contents of Zn, Ba, Rb, and Cs in the herbs of the Lamiaceae family collected in Bulgaria, determined by ICP-MS, were comparable with the obtained data; the contents of Al, Fe, Ni, and Cr were higher in the plants analyzed in the present study, while the Mn content was greater in plants collected in Bulgaria [36]. The contents of Ca, Fe, Mn, Zn, and Ni determined in the present study fell within the ranges of concentrations determined in plants of the Lamiaceae family collected in Morocco, while the Co content was lower in the Moroccan herbs, and the contents of K, Mg, Cr, Se, As, and V in the Moroccan plants were determined to be higher than those of the plants from the Republic of Moldova [37].
For the Apiaceae (Umbelliferae) family, the following “chemical fingerprints” were characteristic of the three studied members (species): Br, Hf, Se, Sc, Ta, and Th; and the highest mineral contents were found in the leaves and inflorescences. Tunçtürk & Özgökçe [38] performed atomic absorption spectrometry on herbs from the Apiaceae (Umbelliferae) family. The content of Na in the inflorescences of A. graveolens in the present study was similar to the data reported for the same medicinal plant species in the referenced work (1.26 ± 0.05 g/kg); however, the content of Mg (4.53 ± 0.15), K (27.4 ± 0.32), and Ca (20.0 ± 1.21) in the aboveground parts of the plant was higher by a factor of 2, 3, and 2, respectively. Zaidi et al. [39] studied the contents of trace elements in store-bought food spices by means of NAA. It was observed that the elemental content of leaves of coriander in the present study was similar to the reported data for the elements Cl, Hf, and Mn. Similarities to the reported values were observed for the elemental contents of Co, Sc, Zn, and Na in the inflorescences, and Sc, Se, and Sb in the stalks. The reported values for As and K were about three times lower than those determined in the present study. The contents of As, Cs, Co, Ni, and Se in Anethum Sowa L. roots determined by ICP-MS and of Al, Fe, and Na determined by AAS were lower than those ascertained in the present study, while the contents of Ca, Mg, and K were much greater [40].
Data on the effects of chromium, copper, iodine, iron, manganese, molybdenum, selenium, and zinc on the human organism was reviewed in [41]. Thorough data on typical contents of numerous elements in various plants and in the soil has been summarized by Kabata-Pendias and Pendias [42], as well as by Markert et al. [35].
Over the years, international organizations and numerous national regulatory agencies in various countries have imposed or recommended guideline values in order to limit the consumption of potentially toxic elements in food, feed, and in drinking water.
In 1999, the World Health Organization set the maximal permissible level of arsenic in raw plant materials to 1.0 mg/kg [43,44]. This would imply that the leaves and inflorescences of L. angustifolia (Table 2) had an As content almost equal to the obsolete guideline maximal value. In the updated Guidelines for Assessing Quality of Herbal Medicines with Reference to Contaminants and Residues, such maximal levels are no longer prescribed [45]. Instead, provisional tolerable intake (PTI) values established on a regional or national basis are cited and a recommendation for harmonizing the limits and standards for toxic metals is given. Previously set limit values prescribed by the WHO, still applicable for herbal medications, are available only for the elements lead and cadmium: 10 mg/kg and 0.3 mg/kg, respectively.
For other herbal preparations, the National Sanitation Foundation draft proposal (raw dietary supplements) suggests a limit of 5 mg/kg for As, 10 mg/kg for Pb, 0.3 mg/kg for Cd, and 2 mg/kg for Cr [46]. As such, the content of arsenic determined in the studied plants did not exceed the recommended limit value. However, the content of Cr in different morphological parts of four of the studied plants did exceed the limit value of 2 mg/kg. This was the case in roots, stalk, leaves, and inflorescences of L. angustifolia (Table 2), in leaves of S. sclarea (Table 3), in inflorescences of L. officinale (Table 4), and in roots of A. graveolens (Table 5).
Currently, there are no maximum levels established for arsenic in food at EU level, despite the fact that such values have been laid down in national legislation in some Member States. For water intended for human consumption [47,48] a parametric value of 10 μg/L is established. Hajeb et al. [49] summarized that terrestrial foods typically contain low levels of arsenic, less than 0.05 μg/g dry matter, except for rice and other grains, in which As content is often reported between 0.03 to 1 μg/g.
The European Union Food Safety Authority Panel on Contaminants in the food chain (CONTAM Panel) has provided intake levels for certain elements. Regulation EC 1881/2006 [50] lays down maximum levels for contaminants in foodstuff. As regards arsenic, however, there are no statutory limits for its content in food, and instead, a range of benchmark-dose lower confidence limit (BMDL01) values between 0.3 and 8 µg/kg b.w. per day was identified for cancers of the lung, skin, and bladder, as well as skin lesions [51]. Work on this topic is ongoing and it is anticipated that limits will be set for other potentially toxic elements in the near future as the methodology for the quantification improves.

3.2. K:Na Ratio

Among the five studied plant species, all except coriander have been reported to have diuretic properties [52,53,54,55]. To assess the diuretic activity of the plants, the K/Na ratio could be used. It was presented graphically in Figure 1. The values ranged between 1.1:1 for the roots of A. graveolens and 486:1 in inflorescences of S. sclarea, which is in good agreement with the findings reported by Zinicovscaia et al. [23] and Szentmihályi et al. [56].
It should be noted that the values for the K/Na ratio determined in all plant organs of C. sativum were greater than those of L. angustifolia, even though the former is not considered a popular herbal diuretic. The results for A. graveolens did not suggest that a substantial diuretic activity could be achieved by ingesting any of the studied organs of the plant.

3.3. Biological Transfer Coefficients (BTC)

Biological transfer coefficient (BTC) and translocation factor (TF) could be defined as the ratio of the concentration of a given element in the aboveground part of a plant (leaves, stalk, and inflorescences) and the concentration of the same element in the underground parts (roots) [57]. The calculated values can be found in Appendix A, Table A1.
The results show that in C. sativum, the following elements were translocated to the aboveground parts, with relatively small amounts remaining in the root system: As (BTC = 2.2), Br (BTC = 13), Ca (BTC = 5.6), Cl (BTC = 18), K (BTC = 4), Mg (BTC = 5.7), Mn (BTC = 7), Ni (BTC = 5), Rb (BTC = 4), Sb (BTC = 3), Se (BTC = 5), Ti (BTC = 2.3), and Zn (BTC = 6). Data for commercially available herbs from Turkey were inconsistent with the results from our study, as the reported content of Se (23.53 kg/kg) and Cr (5.97 mg/kg) was much higher, while for other elements, it was much lower [58]. In a study conducted on contaminated soils in India, it was suggested that C. sativum could accumulate Mn, Fe, Zn, and Cu [59]. Our study suggests that Mn and Zn are accumulated by C. sativum even in the case of unimpacted and unfertilized soils.
As regards L. angustifolia, 30 of the 36 determined elements were characterized by BTC > 2: Al, As, Ba, Br, Ca, Ce, Cl, Co, Cr, Cs, Eu, Fe, Hf, K, La, Mn, Nd, Rb, Sc, Se, Sm, Sr, Ta, Tb, Th, Ti, U, W, Yb, and Zr. The highest values of BTC among all studied plants were observed for the following elements: Al (BTC = 5.5), Ce (BTC = 7), Cs (BTC = 6), Eu (BTC = 5), Hf (BTC = 9), La (BTC = 6), Sc (BTC = 6), Ta (BTC = 9), Th (BTC = 8), Ti (BTC = 7), Yb (BTC = 7), and Zr (BTC = 10). It can be concluded that L. angustifolia has the capability to translocate and deposit a large variety of micronutrients in its shoots, including ultratrace elements. In a study conducted on Lavandula vera L. cultivated on soils contaminated with metals, it was reported that this plant could act as a potential hyperaccumulator of Pb and an accumulator of Cd and Zn [60]. According to Zheljazkov and Astatkie [61] and Angelova et al. [60], the essential oils of Lavandula angustifolia and Lavandula vera L. were not contaminated by heavy metals in the cases of cultivation on lead-enriched soils. Our study demonstrated that Lavandula phytoaccumulates a variety of major and trace elements even when grown on uncontaminated and unfertilized soils.
The BTC values obtained for S. sclarea showed that, in the aboveground mass, the contents of 31 elements were greater than in the roots (BTF > 2): Al, As, Ba, Br, Ca, Cl, Co, Cr, Cs, Eu, Fe, Hf, K, La, Mg, Mn, Ni, Rb, Sb, Se, Sc, Sm, Sr, Ta, Tb, Th, Ti, V, Yb, Zn, and Zr. Among all studied plants, the BTC for the following elements had the greatest values in S. sclarea: As (BTC = 4.1), Ba (BTC = 5), Co (BTC = 5), Fe (BTC = 5), Mn (BTC = 8), Sb (BTC = 3). Angelova et al. [22,62] and Chand et al. [63] reported that under certain soil conditions, clary sage could be a hyperaccumulator of Pb and accumulator of Cd and Zn; therefore, this plant can be utilized for the purposes of phytoremediation of contaminated soils. The same authors ascertained that, in the case of cultivation on polluted soils, the quality and quantity of the extracted essential oils were unaffected.
The data for L. officinale showed that the following elements were accumulated in the aboveground mass of the plant: Ba, Br, Ca, Cl, Co, Cr, Fe, K, Mg, Mn, Ni, Rb, Sb, Se, Sr, and Zn. In comparison to the other studied plants, the rates of accumulation of four of these elements were the highest in L. officinale.: Br (BTC = 27), Cl (BTC = 46), K (BTC = 13), Se (BTC = 6). In addition, the BTC for Rb and Cr were the same as for S. sclarea (BTC = 9 and BTC = 5, respectively).
The results for A. graveolens showed that the following elements accumulated primarily in aboveground organs: Ba, Br, Ca, Cl, K, Mg, Mn, Na, Rb, Se, Sr, and Zn. The obtained values for Ca (BTC = 12), Mg (BTC = 7), Na (BTC = 2.3), Sr (BTC = 10), and Zn (BTC = 9) were the largest among the studied plants.
In a study conducted in Banat region, Romania, it was demonstrated that L. officinale and A. graveolens could be used for phytoextraction of cadmium, as both were characterized by high values for BTC [64]. Our study demonstrated that both plant species did not actively uptake arsenic and could be considered excluders (BTC < 1) [30].

3.4. Mineral Content of the Soil

The comparison with the RP revealed that the contents of Al, Hf, Se, Sc, Na, Ta, Th were high in all studied plants, and it could be hypothesized that the mineral content of the soil and/or common plant characteristics could be a factor in explaining this result.
To ascertain the mineral composition of the soil on the experimental field, two soil samples were collected at a distance of 5 km from each other, and NAA allowed for quantification of 38 elements. The data were averaged and presented in Table 6. To express the degree of variability in the determined elemental content, coefficients of variations were calculated. The concentrations of Br, Ca, Cs, Fe, Gd, Hf, Mg, Ni, V, and Zr showed wide variation. Compared to empirical data for European continental-scale soil surveys (GEMAS Ap in Table 6), the contents of trace elements of the soil samples in our study proved to be very similar. Only the content of Ni was found to be twice that of the GEMAS Ap median values [65].
As regards the metal and metalloid content in agricultural topsoils, there was an attempt to harmonize the standards set in member states of the European Union and to define common threshold values, lower, and higher guideline values for As, Cd, Cr, Cu, Hg, Pb, Zn, Sb, V, Co, and Ni [66]. A comparison of these values with the results obtained in this study showed that only the content of Zn exceeded the lower guideline value of 150 mg/kg defined on the basis of ecological risk, so precautionary measures could be necessary under certain conditions. However, the content of Zn was below the higher guideline value of 250 mg/kg, therefore no associated health or food safety risks are implied. The contents of Co, Ni, and V were similar to the threshold values (20 mg/kg, 50 mg/kg, and 100 mg/kg, respectively), while the contents of Cr and Sb were low. The content of As exceeded the proposed threshold value (2 mg/kg) and yet it was much lower than the respective lower guideline value (50 mg/kg).
Local assessment of the soil could be made using Moldavian limit values for metal concentrations in soil set for the elements Cd, Cu, Ni, Pb, Zn, and Hg [67]. The contents of Ni and Zn determined in the soil samples did not exceed the limit values of 75 mg/kg and 300 mg/kg, respectively. As such, it can be concluded that in terms of the mineral content of the soil, the mentioned fields from the country located near the towns of Causeni and Glodeni, could be considered “ecologically clean”.
In a study of vineyards in Moldova, the reported values for the elements Cr, Mn, Co, Zn, and As in soils were similar to the results obtained in our work [68]. In another study conducted in Moldova, on the mineral content of Tanacetum corymbosum (L.) Sch. Bip., it was suggested that the high contents of Al, As, Br, Cl, K, Mg, Mo, and Sc determined in the plant could be caused by the composition of local soils, rich in dolomites, limestones, and K-feldspars [69].

3.5. Biological Absorption Coefficients (BAC)

The phytoavailability of a given element, or transference from the growth media to the organs of the plant, could be assessed using coefficients known as biological absorption coefficients (BAC) or the index of bioaccumulation (IBA). These coefficients are defined as the ratio of the total content of an element in the plant material to the content of the same element in the associated soils [42]. The BACs were presented in Table A1 alongside the BTCs.
It was observed that the elements characterized by increased phytoavailability in C. sativum were the following: Br (BAC = 5), Ca (BAC = 2.4), Cl (BAC = 127), K (BAC = 9), and Zn (BAC = 2.2). Having in mind that the BTCs for Ca, Cl, K, and Zn were greater than 2, it could be concluded that C. sativum is an accumulator of these four elements in the conditions of cultivation on unpolluted soil and no fertilization. In addition, it was observed that this plant is a rejector (excluder) of U and Zr, since both the BTC and BAC values were smaller than 1, meaning that uptake was limited.
The same set of elements with similar values for BAC were observed for L. angustifolia The BAC for K, which had the value of 5, was the only exception from this observation since in the case of C. sativum it was 9. Additionally, the element Sr was phytoaccumulated by L. angustifolia, BAC = 2.8. As regards S. sclarea, the BACs exceeding or equal to 2, were the following: Ca (BAC = 3), Cl (BAC = 5), K (BAC = 8), and Sr (BAC = 2).
For L. officinale, a similar set of elements to those in C. sativum were phytoaccumulated: Ba (BAC = 22), Ca (BAC =3), Cl (BAC = 336, which was the highest value among all studied plants), K (BAC = 8), Sr (BAC = 3), and Zn (BAC = 2).
A. graveolens showed an ability to phytoaccumulate Br, Na, and Sr the best out of all studied plants (Br: BAC = 46; Na: BAC = 5; Sr: BAC = 4). In addition, the uptake of the elements Ca (BAC = 3), Cl (BAC = 101), and K (BAC = 4) was high.
The uptake of elements is influenced by the specific plant–soil interactions and could be improved by root exudates [70]. However, since Br, Ca, Cl, and K were phytoaccumulated in all studied plants, and the BACs for Sr and Zn had rather high values in most, it could be concluded that soils from the experimental field were rich in mobile or phytoavailable forms of these elements (soluble compounds).

4. Conclusions

By utilizing neutron activation analysis, the number of determined elements was maximized and the quantification of a total of 36 elements was achieved. The leaves, inflorescences, and roots of the studied plants could be considered important sources of nutrients in the food and pharmaceutical industries. The contents of the potentially toxic element Cr in roots, stalk, leaves, and inflorescences of L. angustifolia, in the leaves of S. sclarea, in the inflorescences of L. officinale, and in the roots of A. graveolens exceeded the guideline value (2 mg/kg) laid down by the National Sanitation Foundation International. A comparison with data for Markert’s Reference Plant revealed the following “chemical fingerprints”: for A. graveolens: As, Br, Fe, Hf, Na, Sc, Se, Ta, Th, Ti, and V; for C. sativum: Al, Na, Br, Hf, Se, Sc, Ta, Th, Ti, U, and Zr; for L. angustifolia: Al, As, Ce, Cr, Eu, Ce, Cr, Fe, Hf, La, Na, Nd, Sc, Se, Sm, Ta, Tb, Th, Ti, U, V, Yb, and Zr; for S. sclarea: Al, As, Co, Eu, Fe, Hf, La, Na, Nd, Sc, Se, Ta, Th, Sm, Tb, Th, U, V, Yb, and Zr; and for L. officinale: Se, Br, Al, Fe, Hf, Na, Sc, Se, Ta, Th, and U. The calculated BAC and BTF revealed that the studied aromatic plants accumulated certain elements when grown on unfertilized soils. These findings concern the biogeochemical properties of the plants and could be used in further in botanical and environmental studies.

Author Contributions

Conceptualization, A.C., G.H. and I.Z.; methodology, A.A., I.D., I.Z., N.Y., D.G. and V.P.; samples preparation N.Y., V.P. and I.D.; samples irradiation, D.G.; validation, A.C., A.A. and I.Z.; formal analysis, A.C., G.H. and I.Z.; writing—original draft preparation, G.H.; writing—review and editing, A.C., G.H., A.A. and I.Z. All authors have read and agreed to the published version of the manuscript.

Funding

This research received no external funding.

Institutional Review Board Statement

Not applicable.

Informed Consent Statement

Not applicable.

Data Availability Statement

Data is contained within the article.

Acknowledgments

The authors would like to thank the staff of the Sector of Neutron Activation Analysis and Applied Research for handling the radioactive samples.

Conflicts of Interest

The authors declare no conflict of interest.

Appendix A

Table A1. Biological transfer coefficients (BTC), as the ratio between the content of an element in aboveground organs and the roots; and biological accumulation coefficients (BAC), as the ratio between the total content of an element in the plant and the associated soil samples.
C. sativumL. angustifoliaS. sclareaL. officinaleA. graveolens
BTCBACBTCBACBTCBACBTCBACBTCBAC
Al1.60.045.50.34.70.11.00.040.30.0
As2.20.23.80.54.10.20.60.050.70.1
Ba1.00.23.60.750.62.60.120.1
Br1354471.327221246
Ca5.62.42.62.663113123
Ce1.10.0470.40.50.03
Cl18127612935463368101
Co1.90.140.350.12.10.11.30.1
Cr1.00.0430.450.150.1
Cs1.70.160.250.11.60.11.00.05
Eu1.60.150.230.1
Fe1.70.140.350.120.10.90.0
Hf1.60.0490.480.11.80.020.10.0
K496510813874
La1.70.160.450.11.20.030.40.04
Mg5.70.61.60.960.560.670.5
Mn70.340.580.250.260.3
Na1.30.40.90.70.80.30.11.12.35
Nd1.60.160.4 1.10.1
Ni50.11.40.440.150.21.60.1
Rb40.360.390.490.850.3
Sb30.21.50.530.220.21.80.1
Sc1.50.0560.350.10.90.040.50.04
Se5 3 5 6 4
Sm1.60.0560.360.11.10.030.50.04
Sr1.71.732.85253104
Ta1.30.0490.360.11.60.030.40.04
Tb1.90.0560.340.11.10.030.60.04
Th1.80.180.360.11.40.030.50.04
Ti2.30.070.460.1
U0.70.12.10.4 0.10.1
V1.30.041.50.440.10.60.040.30.04
W1.20.23.40.5
Yb1.00.070.350.1
Zn62.21.1341.37291.5
Zr0.90.04100.450.1

References

  1. World Health Organization. Drug Information. Herbal Medicines; World Health Organization: Geneva, Switzerland, 2002; Volume 16. [Google Scholar]
  2. Fabricant, D.S.; Farnsworth, N.R. The value of plants used in traditional medicine for drug discovery. Environ. Health Perspect. 2001, 109, 69–75. [Google Scholar]
  3. Basch, E.; Foppa, I.; Liebowitz, R.; Nelson, J.; Smith, M.; Sollars, D.; Ulbricht, C. Monograph from National Standard: Lavender (Lavandula angustifolia Miller). J. Herb. Pharm. 2004, 4, 63–78. [Google Scholar]
  4. Leung, A.Y.; Foster, S. Encyclopedia of Common Natural Ingredients Used in Food, Drugs and Cosmetics, 2nd ed.; John Wiley & Sons: New York, NY, USA, 1996. [Google Scholar] [CrossRef]
  5. Russo, A.; Formisano, C.; Rigano, D.; Senatore, F.; Delfine, S.; Cardile, V.; Rosselli, S.; Bruno, M. Chemical composition and anticancer activity of essential oils of Mediterranean sage (Salvia officinalis L.) grown in different environmental conditions. Food Chem. Toxicol. 2013, 55, 42–47. [Google Scholar] [CrossRef] [PubMed]
  6. Tutin, T.G.; Heywood, V.H.; Burges, N.A.; Moore, D.M.; Valentine, D.H.; Walters, S.M.; Webb, D.A. Flora Europaea; Cambridge University Press: Cambridge, UK, 1968; Volume 2. [Google Scholar]
  7. Nurzyńska-Wiedrak, R. Essential oil composition of the coriander (C. sativum) herb depending on the development stage. Acta Agrobot. 2013, 66, 53–60. [Google Scholar] [CrossRef]
  8. Karpiński, T.M. Essential Oils of Lamiaceae Family Plants as Antifungals. Biomolecules 2020, 10, 103. [Google Scholar] [CrossRef] [Green Version]
  9. Nieto, G. Biological Activities of Three Essential Oils of the Lamiaceae Family. Medicines 2017, 4, 63. [Google Scholar] [CrossRef] [Green Version]
  10. Vieira, J.N.; Gonçalves, C.L.; Villarreal, J.P.V.; Gonçalves, V.M.; Lund, R.G.; Freitag, R.A.; Silva, A.F.; Nascente, P.S. Chemical composition of essential oils from the Apiaceae family, cytotoxicity, and their antifungal activity in vitro against candida species from oral cavity. Braz. J. Biol. 2019, 79, 432–437. [Google Scholar] [CrossRef] [Green Version]
  11. Khoury, M.; Beyrouthy, M.E.; Eparvier, V.; Ouaini, N.; Stien, D. Chemical diversity and antimicrobial activity of the essential oils of four Apiaceae species growing wild in Lebanon. J. Essent. Oil Res. 2017, 30, 25–31. [Google Scholar] [CrossRef]
  12. Denner, S.S. Lavandula angustifolia Miller: English lavender. Holist. Nurs. Pract. 2009, 23, 57–64. [Google Scholar] [CrossRef]
  13. Prusinowska, R.; Smigielski, K. Composition, biological activity and therapeutic effects of lavander (Lavandula angustifolia L.). A review. Herba Polonica 2014, 60, 56–66. [Google Scholar] [CrossRef] [Green Version]
  14. Schiller, C.; Schiller, D. 500 Formulas for Aromatherapy: Mixing Essential Oils for Every Use; Sterling Publications: New York, NY, USA, 1994. [Google Scholar]
  15. Baratta, M.T.; Dorman, H.J.D.; Deans, S.G.; Biondi, D.M.; Ruberto, G. Chemical Composition, Antimicrobial and Antioxidative Activity of Laurel, Sage, Rosemary, Oregano and Coriander Essential Oils. J. Essent. Oil Res. 1998, 10, 618–627. [Google Scholar] [CrossRef]
  16. Kong, B.H.; Zhang, H.Y.; Xiong, Y.L. Antioxidant activity of spice extracts in a liposome system and in cooked pork patties and the possible mode of action. Meat Sci. 2010, 85, 772–778. [Google Scholar] [CrossRef]
  17. Preedy, V.R. Essential Oils in Food Preservation, Flavor and Safety; Elsevier: Oxford, UK, 2016; pp. 539–549. [Google Scholar]
  18. Da Porto, C.; Decorti, D.; Kikic, I. Flavour compounds of Lavandula angustifolia L. to use in food manufacturing: Comparison of three different extraction methods. Food Chem. 2009, 112, 1072–1078. [Google Scholar] [CrossRef]
  19. Al-Harbi, N.A.; Al Attar, N.M.; Hikal, D.M.; Mohamed, S.E.; Latef, A.A.H.; Ibrahim, A.A.; Abdein, M.A. Evaluation of Insecticidal Effects of Plants Essential Oils Extracted from Basil, Black Seeds and Lavender against Sitophilus oryzae. Plants 2021, 10, 829. [Google Scholar] [CrossRef]
  20. Samarth, R.M.; Samarth, M.; Matsumoto, Y. Medicinally important aromatic plants with radioprotective activity. Futur. Sci. OA 2017, 3, FSO247. [Google Scholar] [CrossRef] [Green Version]
  21. Mukherje, P.K. GMP for Indian Systems of Medicine. In GMP for Botanicals: Regulatory and Quality Issues on Phytomedicines; Mukherjee, P.K., Verpoorte, R., Eds.; Business Horizons: New Delhi, India, 2003; pp. 99–112. ISBN 81-900788-5. [Google Scholar]
  22. Angelova, V.R.; Ivanov, K.; Ivanova, R. Heavy Metal Content in Plants from Family Lamiaceae Cultivated in an Industrially Polluted Region. J. Herbs Spices Med. Plants 2006, 11, 37–46. [Google Scholar] [CrossRef]
  23. Zinicovscaia, I.; Gundorina, S.; Vergel, K.; Grozdov, D.; Ciocarlan, A.; Aricu, A.; Dragalin, I.; Ciocarlan, N. Elemental analysis of Lamiaceae medicinal and aromatic plants growing in the Republic of Moldova using neutron activation analysis. Phytochem. Lett. 2020, 35, 119–127. [Google Scholar] [CrossRef]
  24. Aggett, P.J. Physiology and metabolism of essential trace elements: An outline. Clin. Endocrinol. Metab. 1985, 14, 513–543. [Google Scholar] [CrossRef]
  25. Tsuji, P.A.; Canter, J.A.; Rosso, L.E. Trace Minerals and Trace Elements. In Encyclopedia of Food and Health; Elsevier BV: Amsterdam, The Netherlands, 2016; pp. 331–338. [Google Scholar]
  26. Arpadjan, S.; Çelik, G.; Taşkesen, S.; Gucer, S. Arsenic, cadmium and lead in medicinal herbs and their fractionation. Food Chem. Toxicol. 2008, 46, 2871–2875. [Google Scholar] [CrossRef]
  27. Ernst, E. Heavy metals in traditional Indian remedies. Eur. J. Clin. Pharmacol. 2002, 57, 891–896. [Google Scholar] [CrossRef]
  28. Ernst, E. Toxic heavy metals and undeclared drugs in Asian herbal medicines. Trends Pharmacol. Sci. 2002, 23, 136–139. [Google Scholar] [CrossRef]
  29. Markert, B. Establishing of “Reference Plant” for inorganic characterization of different plant species by chemical fingerprinting. Water Air Soil Pollut. 1992, 64, 533–538. [Google Scholar] [CrossRef]
  30. Stefanowicz, A.M.; Stanek, M.; Woch, M.W.; Kapusta, P. The accumulation of elements in plants growing spontaneously on small heaps left by the historical Zn-Pb ore mining. Environ. Sci. Pollut. Res. 2016, 23, 6524–6534. [Google Scholar] [CrossRef] [PubMed] [Green Version]
  31. Klink, A.; Macioł, A.; Wisłocka, M.; Krawczyk, J. Metal accumulation and distribution in the organs of Typha latifolia L. (cattail) and their potential use in bioindication. Limnologica 2013, 43, 164–168. [Google Scholar] [CrossRef]
  32. Wei, B.; Yu, J.; Cao, Z.; Meng, M.; Yang, L.; Chen, Q. The Availability and Accumulation of Heavy Metals in Greenhouse Soils Associated with Intensive Fertilizer Application. Int. J. Environ. Res. Public Health 2020, 17, 5359. [Google Scholar] [CrossRef]
  33. Frontasyeva, M.V. Neutron activation analysis in the life sciences. Phys. Part. Nucl. 2011, 42, 332–378. [Google Scholar] [CrossRef]
  34. Pavlov, S.S.; Dmitriev, A.Y.; Frontasyeva, M.V. Automation system for neutron activation analysis at the reactor IBR-2, Frank Laboratory of Neutron Physics, Joint Institute for Nuclear Research, Dubna, Russia. J. Radioanal. Nucl. Chem. 2016, 309, 27–38. [Google Scholar] [CrossRef] [Green Version]
  35. Markert, B.; Fränzle, S.; Wünschmann, S. Chemical Evolution—The Biological System of the Elements, 1st ed.; Springer Science and Business Media LLC: Berlin/Heidelberg, Germany, 2015. [Google Scholar]
  36. Mladenova, T.; Stoyanov, P.; Todorov, K.; Davcheva, D.; Kirova, G.; Deneva, T.; Gyuzeleva, D.; Mladenov, R.; Bivolarska, A. Phytochemical and Biological Traits of Endemic Betonica bulgarica (Lamiaceae). Separations 2021, 8, 11. [Google Scholar] [CrossRef]
  37. Bennouna, M.A.; Belaqziz, R.; Arjouni, M.Y.; Romane, A. Quantitative analysis of some oligo-elements and heavy metals in some species of Thymus from Morocco. Nat. Prod. Res. 2013, 27, 1784–1788. [Google Scholar] [CrossRef] [PubMed]
  38. Tunçtürk, M.; Özgökçe, F. Chemical composition of some Apiaceae plants commonly used inherby cheese in Eastern Anatolia. Turk. J. Agric. For. 2015, 39, 55–62. [Google Scholar] [CrossRef]
  39. Zaidi, J.H.; Qureshi, I.H.; Arif, M.; Fatima, I. Trace element analysis of food spices by inaa: II. Solanaceae, Liliaceae, Zingiberaceae and Apiaceae Families. Int. J. Environ. Anal. Chem. 1992, 48, 33–40. [Google Scholar] [CrossRef]
  40. Saleh-E-In, M.M.; Sultana, N.; Rahim, M.M.; Ahsan, M.A.; Bhuiyan, M.N.H.; Hossain, M.N.; Rahman, M.M.; Roy, S.K.; Islam, M.R. Chemical composition and pharmacological significance of Anethum sowa L. Root. BMC Complement. Altern. Med. 2017, 17, 1–17. [Google Scholar] [CrossRef] [PubMed] [Green Version]
  41. Goldhaber, S.B. Trace element risk assessment: Essentiality vs. toxicity. Regul. Toxicol. Pharmacol. 2003, 38, 232–242. [Google Scholar] [CrossRef]
  42. Kabata-Pendias, A.; Pendias, H. Trace Elements in Soils and Plants Trace Elements in Soils and Plants, 3rd ed.; CRC Press: Boca Raton, FL, USA, 2001. [Google Scholar]
  43. Lozak, A.; Soytyk, K.; Ostapczuk, P.; Fijayek, Z. Determination of selected trace elements in herbs and their infusions. Sci. Total Environ. 2002, 289, 33–40. [Google Scholar] [CrossRef]
  44. World Health Organization. WHO Monographs on Selected Medicinal Plants; World Health Organization: Geneva, Switzerland, 1999; Volume 1, Available online: https://apps.who.int/iris/bitstream/handle/10665/42052/9241545178.pdf?sequence=1 (accessed on 12 April 2021).
  45. World Health Organization. WHO Guidelines for Assessing Quality of Herbal Medicines with Reference to Contaminants and Residues. 2007. Available online: https://apps.who.int/iris/handle/10665/43510 (accessed on 12 April 2021).
  46. NSF. International Draft Standard NSF/ANSI 173-2001: Dietary Supplements; National Sanitation Foundation International: Ann Arbor, MI, USA, 2001. [Google Scholar]
  47. Council Directive 98/83/EC of 3 November 1998 on the Quality of Water Intended for Human Consumption. Available online: https://eur-lex.europa.eu/legal-content/EN/TXT/?uri=CELEX:31998L0083 (accessed on 12 April 2021).
  48. Commission Directive 2003/40/EC of 16 May 2003 Establishing the List, Concentration Limits and Labelling Requirements for the Constituents of Natural Mineral Waters and the Conditions for Using Ozone-Enriched Air for the Treatment of Natural Mineral Waters and Spring Waters. Available online: https://eur-lex.europa.eu/legal-content/en/ALL/?uri=CELEX%3A32003L0040 (accessed on 12 April 2021).
  49. Hajeb, P.; Sloth, J.J.; Shakibazadeh, S.; Mahyudin, N.A.; Afsah-Hejri, L. Toxic Elements in Food: Occurrence, Binding, and Reduction Approaches. Compr. Rev. Food Sci. Food Saf. 2014, 13, 457–472. [Google Scholar] [CrossRef]
  50. Commission Regulation (EC) 1881/2006 of 19 December 2006 Setting Maximum Levels for Certain Contaminants in Food Stuff. Available online: https://eur-lex.europa.eu/legal-content/EN/ALL/?uri=CELEX%3A32006R1881 (accessed on 12 April 2021).
  51. EFSA Panel on Contaminants in the Food Chain (CONTAM). Scientific Opinion on Arsenic in Food. EFSA J. 2009, 7. [Google Scholar] [CrossRef]
  52. Mahran, G.H.; Kadry, H.A.; Isaac, Z.G.; Thabet, C.K.; Al-Azizi, M.M.; El-Olemy, M.M. Investigation of diuretic drug plants. 1-Phytochemical screening and pharmacological evaluation of A. graveolens, Apium graveolens L., Daucus carota L. and Eruca sativa Mill. Phytother. Res. 1991, 5, 169–172. [Google Scholar] [CrossRef]
  53. Yarnell, E. Botanical medicines for the urinary tract. World J. Urol. 2002, 20, 285–293. [Google Scholar] [CrossRef] [PubMed]
  54. Segebrecht, S.; Schilcher, H. Ligustilide: Guiding Component for Preparations of Levisticum officinale Roots. Planta Med. 1989, 55, 572–573. [Google Scholar] [CrossRef]
  55. Goodarzi, M.T.; Khodadadi, I.; Tavilani, H.; Oshaghi, E.A. The Role of Anethum graveolens L. (Dill) in the Management of Diabetes. J. Trop. Med. 2016, 2016, 1–11. [Google Scholar] [CrossRef]
  56. Szentmihályi, K.; Kéry, Á.; Then, M.; Lakatos, B.; Sándor, Z.; Vinkler, P. Potassium-sodium ratio for the characterization of medicinal plant extracts with diuretic activity. Phytother. Res. 1998, 12, 163–166. [Google Scholar] [CrossRef]
  57. Prakash, V.; Narayana, Y.; Saxena, M.K.; Deb, S.B.; Nagar, B.K.; Ramakumar, K.L. Study of transfer of trace elements from soil to medicinal plants in the environment of Mangalore. J. Radioanal. Nucl. Chem. 2011, 290, 103–107. [Google Scholar] [CrossRef]
  58. Özcan, M.M.; Ünver, A.; Uçar, T.; Arslan, D. Mineral content of some herbs and herbal teas by infusion and decoction. Food Chem. 2008, 106, 1120–1127. [Google Scholar] [CrossRef]
  59. Matic, N.; Jena, V.; Sinha, D.; Ghosh, S.; Aditi, P. Accumulation and Translocation of Heavy Metals in Coriandrum sativum. J. Appl. Chem. 2019, 8, 850–855. [Google Scholar]
  60. Angelova, V.; Grekov, D.; Kisyov, V.; Ivanov, K. Potential of lavender (Lavandula vera L.) for phytoremediation of soils contaminated with heavy metals. Int. J. Biol. Biomol. Agric. Food Biotechnol. Eng. 2015, 9, 465–472. [Google Scholar]
  61. Zheljazkov, V.D.; Astatkie, T. Effect of Plant Species and Benomyl on Lead Concentration and Removal from Lead-enriched Soil. HortScience 2011, 46, 1604–1607. [Google Scholar] [CrossRef] [Green Version]
  62. Angelova, V.; Ivanova, R.; Todorov, G.; Ivanov, K. Potential of S. sclarea for phytoremediation of soils contaminated with heavy metals. Int. J. Biol. Biomol. Agric. Food Biotechnol. Eng. 2016, 10, 754–764. [Google Scholar]
  63. Chand, S.; Yaseen, M.; Rajkumari; Patra, D.D. Application of Heavy Metal Rich Tannery Sludge on Sustainable Growth, Yield and Metal Accumulation by Clarysage (Salvia sclarea L.). Int. J. Phytoremediation 2015, 17, 1171–1176. [Google Scholar] [CrossRef]
  64. Caunii, A.; Negrea, A.; Pentea, M.; Samfira, I.; Motoc, M.; Butnariu, M. Mobility of Heavy metals from soil in the two species of the aromatic plants. Rev. Chim. 2015, 66, 382–386. [Google Scholar]
  65. De Caritat, P.; Reimann, C.; Bastrakov, E.; Bowbridge, D.; Boyle, P.; Briggs, S.; Brown, D.; Brown, M.; Brownlie, K.; Burrows, P.; et al. Comparing results from two continental geochemical surveys to world soil composition and deriving Predicted Empirical Global Soil (PEGS2) reference values. Earth Planet. Sci. Lett. 2012, 319–320, 269–276. [Google Scholar] [CrossRef]
  66. Tóth, G.; Hermann, T.; da Silva, M.R.; Montanarella, L. Heavy metals in agricultural soils of the European Union with implications for food safety. Environ. Int. 2016, 88, 299–309. [Google Scholar] [CrossRef] [PubMed]
  67. Anonymous. Soil Protection Procedures during Agricultural Practice; Decision No. 1157/13.10.2008 of the Government of the Republic of Moldova; Official Monitor of Moldova: Chisinau, Moldova, 2008; pp. 193–194. (In Romanian)
  68. Zinicovscaia, I.; Duliu, O.G.; Culicov, O.A.; Frontasyeva, M.V.; Sturza, R. Major and trace elements distribution in Moldavian soils. Rom. Rep. Phys. 2018, 70, 701. [Google Scholar]
  69. Zinicovscaia, I.; Ciocarlan, A.; Lupascu, L.; Aricu, A.; Dragalin, I.; Ciocarlan, N.; Yushin, N. Chemical analysis of Tanacetum corymbosum (L.) Sch. Bip. using neutron activation analysis. J. Radioanal. Nucl. Chem. 2019, 321, 349–354. [Google Scholar] [CrossRef]
  70. Dakora, F.D.; Phillips, D.A. Root exudates as mediators of mineral acquisition in low-nutrient environments. Plant Soil 2002, 245, 35–47. [Google Scholar] [CrossRef]
Figure 1. K/Na ratio for each of the studied morphological parts of the medicinal plant species: Anethum graveolens L., Coriandrum sativum L., Lavandula angustifolia Mill., Levisticum officinale W.D.J. Koch, and Salvia sclarea L.
Agronomy 11 01011 g001
Table 1. Mineral content of Coriandrum sativum L.: roots, stalks, leaves, and inflorescences (mg/kg). Reference Plant values by Markert [35].
RootsStalksLeavesInflorescencesRP
Al937 ± 4767 ± 3351 ± 181060 ± 5380
As0.42 ± 0.0290.316 ± 0.0250.267 ± 0.0190.33 ± 0.030.1
Ba29.7 ± 4.29.9 ± 1.54.3 ± 0.714.5 ± 2.240
Br5.3 ± 0.310.4 ± 0.528 ± 1.432.5 ± 1.34
Ca5490 ± 7144520 ± 5426800 ± 81619,500 ± 234010,000
Ce1.16 ± 0.13<0.264<0.41.32 ± 0.150.5
Cl342 ± 27576 ± 403060 ± 2142680 ± 1882000
Co0.31 ± 0.0190.072 ± 0.0090.195 ± 0.0140.334 ± 0.0170.2
Cr1.54 ± 0.2<0.491.48 ± 0.3<0.731.5
Cs0.113 ± 0.0060.024 ± 0.0020.048 ± 0.0030.12 ± 0.0050.2
Eu0.0254 ± 0.0070.0138 ± 0.005<0.01470.026 ± 0.0080.008
Fe578 ± 3595 ± 7245 ± 17648 ± 32150
Hf0.16 ± 0.010.0227 ± 0.0040.056 ± 0.0060.178 ± 0.0110.005
K33,400 ± 233839,700 ± 357345,600 ± 410454,900 ± 384319,000
La0.59 ± 0.0350.081 ± 0.0160.147 ± 0.0260.76 ± 0.0530.2
Mg2180 ± 2401240 ± 1614620 ± 3706520 ± 4562000
Mn18.8 ± 1.59.4 ± 0.837.5 ± 2.692 ± 6200
Na1120 ± 90446 ± 36315 ± 25662 ± 53150
Nd0.67 ± 0.13<0.405<0.651.1 ± 0.280.2
Ni<1.18<0.423 ± 0.32.04 ± 0.31.5
Rb7.2 ± 1.26.4 ± 1.112.3 ± 2.19.3 ± 1.650
Sb0.037 ± 0.0040.023 ± 0.0030.03 ± 0.0030.056 ± 0.0060.1
Sc0.2 ± 0.0080.0246 ± 0.0020.072 ± 0.0040.2 ± 0.0080.02
Se0.162 ± 0.0210.165 ± 0.020.336 ± 0.0370.3 ± 0.0330.02
Sm0.12 ± 0.010.0154 ± 0.0010.036 ± 0.0030.14 ± 0.0110.04
Sr68 ± 6.139 ± 3.516.3 ± 1.657 ± 5.150
Ta0.017 ± 0.0010.0019 ± 0.0004<0.00230.02 ± 0.0010.001
Tb0.014 ± 0.0010.003 ± 0.0010.005 ± 0.0010.019 ± 0.0010.008
Th0.226 ± 0.0110.027 ± 0.0020.067 ± 0.0030.314 ± 0.0160.005
Ti<66<34.6<73138 ± 34.55
U0.085 ± 0.005<0.0040.016 ± 0.0020.04 ± 0.0050.01
V1.75 ± 0.180.091 ± 0.020.465 ± 0.111.7 ± 0.170.5
W0.15 ± 0.020.074 ± 0.015<0.0890.104 ± 0.030.2
Yb0.06 ± 0.011<0.0120<0.0290.06 ± 0.0140.02
Zn22 ± 1.320.4 ± 1.272 ± 3.639 ± 250
Zr7.3 ± 1.9<1.5<2.166.8 ± 1.80.1
Table 2. Mineral content of Lavandula angustifolia Mill.: roots, stalks, leaves, and inflorescences (mg/kg). Reference Plant values by Markert [35].
RootsStalksLeavesInflorescencesRP
Al2410 ± 1212730 ± 1376790 ± 3403810 ± 19180
As0.78 ± 0.050.65 ± 0.051.3 ± 0.091.01 ± 0.070.1
Ba57 ± 664 ± 766 ± 974 ± 1040
Br11.5 ± 0.614.7 ± 0.716.4 ± 0.819.2 ± 14
Ca11,100 ± 13327400 ± 8887810 ± 93713,200 ± 158410,000
Ce3.1 ± 0.23.8 ± 0.311 ± 0.85.9 ± 0.40.5
Cl956 ± 762260 ± 1581470 ± 1032080 ± 1462000
Co0.89 ± 0.040.71 ± 0.041.63 ± 0.071 ± 0.040.2
Cr8.1 ± 0.74.95 ± 0.512 ± 1.17 ± 0.61.5
Cs0.176 ± 0.010.21 ± 0.010.5 ± 0.020.3 ± 0.010.2
Eu0.044 ± 0.009<0.02040.152 ± 0.0150.051 ± 0.010.008
Fe1890 ± 951450 ± 873420 ± 1712060 ± 103150
Hf0.39 ± 0.0230.59 ± 0.031.78 ± 0.091.13 ± 0.060.005
K14,000 ± 112023,600 ± 165229,300 ± 205129,100 ± 203719,000
La1.52 ± 0.091.87 ± 0.114.7 ± 0.22.7 ± 0.20.2
Mg8080 ± 5663130 ± 3764770 ± 5254900 ± 3432000
Mn58 ± 469 ± 498 ± 785 ± 6200
Na2250 ± 180424 ± 34941 ± 75558 ± 45150
Nd1.3 ± 0.21.82 ± 0.44.4 ± 0.62.16 ± 0.30.2
Ni7.3 ± 0.62.44 ± 0.35.4 ± 0.52.5 ± 0.31.5
Rb4.3 ± 0.76 ± 113.2 ± 28 ± 150
Sb0.198 ± 0.0160.07 ± 0.0060.128 ± 0.0120.093 ± 0.0080.1
Sc0.4 ± 0.010.51 ± 0.021.27 ± 0.040.72 ± 0.020.02
Se0.142 ± 0.0240.086 ± 0.0220.095 ± 0.0350.21 ± 0.0320.02
Sm0.283 ± 0.020.37 ± 0.030.9 ± 0.070.5 ± 0.040.04
Sr80 ± 767 ± 660 ± 592 ± 850
Ta0.0295 ± 0.0010.051 ± 0.0020.14 ± 0.0060.076 ± 0.0030.001
Tb0.041 ± 0.0020.042 ± 0.0020.124 ± 0.0050.069 ± 0.0030.008
Th0.39 ± 0.020.65 ± 0.031.65 ± 0.080.93 ± 0.050.005
Ti228 ± 41331 ± 50803 ± 88447 ± 585
U0.306 ± 0.0120.14 ± 0.0070.345 ± 0.0140.17 ± 0.0090.01
V13.3 ± 0.84 ± 0.310.2 ± 0.65.7 ± 0.40.5
W0.197 ± 0.0280.094 ± 0.0170.244 ± 0.0320.324 ± 0.0390.2
Yb0.154 ± 0.020.193 ± 0.020.55 ± 0.040.33 ± 0.030.02
Zn96 ± 531 ± 238 ± 238.5 ± 250
Zr12.6 ± 320.5 ± 565 ± 1644 ± 110.1
Table 3. Mineral content of Salvia sclarea L.: roots, stalks, leaves, and inflorescences (mg/kg). Reference Plant values by Markert [35].
RootsStalksLeavesInflorescencesRP
Al975 ± 49292 ± 154070 ± 204193 ± 1080
As0.276 ± 0.0190.192 ± 0.0170.78 ± 0.0470.146 ± 0.010.1
Ba41 ± 677 ± 1177 ± 1153 ± 740
Br2.14 ± 0.12.26 ± 0.16.4 ± 0.36.7 ± 0.34
Ca6460 ± 7759450 ± 113417,700 ± 194711,000 ± 132010,000
Ce1.32 ± 0.1320.315 ± 0.0760.4 ± 0.032<0.2640.5
Cl67 ± 852 ± 789 ± 1279 ± 82000
Co0.29 ± 0.020.158 ± 0.011 ± 0.040.175 ± 0.010.2
Cr1.63 ± 0.2<1.25.9 ± 0.52.27 ± 0.31.5
Cs0.101 ± 0.0050.047 ± 0.0030.39 ± 0.0160.045 ± 0.0030.2
Eu0.022 ± 0.0040.0142 ± 0.0050.053 ± 0.011<0.01420.008
Fe540 ± 27201 ± 122320 ± 139205 ± 16150
Hf0.113 ± 0.0080.045 ± 0.0050.79 ± 0.0470.047 ± 0.0060.005
K13,800 ± 96632,500 ± 292559,600 ± 476848,100 ± 432919,000
La0.54 ± 0.0320.2 ± 0.0162.4 ± 0.0960.146 ± 0.0120.2
Mg1740 ± 2261970 ± 1974120 ± 4124180 ± 2932000
Mn15 ± 1.213 ± 178 ± 530 ± 2200
Na873 ± 70114 ± 10502 ± 3099 ± 4150
Nd<0.45<0.4451.58 ± 0.3<0.490.2
Ni1.28 ± 0.2<0.453.3 ± 0.41.18 ± 0.21.5
Rb4.7 ± 0.88.7 ± 1.518.5 ± 3.116.8 ± 2.950
Sb0.048 ± 0.0050.0264 ± 0.0030.104 ± 0.0070.0336 ± 0.0030.1
Sc0.19 ± 0.0080.065 ± 0.0030.81 ± 0.0240.055 ± 0.0030.02
Se0.137 ± 0.0190.136 ± 0.0190.297 ± 0.0330.294 ± 0.0260.02
Sm0.103 ± 0.0080.033 ± 0.0030.56 ± 0.050.026 ± 0.0030.04
Sr36.4 ± 3.354 ± 4.974 ± 5.952 ± 4.250
Ta0.013 ± 0.0010.0049 ± 0.00050.074 ± 0.0030.005 ± 0.0010.001
Tb0.0143 ± 0.0010.0041 ± 0.0010.056 ± 0.0030.00305 ± 0.0010.008
Th0.148 ± 0.0070.067 ± 0.0030.78 ± 0.0310.054 ± 0.0030.005
Ti<60<48300 ± 48<495
U0.055 ± 0.0030.015 ± 0.0010.153 ± 0.0080.0157 ± 0.0020.01
V2.02 ± 0.20.46 ± 0.076.5 ± 0.50.31 ± 0.060.5
W<0.030.041 ± 0.0080.18 ± 0.0270.063 ± 0.010.2
Yb0.0415 ± 0.01<0.02240.214 ± 0.024<0.02540.02
Zn17.5 ± 1.115.8 ± 0.927 ± 1.627.3 ± 1.650
Zr5.8 ± 1.6<1.831 ± 7.8<2.270.1
Table 4. Mineral content of Levisticum officinale W.D.J. Koch: roots, stalks, leaves, and inflorescences (mg/kg). Reference Plant values by Markert [35].
RootsStalksLeavesInflorescencesRP
Al1040 ± 52266 ± 13255 ± 13473 ± 2480
As0.237 ± 0.02<0.0690.142 ± 0.02<0.1130.1
Ba12 ± 1.813.2 ± 1.510.1 ± 1.57.8 ± 1.240
Br10.6 ± 0.4139 ± 5.670 ± 2.882 ± 3.34
Ca4410 ± 52911,000 ± 132022,000 ± 242014,000 ± 168010,000
Ce0.91 ± 0.12<0.36<0.405<0.750.5
Cl377 ± 308110 ± 5683570 ± 2505590 ± 3912000
Co0.233 ± 0.020.13 ± 0.010.14 ± 0.010.21 ± 0.010.2
Cr1.7 ± 0.2<0.652.04 ± 0.36.4 ± 0.61.5
Cs0.122 ± 0.0050.058 ± 0.0030.068 ± 0.0040.065 ± 0.0040.2
Eu<0.0133<0.015<0.016<0.01860.008
Fe600 ± 36222 ± 18320 ± 22859 ± 52150
Hf0.059 ± 0.006<0.02830.0405 ± 0.0060.068 ± 0.0080.005
K10,600 ± 84845,100 ± 405939,500 ± 355551,100 ± 408819,000
La0.49 ± 0.040.41 ± 0.07<0.0530.16 ± 0.050.2
Mg2000 ± 2801830 ± 2934270 ± 3425010 ± 4012000
Mn18.7 ± 112.5 ± 238.5 ± 337 ± 3200
Na5640 ± 338285 ± 17245 ± 10143 ± 9150
Nd<0.36<0.455<0.61<0.680.2
Ni1.27 ± 0.24<0.72.4 ± 0.344.5 ± 0.51.5
Rb8.7 ± 1.521 ± 3.624 ± 4.137.5 ± 6.450
Sb0.064 ± 0.0050.024 ± 0.0030.036 ± 0.0030.069 ± 0.0060.1
Sc0.21 ± 0.0080.065 ± 0.0040.054 ± 0.0040.066 ± 0.0040.02
Se0.43 ± 0.040.33 ± 0.031.1 ± 0.091 ± 0.080.02
Sm0.107 ± 0.0110.034 ± 0.0030.044 ± 0.0040.039 ± 0.0050.04
Sr51 ± 4.186 ± 6.9109 ± 7.676 ± 6.150
Ta0.011 ± 0.0010.005 ± 0.0010.005 ± 0.0010.008 ± 0.0010.001
Tb0.010 ± 0.0010.0035 ± 0.00040.003 ± 0.0020.004 ± 0.0010.008
Th0.148 ± 0.0070.058 ± 0.0030.068 ± 0.0030.078 ± 0.0040.005
Ti<76<103<86<965
U0.138 ± 0.0060.014 ± 0.003<0.0085<0.01180.01
V2.1 ± 0.2<0.4050.46 ± 0.110.72 ± 0.140.5
W<0.055<0.104<0.072<0.1580.2
Yb0.055 ± 0.013<0.024<0.031<0.0340.02
Zn17.2 ± 119.5 ± 1.247 ± 2.853 ± 3.250
Zr<2.07<2.4<2.64<3.20.1
Table 5. Mineral content of Anethum graveolens L.: roots, stalks, leaves, and inflorescences (mg/kg). Reference Plant values by Markert [35].
RootsStalksLeavesInflorescencesRP
Al1600 ± 8098 ± 6400 ± 2049.5 ± 280
As0.46 ± 0.032<0.0770.33 ± 0.1<0.1380.1
Ba15.8 ± 2.412.7 ± 1.917 ± 2.68.1 ± 1.240
Br50 ± 2118 ± 5213 ± 9256 ± 104
Ca3980 ± 4788950 ± 107431,700 ± 34875200 ± 62410,000
Ce2.1 ± 0.189<0.27<0.72<0.390.5
Cl618 ± 491200 ± 842200 ± 1541280 ± 902000
Co0.41 ± 0.0210.09 ± 0.0120.182 ± 0.0150.277 ± 0.0170.2
Cr3 ± 0.3<0.57<0.76<0.721.5
Cs0.14 ± 0.0060.021 ± 0.0020.071 ± 0.0040.041 ± 0.0030.2
Eu0.013 ± 0.005<0.0133<0.017<0.01670.008
Fe813 ± 4969 ± 10416 ± 29244 ± 20150
Hf0.297 ± 0.018<0.0230.042 ± 0.006<0.01720.005
K9230 ± 83113,900 ± 125117,200 ± 172032,600 ± 293419,000
La0.85 ± 0.043<0.0820.38 ± 0.053<0.0930.2
Mg1290 ± 3351670 ± 3016220 ± 4981360 ± 1632000
Mn28.4 ± 219.7 ± 2115 ± 829 ± 2200
Na8510 ± 4269240 ± 3709460 ± 3781160 ± 46150
Nd0.68 ± 0.143<0.37<0.560.76 ± 0.2360.2
Ni2.4 ± 0.31.15 ± 0.2<0.582.7 ± 0.41.5
Rb5.7 ± 14.2 ± 0.76.1 ± 116 ± 350
Sb0.045 ± 0.0040.019 ± 0.0020.036 ± 0.0030.026 ± 0.0030.1
Sc0.286 ± 0.009<0.00640.094 ± 0.0050.048 ± 0.0030.02
Se0.23 ± 0.0230.207 ± 0.0210.33 ± 0.0330.346 ± 0.0310.02
Sm0.17 ± 0.0150.015 ± 0.0020.051 ± 0.0070.026 ± 0.0030.04
Sr43 ± 3104 ± 8226 ± 16110 ± 950
Ta0.027 ± 0.001<0.0020.006 ± 0.0010.004 ± 0.0010.001
Tb0.02 ± 0.001<0.00130.007 ± 0.0010.006 ± 0.0010.008
Th0.31 ± 0.0120.023 ± 0.0020.101 ± 0.0050.046 ± 0.0030.005
Ti131 ± 41<96<130<475
U<0.082<0.015<0.029 ±<0.02260.01
V2.56 ± 0.2<0.230.72 ± 0.1<0.1070.5
W<0.077<0.118<0.2<0.2030.2
Yb0.089 ± 0.013<0.0213<0.0286<0.0290.02
Zn10.4 ± 0.610.8 ± 0.626.6 ± 254 ± 350
Zr10.5 ± 3<1.83<2.2<2.470.1
Table 6. Mineral content of soils: averaged content (n = 2) and measurement uncertainties (mg/kg), coefficients of variation (%). Empirical data for European continental-scale soil surveys (GEMAS Ap) is included for comparison.
ElementsAveraged Content, mg/kgCV, %Compounds, ElementsGEMAS Ap, mg/kg
Al53,700 ± 268513Al2O31050
As8.3 ± 0.55As7
Ba388.5 ± 544Ba391
Br13.95 ± 0.743
Ca15,110 ± 196494CaO120
Ce65 ± 54Ce59
Cl52.5 ± 201
Co13.1 ± 0.58Co9
Cr84.5 ± 79Cr64
Cs5.7 ± 0.225
Dy5.0 ± 1.41
Eu1.15 ± 0.089
Fe31,000 ± 155016Fe2O3360
Gd5 ± 1.314
Hf9.8 ± 0.536
K19,200 ± 15364K2O190
La30 ± 23
Lu0.57 ± 0.1012
Mg22,700 ± 215722MgO100
Mn572 ± 404MnO8
Na5835 ± 46720Na2O79
Nd26 ± 33
Ni47.2 ± 426Ni21
Rb110.5 ± 1912Rb75
Sb0.925 ± 0.0748
Sc10.9 ± 0.314
Sm6.45 ± 0.528
Sr108.5 ± 1020Sr102
Ta1.015 ± 0.0419
Tb0.835 ± 0.03311
Th11.15 ± 0.562Th9
Ti5155 ± 5167TiO262
U2.225 ± 0.0898U
V92 ± 632V70
W1.8 ± 0.22
Yb3.62 ± 0.2916
Zn70 ± 420Zn62
Zr352.5 ± 8638Zr263
Publisher’s Note: MDPI stays neutral with regard to jurisdictional claims in published maps and institutional affiliations.

