Article

Sustainable Agronomic Valorization of Unsulfured Molasses and Defatted Soybean Meal as an Optimized Formulation of Bio-Organic Fertilizer Enriched with High Cell Density P-Solubilizing Bacteria

by
Muhamad Aidilfitri Mohamad Roslan
1,
Izzalan Sohedein
1,
Puan Sheau Ling
1,
Zulfazli M. Sobri
1,
Ali Tan Kee Zuan
2,
Sim Choon Cheak
3 and
Nor Aini Abdul Rahman
1,*
1
Department of Bioprocess Technology, Faculty of Biotechnology and Biomolecular Sciences, University Putra Malaysia, Serdang 43400, Selangor, Malaysia
2
Department of Land Management, Faculty of Agriculture, University Putra Malaysia, Serdang 43400, Selangor, Malaysia
3
R&D Center, Sime Darby Plantation Research Sdn. Bhd., Carey Island 42960, Selangor, Malaysia
*
Author to whom correspondence should be addressed.
Submission received: 5 April 2021 / Revised: 8 May 2021 / Accepted: 11 May 2021 / Published: 18 May 2021
(This article belongs to the Special Issue Development and Application of Sustainable Organic Fertilizer)

Abstract

:
The application of plant beneficial bioinoculants such as phosphate solubilizing bacteria is a sustainable approach to expanding crop performance in agriculture. However, bioinoculant strains, particularly non-sporulating bacteria are often exposed to detrimental conditions throughout the production process and a long period of storage. This will negatively influence their viable cell density and eventually limit its efficacy in the field. To overcome such a scenario, an optimal formulation of biofertilizer should be prioritized. In this report, a sustainable valorization of molasses and defatted soybean meal as formulation of biofertilizer enriched with Enterobacter hormaechei 40a was proposed. Through the two-level factorial design and central composite design, the optimal formulation and fermentation conditions of bio-organic fertilizer to achieve maximum cell density of strain 40a were achieved. The highest cell density of strain 40a in the optimized molasses-DSM (OMD) medium was 12.56 log CFU/mL after 24 h which was 99.7% accuracy towards the predicted value. Interestingly, the solubilized P was increased by 62.4% in the OMD medium (174.07 µg/mL P) as compared to the standard P medium (65.38 µg/mL P). The shelf life of strain 40a after 180 days of storage was improved significantly around 10 log CFU/mL, when the OMD medium was amended with 0.1% sodium alginate. The strategy described here offers opportunities for agronomic formulation and large-scale bio-organic fertilizer production in the agriculture industry.

1. Introduction

In the new global agricultural system, biofertilizer technology has become a pivotal subject in crop productivity enrichment. Aside from the potential of reducing synthetic agrochemicals input, the technology is profoundly tailored with specific plant beneficial microorganisms which have been exploited for crop nutrition and protection. Our previous report has demonstrated the potential of Enterobacter hormaechei 40a with multiple plant growth-promoting (PGP) traits particularly phosphate (P) solubilizing activity to improve the early vegetative growth of okra [1]. However, the efficacy of strain 40a in a long-term greenhouse setting and on the field is still unknown. It has become a real prospective challenge particularly concerning its non-spore forming characteristic. Contrary to its sporulating counterparts, strain 40a such as other Gram-negative bacteria is more susceptible to detrimental conditions occurring during storage, processing, handling and field application [2]. Therefore, an ideal and protective formulation of biofertilizer enriched with strain 40a is of paramount importance.
In many cases, low-grade formulations and the concurrent poor inoculant quality are still considered as the main constraints to the effective, extensive use of biofertilizers [3]. The supply of a high viable cell density to the plant is a prerequisite to achieve an effective colonization rate, which in turn boosts the anticipated PGP effects. Any stages before and during the application of biofertilizers may compromise the viable cell density of inoculants. For instance, a biofertilizer product should exhibit a sufficiently long shelf life, which translates its stability during the whole process of production, packaging, storage and transportation [4]. Obviously, during soil application, inoculant strains are exposed to various biotic (e.g., native microflora and microfauna) and abiotic stress conditions (e.g., soil pH, temperature, salinity) as compared to during pre-application stages [5]. In view of these limitations, the pre-application stages of biofertilizers, i.e., formulation and storage, should be prioritized since the quality of products in this stage can be controlled and monitored periodically. This is especially important to maintain the quality and sustain the efficacy of the establishment of biofertilizers at the target site and to facilitate the optimal application by farmers.
A high-quality biofertilizer formulation must be able to enhance inoculant cell density during production and maintain an adequately prolonged shelf life during storage [6]. In addition to cell growth and preservation, the high nutrient constituents in the formulation are valuable to crop and soil application. Inoculant strains highly depend on the carbon (C) and nitrogen (N) sources included in the growth medium for cell maintenance, reproduction and product synthesis, particularly during the storage phase. Among the most common sources used to produce high inoculant strain biomass are semi-synthetic media such as skim-milk, yeast extract, carboxymethylcellulose, etc. Despite the fact that those commercial sources are inextricably effective and have been widely used, they add up to the capital cost required for production [7]. Alternatively, the C and N elements can be obtained from a wide array of inexpensive and natural biomass including agricultural residues [8,9], industrial waste [10], animal manure [11], etc. While the utilization of various raw materials offers an ecologically sustainable solution to natural waste management, it also represents a tremendous opportunity to recycle nutrients that can nourish the soils, especially those of tropical regions that present low fertility conditions [12].
Molasses is a viscous and dark syrup generated abundantly as a by-product in the sugar beet and sugarcane processing industry [7]. It is a renewable resource that consists of 40 to 60% complex sugars, hence suitable as a C source formulation of biofertilizers. Additionally, it also contains humic substances which are the major components of organic matter beneficial for plant growth [13]. Previously, it has shown potential as a component of biofertilizer for Rhizobium sp. production for leguminous crops [7], apart from the production of high-cell density fed-batch of Saccharomyces cerevisiae culture for bioethanol synthesis [14]. Defatted soybean meal (DSM), an abundant by-product in the soybean oil industry, has been extensively used as protein diets for animals, particularly for poultry and swine [15]. DSM is comprised of 50% protein, 25–30% carbohydrate and other micronutrients [16] which makes it an excellent source of organic N composition in biofertilizers. Recently, it has been utilized in myriads biotechnological application in-vitro, i.e., nisin production by a genetically engineered proteolytic system of Lactococcus lactis, fermented soybean meal production as animal feed using Lactobacillus sp. and Clostridium butyricum, fumaric acid production by Rhizopus oryzae [15,17,18].
Apart from the sufficient cell counts of desired inoculant strains and the nutrient-rich components, liquid biofertilizers also incorporate essential cell protectants or additives in the formulation that promote prolonged shelf-life and protect against adverse conditions [5,19]. The common cell protectants include natural polymers, e.g., Arabic gum, xanthan gum, gelatin, sodium alginate (SA), and synthetic polymers, e.g., polyvinyl alcohol, horticultural oil, glycerol (Gly), monosaccharides and disaccharides such as lactose [20,21]. Thirumal et al. [22] reported that the high viable cell of Rhizobium biofertilizer was observed in SA formulation at room temperature after eight months of storage. Similarly, Rhodopseudomonas palustris was also found to survive well and maintain at around 10 log CFU/mL in a growth medium amended with 0.5% SA [23]. They also reported that the amendment with 1% Gly provided extra protection for bacterial cells against temperature stress.
Therefore, the objectives of this research were to: (1) investigate the biocompatibility of molasses as a basal nutrient composition and screen for supplementary C and N sources required to enhance cell density of strain 40a, (2) develop and optimize a medium using molasses and DSM to achieve maximum cell density of strain 40a, (3) evaluate the P solubilizing activity of strain 40a in the optimized medium, (4) amend the optimized medium with suitable cell protectants to improve shelf-life of strain 40a.

2. Materials and Methods

2.1. Characterization of Molasses and DSM

Unsulfured molasses and DSM were purchased from Anizam Resources Sdn. Bhd., Shah Alam, Selangor, Malaysia. The raw samples were transported to the laboratory and stored in a tight container at room temperature prior to analysis. The pH of the sample was determined using a pH-meter (Sartorius PB-10, Göttingen, Germany) by diluting at a ratio of 1:1 v/v with distilled water at ambient temperature. The moisture content was determined by oven-drying at 70 °C until a constant dry weight was obtained. Sugar profile was determined using High-Performance Liquid Chromatography (HPLC) Waters Alliance 2695 HPLC Separations Module (ELS 2410) System (Waters Corporation, Milford, MA, USA) with Waters 2410 RI detector against standards of 1 mg/mL sucrose, glucose, fructose, galactose, mannose solution (Sigma-Aldrich, Darmstadt, Germany). The dried sample was digested for elemental analysis using concentrated nitric acid at a ratio of 1:10 w/v on a digester for about 10 min until brown fume disappeared. The trace elements were determined using inductively coupled plasma-optical emission spectrometry (ICP–OES) Optima 7300 DV (Perkin Elmer, Waltham, MA, USA). The organic C, N and sulfur (S) content of the dried sample were determined using TruMac CNS Analyzer (Leco Corporation, St. Joseph, MI, USA).

2.2. Test Bacteria and Fermentation Condition

E. hormaechei 40a strain was obtained from the bacterial culture collection at Research Laboratory 1.6, Bioprocessing and Biomanufacturing Research Centre, Universiti Putra Malaysia. The growth of strain 40a was maintained by routine subculture on nutrient agar to acquire a pure single colony. Unless stated otherwise, the fermentation condition of the starter culture (nutrient broth) and other fermentation media were prepared in 250 mL conical flasks containing 100 mL liquid medium at neutral pH (6.8–7.0) and the bacteria was grown at 37 °C, shaking at 200 rpm for 24 h.

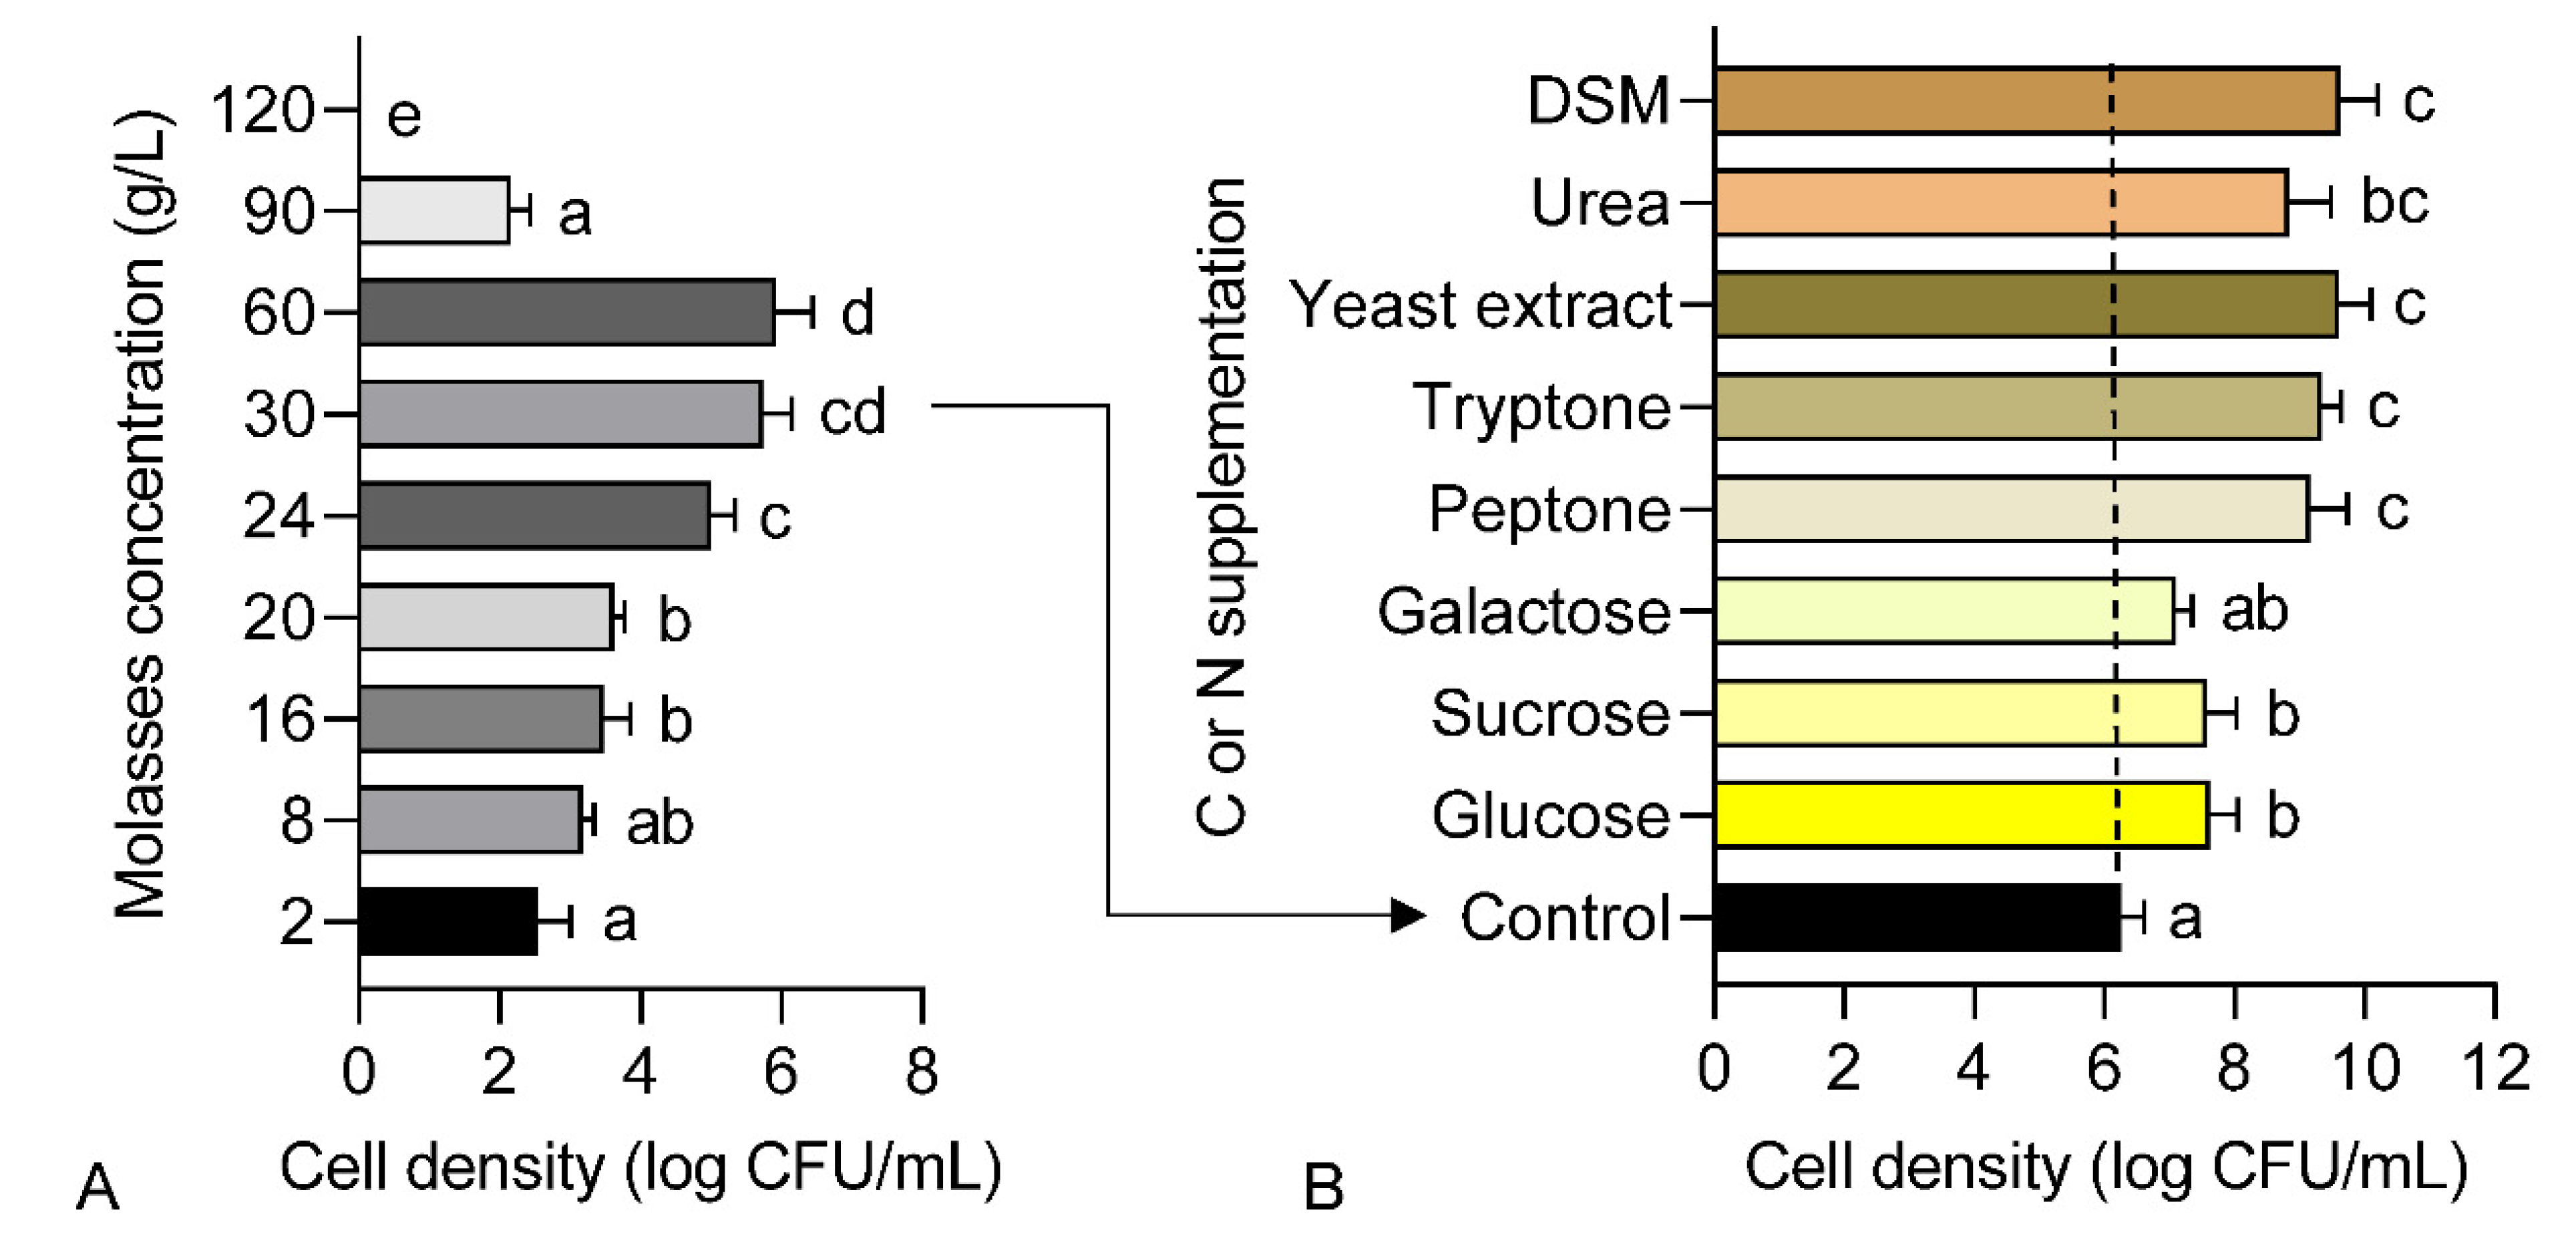
2.3. C and N Sources Supplementation

The unsulfured molasses was used as a basic nutrient source for growth culture throughout the whole experiment. A preliminary test was performed beforehand to evaluate the biocompatibility of molasses as the sole nutrient source to culture strain 40a with different concentrations ranging from 2 to 120 g/L. Nutrient broth was used as a starter culture and a standard inoculum size (~1 × 10¹⁰ CFU/mL) was used to inoculate the fermentation media unless stated otherwise. For single-factor screening of C and N supplementation, the molasses-based media were separately supplemented with different C sources, i.e., glucose, sucrose, galactose and N sources, i.e., peptone, tryptone, yeast extract and urea at a fixed concentration of 10 g/L respectively.

2.4. Cell Density Enumeration

The standard plate count method was used to determine the bacterial cell density. An aliquot of 100 μL culture was transferred into a microcentrifuge tube containing 900 μL of sterile phosphate-buffered saline (PBS). A routine serial dilution was performed and 10 μL of every dilution was pipetted onto nutrient agar. The inverted agar plate was incubated in a static incubator (Memmert GmbH + Co.KG, Schwabach, Germany) at 37 °C for 24 h. The bacterial colonies were counted manually by using a colony counter (Stuart, UK). Cell density was recorded in a log form (log CFU/mL).

2.5. Two-Level Factorial Design (TFLD)

A two-level factorial design (TFLD) was employed to screen for the significant factors [24] influencing the cell growth of strain 40a. Nine factors (29-4 factorial design, 32 experimental runs) were evaluated in this test which were molasses, DSM, yeast extract, glucose, sucrose, pH, temperature, inoculum size, and agitation with a response measured in cell density. Each factor was evaluated at two levels coded as high levels (+1) and low levels (−1) in the experimental design using Design of Expert (DOE) software (Version 11, Stat-Ease, Inc., Minneapolis, MN, USA). The symbols, units and actual levels of the variables were shown in Table 1.

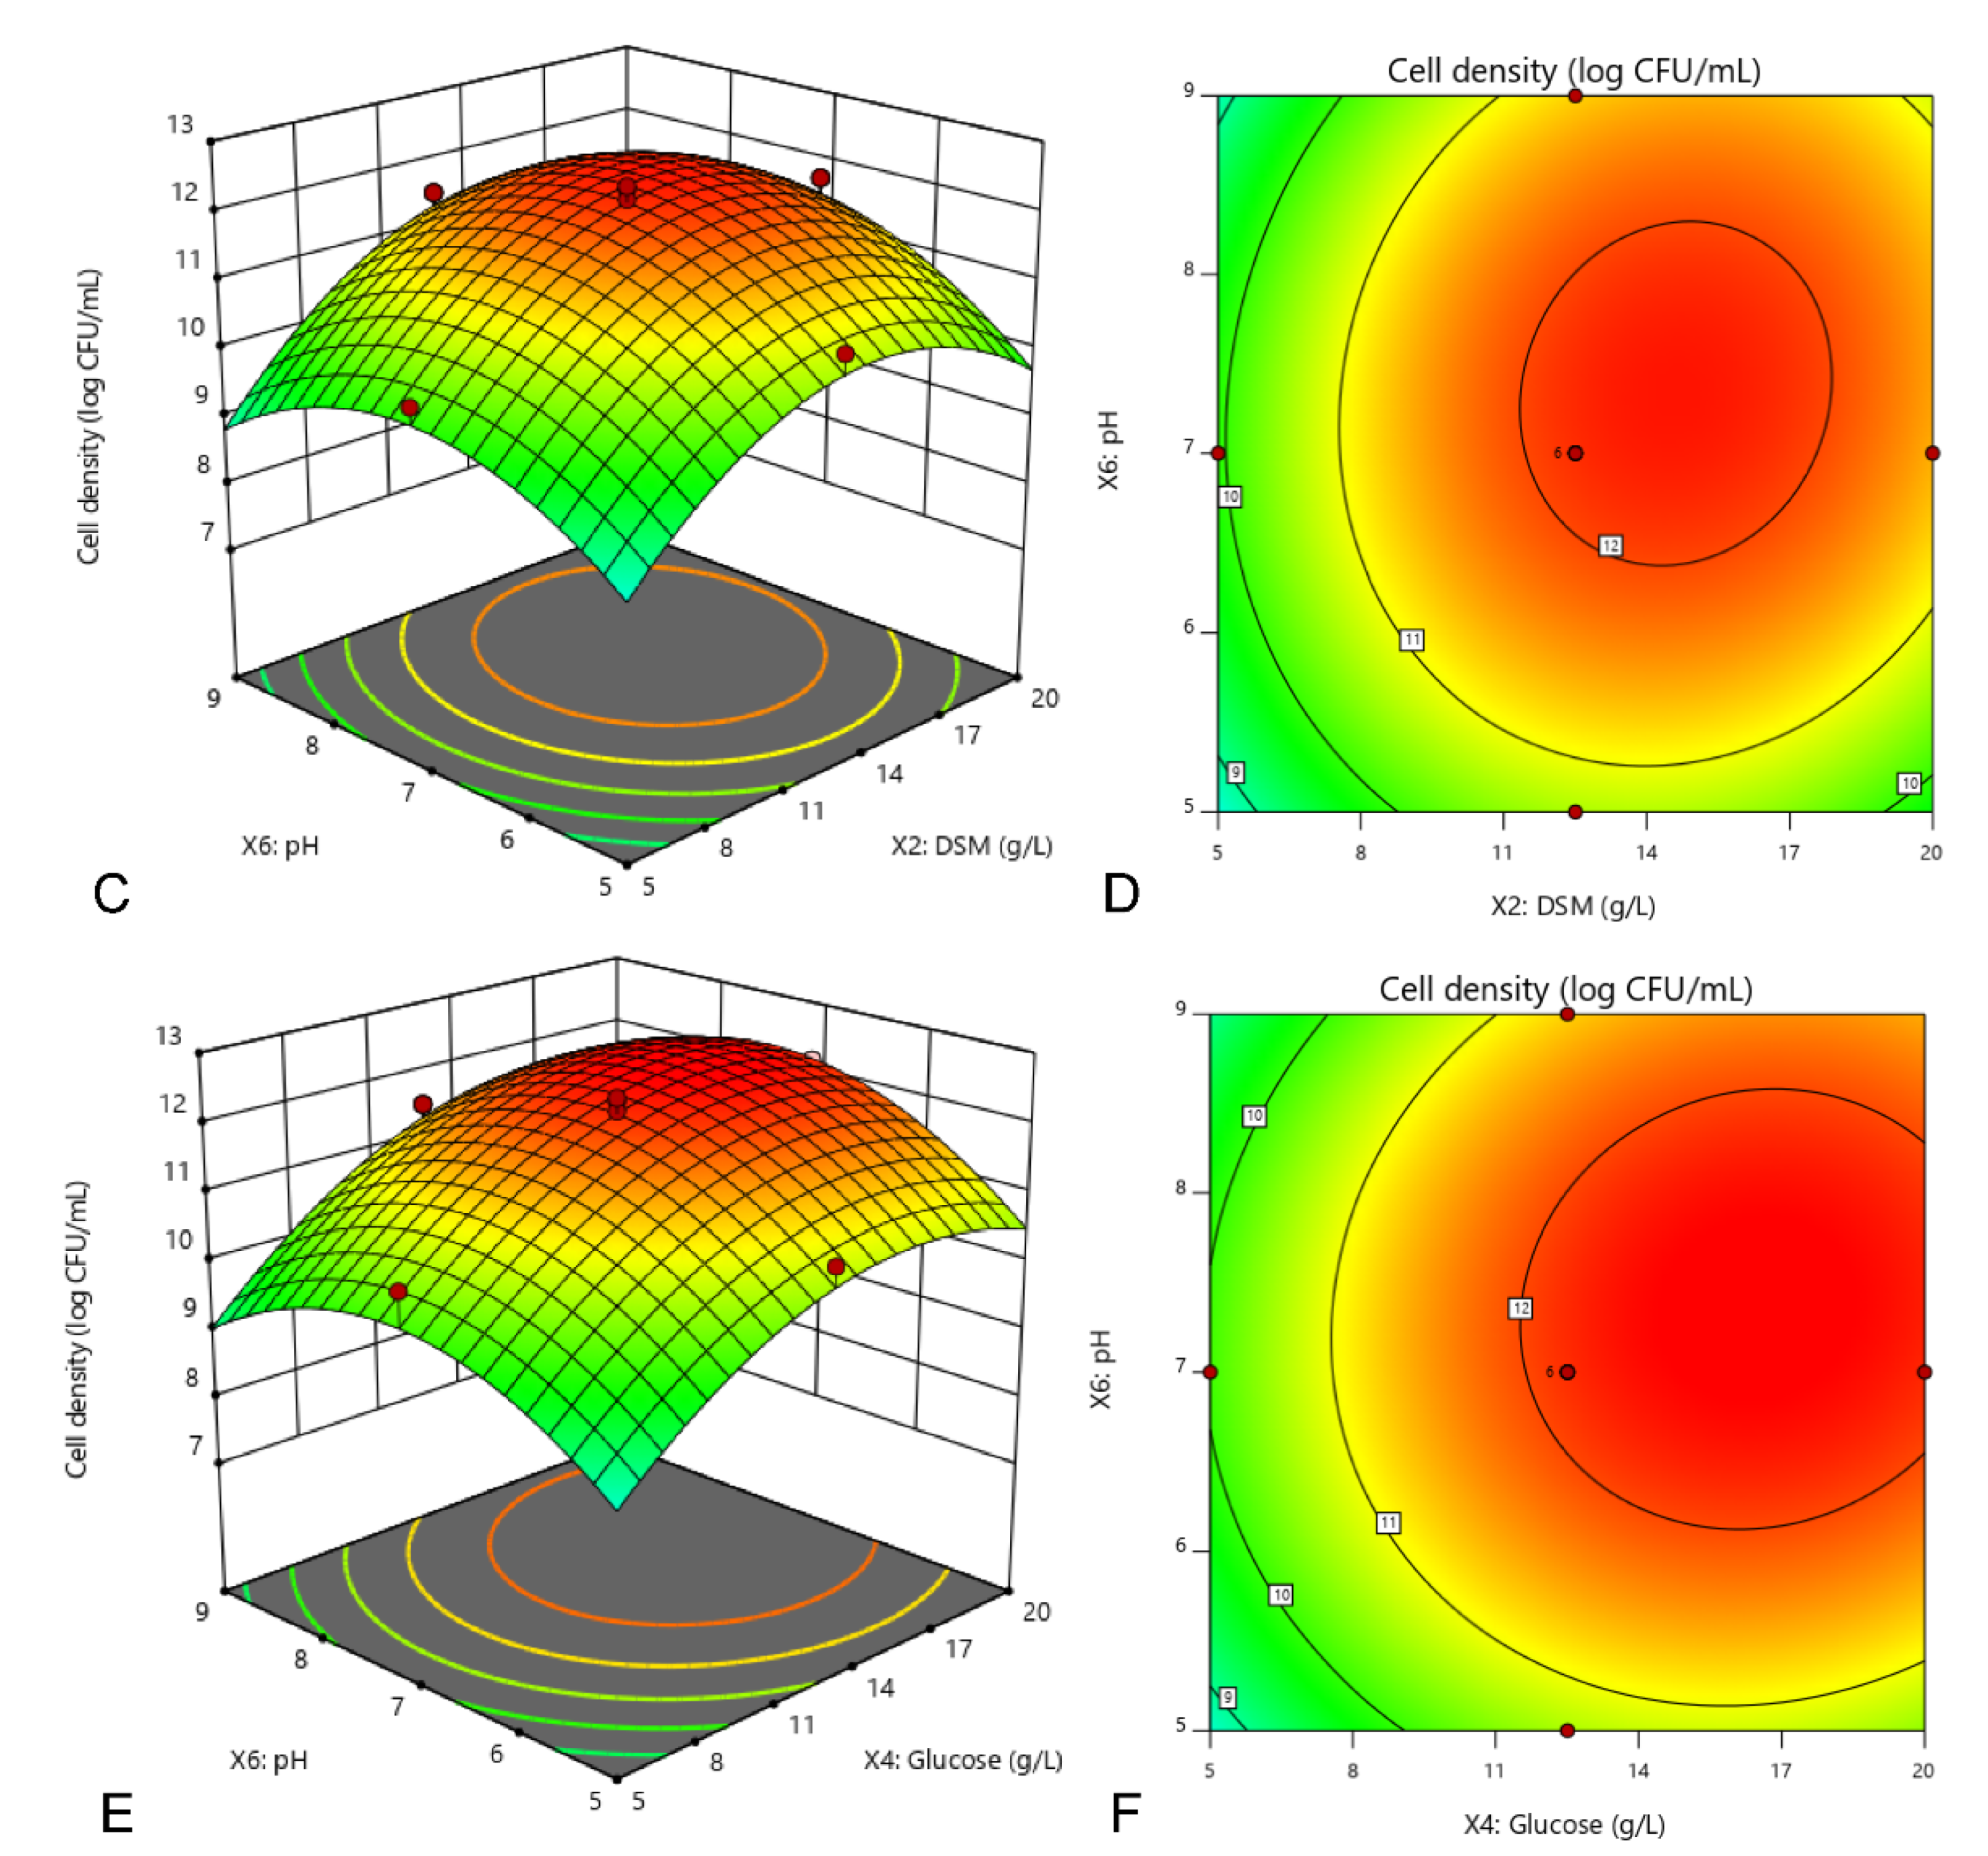
2.6. Central Composite Design (CCD) Using Response Surface Methodology (RSM)

A central composite design (CCD) [25] of response surface methodology (RSM) was employed to optimize the culture conditions selected from the most significant (p < 0.05) C source, N source and physical factor respectively, assessed in the previous TLFD test. In this study, the experimental design consisted of 20 experimental runs with 6 replicates at the center point. The behavior of the system was established by assuming a second-order polynomial function with linear, quadratic and interaction effects as shown in Equation (1).
Y = β0 + ΣβiXi + ΣβiiXi2 + ΣβijXij
where Y is the predicted result, β0 (offset term), βi (linear effect), βii (squared effect), and βij (interaction effect) are constant coefficients, and X shows the coded level of the independent variable. The regression analysis of variance and preparation of response surface graphs were implemented using Design of Expert (DOE) software (Version 11, Stat-Ease, Inc., Minneapolis, MN, USA). The optimal culture conditions for maximum cell density of E. hormaechei 40a were estimated by statistical analysis.

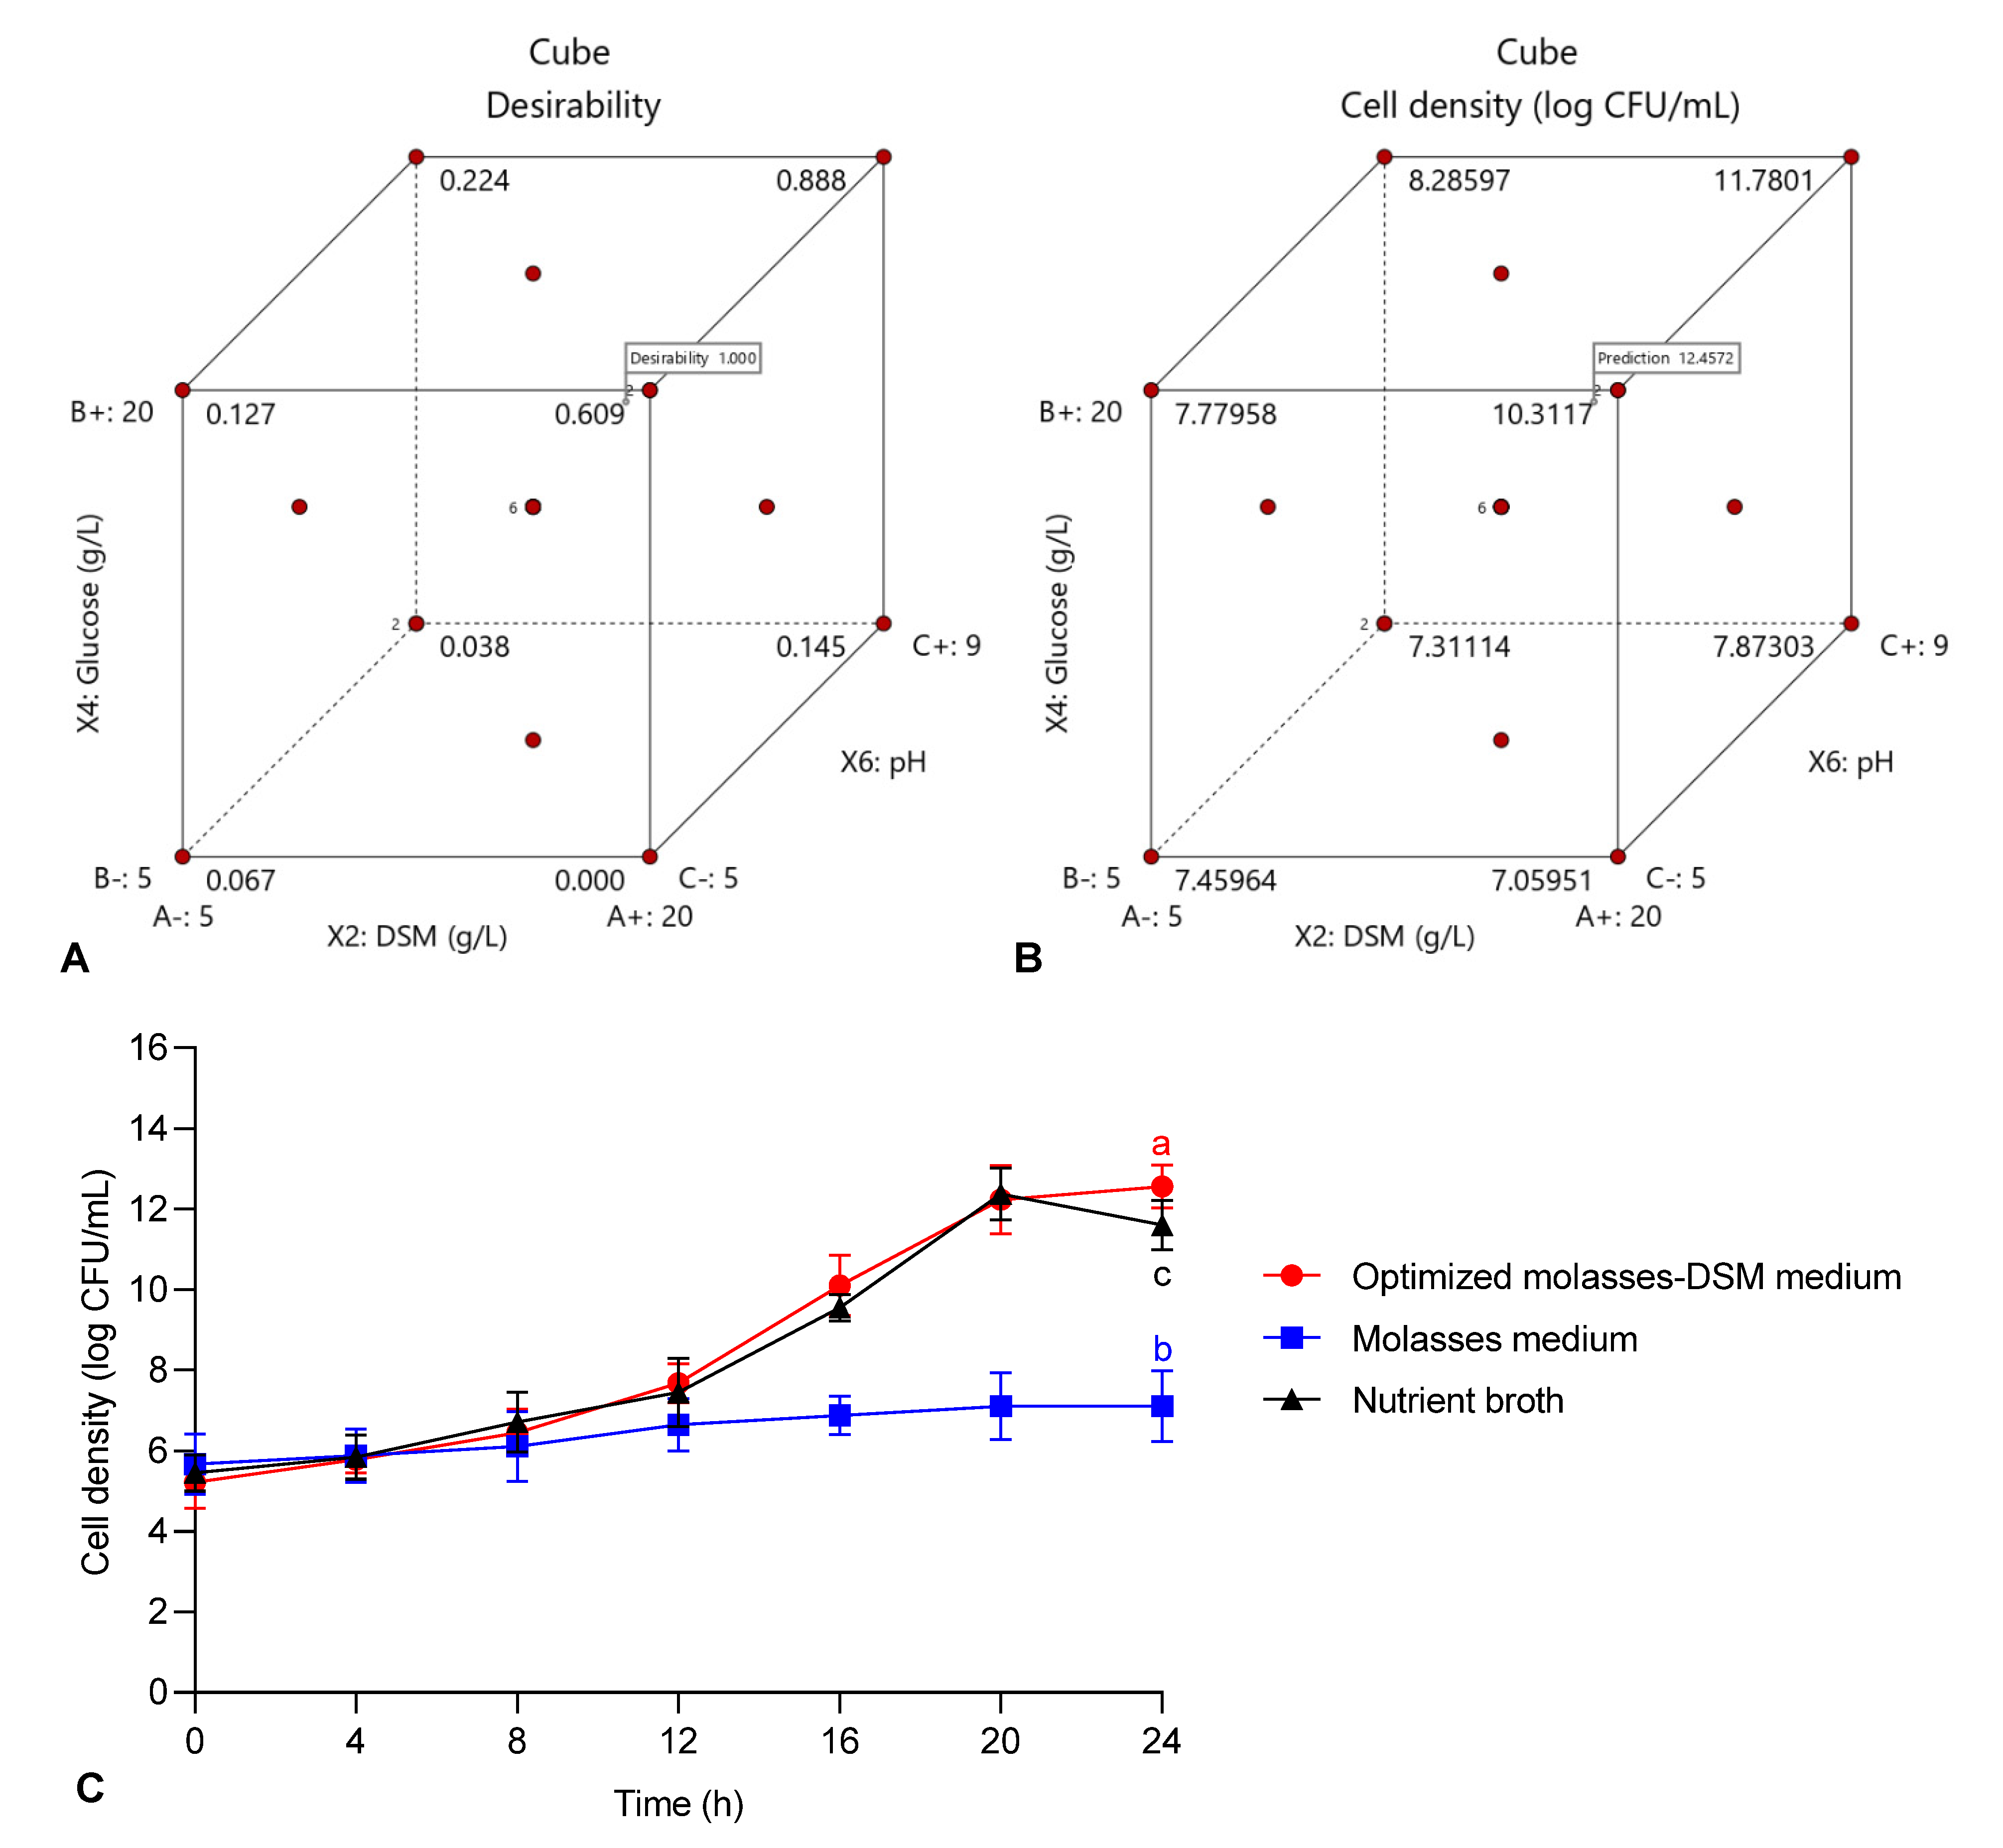
2.7. Post-Analysis of the Optimized Model

The post-analysis of the optimized formulation model was performed according to the parameters suggested by the DOE algorithm to achieve maximum cell density of strain 40a. The bacterial cell density was grown in a basic molasses medium and a commercial nutrient broth were concurrently compared with the optimized molasses-DSM (OMD) medium (final composition: DSM, 13.8 g/L; glucose, 17.7 g/L; initial pH, 7.6). The samples were withdrawn every 4 h and analyzed for cell density using previously described standard plate count method.

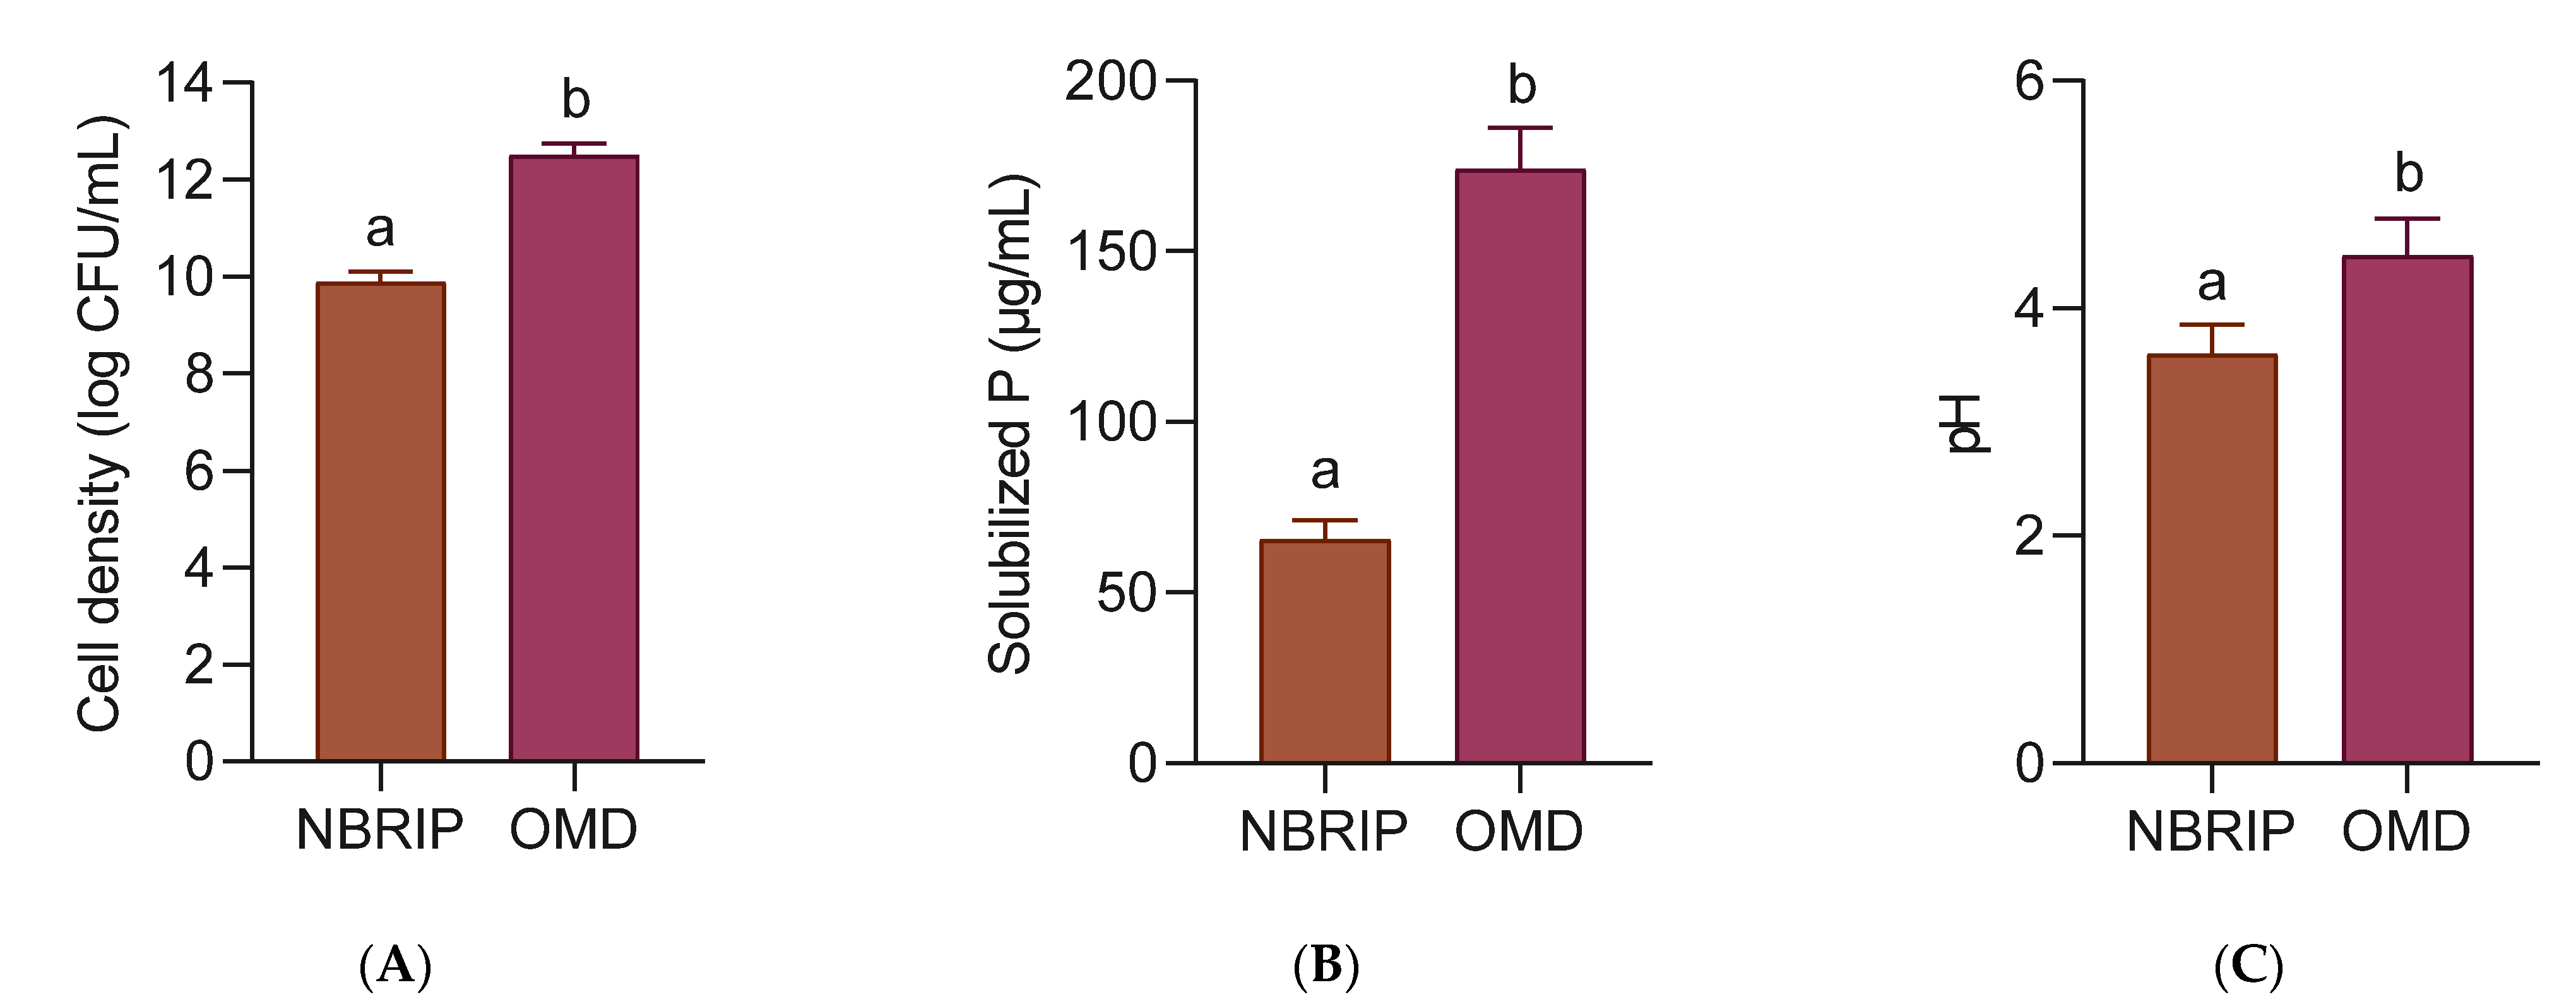
2.8. P Solubilization Activity of E. hormaechei 40a in Different Media

Strain 40a was grown in the OMD medium and the National Botanical Research Institute’s Phosphate (NBRIP) medium in a 250 mL Erlenmeyer flask separately for 24 h. NBRIP was prepared according to the standard composition excluding tricalcium phosphate [26]. Both media were added with 5 g/L Christmas island rock phosphate (CIRP) before autoclaved. The soluble P was determined by the yellow phospho-molybdo-vanadate colorimetry [27] using a UV-VIS spectrophotometer (Uviline 9400, Secomam, Alès France) against a KH2PO4 standard curve. The pH of the medium was measured using a benchtop pH meter (pH 700, Eutech Instruments, Ayer Rajah Crescent, Singapore). The viable cell density was determined using previously described standard plate count method.

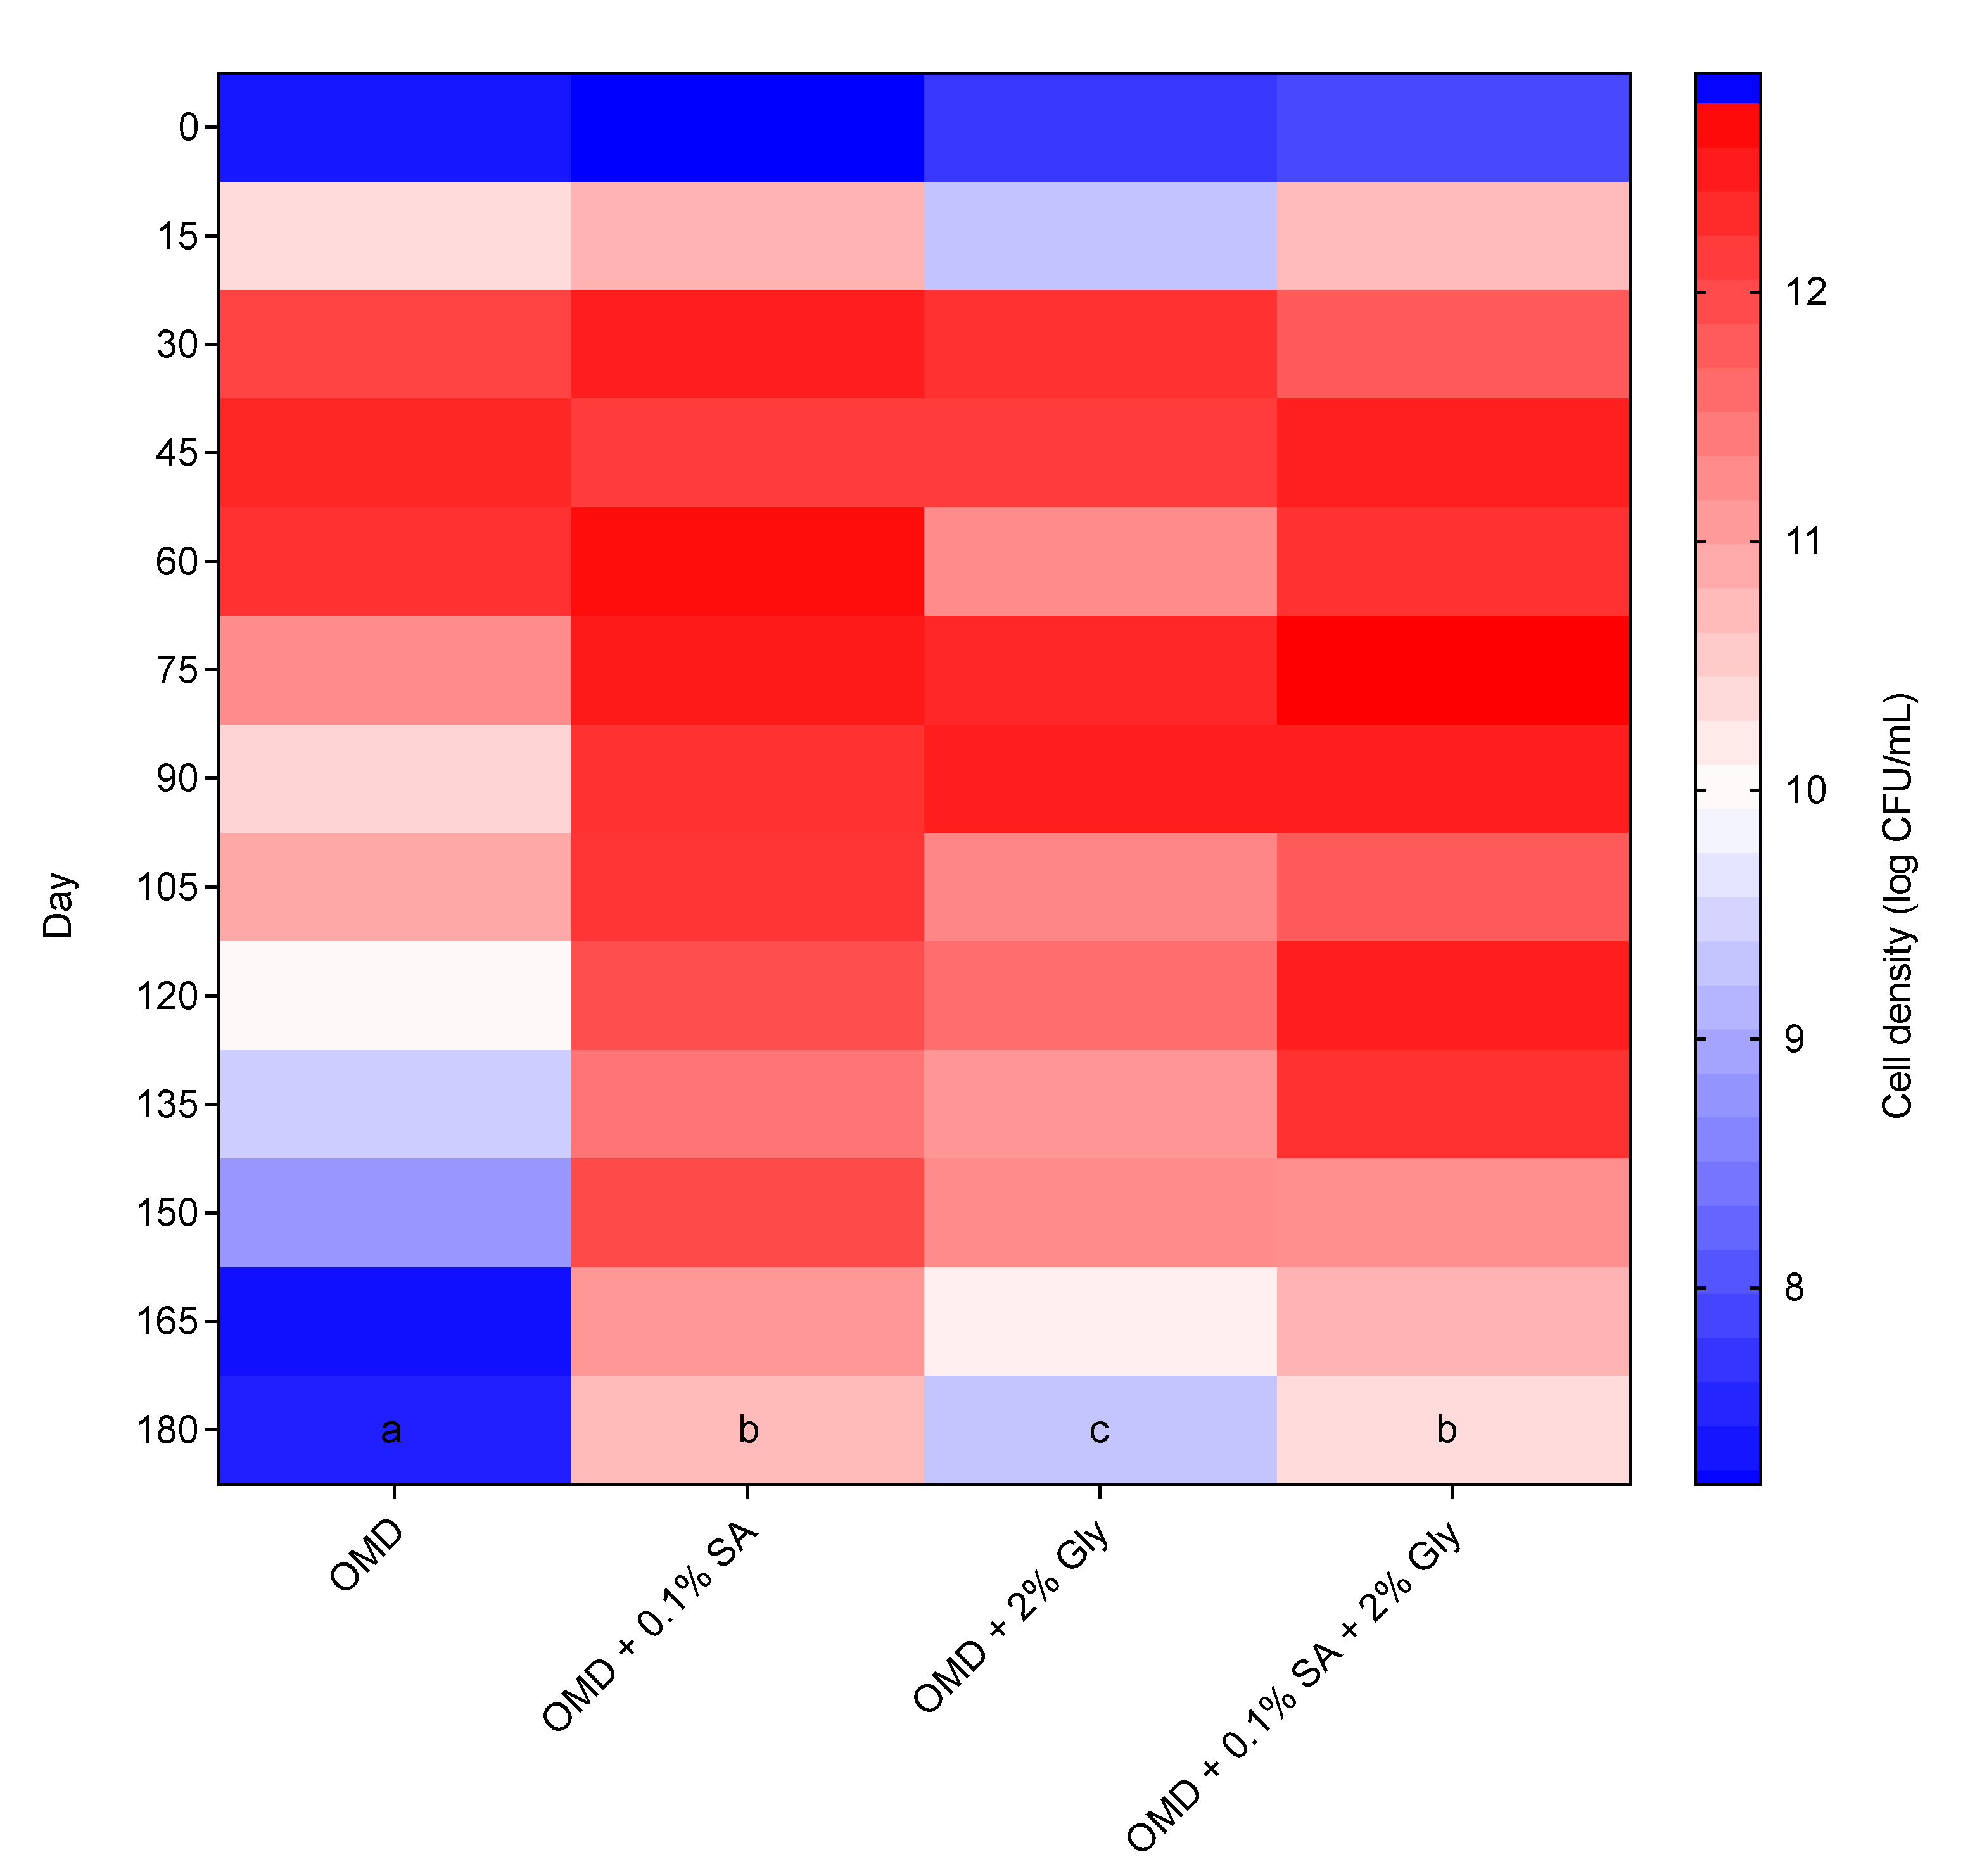
2.9. Shelf-Life Determination

The optimized culture formulation was prepared as stated previously and loaded half-full into a 100 mL UV-sterilized high-density polyethylene (HDPE) bottle. The effects of the addition of cell protectants, i.e., 0.1% sodium alginate (SA) [19] and 2% glycerol (Gly) [28] to the media were also investigated. The bottles were stored at room temperature (28 ± 2 °C) in a static condition. The shelf-life of the optimized culture was monitored by bimonthly interval up to 180 days of storage using the standard plate count method.

2.10. Statistical Analysis

Statistical tests were performed using one-way analysis of variance (ANOVA) to determine the significance of each variable employed in the preliminary single-factor screening and the shelf-life determination experiment. The regression coefficients were determined by Tukey-test as a post hoc pairwise comparison at p < 0.05. The significant difference between soluble P, pH and cell density between NBRIP and OMD media were determined using unpaired t-test at p < 0.05.

3. Results and Discussion

3.1. Effects of C and N Substrates Supplementation

P-solubilizing bacteria has gained widespread interest from researchers in academic and agricultural industries as a plant-beneficial biofertilizer. Our previous report has demonstrated the plant beneficial traits of strain 40a to improve the growth and P uptake of okra [1]. However, the activity of P-solubilizing bacteria was largely influenced by its cell density which corresponds to its capacity to release P from insoluble metal complexes in soil or any P fertilizer input. In this study, two combined strategies were implemented: (1) development of optimized molasses-DSM medium to enhance cell density of strain 40a; (2) amendment of medium formulation with cell protectants to improve shelf life of strain 40a.
Molasses was used as a basal C and multi-nutrient source in the fermentation medium whilst DSM was supplemented as an additional N substrate. The chemical analysis of molasses (Table 2) revealed that more than 63% of its viscous liquid weight was comprised of soluble sugar which was mainly glucose followed by sucrose, fructose, mannose and galactose. Besides, it also contained various mineral elements where P, K and Ca were found in bulk amounts. In contrast, DSM contained minimal soluble sugar mainly sucrose, and it was the only detectable soluble sugar by HPLC. In terms of mineral contents, DSM was almost entirely superior to molasses except for P, Ca and Zn. These nutrient-rich compositions of molasses and DSM respectively are beneficial for bacterial cell growth apart from being the ingredient composition of bio-organic fertilizer favorable for plant growth and soil fertility.
A preliminary screening of molasses with varying concentrations was performed to assess its biocompatibility as the sole nutrient source in growth medium for strain 40a. Based on the result presented in Figure 1A, the cell density of strain 40a increased steadily in molasses concentration ranging from 2 to 60 g/L. However, the cell density was dramatically declined in higher molasses concentration between 90 to 120 g/L. The maximum cell density around 6 log CFU/mL was recorded in molasses concentration ranging from 30 to 60 g/L (p < 0.05). This result suggests that a molasses medium with a concentration lesser than 60 g/L is suitable for the growth of strain 40a.
This finding is consistent with that of Sugiyama et al. and Ikegami et al., [29,30] who utilized molasses for the growth of actinobacteria for the bioremediation of hexavalent chromium Cr (VI) in soil. It was found that the Cr (VI) reduction was rather efficient when glucose was substituted with a low concentration of molasses. However, this data was much lower as compared to our previous report [1], wherein the cell density of strain 40a achieved around 12 log CFU/mL when grown in a commercial nutrient broth for 24 h. Therefore, additional C (e.g., glucose, sucrose and galactose) and N (e.g., peptone, tryptone, yeast extract, urea and DSM) substrates were screened individually afterward as supplementary nutrients in the molasses-based medium.
The results obtained from the single factor screening in Figure 1B indicated that all C and N substrates successfully enhanced the cell density of strain 40a in the molasses-based medium after 24 h fermentation. Glucose showed the highest cell density (7.6 log CFU/mL) boost among the C sources followed by sucrose and galactose (p > 0.05). Remarkably, all the N sources contributed to even higher cell density than any C sources, whereby DSM recorded the highest cell density (9.6 log CFU/mL) followed by yeast extract, tryptone, peptone and urea (p > 0.05). Hence, it could conceivably be hypothesized that strain 40a was more favorable to N substrates for cell growth rather than C sources.
In a prior study, Vu and Kim, [14] reported that the use of corn steep liquor (CSL) and molasses in a basal medium had successfully optimized the cell dry weight of Saccharomyces cerevisiae up to 187.63 g/L. Comparable to DSM, CSL is essentially rich with N constituents, e.g., protein, amino acids as well as vitamins and minerals which are easily accessible for cell metabolisms [14,31]. These factors may explain the relatively good correlation between the enrichment of N sources by DSM and the growth of strain 40a. An optimization step was conducted subsequently to achieve the maximum cell density of strain 40a for biofertilizer production.

3.2. Screening for Significant Fermentation Factors

Two-level factorial design (TLFD) is used to study the effect of all factors by varying them simultaneously [32]. The design matrix of TLFD in this study was created using Design Expert software where the selected factors from the previous single factor screening, i.e., molasses, glucose, sucrose, DSM and yeast extract including several other fermentation parameters, i.e., initial pH, temperature, inoculum size and agitation were randomized in 32 runs. The response of all factors was examined to determine the degree of effect on the cell density of strain 40a. The interactions between the independent factors were determined using analysis of variance (ANOVA) and the main effects of cell density were identified based on the p-value with confidence level greater than 95%. As shown in Table 3, the TLFD results indicated that the cell density of strain 40a varied from 6.36 (run 23) to 12.45 log CFU/mL (run 12) with randomized variable levels (presented in coded symbols). According to these data, we can infer that the fermentation parameters and substrate types could directly affect the cell density.
The regression analysis of variance (ANOVA) was presented in Table 4. The coefficient of determination R2 of the model was 0.9687 which inferred 96.87% of the response variability. The significant effects (importance) of each corresponding variable were determined by sorting their p-values numerically from the lowest to the highest value, whereby only p-value lesser than 0.05 was classified as significant effects on the response. As shown in Table 4, DSM (X2) demonstrated the most significant contribution (p < 0.05) towards the cell density of strain 40a, followed by yeast extract (X3), initial pH (X6) and glucose (X4) with 36.09%, 31.09%, 24.61% and 2.39% contribution, respectively. In contrast, the temperature, inoculum size, agitation and molasses indicated insignificant contribution (p > 0.05) towards the strain growth with each contribution lesser than 2%. The most significant C (glucose) and N (DSM) substrates, as well as initial pH, were included in the subsequent optimization step.

3.3. Optimization of Culture Condition

The experimental setup and the results of CCD were presented in Table 5. It was observed from the table that the cell density of strain 40a varied from 7.11 (run 3) to 12.32 log CFU/mL (run 1). The regression analysis of a full second-order polynomial model was shown in Table 6. The high F-value of the model (42.49) implied that the model was extremely significant that the probability of it occurring due to noise was only 0.01%. Above all, the relatively high value of the determination coefficient (R2 = 0.9745) indicated that the model fitted to the experimental results excellently which provides a good estimation of cell density (p < 0.05). In this case, all the linear and quadratic functions of X2, X4, X6, X22, X62 and X42 were identified as the significant model terms (p < 0.05), suggesting that DSM, glucose and initial pH play significant roles in cell density of strain 40a. However, only DSM and glucose (X2X4) showed a significant interaction (p < 0.05), while the other interactions (X2X6 and X4X6) were insignificant to cell density dynamics. The polynomial model for cell density of strain 40a (Y) was regressed by considering the significant terms and thereafter expressed in Equation (2).
Y = 12.14 + 0.77X2 + 1.06X4 + 0.33X6 + 0.73X2X4 + 0.24X2X6 + 0.16X2X6 − 1.44X22 − 1.02X42 − 1.19X62
where Y was the cell density of E. hormaechei 40a, X2, X4 and X6 were the coded values of DSM, glucose and initial pH, respectively. The regression model (Equation (2)) was used to predict the range of cell density dynamics for various levels of the selected variables. According to calculation, the maximum cell density of strain 40a (Y) was 12.6 log CFU/mL when the optimal concentration of DSM (X2) glucose (X4) and initial pH (X6) was 13.8 g/L, 17.7 g/L and 7.6, respectively (Figure 2).

3.4. Validation of the Quadratic Optimization Model

To validate the model adequacy and investigate the effect of C and N supplementation on cell density of strain 40a, fermentation experiments were conducted using the optimized molasses-DSM (OMD) medium under the parameters optimized by the previous methods of TLFD and CCD. The basal molasses medium and commercial nutrient broth were used for comparison. Figure 3 illustrated the viable cell density of strain 40a grown in the OMD medium, molasses medium and commercial nutrient broth separately. In the OMD medium, the maximum cell density of strain 40a was 12.56 log CFU/mL at 24 h. This result accords with the predicted value of 12.6 log CFU/mL as shown in the cube plot in Figure 3 with 99.7% accuracy. Interestingly, the cell density of strain 40a attained in the OMD medium was 7.9% and 43.6% higher than that in the commercial nutrient broth (11.6 log CFU/mL) and basal molasses medium (7.11 log CFU/mL) respectively. These results provide further support for the hypothesis that the combination of both DSM and glucose in neutral pH were ideal for maximum growth of strain 40a.

3.5. P Solubilization of CIRP between Standard NBRIP and Optimized Medium

In another experiment, the P solubilization activity of strain 40a was evaluated in the OMD medium with the addition of 5 g/L Christmas Island Rock Phosphate (CIRP). The standard NBRIP medium with the same amount of CIRP was compared as a reference. As shown in Figure 4, the cell density of strain 40a, the P release and the final pH in OMD were significantly higher (p < 0.05) than those in NBRIP. In terms of cell density, strain 40a was improved by 20.9% in OMD (12.49 log CFU/mL) than in NBRIP (9.88 log CFU/mL). Interestingly, the amount of P released was increased by 62.4% in OMD (174.07 µg/mL P) as compared to NBRIP (65.38 µg/mL P). Despite the higher P solubilization in OMD, the pH of the medium was slightly higher (4.46) than in NBRIP (3.59). These findings concluded that the overall P solubilization activity of strain 40a in the OMD medium was significantly higher than in the NBRIP medium.
P solubilization occurs when growth medium acidifies in response to microbial organic acids accumulation releasing cation-chelating carboxyl and hydroxyl ions [33]. Among all organic acids, gluconic acid is the most common mediator of P solubilization where it chelates the cations bounds to P, thus making it freely liberated in the medium [34]. In the case of Gram-negative bacteria such as strain 40a, gluconic acid is produced through direct oxidation of glucose [35]. The high glucose constituent in the OMD formulation might explain the high P release owing to the active cell proliferation secreting a high amount of gluconic acid. Another possible reason is that the P release might be contributed by P demineralization of DSM components in the OMD medium. As a result, the overall P solubilization activity of strain 40a was boosted. Nevertheless, the slightly higher pH of the OMD medium as compared to NBRIP could be due to the presence of buffer substances in DSM composition [15].

3.6. Effects of Cell Protectants on the Shelf-Life of Biofertilizer

The newly formulated OMD medium was assessed for a medium-compatibility test in a shelf-life experiment. The shelf life of strain 40a in the original OMD medium was compared with the OMD medium amended with cell protectants, i.e., 0.1% SA, 2% Gly and 0.1% SA + 2% Gly. The data of bimonthly shelf-life evaluation of strain 40a for 180 days of storage in the mentioned media respectively was visualized in a graphical heatmap as shown in Figure 5. Based on the results, the original OMD unfortunately was not able to sustain the high cell density of strain 40a longer than 60 days as it gradually dropped from 12.45 to 7.55 log CFU/mL over the next 120 days. This phenomenon might be due to the presence of inhibitors in the OMD medium released from the DSM breakdown. As well, nutrient starvation might occur since DSM is rich with phytate-bound minerals that potentially chelate the available cations and amino acids essential for cellular microbial activities [36].
On the contrary, the OMD media amended with cell protectants demonstrated a significantly (p < 0.05) prolonged high cell density of strain 40a around 10 log CFU/mL at the end of the storage period. The performance of OMD, however, was observed persistent and insignificantly different (p > 0.05) between 0.1% SA and 0.1% SA + 2% Gly, thus inferring the compatibility of SA alone as an additive in OMD to sustain the survival of strain 40a. It is possible, therefore, that the setbacks of DSM-bearing inhibitors mentioned previously are countered by the amendment of medium with cell protectants. Protectants with complex chemical nature such as the polymeric SA, are needed to avoid fast degradation [19,37]. The protectants provide cell protection by supplying additional nutrients, improving the physical properties and providing cellular osmoprotection [21]. They can form resting cells such as cysts and spores which enhance cell resistance towards adverse conditions [28].
This study supports evidence from previous observations where the utilization of SA prolonged a higher cell density of Azospirillum brasilense as compared to Gly based on the Arrhenius thermodynamic model [38]. SA is a type of natural cell protectant which is harmless and has a large molecular weight. It possesses adhesive characteristics, high water activity, high porosity and high viscosity. As a result, it can tolerate temperature instability of cell environment and thus suitable to be stored at ambient or room temperature [19,39]. It is encouraging to compare this finding with that reported by Bashan and Gonzalez, [40] who found that the alginate-microencapsulated N-fixing bacterial cells were able to survive after 14 years of storage while retaining their physiological plant-growth promoting properties.

4. Conclusions

In conclusion, this research provided an efficient and economic process for sustainable valorization of molasses and DSM through combined optimization of medium and amendment with cell protectants for the sustenance of high cell density of strain 40a in a liquid biofertilizer formulation. The original physiological P solubilizing activity of strain 40a in the OMD medium was observed higher as compared to the standard NBRIP medium. Additionally, the shelf life of strain 40a was enhanced by the amendment with 0.1% SA in the OMD medium. While the results obtained show a promising feasibility, the future prospect should focus on replacing the supplementary C source which was glucose with other potential sugar-rich and lignocellulosic agro-industrial waste materials such as fruit peels and plant residues. Additionally, a large-scale production trial of the formulated bio-organic fertilizer should be conducted in the future to establish a comprehensive cost analysis and thus validate its economic efficacy in industrial scale.

Author Contributions

Conceptualization, M.A.M.R.; methodology, M.A.M.R.; software, M.A.M.R.; validation, M.A.M.R., I.S. and P.S.L.; formal analysis, M.A.M.R., I.S. and P.S.L.; investigation, M.A.M.R., I.S. and P.S.L.; resources, M.A.M.R., I.S. and P.S.L.; data curation, M.A.M.R., I.S. and P.S.L.; writing—original draft preparation, M.A.M.R., I.S. and P.S.L.; writing—review and editing, M.A.M.R., I.S. and P.S.L.; visualization, M.A.M.R., I.S. and P.S.L.; supervision, N.A.A.R., Z.M.S., A.T.K.Z. and S.C.C.; project administration, N.A.A.R., Z.M.S., A.T.K.Z. and S.C.C.; funding acquisition, N.A.A.R., Z.M.S., A.T.K.Z. and S.C.C. All authors have read and agreed to the published version of the manuscript.

Funding

This research was funded by the Universiti Putra Malaysia (UPM) through Putra High Impact Grant, grant number 9659800. The APC was funded by the Research Management Centre, UPM.

Institutional Review Board Statement

Not applicable.

Informed Consent Statement

Not applicable.

Data Availability Statement

Not applicable.

Acknowledgments

The authors extend their appreciation to Jannatul Hawa Jasni for her basic guidance about the Design Expert software used in this project.

Conflicts of Interest

The authors declare no conflict of interest. The funders had no role in the design of the study; in the collection, analyses, or interpretation of data; in the writing of the manuscript, or in the decision to publish the results.

References

  1. Roslan, M.A.M.; Zulkifli, N.N.; Sobri, Z.M.; Zuan, A.T.K.; Cheak, S.C.; Abdul Rahman, N.A. Seed biopriming with P- and K-solubilizing Enterobacter hormaechei sp. improves the early vegetative growth and the P and K uptake of okra (Abelmoschus esculentus) seedling. PLoS ONE 2020, 15, e0232860. [Google Scholar] [CrossRef] [PubMed]
  2. O’Callaghan, M. Microbial inoculation of seed for improved crop performance: Issues and opportunities. Appl. Microbiol. Biotechnol. 2016, 100, 5729–5746. [Google Scholar] [CrossRef] [PubMed]
  3. Stephens, J.H.G.; Rask, H.M. Inoculant production and formulation. Field Crop. Res. 2000, 65, 249–258. [Google Scholar] [CrossRef]
  4. Arora, N.K.; Khare, E.; Maheshwari, D.K. Plant Growth Promoting Rhizobacteria: Constraints in Bioformulation, Commercialization, and Future Strategies. In Plant Growth Promoting Rhizobacteria; Maheshwari, D.K., Ed.; Springer: Berlin/Heidelberg, Germany, 2010; Volume 18, pp. 97–116. Available online: http://0-link-springer-com.brum.beds.ac.uk/10.1007/978-3-642-13612-2 (accessed on 1 April 2021).
  5. Berninger, T.; González López, Ó.; Bejarano, A.; Preininger, C.; Sessitsch, A. Maintenance and assessment of cell viability in formulation of non-sporulating bacterial inoculants. Microb. Biotechnol. 2018, 11, 277–301. [Google Scholar] [CrossRef] [Green Version]
  6. Sahu, P.K.; Brahmaprakash, G.P. Formulations of biofertilizers—Approaches and advances. In Microbial Inoculants in Sustainable Agricultural Productivity; Singh, D.P., Singh, H.B., Prabha, R., Eds.; Springer: New Delhi, India, 2016; pp. 179–198. Available online: http://0-link-springer-com.brum.beds.ac.uk/10.1007/978-81-322-2644-4 (accessed on 1 April 2021).
  7. Garcha, S.; Kansal, R.; Gosal, S.K. Molasses growth medium for production of Rhizobium sp. Based biofertilizer. Indian J. Biochem. Biophys. 2019, 56, 378–383. [Google Scholar]
  8. Wang, H.Y.; Shen, L.I.U.; Zhai, L.M.; Zhang, J.Z.; Ren, T.Z.; Fan, B.Q.; Liu, H. Preparation and utilization of phosphate biofertilizers using agricultural waste. J. Integr Agric. 2015, 14, 158–167. [Google Scholar] [CrossRef]
  9. Singh, D.P.; Prabha, R.; Renu, S.; Sahu, P.K.; Singh, V. Agrowaste bioconversion and microbial fortification have prospects for soil health, crop productivity, and eco-enterprising. Int. J. Recycl. Org. Waste Agric. 2019, 8, 457–472. [Google Scholar] [CrossRef] [Green Version]
  10. Ravindran, R.; Jaiswal, A.K. Exploitation of food industry waste for high-value products. Trends Biotechnol. 2016, 34, 58–69. [Google Scholar] [CrossRef] [Green Version]
  11. Unsoed, P.; AS, Y.; Sumadi, S.; Simarmata, T. Viability of Trichoderma harzianum grown on different carrier formulation. KnE Life Sci. 2017, 2, 95. [Google Scholar] [CrossRef] [Green Version]
  12. Cajamarca, S.M.N.; Martins, D.; da Silva, J.; Fontenelle, M.R.; Guedes, Í.M.R.; de Figueiredo, C.C.; Pacheco Lima, C.E. Heterogeneity in the chemical composition of biofertilizers, potential agronomic use, and heavy metal contents of different agro-industrial wastes. Sustainability 2019, 11, 7. [Google Scholar] [CrossRef] [Green Version]
  13. Shah, Z.H.; Rehman, H.M.; Akhtar, T.; Alsamadany, H.; Hamooh, B.T.; Mujtaba, T.; Daur, I.; Al Zahrani, Y.; Alzahrani, H.A.; Ali, S.; et al. Humic substances: Determining potential molecular regulatory processes in plants. Front. Plant. Sci. 2018, 9, 263. [Google Scholar] [CrossRef] [Green Version]
  14. Vu, V.H.; Kim, K. High-cell-density fed-batch culture of Saccharomyces cerevisiae KV-25 using molasses and corn steep liquor. J. Microbiol. Biotechnol. 2009, 19, 1603–1611. [Google Scholar] [CrossRef] [Green Version]
  15. Liu, J.; Zhou, J.; Wang, L.; Ma, Z.; Zhao, G.; Ge, Z.; Zhu, H.; Qiao, J. Improving nitrogen source utilization from defatted soybean meal for nisin production by enhancing proteolytic function of Lactococcus lactis F44. Sci Rep. 2017, 7. [Google Scholar] [CrossRef] [PubMed] [Green Version]
  16. Kim, S.; Kim, W.; Hwang, I.K. Optimization of the extraction and purification of oligosaccharides from defatted soybean meal. Int. J. Food Sci. Technol. 2003, 38, 337–342. [Google Scholar] [CrossRef]
  17. Zhang, K.; Yu, C.; Yang, S.T. Effects of soybean meal hydrolysate as the nitrogen source on seed culture morphology and fumaric acid production by Rhizopus oryzae. Process. Biochem. 2015, 50, 173–179. [Google Scholar] [CrossRef]
  18. Su, L.W.; Cheng, Y.H.; Hsiao, F.S.H.; Han, J.C.; Yu, Y.H. Optimization of mixed solid-state fermentation of soybean meal by Lactobacillus species and Clostridium butyricum. Pol. J. Microbiol. 2018, 67, 297–305. [Google Scholar] [CrossRef] [PubMed] [Green Version]
  19. Biradar, B.J.P.; Santhosh, G.P. Cell protectants, adjuvants, surfactant and preservative and their role in increasing the shelf life of liquid inoculant formulations of Pseudomonas fluorescens. Int. J. Pure Appl. Biosci. 2018, 6, 116–122. [Google Scholar] [CrossRef]
  20. Sivakumar, G.K.K. Enhancing the shelf life of Azotobacter and Azospirillum bioinoculants by development of liquid formulations. Int. Arch. Appl. Sci. Technol. 2019, 10, 132–136. [Google Scholar]
  21. Lobo, C.B.; Juárez Tomás, M.S.; Viruel, E.; Ferrero, M.A.; Lucca, M.E. Development of low-cost formulations of plant growth-promoting bacteria to be used as inoculants in beneficial agricultural technologies. Microbiol. Res. 2019, 219, 12–25. [Google Scholar] [CrossRef]
  22. Thirumal, G.; Reddy, R.S.; Triveni, S.; Damodarachari, K.; Bhavya, K. Evaluate the shelf life of Rhizobium carrier based biofertilizer stored at different temperatures at different intervals. Int. J. Curr. Microbiol. Appl. Sci. 2017, 6, 753–759. [Google Scholar] [CrossRef] [Green Version]
  23. Lee, S.K.; Lur, H.S.; Lo, K.J.; Cheng, K.C.; Chuang, C.C.; Tang, S.J.; Yang, Z.W.; Liu, C.T. Evaluation of the effects of different liquid inoculant formulations on the survival and plant-growth-promoting efficiency of Rhodopseudomonas palustris strain PS3. Appl. Microbiol. Biotechnol. 2016, 100, 7977–7987. [Google Scholar] [CrossRef] [PubMed]
  24. Shu, G.; Lei, Z.; Chen, H.; Wang, P.; Huang, D. Screening of medium compounds using a two-level factorial design for Saccharomyces boulardii. Sci. Study Res. 2016, 17, 45–54. [Google Scholar]
  25. Box, G.E.P.; Hunter, J.S.; Hunter, W.G. Statistics for Experimenters: Design, Innovation, and Discovery; Wiley: New York, NY, USA, 2005; p. 672. [Google Scholar]
  26. Nautiyal, C.S. An efficient microbiological growth medium for screening phosphate solubilizing microorganisms. FEMS Microbiol. Lett. 1999, 170, 265–270. Available online: https://0-academic-oup-com.brum.beds.ac.uk/femsle/article-lookup/doi/10.1111/j.1574-6968.1999.tb13383.x (accessed on 1 April 2021). [CrossRef] [PubMed]
  27. Gupta, A.P.; Neue, H.U.; Singh, V.P. Phosphorus determination in rice plants containing variable manganese content by the Phospho-Molybdo-Vanadate (yellow) and phosphomolybdate (blue) colorimetric methods. Commun. Soil Sci. Plant. Anal. 1993, 24, 1309–1318. [Google Scholar] [CrossRef]
  28. Gopi, G.K.; Meenakumari, K.S.; Nysanth, N.S.; Subha, P. An optimized standard liquid carrier formulation for extended shelf-life of plant growth promoting bacteria. Rhizosphere 2019, 11, 100160. [Google Scholar] [CrossRef]
  29. Sugiyama, T.; Sugito, H.; Mamiya, K.; Suzuki, Y.; Ando, K.; Ohnuki, T. Hexavalent chromium reduction by an actinobacterium Flexivirga alba ST13T in the family Dermacoccaceae. J. Biosci. Bioeng. 2012, 113, 367–371. [Google Scholar] [CrossRef] [PubMed]
  30. Ikegami, K.; Hirose, Y.; Sakashita, H.; Maruyama, R.; Sugiyama, T. Role of polyphenol in sugarcane molasses as a nutrient for hexavalent chromium bioremediation using bacteria. Chemosphere 2020, 250. [Google Scholar] [CrossRef]
  31. White, P.; Johnson, L.A. Corn, Chemistry and Technology, 2nd ed.; American Association of Cereal Chemists: Saint Paul, MN, USA, 2003. [Google Scholar]
  32. Mohd Ridza, P.N.Y.; Ya’Acob, A.; Zainol, N.; Mortan, S.H. Application of two level factorial design to study the microbe growth inhibition by pineapple leaves juice. IOP Conf. Ser. Mater. Sci. Eng. 2020, 736, 022011. [Google Scholar] [CrossRef]
  33. Seshachala, U.; Tallapragada, P. Phosphate Solubilizers from the Rhizospher of Piper nigrum L. in Karnataka, India. Chil. J. Agric. Res. 2012, 72, 397–403. [Google Scholar] [CrossRef] [Green Version]
  34. Alori, E.T.; Glick, B.R.; Babalola, O.O. Microbial phosphorus solubilization and its potential for use in sustainable agriculture. Front. Microbiol. 2017, 8, 971. [Google Scholar] [CrossRef] [Green Version]
  35. Goldstein, A.H. Bioprocessing of rock phosphate ore: Essential technical considerations for the development of a successful commercial technology. In Proceedings of the 4th International Fertilizer Association Technical Conference, IFA, Paris, France, 9 May 2000; p. 220. [Google Scholar]
  36. Nelson, T.S.; Shieh, T.R.; Wodzinski, R.J.; Ware, J.H. The availability of phytate phosphorus in soybean meal before and after treatment with a mold phytase. Poult. Sci. 1968, 47, 1842–1848. [Google Scholar] [CrossRef]
  37. Herrmann, L.; Lesueur, D. Challenges of formulation and quality of biofertilizers for successful inoculation. Appl. Microbiol. Biotechnol. 2013, 97, 8859–8873. [Google Scholar] [CrossRef]
  38. Sandra, C.; Rebeca, B.R. Polymers selection for a liquid inoculant of Azospirillum brasilense based on the Arrhenius thermodynamic model. Afr. J. Biotechnol. 2015, 14, 2547–2553. [Google Scholar]
  39. Campos, D.C.; Acevedo, F.; Morales, E.; Aravena, J.; Amiard, V.; Jorquera, M.A.; Inostroza, N.G.; Rubilar, M. Microencapsulation by spray drying of nitrogen-fixing bacteria associated with lupin nodules. World J. Microbiol. Biotechnol. 2014, 30, 2371–2378. [Google Scholar] [CrossRef] [PubMed]
  40. Bashan, Y.; Gonzalez, L.E. Long-term survival of the plant-growth-promoting bacteria Azospirillum brasilense and Pseudomonas fluorescens in dry alginate inoculant. Appl. Microbiol. Biotechnol. 1999, 51, 262–266. [Google Scholar] [CrossRef]
Figure 1. Cell density of E. hormaechei 40a grown in molasses-based media: (A) different concentrations of molasses; (B) molasses-based media supplemented with different C and N substrates separately (10 g/L). Data represent mean values ± SE (n = 3). Different letters indicate statistically significant differences between factors (one-way ANOVA + Tukey multiple comparisons test at p < 0.05).
Agronomy 11 00996 g001
Figure 2. Interaction among DSM, glucose and initial pH towards the cell density of E. hormaechei 40a demonstrated by 3D response surface (A,C,E) and 2D contour (B,D,F) plots. Cultures were standardized at starting inoculum size (~1 × 10⁸ CFU/mL) and grown at a fixed condition of 200 rpm at 37 °C in 24 h. The central composite design (CCD) was employed by three independent factors at three levels (full factorial) with 20 runs assignment by using Design-Expert software (version 11, Stat-Ease, Inc., MN, USA).
Agronomy 11 00996 g002aAgronomy 11 00996 g002b
Figure 3. Validation of the quadratic optimization model: (A) cube plot of desirability prediction; (B) cube plot of cell density based on the predicted optimum factors; (C) time profile of the cell growth of E. hormaechei 40a cultured in the optimized molasses-DSM medium, molasses medium and commercial nutrient broth. The mean data of triplicate experiments were presented with error bars representing the standard deviations. The data were analyzed by one-way ANOVA. Statistically significant differences between the means were indicated by different letters at p < 0.05.
Agronomy 11 00996 g003
Figure 4. Comparison of P solubilization of CIRP by E. hormaechei 40a in NBRIP and OMD medium respectively, with shaking at 37 °C in 24 h. (A) Cell density; (B) solubilized P; (C) pH. The mean data of triplicate experiments were presented with error bars representing the standard deviations. The data were analyzed by unpaired t-test. Statistically significant differences between the means were indicated by different letters at p < 0.05.
Agronomy 11 00996 g004
Figure 5. Heatmap of bimonthly shelf-life determination of E. hormaechei 40a cultured in optimized molasses-DSM medium with or without (control medium) the addition of cell protectants (0.1% SA, 2% Gly or 0.1% SA + 2% Gly). The data were represented by the mean of triplicate runs and analyzed by one-way ANOVA. Statistically significant differences between treatments were indicated by different letters at p < 0.05.
Agronomy 11 00996 g005
Table 1. Variables and their selected levels in the two-level factorial design.
SymbolsFactorsUnitsCoded LowCoded High
X1Molassesg/L−1 ↔ 10+1 ↔ 60
X2DSMg/L−1 ↔ 0+1 ↔ 10
X3Yeast extractg/L−1 ↔ 0+1 ↔ 10
X4Glucoseg/L−1 ↔ 0+1 ↔ 10
X5Sucroseg/L−1 ↔ 0+1 ↔ 10
X6pH −1 ↔ 4+1 ↔ 7
X7Temperature°C−1 ↔ 27+1 ↔ 37
X8Inoculum size% v/v−1 ↔ 1+1 ↔ 4
X9Agitationrpm−1 ↔ 100+1 ↔ 200
Table 2. Chemical characteristics of molasses and defatted soybean meal.
CharacteristicMolassesDSM
pH (H2O)4.53 ± 0.386.51 ± 0.59
Moisture content (%)85.37 ± 1.2211.33 ± 2.73
Soluble sugar a (mg/g)wmbdmb
Sucrose138.73 ± 1.6776.60 ± 1.29
Glucose283.53 ± 5.66nd
Fructose122.70 ± 17.67nd
Galactose11.23 ± 4.97nd
Mannose77.23 ± 23.06nd
Elemental analysis
Macro-element (mg/g dmb)
Carbon, C b557.8 ± 11.8419.32 ± 21.1
Nitrogen, N b4.01 ± 0.276.17 ± 1.1
Sulphur, S b1.2 ± 0.13.38 ± 0.2
Phosphorus, P c16.72 ± 7.352.09 ± 0.49
Potassium, K d4.84 ± 0.1543.4 ± 4.22
Calcium, Ca d6.24± 1.054.24 ± 1.14
Magnesium, Mg d1.06 ± 0.912.39 ± 0.62
Sodium, Na d0.51 ± 1.0314.07 ± 0.54
Micro-element (µg/g dmb)
Iron, Fe d42.1 ± 0.8124.4 ± 5.4
Boron, B d4.88 ± 0.19366.1 ± 40.4
Manganese, Mn d4.75 ± 0.1138.2 ± 14.11
Molybdenum, Mo d0.23 ± 0.086.2 ± 1.41
Zinc, Zn d4.13 ± 0.18nd
Value is expressed in mean ± standard deviation (n = 3 biological replicates); nd—not detected; wmb—wet matter basis; dmb—dry matter basis; a determined by HPLC analysis; b determined by CNS elemental analysis; c determined by the yellow phospho-molybdo-vanadate colorimetry [27]; d determined by ICP-OES analysis.
Table 3. Two-level factorial design variables (coded) with cell density of E. hormaechei 40a as a response.
RunX1X2X3X4X5X6X7X8X9Cell Density (log CFU/mL)
1++++7.30
2++++10.81
3+++++8.58
4++++++10.24
5+++++9.40
6++++6.95
7+++++6.50
8+++++10.04
9+++++7.75
10+++++9.39
11+++++12.42
12++++12.45
13++8.29
14++++++11.99
15+++++8.34
16++++++11.17
17+++++9.98
18+++++10.07
19++++10.75
20+++++7.69
21+++++9.15
22+++++8.33
23+6.36
24++++10.16
25++++7.79
26++8.04
27++++7.73
28++6.75
29++++++10.49
30+++++++++12.27
31+++++7.66
32++6.57
Table 4. ANOVA for two-level factorial model.
SourceSum of SquaresdfMean SquareF-Valuep-ValueImportance (Remarks)
Model101.27911.2575.77<0.0001Significant
X10.391310.39132.630.11887
X237.73137.73254.09<0.00011 (Significant)
X332.50132.50218.85<0.00012 (Significant)
X42.5012.5016.840.00054 (Significant)
X51.8011.8012.090.00215 (Significant)
X625.73125.73173.28<0.00013 (Significant)
X70.075210.07520.50610.48439
X80.136910.13690.92220.34738
X90.406010.40602.730.11246
Residual3.27220.1485
Cor Total104.5331
Fit statistics: R2 = 0.9687; Adjusted R2 = 0.9559; Predicted R2 = 0.9339; df: degree of freedom.
Table 5. Experimental design and the results of CCD.
RunX2: DSM (g/L)X4: Glucose (g/L)X6: pHCell Density (log CFU/mL)
ObservedPredicted
112.512.5712.3212.14
220597.557.87
35557.117.46
412.512.5712.1812.14
552098.098.29
65597.47.31
752057.987.78
812.520712.1512.17
9512.5710.179.92
1012.55710.5710.06
112020510.110.31
1212.512.5712.0112.14
1312.512.5711.4412.14
1412.512.5712.3712.14
152012.5711.711.47
1612.512.5510.9110.62
1712.512.5711.5212.14
1820557.137.06
192020912.0111.78
2012.512.5911.4811.28
Table 6. Regression analysis of a full second-order polynomial model for cell density optimization of E. hormaechei 40a.
SourceSum of SquaresdfMean SquareF-Valuep-ValueRemarks
Model72.3598.0442.49<0.0001significant
X25.9815.9831.620.0002
X411.17111.1759.02<0.0001
X61.0911.095.750.0374
X2X44.3014.3022.720.0008
X2X60.4610.462.450.1489
X4X60.2110.211.130.3121
X225.7315.7330.290.0003
X422.8812.8815.210.0030
X623.8813.8820.480.0011
Residual1.89100.19
Lack of Fit1.0850.221.340.3780not significant
Pure Error0.8150.16
Cor Total74.2419
Fit statistics: R2 = 0.9745; Adjusted R2 = 0.9516; Predicted R2 = 0.8266; C.V.% = 4.2191; df: degree of freedom.
Publisher’s Note: MDPI stays neutral with regard to jurisdictional claims in published maps and institutional affiliations.

