Article

Nutritional and Sensory Quality of Two Types of Cress Microgreens Depending on the Mineral Nutrition

by
Norbert Keutgen
1,
Michael Hausknecht
1,
Magda Tomaszewska-Sowa
2 and
Anna Jadwiga Keutgen
1,*
1
Department of Crop Sciences, Institute of Vegetables and Ornamentals, BOKU-University of Natural Resources and Life Sciences, 1180 Vienna (Wien), Austria
2
Laboratory of Genetics and Plant Physiology, Department of Agricultural Biotechnology, UTP University of Science and Technology, 85-029 Bydgoszcz, Poland
*
Author to whom correspondence should be addressed.
Submission received: 19 April 2021 / Revised: 25 May 2021 / Accepted: 27 May 2021 / Published: 29 May 2021
(This article belongs to the Special Issue Sprouts, Microgreens and Edible Flowers as Novel Functional Foods)

Abstract

:
The present study addressed the combination of nutritional and sensory quality assessment of radish and garden cress as microgreens cultivated in different amounts of mineral nutrients under conditions that can be realized in a private household. The content of value adding compounds was determined by means of chemical analyses. Total flavor impression and visual appearance were rated by untrained consumer tests. In cotyledons of radish cress (Raphanus sativus L.), carotenoid, total phenols, nitrate contents, and antioxidant capacity decreased significantly with decreasing mineral content in the nutrient solution, whereas, in stems, total phenols and anthocyanin contents rose and nitrate content decreased significantly with decreasing mineral content. In garden cress (Lepidium sativum L.), carotenoid and nitrate contents decreased and anthocyanin content increased significantly with decreasing mineral content, indicating that the response of value adding compounds to changing amounts of minerals in the nutrient solution depends on the compound of interest, plant species, and even the plant organ of a species. The sensory quality of the studied microgreens was generally rated highest when mineral content in the nutrient solution was highest, indicating that sensory quality is not necessarily identical with nutritional quality. Considering the common practice in private households, cultivation with tap water represents an attractive compromise for nutritional and sensory quality in case of garden cress, whereas, for radish cress, the application of 25% modified Hoagland solution is recommended.

1. Introduction

As microgreens may serve not only vegetables, but also herbs and grains, they are best harvested when the first pair of true leaves develops [1]. Microgreens may be confused with sprouts but are eaten without the roots and are frequently able to develop larger, more tasty leaves [2]. Both microgreens and sprouts are consumed for their slightly sour, spicy, or bitter flavors and are recommended for their secondary metabolites [3,4,5,6,7,8,9,10]: chlorophylls, carotenoids, ascorbic acid, tocopherols, and phenolic compounds. Additionally, Brassicaceae family sulfur-organic compounds, such glucosinolates, are all recommended to improve human diet and prevent a range of common diseases by reducing, e.g., cardiovascular disease risk factors and levels of liver cholesterol [3,5,11,12,13,14].
The consumption of microgreens in the human diet is well established because of their vivid colors and special flavors contributing to the experience and sensation of taste [15,16,17]. Microgreens are increasingly integrated in daily meals due to their, in principle, simple cultivation. However, the commercial production of microgreens can be quite challenging, because the perfect time of harvest plays an essential role in the success of marketing these perishable products [18]. The cultivation of microgreens is mostly realized in hydroponic cultivation systems and different nutrient solutions and culture vessels, such as mats, trays, and bags [19]. Information on the applied nutrient solution for microgreen cultivation is scarce, but many solutions currently used are based on a modified Hoagland solution. In literature, authors usually favor a 25% [5,12,17,20,21] or 50% Hoagland solution [22,23]. In their comparative study, Palmitessa et al. [24] investigated the different effects of fertilization with 50%, 25%, and 12.5% modified Hoagland solution on Brassica oleracea L. var. italica Plenck, Brassica oleracea L. var. botrytis L., and Brassica rapa L. subsp. sylvestris L. Janch. var. esculenta Hort. They summarized that the use of 50% Hoagland solution resulted in both a high yield and a desirable seedling height, while 12.5% Hoagland solution produced the least acceptable microgreens. Another recent study [25] on microgreens examined the effect of different Hoagland concentrations on the content of value adding compounds in Diplotaxis tenuifolia (L.) DC., Brassica oleracea L. var. capitata L., and Brassica oleracea L. var. gemmifera DC., comparing 25% Hoagland solution with distilled water. Additional nutrient supplementation increased yield in rocket, Brussels sprouts, and cabbage microgreens, accompanied by an increase in chlorophyll content. The response of carotenoid content depended on cv. It increased in Brussels sprouts and cabbage when nutrient content rose, but decreased in rocket. Total phenols content was not affected by fertigation in Brussels sprouts or cabbage microgreens, while the content of some phenolic acids changed in rocked, depending on fertilizer concentration.
Microgreens cultivation can take place in pure nutrient solution or within carrier media, and, hence, microgreens are also suitable for cultivation in areas with adverse cultivation conditions. Soilless systems offer several advantages, such as flexibility, a high quality of the product, a reduction in soil-borne diseases, and the control of water and nutrients [26]. Abiotic stress, for instance, applied as a nutrient deficiency, results in an acclimative response of the plant secondary metabolism and is able to modify the biochemical composition of microgreens [8], frequently resulting in elevated concentrations of value adding compounds [27,28,29,30]. In addition, nitrogen deficiency may have the advantage of limiting the concentration of the anti-nutrient nitrate in the harvested greens [29]. A nutrient deficiency approach is especially interesting in the case of soilless cultivation systems, for which there are different kinds commercially available, and for private cultivation at home for own needs. Although there are some studies focusing on the response of microgreens to nutrient solution concentration [24,25,31,32], a combined evaluation of plants’ secondary metabolites and an assessment of their sensory attributes under realistic practical conditions has not yet been performed.
In the present study, pungency, crispness, typical aroma, and the presence of off-flavors summarized as total flavor impression and the visual appearance (stem length as a measure of plant size, leaf appearance, color impression) were evaluated by untrained consumer tests. Because of their multifaceted sensory attributes, microgreens are easily assessable by the Humans’ organoleptic system [11,33]. Although the sensory attributes are interconnected with the chemical composition of the microgreens [4], additional aspects such as the visual appearance and texture, in addition to aroma and flavor, are critical for the consumer’s acceptance [17]. To date, several studies have shown that the sensory attributes and visual appearance of microgreens are decisive for the consumer acceptance [4,17,33,34,35], but it remains questionable whether consumer preference reflects the highest concentrations of value adding compounds. Therefore, our hypothesis is that consumer preference does not necessarily reflect the highest concentrations of health promoting compounds of selected microgreens but that a compromise between consumer preference and health attributes can be elaborated. However, the selected concentration of a nutrient solution may depend on the chosen species.
The present study aimed to examine the cultivation success of two microgreens, radish cress and garden cress, under practical culture conditions that can be realized in a private household. Both the organoleptic evaluation by untrained consumer tests and the determination of value adding compounds were examined against the background that, in private households, usually only tap water is available for germination and growth in a soilless cultivation system. It was studied whether modified Hoagland solution in different dilution levels or demineralized water increased customer satisfaction with the product and whether the highest customer acceptance corresponded to the highest concentrations of value adding compounds.

2. Materials and Methods

2.1. Plant Material and Cultivation

Ten repetitions were conducted from November 2018 to February 2019 with radish cress (Raphanus sativus L.) and ten repetitions from March to June 2019 with garden cress (Lepidium sativum L.), which were each germinated and cultivated in 5 trays of the Cressbar® company (dimensions 156 mm × 145 mm) in the cultivation chamber under a 16/8 h day/night regime at 22/18 ± 2 °C temperature and a relative air humidity of 60/65%. Fluorescent lamps (Osram L18W/77 Fluora, Munich, Germany) generated a light intensity of c. 50 µmol m−2 s−1 at plant height. Pads made of seed testing cellulose paper supplied by Cressbar® with approximately 400 seeds were used for garden cress and approximately 300 seeds for radish cress.
A total of five different nutrient solutions were supplied for the experiment, and 250 mL were poured into the Cressbar® trays over the seed pads at the beginning of germination. Nutrient solutions were not exchanged during the short-termed cultivation period. Solutions were three modified Hoagland solutions (Table 1), tap water (Table 2), and demineralized tap water. Both before and after the cultivation of the microgreens, the pH of the five nutrient solutions was determined by an inoLab® pH/ion 7320 benchtop meter (WTW, Weilheim, Germany) and the electrical conductivity of the solutions was measured with a digital multimeter pH/Cond 340i (WTW, Germany).
During germination, moisture was retained by transparent lids, which were removed from all variants as soon as the seedlings of one of the test variants had reached the height of the lid. This usually happened after 4–5 days. In the case of the variants with tap water and demineralized water, the height of the lid was not reached in this period. From the third day of the experiment, the shoot length was measured with a vernier caliper until harvest on the seventh day in case of radish cress and on the sixth day in case of garden cress. For harvesting, the microgreens were cut off with a scissor. Half of the plants were assigned to the chemical analysis, the second to the sensory test (c. 200 plants for garden cress and c. 150 for radish cress). In the case of the radish cress, the cotyledons and stems were separated for further analyses and the area of 10 randomly selected single cotyledons was estimated as the product of length times width (Figure 1); in addition, stem length was measured (10 measurements per each of the 10 replicates). In the case of the garden cress, entire shoots were stored. The fresh sample material was stored in freezer bags at −18 °C until freeze-drying (Alpha 1-2 LDplus, CHRIST Company, Osterode am Harz, Germany). Two of the 10 samples were pooled, and the created 5 samples were used as repetitions for the chemical analyses. The samples were then ground and stored in a desiccator with exclusion of light. To determine the water content, the fresh mass of the samples was measured after harvest and the dry mass after freeze-drying.

2.2. Ethanol Extraction

For the ethanol extraction, 0.1 g of the freeze-dried sample material was transferred to a test tube and mixed with 5 mL denatured ethanol (99.8%) for 10 min. The samples were centrifuged for 15 min at 4000 rpm and a temperature of 4 °C. The supernatant was transferred to 20 mL Erlenmeyer flasks. This process was repeated four times to achieve a total extraction volume of 20 mL. The extracts were then stored at −18 °C and used for the measurements of chlorophyll, total carotenoids, total phenols, flavonoids, anthocyanins, and antioxidant capacity.

2.3. Water Extraction

Of the freeze-dried sample, 0.1 g was mixed in test tubes with 10 mL of ultrapure water. The samples were placed in a shaking water bath at 60 °C for 60 min. The samples were centrifuged for 15 min at 4000 rpm and a temperature of 10 °C. After centrifugation, the liquid was filtered through a Rotilabo® round filter, type 113 A (Ø 110 mm), into 20 mL scintillation vials. The sample was then mixed again with 10 mL of ultrapure water and the process repeated in order to obtain 20 mL of extract from the sample. Finally, the extracts were stored at −18 °C. From the water extracts, the nitrate content was determined.

2.4. Analysis of the Compounds

To measure the chlorophyll (Chl) a, Chl b, and carotionoid (Car) content, the ethanol extracts were measured, according to Sumanta et al. [36], with the Agilent Cary 60 UV-Vis photometer (Agilent, Vienna, Austria).
The concentration of total phenolic compounds was determined spectrophotometrically using the colorimetric assay with Folin-Ciocalteu’s phenol reagent, according to Singleton and Rossi [37], with ethanol as an extraction agent, as described by Keutgen and Pawelzik [38], against gallic acid standards (0, 3.304, 6.608, 9.912; 13.216, 19.858 mg L−1). The measurement was performed at 735.8 nm, and the results were expressed in mg of gallic acid equivalents kg−1 dry mass.
Total flavonoids were determined colorimetrically from ethanol extracts, according to Keutgen et al. [39], at 510 nm against rutin standards (0, 50, 100, 150, 200, 1000 mg L−1). The results are expressed in g of rutin equivalents kg−1 dry mass.
The total anthocyanin content was determined by the pH difference method (pH 1.0 and pH 4.5) from ethanol extracts, in line with Lee et al. [40] and Purbaningtias et al. [41]. The used wavelength of 510 nm was the maximum wavelength for cyanidin-3-glucoside, while the wavelength of 700 nm was applied to correct for solution background. Two solutions were prepared to analyze the anthocyanin content. In the first solution, KCl buffer was used with pH 1 (0.025 M KCl solution), and for the second solution, Na-acetate buffer was used with pH 4.5 (0.4 M sodium acetate solution).
The antioxidant capacity was evaluated spectrophotometrically at 593 nm using the Ferric ion Reducing Antioxidant Power (FRAP) assay, as described by Keutgen and Pawelzik [38]. For comparison, six standards (0, 0.2, 0.4, 0.6, 0.8, 1 mM) were prepared with an iron sulfate stock solution.
The determination of the nitrate content was carried out with the water extract, in line with Miranda et al. [42]. In the first step, the nitrate was reduced to nitrite by vanadium (III), then nitrite was detected by the acidic Griess reaction, where the nitrite-containing sample was treated with sulfanilic acid (1 g sulfanilic acid in 100 mL 3 M HCL) and N-(1-naphthyl)ethylenediamine dihydrochloride solution (200 mg L−1). The test tubes were incubated for 30 min at 37 °C in a water bath, then transferred to semi-micro cuvettes and measured at 540 nm using the Agilent Cary 60 UV-Vis photometer. Nitrate contents from the water extracts were determined by comparing six standard solutions (0, 0.2, 0.5, 1, 2.5, 5 mg L−1).

2.5. Sensory Evaluation

The sensory evaluation took place in the sensory test room, which had four individual test stations with a color-neutral lighting and a special exhaust system. The test persons were not trained. Each person received five coded taste samples in irregular order. At each test appointment, a total of six persons, three male and three female, were interviewed. The average test duration was 30 min. A questionnaire handed out comprised various parameters, which were divided into the two main groups, “total flavor impression” and “visual appearance” (Table 3). At the end of the test, an overall evaluation of the variants for the two main groups had to be given. The scale of the sensory attributes comprised five degrees of expression for each of the properties queried, with “1” corresponding to the lowest preference and “5” to the highest preference.

2.6. Statistics

The statistical evaluation of the measured values was carried out with the statistics program IBM® SPSS® (Version 26). The level of significance was set at α = 0.05. The normal distribution of the data was tested with the Kolmogorov–Smirnov and Shapiro–Wilk tests, and in case one of the tests indicated a normal distribution, a normal distribution was assumed. For normally distributed data, the Levene test was applied to test for homogeneity of variances. An ANOVA was then performed, and the means were grouped using a Duncan’s post-hoc test. In some cases, it was necessary to stabilize the variances by transformation of the data. In the case of data that were not normally distributed, a Kruskal–Wallis test was used to check whether there were significant differences, which could be excluded in each case. The statistical evaluation of the sensory questionnaires was carried out with the Friedman test, which is based on a two-way analysis of variance by ranks. The significance level was adjusted by the Bonferroni correction for multiple tests.

3. Results

The growth of both cress cultivars responded differently to the increasing mineral content in the nutrient solution. A linear equation best expressed height growth of garden cress when considering the majority of the measurements (Figure 2). It is acknowledged that, in the case of demineralized water, a logarithmic or polynomial equation would produce a distinctly higher R2 than the linear equation, but it is preferred to apply the same type of curve fit for all nutrient solutions applied. Height growth was smallest in case of demineralized water. Growth with tap water was similar to growth within a 25% Hoagland solution. Height growth after application of a 100% Hoagland solution was only slightly larger than that after application of a 50% Hoagland solution. It is noteworthy that the correlation coefficient became smaller the more the mineral content in the nutrient solution decreased, which may be explained by a reduction of height growth during the last day of the experiment, especially when demineralized water, tap water, and 25% Hoagland solution were supplied (Figure 2). In contrast, a power function curve explained height growth of radish cress best (Figure 3), and, as in the case of garden cress, the differences between 100% and 50% Hoagland solution were small. The plants cultivated with 25% Hoagland solution performed better than those in tap water, and radish cress cultivated in demineralized water performed least. It is noteworthy that, on the seventh day of the experiment, the increase in height growth was reduced more distinctly in demineralized cultures than well-nourished cultures.
Stem length measured at the end of the experiment was largest when both cress cultivars received the highest mineral content in the nutrient solution and the smallest mineral content at the lowest concentration (Table 4). In addition, the estimated leaf area of single cotyledons was largest in radish cress supplied with 100% Hoagland solution and smallest in plants cultivated in demineralized water, thus confirming the growth response deduced from height growth.
Within the different kinds of Hoagland solutions and in tap water, the pH decreased during the course of the experiment but rose in the case of demineralized water in both kinds of cress (Figure 4). The increase was more distinct in garden cress than radish cress. In garden cress, a tendency towards a relatively higher pH at the end of the experiment became evident at 25% Hoagland solution and tap water.
The electrical conductivity was strongly influenced by the nutrient solution: the higher the concentration of the nutrient solution, the higher the EC-value (Figure 5). In the Hoagland solutions and in tap water, the EC was reduced at the end of the experiment. With demineralized water, it rose slightly during the experiment in the case of garden cress.
The concentration of the nutrient solution significantly influenced the water content of garden and radish cress, and the highest concentrated solution corresponded with the highest water content, while the lowest concentrated solution corresponded with the lowest water content in both cress cultivars (Table 5). As expected, nitrate content was highest in cress grown in the highest concentrated nutrient solution and lowest when grown in demineralized water (Table 6). Stems of radish cress achieved higher nitrate contents than cotyledons, and, in the variants supplied with tap water and demineralized water, nitrate was barely detectable in both cress cultivars.
Parallel to the nitrate content, total Chl, Chl a, and Chl b contents were highest at 100% Hoagland solution and lowest in demineralized water in both cress cultivars (Table 7, Table 8 and Table 9). Chl contents were rather low in stems of radish cress, as could be expected from their visual appearance. The Chl a/b ratio rose with decreasing amounts of minerals in the nutrient solutions. Car content decreased in cotyledons of radish cress and garden cress from 100% Hoagland solution to demineralized water (Table 7 and Table 9), whereas, in stems of radish cress, significant differences could not be detected (Table 8).
The total phenols content of the cotyledons of radish cress responded positively to an increasing mineral content in the nutrient solution (Table 10). However, differences between 100%, 50%, and 25% Hoagland were not significant, while the total phenols content of cotyledons of plants supplied with tap water was significantly smaller than that of plants grown with 100% Hoagland. Total phenols content of cotyledons that developed under demineralized water resembled that of cotyledons cultivated with tap water. The significant dependency of the total phenols content from the supplied nutrient solution was not reflected by flavonoid or anthocyanin content (Table 10), although, in the case of the flavonoid content, a decreasing tendency with decreasing mineral concentration in the nutrient solution became evident. The antioxidant capacity of cotyledons decreased slightly from 100% Hoagland solution to demineralized water (Table 10).
In contrast to the cotyledons, total phenols content of radish cress stems rose with decreasing concentration of the nutrient solution (Table 11). Flavonoids were detected, albeit at low concentrations, only in the case of plants that received demineralized water. Anthocyanin content rose significantly with a decreasing mineral concentration in the nutrient solution, while the antioxidant capacity of the stems was unaffected by the supplied kind of nutrient solution, though with a weak tendentious increase with decreasing mineral concentrations (Table 11).
In the case of garden cress, total phenols content was independent of the supplied nutrient solution (Table 12). Flavonoid content of the microgreens was not significantly affected either, but a tendentious increase in the case of decreasing concentrations in the nutrient solution became evident. Anthocyanin content rose significantly, whereas the antioxidant capacity was unaffected by the treatment (Table 12).
The untrained consumer tests rated the sensory attributes of the microgreens, focusing, on the one hand, on their total flavor impression and, on the other hand, their visual appearance. The total flavor impression decreased significantly with decreasing concentration of the nutrient solution in radish cress (Table 13). When the attributes “pungency”, “crispness”, and “typical aroma” and the presence of off-flavors were separately evaluated; only the last two attributes revealed a significant impact on the supplied nutrient solutions (Table 13). The aroma of radish cress cultivated with Hoagland nutrient solution, irrespective of the concentration, was rated as typical, whereas that of radish cress cultivated either in tap water or in demineralized water received a worse rating. A similar trend, though less obvious, was seen in the case of the presence of off-flavors.
With respect to the general visual appearance, only the variant grown in demineralized water achieved a significantly lower rating. The color impressions of the microgreens were perceived as similar among the nutrient solution variants (Table 14). However, the ratings of cotyledon appearance and stem length reflected the measurements of stem length and estimated leaf area (Table 4 and Table 14). It is noteworthy that, different to the total flavor impression, the rating of the general visual appearance in radish cress was not reflected by one or more of the attributes associated with this aspect.
Total flavor impression of garden cress was rated similar to radish cress by the untrained consumers: cress cultivated with 100% Hoagland solution was rated better than cress cultivated with demineralized water, whereby 100% and 50% Hoagland solution received the highest rating (Table 15). This rating was reflected by the attributes “crispness” and “typical aroma”. The test persons detected an off-flavor only in the case of the variant cultivated with demineralized water (Table 15).
In case of the general visual appearance, three well-defined groups could be distinguished: 100% and 50% Hoagland solution and 25% Hoagland solution and tap water, in addition to demineralized water (Table 16). This subdivision was recognized in all of the attributes associated with this aspect: color impressions, leaf appearance, and stem length (plant size).

4. Discussion

For the current microgreens study, it was decided to harvest all combinations on the same day, although in other studies, they were compared when of similar size [17]. Size had an obvious impact on the perception of the untrained consumers (Table 14 and Table 16), but the example of the radish cress indicated that the differences in size and cotyledon appearance negatively affected the general visual appearance, but only to a minor extent. When comparing radish cress with garden cress, it stands to reason that the untrained consumers were willing to accept size differences and rated the visual appearance mainly based on the color impression, which is frequently used as an indicator of product freshness [43]. The present results are in line with Caracciolo et al. [17] (p. 12), who argued that “the visual appearance of microgreens has high consumer appreciation”.
The current study set out to examine the cultivation of cress microgreens under practical culture conditions comparable to private households, where marketing success was not determined by the optimum marketing or harvesting date, but cultivation and harvest were rather determined by the short-term requirements of the consumers. Consequently, plant size was not the decisive parameter, but the planned harvesting date. Hence, for the present study, it was decided to harvest all nutrient solution combinations at the same date.
The observed decrease in plant height was well in line with the observation of a variety of authors that fresh mass decreases in the case of nutrient deficiency [25,31,32]. A deficiency of nutrients, especially of nitrogen and phosphorus, reduces plant growth, leaf development, and biomass production [44].
It is noteworthy that, even when 100% Hoagland solution was supplied, nitrate content was marginal but still below the limits imposed by the European Commission Regulation (EU) No. 1258/2011 when reference was made to fresh lettuce grown in the open air (3 g kg−1 fresh mass). Since nitrate accumulation in microgreens is modulated by the nitrogen concentration in the nutrient solution [45], its limitation is easily achieved, since a quality reduction was not detected by the untrained consumer tests down to a concentration of 25% Hoagland solution in the case of radish cress and down to 50% Hoagland solution in garden cress (Table 13 and Table 15).
Total Chl, Chl a, and Chl b concentrations were dictated mainly by the fertigation treatment similar to nitrate content but less distinctly. Chl contents and Car contents of both cress cultivars supplied with 100% Hoagland and 50% Hoagland solution did not differ significantly in the case of radish cress, including the 25% Hoagland treatment, indicating that an increased nutrient supply would not result in higher contents of Chl and Car. Nitrogen is an important component of many structural and metabolic cell compounds, such as chlorophyll, amino acids, and enzymes, such as ribulose-1,5-bisphosphate carboxylase-oxygenase. As a consequence, nitrogen deficiency limits photosynthesis and plant growth [25,46,47]. The Chl a/b ratio is highest at low levels of minerals in the nutrient solution, which might reflect that relatively more Chl molecules are partitioned into the light harvesting complex, where only Chl a is present. Carotenoids, especially when present in the leaf, contribute to the protection of the photosynthetic system [48], and, hence, a correlation exists between Chl and Car content. Consequently, it is not surprising that Car content is highest in cress plants cultivated in the nutrient solution with the highest mineral content. For the human immune system, chlorophyll and carotenoids (lutein, β-carotene) are essential because they possess a free-radical scavenging function. Additionally, carotenoids also protect the eye tissue [10,49].
Total phenols content responded variably in the present study (Table 10, Table 11 and Table 12). In cotyledons of radish cress, it was highest when plants were cultivated with 100% Hoagland and lowest when demineralized water was supplied. In contrast, it was the opposite in the stems of radish cress, whereas in garden cress, total phenols content was unaffected by the applied nutrient solution. Phenols are characterized by one or more hydroxyl groups bonded directly to an aromatic hydrocarbon group and form a rather large group. Hence, a nutrient deficiency may modify the metabolism in different ways. In addition, the ratio of the concentrations of the phenols to each other may vary distinctly from day to day during sprouting [50], and, therefore, differences in total phenols content might be explained by the physiological state of the cress variants, because a nutrient deficiency may delay developmental processes. Alternatively, an inhibition of growth could also result in a shift of the available carbon towards compounds not containing, e.g., nitrogen, such as carbohydrates or phenolic compounds, thus inducing species- and even cultivar-dependent changes of total phenols content.
Important compounds of microgreens are also flavonoids, which are polyphenols with a wide range of structures, categorized mainly into flavones, flavanols, isoflavones, flavonols, flavanones, flavanonols, and chalcones [51]. Generally, they have an immunomodulatory effect on the human immune system and their diverse structures may be related to numerous properties, including antioxidant, antibacterial, anti-cancer, anti-mutagenic, and anti-inflammatory effects [51,52,53,54]. There was a clear tendency towards elevated flavonoid contents in well-nourished cotyledons of radish cress. In contrast, flavonoid contents tended to be higher in garden cress cultivated with demineralized water (Table 10, Table 11 and Table 12), indicating that the relationship is species-dependent and cannot be generalized. Neugart et al. [8] summarized that nitrogen supply correlates negatively with flavonoid concentrations in brassicaceous vegetables, which would classify the present result for radish cress cotyledons as unusual.
Anthocyanins may be regarded as so-called defensive flavonoids, the synthesis of which comes along with additional energy costs, which may delay plant growth or development [55]. In the cotyledons of radish cress, anthocyanin content was independent of the supplied nutrient solutions, but in stems, it rose with decreasing mineral content. In the case of garden cress, anthocyanin content was also highest when plants were cultivated in demineralized water and smallest when grown in 100% Hoagland solution. Similar observations are reported for rocket, cabbage, and lettuce under nutrient deficiency [25,56]. Anthocyanins are frequently found in the Brassicaceae family, to which garden and radish cress belongs, and they confer the purple color of some varieties [7]. Di Gioia et al. [7] reported an up-regulation of anthocyanins’ biosynthesis in case of phosphorus and nitrogen deficiency in red cabbage. This interpretation may explain the results of the present study.
The antioxidant capacity may be rated as a superordinate property of the examined cress compounds and other components with importance for human health. While the antioxidant capacity remained unaffected by the supplied nutrient solution in the case of garden cress and stems of radish cress, it was highest in the cotyledons of radish cress grown in 100% Hoagland solution and lowest when cultivated in demineralized water; however, even the effect in cotyledons was barely detectable (Table 10, Table 11 and Table 12). It may be considered that a modification of the nutrient solution composition has only a minor influence on the health potential of all compounds in garden and radish cress. For garden cress, it may be summarized that anthocyanin and flavonoid content were highest in the case of tap water and demineralized water, while carotenoid content was highest when Hoagland nutrient solution was supplied. Radish cress contained elevated amounts of anthocyanins in the stems when cultivated in tap water and demineralized water but higher amounts of flavonoids and carotenoids in the cotyledons when Hoagland solution was supplied. The variations in the total phenols content of cotyledons and stems have cancelled each other out in radish cress.
In the present study, the untrained consumers consistently attributed higher scores to the cress cultivars grown with Hoagland solution than with demineralized water and tap water. In the case of garden cress, the rating of the general visual appearance and total flavor impression revealed that only cultivation with 100% and 50% Hoagland solution was acceptable for the consumers, despite low contents of anthocyanin and flavonoids. Demineralized water resulted in an off flavor. In summary, cultivation with tap water, which is the common practice in private households, may represent an attractive combination of consumers’ acceptability and health promoting compounds.
In the case of radish cress, the general visual appearance disqualified only the variant cultivated in demineralized water. However, off-flavors and a less attractive aroma were identified in the plants grown in demineralized and tap water. For the cultivation, application of Hoagland solution (25%, possibly 50%) may be recommended, mainly to increase consumer satisfaction with their own cultivation product. In addition, higher amounts of flavonoids and carotenoids in the cotyledons may be expected. However, this would require private households to be provided with an appropriate nutrient solution. If, for practical reasons, a cultivation with tap water would be considered, the advantage would represent a higher anthocyanin content.
A comparison of the nutritional statuses of radish cress cultivated in 25% modified Hoagland solution and garden cress in tap water, with the statuses of other important or popular vegetable species, is difficult because information on the nutritional status of vegetables varies considerably in the literature. The reported data depend on cultivation conditions, the developmental stage of plants at harvest, analytical procedures applied, and the expression of the compounds per fresh or dry mass, because water content is influenced, e.g., by cultivation conditions (Table 5). Although it is generally stated that microgreens are characterized by high amounts of secondary metabolites compared to their mature counterparts [6,25], further studies revealed different, more nuanced conclusions. De la Fuente et al. [57] investigated the content of antioxidant bioactive compounds in broccoli (Brassica oleracea L. var. italica Plenck), green curly kale (Brassica oleracea L. var. sabellica L.), red mustard (Brassica juncea (L.) Czern.), and radish (Raphanus sativus L.) and reported that the contents of total carotenoids were higher in the microgreens than in their mature counterparts. At the same time, total soluble phenols contents were either smaller or similar in mature plants, depending on the literature sources referring to the latter growth stage, while anthocyanin contents were independent of the developmental stage. In contrast, in a study on three wild species of microgreens and baby greens, the latter were characterized by higher carotenoid concentrations, but significant differences in the chlorophyll contents between the two growth stages were not found [23]. Last but not least, Di Bella et al. [58] compared the contents of bioactive compounds of two broccoli cultivars and kale when harvested as sprouts, microgreens, and baby leaves and reported significant interactions between plant species and plant growth stage.
With regard to the different results for the compounds as affected by the growth stage of the vegetables, a comparison of radish cress cultivated in 25% modified Hoagland solution and garden cress in tap water with further microgreens was made. The results of the present study were converted from dry mass to fresh mass (FM) for comparison purposes, since the majority of the literature data was based on the fresh mass. Hence, the antioxidant capacity (FRAP assay) was 16 mmol kg−1 FM for garden cress and 20 mmol kg−1 FM for radish cress leaves. The latter is quite comparable to that reported by Ghoora et al. [59] for radish microgreens (22.7 mmol kg−1 FM). The same study characterized further microgreens by their FRAP-values, some by higher values, such as fennel (38.7 mmol kg−1 FM), roselle (36.3 mmol kg−1 FM), and sunflower (29.2 mmol kg−1 FM), and also microgreens with similar or lower values (French brasil 20.1 mmol kg−1 FM; carrot 17.8 mmol kg−1 FM; spinach 10.4 mmol kg−1 FM; mustard 9.3 mmol kg−1 FM; onion 7.9 mmol kg−1 FM). If the antioxidant capacity is accepted as a superordinate property characterizing the potential human health benefits of the microgreens, this would suggest a medium position for radish and garden cress cultivated in the recommended nutrient solutions. The ranking indicated by the antioxidant capacity was well reflected by the total phenols content, which was highest in roselle microgreens (c. 0.7 g GAE kg−1 FM), followed by fennel and radish (c. 0.6 g GAE kg−1 FM) [59]. However, the calculated total phenols content of radish leaves (0.24 g GAE kg−1 FM) was distinctly smaller; smaller even than the phenols contents of mustard (c. 0.5 g GAE kg−1 FM), sunflower (c. 0.4 g GAE kg−1 FM), carrot (c. 0.35 g GAE kg−1 FM), and French brasil (c. 0.3 g GAE kg−1 FM) [59]. The total phenols content of garden cress (0.24 g GAE kg−1 FM) resembled that of garden cress (0.3 g GAE kg−1 FM) reported by Kyriacou et al. [5]. Total phenols contents of onions and spinach (0.2 g GAE kg−1 FM) were smallest [59]. In summary, the ranking reflected the deduction from the FRAP-values, with the exception of mustard, which had a higher content of phenolic compounds than could be expected from its antioxidant capacity.
Concerning the flavonoid contents, the calculated concentrations for garden cress (1.9 g RE kg−1 FM) and radish cress leaves (1.8 g RE kg−1 FM) were in line with those of Lobiuc et al. [60] for green and red basil (3–7 g of catechin equivalents kg−1 FM). However, they were an order of magnitude larger than those reported by Ghoora et al. [59]. In the latter study, the following ranking for flavonoid contents was reported: roselle > sunflower > fennel > carrot > French basil > spinach > radish > onion > mustard microgreens. Taking into account the relative position of basil and radish microgreens, it may be hypothesized that, in agreement with our, a medium to low amount of flavonoids is produced by the selected garden and radish cress microgreens.
Information on plant anthocyanin content in literature varies. While Lobiuc et al. [60] reported high amounts for red basil microgreens (1.44 g kg−1 FM), those reported here for radish cress stems (0.36 g kg−1 FM) and leaves (0.15 g kg−1 FM) were quite comparable with those reported by Lenzi et al. [23] for small burnet (Sanguisorba minor Scop.), wild mustard (Sinapis arvensis L.), and common dandelion (Taraxacum officinale Weber ex F.H. Wigg.) microgreens (0.10–0.15 g kg−1 FM). The anthocyanin content of garden cress (0.012 g kg−1 FM) that we cultivated in tap water was low, being in the range of mustard (0.036 g kg−1 FM) and broccoli (0.012 g kg−1 FM), as reported in De la Fuente [57]. Further studies [25,57] on radish, kale, Brussel sprouts, cabbage, and rocket microgreens reported even smaller anthocyanin contents (0.001–0.006 g kg−1 FM), indicating that both the selection of the cultivar and growing conditions strongly affect the content of this value adding compound.
A comparison of the calculated carotenoid content with literature data was complicated by the fact that different approaches were applied in different investigations. Strategies comparable to this study were used by Mlinarić et al. [61] (chia microgreens: 0.12 g kg−1 FM) and Lobiuc et al. [60] (green and red basil microgreens: 0.10–0.11 g kg−1 FM). Indeed, these results were in line with those reported for the carotenoid content of radish cress leaves (0.095 g kg−1 FM), but less so with garden cress (0.041 g kg−1 FM). From the data reported by Ghoora et al. [59], the following ranking for carotenoid contents was deduced for a larger number of vegetable microgreens: carrot > mustard > sunflower > roselle > French basil > fennel > radish > onion > spinach. Again, in this ranking, the position of basil with a higher carotenoid content than radish reflected the comparison of the data supplied by Lobiuc et al. [60] with the results of the present study. As a consequence, it may be deduced that the carotenoid content of radish cress grown in 25% Hoagland solution is in the medium range for microgreens, whereas that of garden cress cultivated with tap water is comparatively low.
In summary, under our recommended conditions for the cultivation of radish cress (25% Hoagland solution), the produced antioxidant capacity was typical for this cultivar and in the medium range for microgreens. The total phenols contents was rather lower than usually reported, while flavonoid contents was medium rated. Nevertheless, anthocyanin content of radish cress was above average, while carotenoid content was in the medium range for microgreens. The recommended cultivation of garden cress in tap water produced microgreens with an antioxidant capacity typical of this cultivar and in the medium range for microgreens. The total phenols content was typical for garden cress, but low when compared with other microgreens species. Flavonoid and anthocyanin contents were medium rated, although the latter tended to be elevated under the suggested growth conditions. Carotenoid content of garden cress was lower than usual for microgreens.

5. Conclusions

The present study revealed that consumer acceptance of a product and its content in terms of value adding compounds do not necessarily correspond with each other, at least in the case of garden and radish cress. Although controlling the composition of the nutrient solution, especially the induction of a moderate nutrient deficiency, may represent a useful tool to modulate the levels of functional compounds in microgreens naturally, consumers’ acceptance, given by the preferred appearance, flavor, and texture of the product, should also be considered in order to select the adequate composition of the nutrient solution. Only the combined investigation of all quality aspects can exploit the full potential of microgreens to meet consumer requirements for healthier food beyond their content of biochemical compounds and add a special visual and taste experience that underlines the perceived naturalness of microgreens.

Author Contributions

Conceptualization, N.K., A.J.K. and M.T.-S.; methodology, A.J.K., N.K. and M.T.-S.; validation, A.J.K. and M.T.-S.; formal analysis, N.K. and M.H.; investigation, M.H. and N.K.; resources, A.J.K.; data curation, N.K. and M.H.; writing—original draft preparation, N.K. and M.H.; writing—review and editing, A.J.K. and M.T.-S.; visualization, N.K.; supervision, A.J.K.; project administration, N.K. and A.J.K.; funding acquisition, A.J.K. The experiments presented here are part of the Master thesis of M.H. All authors have read and agreed to the published version of the manuscript.

Funding

The article processing charges was funded by the BOKU Vienna Open Access Publishing Fund.

Institutional Review Board Statement

Not applicable.

Informed Consent Statement

Informed consent was obtained from all subjects involved in the study.

Data Availability Statement

The data are stored on the server of the BOKU University and will be made available on request for non-commercial studies.

Conflicts of Interest

The authors declare no conflict of interest.

References

  1. Kyriacou, M.C.; Rouphael, Y.; Di Gioia, F.; Kyratzis, A.; Serio, F.; Renna, M.; De Pascale, S.; Santamaria, P. Micro-scale vegetable production and the rise of microgreens. Trends Food Sci. Technol. 2016, 57, 103–115. [Google Scholar] [CrossRef]
  2. Brentlinger, D.J. New trends in hydroponic crop production in the US. In Proceedings of the International Conference and Exhibition on Soilless Culture: ICESC 2005, Singapore, 5–8 September 2005; Volume 742, pp. 31–33. [Google Scholar] [CrossRef]
  3. Kyriacou, M.C.; El-Nakhel, C.; Graziani, G.; Pannico, A.; Soteriou, G.A.; Giordano, M.; Ritieni, A.; De Pascale, S.; Rouphael, Y. Functional quality in novel food sources: Genotypic variation in the nutritive and phytochemical composition of thirteen microgreens species. Food Chem. 2019, 277, 107–118. [Google Scholar] [CrossRef]
  4. Xiao, Z.; Lester, G.E.; Park, E.; Saftner, R.A.; Luo, Y.; Wang, Q. Evaluation and correlation of sensory attributes and chemical compositions of emerging fresh produce: Microgreens. Postharvest Biol. Technol. 2015, 110, 140–148. [Google Scholar] [CrossRef]
  5. Kyriacou, M.C.; El-Nakhel, C.; Pannico, A.; Graziani, G.; Soteriou, G.A.; Giordano, M.; Zarrelli, A.; Ritieni, A.; De Pascale, S.; Rouphael, Y. Genotype-specific modulatory effects of select spectral bandwidths on the nutritive and phytochemical composition of microgreens. Front. Plant Sci. 2019, 10, 1501. [Google Scholar] [CrossRef] [PubMed]
  6. El-Nakhel, C.; Pannico, A.; Graziani, G.; Kyriacou, M.C.; Giordano, M.; Ritieni, A.; De Pascale, S.; Rouphael, Y. Variation in macronutrient content, phytochemical constitution and in vitro antioxidant capacity of green and red butterhead lettuce dictated by different developmental stages of harvest maturity. Antioxidants 2020, 9, 300. [Google Scholar] [CrossRef] [PubMed] [Green Version]
  7. Di Gioia, F.; Tzortzakis, N.; Rouphael, Y.; Kyriacou, M.C.; Sampaio, S.L.; Ferreira, I.C.; Petropoulos, S.A. Grown to Be Blue—Antioxidant Properties and Health Effects of Colored Vegetables. Part II: Leafy, Fruit, and Other Vegetables. Antioxidants 2020, 9, 97. [Google Scholar] [CrossRef] [PubMed] [Green Version]
  8. Neugart, S.; Baldermann, S.; Hanschen, F.S.; Klopsch, R.; Wiesner-Reinhold, M.; Schreiner, M. The intrinsic quality of brassicaceous vegetables: How secondary plant metabolites are affected by genetic, environmental, and agronomic factors. Sci. Hortic. 2018, 233, 460–478. [Google Scholar] [CrossRef]
  9. Kapusta-Duch, J.; Kopec, A.; Piatkowska, E.; Borczak, B.; Leszczynska, T. The beneficial effects of Brassica vegetables on human health. Rocz. Państwowego Zakładu Hig. 2012, 63, 389–395. [Google Scholar]
  10. Kamal, K.Y.; Khodaeiaminjan, M.; El-Tantawy, A.A.; Moneim, D.A.; Salam, A.A.; Ash-shormillesy, S.M.A.I.; Attia, A.; Ali, M.A.S.; Herranz, R.; El-Esawi, M.A.; et al. Evaluation of growth and nutritional value of Brassica microgreens grown under red, blue and green LEDs combinations. Physiol. Plant. 2020, 169, 625–638. [Google Scholar] [CrossRef]
  11. Di Gioia, F.; Renna, M.; Santamaria, P. Sprouts, microgreens and baby leaf vegetables. In Minimally Processed Refrigerated Fruits and Vegetables; Springer: Boston, MA, USA, 2017; pp. 403–432. [Google Scholar] [CrossRef]
  12. Pannico, A.; El-Nakhel, C.; Graziani, G.; Kyriacou, M.C.; Giordano, M.; Soteriou, G.A.; Zarrelli, A.; Ritieni, A.; De Pascale, S.; Rouphael, Y. Selenium biofortification impacts the nutritive value, polyphenolic content, and bioactive constitution of variable microgreens species. Antioxidants 2020, 9, 272. [Google Scholar] [CrossRef] [Green Version]
  13. El-Nakhel, C.; Pannico, A.; Kyriacou, M.C.; Giordano, M.; De Pascale, S.; Rouphael, Y. Macronutrient deprivation eustress elicits differential secondary metabolites in red and green-pigmented butterhead lettuce grown in a closed soilless system. J. Sci. Food Agric. 2019, 99, 6962–6972. [Google Scholar] [CrossRef]
  14. Choe, U.; Yu, L.L.; Wang, T.T.Y. The science behind microgreens as an exciting new food for the 21st century. J. Agric. Food Chem. 2018, 66, 11519–11530. [Google Scholar] [CrossRef]
  15. Xiao, Z.; Lester, G.E.; Luo, Y.; Wang, Q. Assessment of vitamin and carotenoid concentrations of emerging food products: Edible microgreens. J. Agric. Food Chem. 2012, 60, 7644–7651. [Google Scholar] [CrossRef] [PubMed]
  16. Mir, S.A.; Shah, M.A.; Mir, M.M. Microgreens: Production, shelf life, and bioactive components. Crit. Rev. Food Sci. Nutr. 2017, 57, 2730–2736. [Google Scholar] [CrossRef] [PubMed]
  17. Caracciolo, F.; El-Nakhel, C.; Raimondo, M.; Kyriacou, M.C.; Cembalo, L.; De Pascale, S.; Rouphael, Y. Sensory attributes and consumer acceptability of 12 microgreens species. Agronomy 2020, 10, 1043. [Google Scholar] [CrossRef]
  18. Treadwell, D.; Hochmuth, R.; Landrum, L.; Laughlin, W. Microgreens: A New Specialty Crop. EDIS 2020, 5, 1–3. [Google Scholar] [CrossRef]
  19. Gerovac, J.R.; Craver, J.K.; Boldt, J.K.; Lopez, R.G. Light intensity and quality from sole-source light-emitting diodes impact growth, morphology, and nutrient content of Brassica microgreens. HortScience 2016, 51, 497–503. [Google Scholar] [CrossRef] [Green Version]
  20. Waterland, N.L.; Moon, Y.; Tou, J.C.; Kopsell, D.A.; Kim, M.J.; Park, S. Differences in leaf color and stage of development at harvest influenced phytochemical content in three cultivars of kale (Brassica oleracea L. and B. napus). J. Agric. Sci. 2019, 11, 14. [Google Scholar] [CrossRef]
  21. Kyriacou, M.C.; El-Nakhel, C.; Pannico, A.; Graziani, G.; Soteriou, G.A.; Giordano, M.; Palladino, M.; Ritieni, A.; De Pascale, S.; Rouphael, Y. Phenolic constitution, phytochemical and macronutrient content in three species of microgreens as modulated by natural fiber and synthetic substrates. Antioxidants 2020, 9, 252. [Google Scholar] [CrossRef] [Green Version]
  22. Bulgari, R.; Baldi, A.; Ferrante, A.; Lenzi, A. Yield and quality of basil, Swiss chard, and rocket microgreens grown in a hydroponic system. N. Z. J. Crop Hort. 2017, 45, 119–129. [Google Scholar] [CrossRef]
  23. Lenzi, A.; Orlandini, A.; Bulgari, R.; Ferrante, A.; Bruschi, P. Antioxidant and mineral composition of three wild leafy species: A comparison between microgreens and baby greens. Foods 2019, 8, 487. [Google Scholar] [CrossRef] [PubMed] [Green Version]
  24. Palmitessa, O.D.; Renna, M.; Crupi, P.; Lovece, A.; Corbo, F.; Santamaria, P. Yield and quality characteristics of brassica microgreens as affected by the NH4:NO3 molar ratio and strength of the nutrient solution. Foods 2020, 9, 677. [Google Scholar] [CrossRef]
  25. El-Nakhel, C.; Pannico, A.; Graziani, G.; Kyriacou, M.C.; Gaspari, A.; Ritieni, A.; De Pascale, S.; Rouphael, Y. Nutrient supplementation configures the bioactive profile and production characteristics of three Brassica L. microgreens species grown in peat-based media. Agronomy 2021, 11, 346. [Google Scholar] [CrossRef]
  26. Gruda, N. Does soilless culture have an influence on product quality of vegetables? J. Appl. Bot. Food Qual. 2009, 2, 141–147. [Google Scholar] [CrossRef]
  27. Raskin, I.; Ribnicky, D.M.; Komarnytsky, S.; Ilic, N.; Poulev, A.; Borisjuk, N.; Brinker, A.; Moreno, D.A.; Ripoll, C.; Yakoby, N.; et al. Plants and human health in the twenty-first century. Trends Biotechnol. 2002, 20, 522–531. [Google Scholar] [CrossRef]
  28. Oancea, S.; Oprean, L. Anthocyanins, from biosynthesis in plants to human health benefits. Acta Univ. Cinbinesis Ser. E Food Technol. 2011, 15, 3–16. [Google Scholar]
  29. Rouphael, Y.; Kyriacou, M.C. Enhancing quality of fresh vegetables through salinity eustress and biofortification applications facilitated by soilless cultivation. Front. Plant Sci. 2018, 9, 1254. [Google Scholar] [CrossRef] [PubMed]
  30. Teklić, T.; Parađiković, N.; Špoljarević, M.; Zeljković, S.; Lončarić, Z.; Lisjak, M. Linking abiotic stress, plant metabolites, biostimulants and functional food. Ann. Appl. Biol. 2020, 178, 169–191. [Google Scholar] [CrossRef]
  31. Murphy, C.; Pill, W. Cultural practices to speed the growth of microgreen arugula (roquette; Eruca vesicaria subsp. sativa ). J. Hortic. Sci. Biotechnol. 2010, 85, 171–176. [Google Scholar] [CrossRef]
  32. Wieth, A.R.; Pinheiro, W.D.; Duarte, T.S. Purple cabbage microgreens grown in different substrates and nutritive solution concentrations | Microgreens de repolho roxo cultivado em diferentes substratos e concentrações de solução nutritiva. Rev. Caatinga 2019, 32, 976–985. [Google Scholar] [CrossRef] [Green Version]
  33. Renna, M.; Di Gioia, F.; Leoni, B.; Mininni, C.; Santamaria, P. Culinary assessment of self-produced microgreens as basic ingredients in sweet and savory dishes. J. Culinary Sci. Technol. 2017, 15, 126–142. [Google Scholar] [CrossRef]
  34. Michell, K.A.; Isweiri, H.; Newman, S.E.; Bunning, M.; Bellows, L.L.; Dinges, M.M.; Prenni, J.E. Microgreens: Consumer sensory perception and acceptance of an emerging functional food crop. J. Food Sci. 2020, 85, 926–935. [Google Scholar] [CrossRef]
  35. Suki, N.M. Consumer environmental concern and green product purchase in Malaysia: Structural effects of consumption values. J. Clean. Prod. 2016, 132, 204–214. [Google Scholar] [CrossRef] [Green Version]
  36. Sumanta, N.; Haque, C.I.; Nishika, J.; Suprakash, R. Spectrophotometric analysis of chlorophylls and carotenoids from commonly grown fern species by using various extracting solvents. Res. J. Chem. Sci. 2014, 2231, 606X. [Google Scholar] [CrossRef] [Green Version]
  37. Singleton, V.L.; Rossi, J.A. Colorimetry of total phenolics with phosphomolybdic-phosphotungstic acid reagent. Am. J. Enol. Vitic. 1965, 16, 144–158. [Google Scholar]
  38. Keutgen, A.J.; Pawelzik, E. Modifications of strawberry fruit antioxidant pools and fruit quality under NaCl stress. J. Agric. Food Chem. 2007, 55, 4066–4072. [Google Scholar] [CrossRef]
  39. Keutgen, A.J.; Wszelaczyńska, E.; Pobereżny, J.; Przewodowska, A.; Przewodowski, W.; Milczarek, D.; Tatarowska, B.; Flis, B.; Keutgen, N. Antioxidant properties of potato tubers (Solanum tuberosum L.) as a consequence of genetic potential and growing conditions. PLoS ONE 2019, 14, e0222976. [Google Scholar] [CrossRef] [PubMed]
  40. Lee, J.; Durst, R.; Wrolstad, R. Determination of total monomeric anthocyanin pigment content of fruit juices, beverages, natural colorants, and wines by the pH differential method: Collaborative study. J. AOAC Int. 2005, 88, 1269–1278. [Google Scholar] [CrossRef] [Green Version]
  41. Purbaningtias, T.E.; Aprilia, A.C.; Fauziáh, L. The study of temperature and UV light effect in anthocyanin extract from dragon fruit (Hylocereus costaricensis) rind using UV-Visible spectrophotometer. AIP Conf. Proc. 2017, 1911, 020014. [Google Scholar] [CrossRef] [Green Version]
  42. Miranda, K.M.; Espey, M.G.; Wink, D.A. A rapid, simple spectrophotometric method for simultaneous detection of nitrate and ntrite. Nitric Oxide 2001, 5, 62–71. [Google Scholar] [CrossRef]
  43. Qiu, Y.; Zhao, Y.; Liu, J.; Guo, Y. A statistical analysis of the freshness of postharvest leafy vegetables with application of water based on chlorophyll fluorescence measurement. Inf. Process. Agric. 2017, 4, 269–274. [Google Scholar] [CrossRef]
  44. Verma, N.; Shukla, S. Impact of various factors responsible for fluctuation in plant secondary metabolites. J. Appl. Res. Med. Aromat. Plants 2015, 2, 105–113. [Google Scholar] [CrossRef]
  45. Kyriacou, M.C.; Soteriou, G.A.; Colla, G.; Rouphael, Y. The occurrence of nitrate and nitrite in Mediterranean fresh salad vegetables and its modulation by preharvest practices and postharvest conditions. Food Chem. 2019, 285, 468–477. [Google Scholar] [CrossRef]
  46. Tuncay, Ö.; Eşiyok, D.; Yağmur, B.; Okur, B. Yield and quality of garden cress affected by different nitrogen sources and growing period. Afr. J. Agr. Res. 2011, 6, 608–617. [Google Scholar]
  47. Berges, J.A.; Charlebois, D.O.; Mauzerall, D.C.; Falkowski, P.G. Differential effects of nitrogen limitation on photosynthetic efficiency of photosystems I and II in microalgae. Plant Physiol. 1996, 110, 689–696. [Google Scholar] [CrossRef] [Green Version]
  48. Young, A.J. The photoprotective role of carotenoids in higher plants. Physiol. Plant. 1991, 83, 702–708. [Google Scholar] [CrossRef]
  49. Pareek, S.; Sagar, N.A.; Sharma, S.; Kumar, V.; Agarwal, T.; Gonzalez-Aguilar, G.A.; Yahia, E.M. Chlorophylls: Chemistry and biological functions. In Fruit and Vegetable Phytochemicals: Chemistry and Human Health, 2nd ed.; Yahia, E.M., Ed.; Wiley-Blackwell, John Wiley & Sons, Ltd.: Hoboken, NJ, USA, 2017; Volume 1, pp. 269–284. [Google Scholar] [CrossRef]
  50. Abdel-Aty, A.M.; Salama, W.H.; Fahmy, A.S.; Mohamed, S.A. Impact of germination on antioxidant capacity of garden cress: New calculation for determination of total antioxidant activity. Sci. Hortic. 2019, 246, 155–160. [Google Scholar] [CrossRef]
  51. Middleton, E.; Kandaswami, C.; Theoharides, T.C. The effects of plant flavonoids on mammalian cells: Implications for inflammation, heart disease, and cancer. Pharmacol. Rev. 2000, 52, 673–751. [Google Scholar] [PubMed]
  52. Ravishankar, D.; Rajora, A.K.; Greco, F.; Osborn, H.M. Flavonoids as prospective compounds for anti-cancer therapy. Int. J. Biochem. Cell Biol. 2013, 45, 2821–2831. [Google Scholar] [CrossRef] [PubMed]
  53. Cardenas, C.; Quesada, A.R.; Medina, M.A. Anti-angiogenic and anti-inflammatory properties of kahweol, a coffee diterpene. PLoS ONE 2011, 6, e23407. [Google Scholar] [CrossRef]
  54. Hosseinzade, A.; Sadeghi, O.; Biregani, A.N.; Soukhtehzari, S.; Brandt, G.S.; Esmaillzadeh, A. Immunomodulatory effects of flavonoids: Possible induction of T CD4+ regulatory cells through suppression of mTOR pathway signaling activity. Front. Immunol. 2019, 10, 51. [Google Scholar] [CrossRef] [Green Version]
  55. Toscano, S.; Trivellini, A.; Cocetta, G.; Bulgari, R.; Francini, A.; Romano, D.; Ferrante, A. Effect of preharvest abiotic stresses on the accumulation of bioactive compounds in horticultural produce. Front. Plant Sci. 2019, 10, 1212. [Google Scholar] [CrossRef] [PubMed] [Green Version]
  56. Islam, M.; Lee, Y.-T.; Mele, M.; Choi, I.-L.; Kang, H.-M. The effect of phosphorus and root zone temperature on anthocyanin of red Romaine lettuce. Agronomy 2019, 9, 47. [Google Scholar] [CrossRef] [Green Version]
  57. De la Fuente, B.; López-García, G.; Máñez, V.; Alegría, A.; Barberá, R.; Cilla, A. Evaluation of the bioaccessibility of antioxidant bioactive compounds and minerals of four genotypes of Brassicaceae microgreens. Foods 2019, 8, 250. [Google Scholar] [CrossRef] [Green Version]
  58. Di Bella, M.C.; Niklas, A.; Toscano, S.; Picchi, V.; Romano, D.; Lo Scalzo, R.; Branca, F. Morphometric characteristics, polyphenols and ascorbic acid variation in Brassica oleracea L. novel foods: Sprouts, microgreens and baby leaves. Agronomy 2020, 10, 782. [Google Scholar] [CrossRef]
  59. Ghoora, M.D.; Haldipur, A.C.; Srividya, N. Comparative evaluation of phytochemical content, antioxidant capacities and overall antioxidant potential of select culinary microgreens. J. Agric. Food Res. 2020, 2, 100046. [Google Scholar] [CrossRef]
  60. Lobiuc, A.; Vasilache, V.; Pintilie, O.; Stoleru, T.; Burducea, M.; Oroian, M.; Zamfirache, M.M. Blue and red LED illumination improves growth and bioactive compounds contents in acyanic and cyanic Ocimum basilicum L. microgreens. Molecules 2017, 22, 2111. [Google Scholar] [CrossRef] [Green Version]
  61. Mlinarić, S.; Gvozdić, V.; Vukovic, A.; Varga, M.; Vlašiček, I.; Cesar, V.; Begović, L. The effect of light on antioxidant properties and metabolic profile of chia microgreens. Appl. Sci. 2020, 10, 5731. [Google Scholar] [CrossRef]
Figure 1. Cotyledon width (left), measured at the widest part of the leaf; cotyledon length (middle), measured from the leaf indentation to the beginning of the stem; stem length (right), measured from the first node to the beginning of the root of radish cress.
Agronomy 11 01110 g001
Figure 2. Average height growth of garden cress. A straight line through the origin connects the data points of the graph. R2 is the square of the correlation coefficient.
Agronomy 11 01110 g002
Figure 3. Average height growth of radish cress. A power function curve connects the data points of the graph. R2 is the square of the correlation coefficient.
Agronomy 11 01110 g003
Figure 4. Average pH of the nutrient solution of two measurements at the beginning of cultivation and at harvest of the microgreens radish and garden cress.
Agronomy 11 01110 g004
Figure 5. Average electrical conductivity (EC) of the nutrient solution of two measurements at the beginning of cultivation and at harvest of the microgreens, radish and garden cress.
Agronomy 11 01110 g005
Table 1. Composition of the three Hoagland nutrient solutions applied during the study.
Nutrient SolutionCaSO4 [mg L−1]MgSO4 [mg L−1]K2HPO4 [mg L−1]KNO3 [mg L−1]
100% Hoagland172123114354
50% Hoagland8661.557177
25% Hoagland4330.7528.588.5
Table 2. Analysis of the tap water in Vienna from the water supply company, Vienna, 8 February 2021 (https://www.wien.gv.at/wienwasser/qualitaet/ergebnis.html (accessed on 5 April 2021).
Electrical Conductivity (20 °C)217–300 µS cm−1
pH-value8.0–8.2
Nitrate3.5–5.4 mg L−1
Chloride<1–2 mg L−1
Sulfate4–18 mg L−1
Calcium41–54 mg L−1
Magnesium7.4–11 mg L−1
Sodium<1 mg L−1
Potassium<1 mg L−1
Table 3. Sensory attributes and acceptability items collected during the consumer test. Radish cress and garden cress were assessed by means of four flavor impressions and three visual items.
Total Flavor ImpressionScale of Sensory Attributes
Pungency
CrispnessScale: 1 = not perceived at all;
Typical aroma5 = perceived very well
Presence of off-flavors
Visual AppearanceScale of Sensory Attributes
Stem length (plant size)Scale: 1 = not perceived at all;
Cotyledon appearance5 = perceived very well
Color impression
Table 4. Estimated area of cotyledons of radish cress and stem length of garden and radish cress. Different letters within a column indicate significant differences.
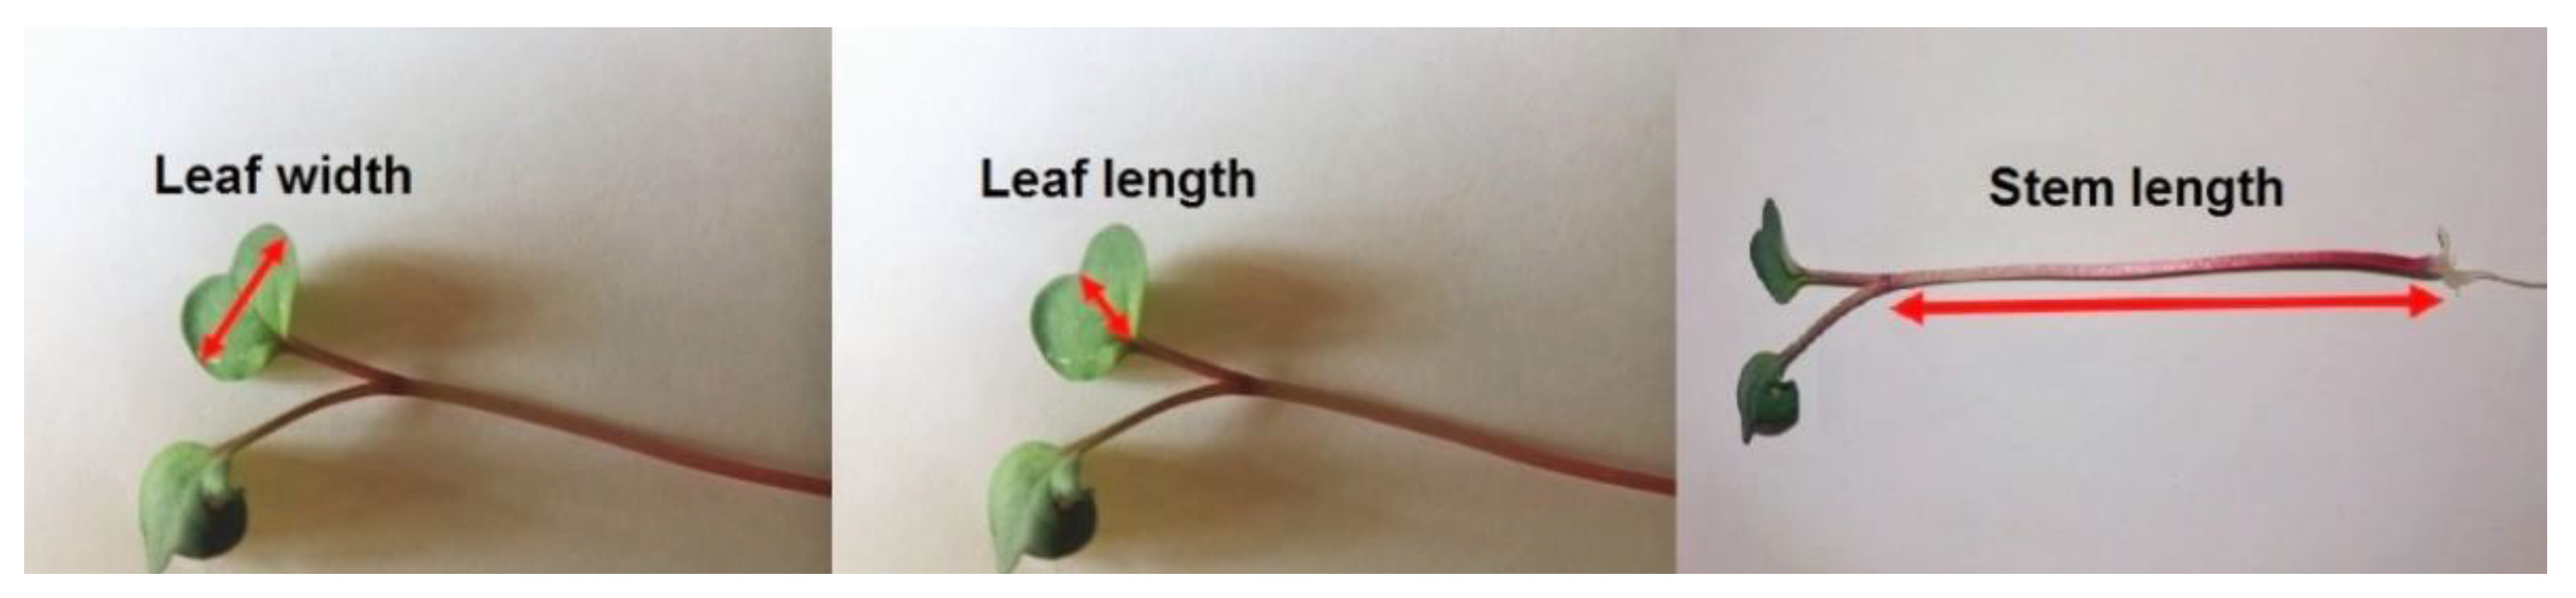
Estimated Leaf Area of Radish Cress
[cm2]
Stem Length of Radish Cress
[cm]
Stem Length of Garden Cress
[cm]
100% Hoagland0.89 ± 0.19 a5.97 ± 0.81 a4.86 ± 0.79 a
50% Hoagland0.65 ± 0.18 b5.14 ± 0.33 b4.29 ± 0.64 a
25% Hoagland0.51 ± 0.11 c4.60 ± 0.71 b3.13 ± 0.68 b
Tap water0.39 ± 0.09 d3.65 ± 0.59 c2.81 ± 0.46 b
Demineralized water 0.27 ± 0.05 e2.71 ± 0.39 d1.93 ± 0.22 c
Transformationf(x) = LN(x)-f(x) = LN(x)
PKolmogorov-Smirnov t.0.200 10.200 10.200 1
PShapiro Wilk test0.6350.4310.140
PLevene test0.6490.0500.452
PANOVA0.0000.0000.000
Posthoc testDuncanDuncanDuncan
1 This is a lower bound of the true significance.
Table 5. Relative water content of garden and radish cress. Different letters within a column indicate significant differences.
Water Content of Radish Cress Cotyledons
[%]
Water Content of Radish Cress Stems
[%]
Water Content of Garden Cress
[%]
100% Hoagland88.5 ± 1.6 a95.6 ± 0.7 a93.2 ± 1.2 a
50% Hoagland86.4 ± 2.2 a95.2 ± 0.8 ab92.6 ± 1.6 ab
25% Hoagland83.1 ± 2.2 b94.5 ± 1.0 b90.8 ± 2.6 bc
Tap water78.7 ± 2.7 c93.4 ± 0.9 c89.8 ± 3.2 cd
Demineralized water 72.6 ± 3.9 d91.4 ± 0.8 d88.4 ± 2.0 d
Transformation---
PKolmogorov-Smirnov t.0.1580.200 10.099
PShapiro Wilk test0.0210.1440.050
PLevene test0.0790.9470.105
PANOVA0.0000.0000.000
Posthoc testDuncanDuncanDuncan
1 This is a lower bound of the true significance.
Table 6. Nitrate content of garden and radish cress. Different letters within a column indicate significant differences.
Nitrate Content of Radish Cress Cotyledons
[g kg−1 DM]
Nitrate Content of Radish Cress Stems
[g kg−1 DM]
Nitrate Content of Garden Cress
[g kg−1 DM]
100% Hoagland6.17 ± 0.53 a23.33 ± 1.61 a21.33 ± 0.58 a
50% Hoagland3.42 ± 0.88 b16.00 ± 0.87 b14.83 ± 1.15 b
25% Hoagland1.18 ± 0.09 c6.03 ± 0.43 c5.47 ± 0.80 c
Tap water0.00 ± 0.00 d0.14 ± 0.03 d0.00 ± 0.00 d
Demineralized water 0.01 ± 0.02 d0.13 ± 0.04 d0.07 ± 0.08 d
Transformationf(x) = x0.8f(x) = x0.5f(x) = x0.455
PKolmogorov-Smirnov t.0.0580.010 10.050
PShapiro Wilk test0.0120.010 10.011
PLevene test0.0570.0890.051
PANOVA0.0000.0000.000
Posthoc testDuncanDuncanDuncan
1 The Duncan test was performed, although the data were not normally distributed; P of normality tests were only slightly <5%.
Table 7. Content of pigments in the cotyledons of radish cress in g kg−1 dry mass (DM). Different letters within a column indicate significant differences.
Total Chl Content
[g kg−1 DM]
Chl a Content
[g kg−1 DM]
Chl b Content
[g kg−1 DM]
Chl a/b RatioCar Content
[g kg−1 DM]
100% Hoagland4.66 ± 1.39 a3.53 ± 0.99 a1.13 ± 0.40 a3.16 ± 0.20 c0.68 ± 0.16 a
50% Hoagland4.10 ± 0.26 a3.11 ± 0.21 a1.00 ± 0.06 a3.12 ± 0.06 c0.60 ± 0.03 a
25% Hoagland3.39 ± 0.41 a2.61 ± 0.30 a0.78 ± 0.12 a3.34 ± 0.15 c0.56 ± 0.03 a
Tap water2.28 ± 0.20 b1.80 ± 0.13 b0.49 ± 0.07 b3.73 ± 0.26 b0.42 ± 0.01 b
Demineralized water1.50 ± 0.19 c1.21 ± 0.16 c0.29 ± 0.03 c4.14 ± 0.20 a0.31 ± 0.04 c
Transformationf(x) = LN(LN(x) + 2)f(x) = LN(x)f(x) = LN(LN(x) + 2)-f(x) = LN(LN(x) + 2)
PKolmogorov-Smirnov t.0.0370.0780.0200.200 10.047
PShapiro Wilk test0.2470.4410.0570.1950.136
PLevene test0.1080.0540.0740.4410.070
PANOVA0.0000.0000.0000.0000.000
Posthoc testDuncanDuncanDuncanDuncanDuncan
1 This is a lower bound of the true significance.
Table 8. Content of pigments in the stems of radish cress in g kg−1 dry mass (DM). Different letters within a column indicate significant differences.
Total Chl Content
[g kg−1 DM]
Chl a Content
[g kg−1 DM]
Chl b Content
[g kg−1 DM]
Chl a/b RatioCar Content
[g kg−1 DM]
100% Hoagland0.34 ± 0.01 a0.30 ± 0.02 a0.05 ± 0.01 a6.73 ± 1.86 a0.08 ± 0.00 a
50% Hoagland0.33 ± 0.04 a0.30 ± 0.03 a0.03 ± 0.01 ab9.99 ± 2.03 a0.08 ± 0.01 a
25% Hoagland0.32 ± 0.02 a0.29 ± 0.01 a0.03 ± 0.01 ab11.54 ± 3.98 a0.08 ± 0.00 a
Tap water0.26 ± 0.07 ab0.25 ± 0.04 ab0.02 ± 0.02 bc13.19 ± 16.91 a0.07 ± 0.01 a
Demineralized water0.20 ± 0.07 b0.21 ± 0.05 b0.00 ± 0.01 c30.47 ± 42.40 a0.06 ± 0.01 a
Transformation-f(x) = x2---
PKolmogorov-Smirnov t.0.1010.0600.200 10.0040.006
PShapiro Wilk test0.0380.1780.7280.0000.029
PLevene test0.1830.4100.559--
P Kruskal-Wallis t.---0.5200.069
PANOVA0.0280.0350.011--
Posthoc testDuncanDuncanDuncan--
1 This is a lower bound of the true significance.
Table 9. Content of pigments in garden cress in g kg−1 dry mass (DM). Different letters within a column indicate significant differences.
Total Chl Content
[g kg−1 DM]
Chl a Content
[g kg−1 DM]
Chl b Content
[g kg−1 DM]
Chl a/b RatioCar Content
[g kg−1 DM]
100% Hoagland4.78 ± 0.98 a3.53 ± 0.58 a1.26 ± 0.40 a2.89 ± 0.40 c0.56 ± 0.07 a
50% Hoagland3.80 ± 0.56 ab2.88 ± 0.42 ab0.92 ± 0.16 ab3.17 ± 0.36 bc0.50 ± 0.08 ab
25% Hoagland2.96 ± 0.29 bc2.31 ± 0.21 bc0.64 ± 0.11 abc3.65 ± 0.51 abc0.44 ± 0.04 ab
Tap water2.70 ± 1.14 bc2.13 ± 0.83 bc0.57 ± 0.31 bc3.97 ± 0.65 ab0.40 ± 0.13 bc
Demineralized water1.96 ± 0.13 c1.58 ± 0.08 c0.39 ± 0.05 c4.11 ± 0.32 a0.31 ± 0.01 c
Transformation--f(x) = LN(LN (LN(x) + 2) + 1))-f(x) = LN(LN (LN (x) + 2) + 1)
PKolmogorov-Smirnov t.0.200 10.20010.1030.200 10.061
PShapiro Wilk test0.4670.5320.1360.9860.041
PLevene test0.0540.0550.0590.7380.064
PANOVA0.0070.0070.0230.0420.007
Posthoc testDuncanDuncanDuncanDuncanDuncan
1 This is a lower bound of the true significance.
Table 10. Content of phenolic compounds and antioxidant capacity in the cotyledons of radish cress in g kg−1 dry mass (DM) and mol kg−1 DM, respectively. Different letters within a column indicate significant differences.
Phenol Content
[g GAE kg−1 DM]
Flavonoid Content
[g RE kg−1 DM]
Anthocyanin Content
[g kg−1 DM]
Antioxidant Capacity
[mol kg−1 DM]
100% Hoagland1.54 ± 0.15 a13.94 ± 5.72 a0.77 ± 0.04 a0.12 ± 0.01 a
50% Hoagland1.48 ± 0.12 ab11.38 ± 2.83 a1.10 ± 0.46 a0.10 ± 0.01 ab
25% Hoagland1.41 ± 0.07 ab10.48 ± 4.53 a0.88 ± 0.06 a0.12 ± 0.01 a
Tap water1.28 ± 0.10 bc7.70 ± 2.99 a1.08 ± 0.27 a0.10 ± 0.01 ab
Demineralized water1.15 ± 0.12 c6.90 ± 0.56 a1.21 ± 0.21 a0.08 ± 0.01 b
Transformation----
PKolmogorov-Smirnov t.0.200 10.1620.0230.136
PShapiro Wilk test0.9840.0450.0120.216
PLevene test0.8070.092-1.000
PKruskal-Wallis t.--0.067-
PANOVA0.0110.219-0.008
Posthoc testDuncan--Duncan
1 This is a lower bound of the true significance; GAE, gallic acid equivalent; RE, rutin equivalent.
Table 11. Content of phenolic compounds and antioxidant capacity in the stems of radish cress in g kg−1 dry mass (DM) and mol kg−1 DM, respectively. Different letters within a column indicate significant differences.
Phenol Content
[g GAE kg−1 DM]
Flavonoid Content
[g RE kg−1 DM]
Anthocyanin Content
[g kg−1 DM]
Antioxidant Capacity
[mol kg−1 DM]
100% Hoagland0.82 ± 0.04 c0.00 ± 0.00 a4.93 ± 0.23 c0.02 ± 0.00 a
50% Hoagland0.90 ± 0.03 c0.00 ± 0.00 a5.95 ± 0.97 bc0.03 ± 0.01 a
25% Hoagland1.01 ± 0.03 b0.00 ± 0.00 a6.51 ± 0.17 ab0.04 ± 0.00 a
Tap water1.10 ± 0.07 a0.00 ± 0.00 a7.57 ± 1.01 ab0.05 ± 0.01 a
Demineralized water 1.14 ± 0.02 a0.93 ± 1.40 a8.79 ± 2.97 a0.04 ± 0.00 a
Transformation--f(x) = LN(LN(LN(x)))-
PKolmogorov-Smirnov t.0.200 10.0000.200 10.000
PShapiro Wilk test0.3760.0000.8610.004
PLevene test0.338-0.166-
PKruskal-Wallis t.-0.073-0.092
PANOVA0.000-0.008-
Posthoc testDuncan-Duncan-
1 This is a lower bound of the true significance; GAE, gallic acid equivalent; RE, rutin equivalent.
Table 12. Content of phenolic compounds and antioxidant capacity in garden cress in g kg−1 dry mass (DM) and mol kg−1 DM, respectively. Different letters within a column indicate significant differences.
Phenol Content
[g GAE kg−1 DM]
Flavonoid Content
[g RE kg−1 DM]
Anthocyanin Content
[g kg−1 DM]
Antioxidant Capacity
[mol kg−1 DM]
100% Hoagland2.35 ± 0.08 a11.22 ± 3.62 a0.04 ± 0.05 b0.15 ± 0.01 a
50% Hoagland2.15 ± 0.13 a12.34 ± 5.66 a0.03 ± 0.02 b0.14 ± 0.02 a
25% Hoagland2.16 ± 0.21 a14.42 ± 11.96 a0.04 ± 0.02 b0.14 ± 0.01 a
Tap water2.37 ± 0.01 a18.97 ± 7.94 a0.12 ± 0.07 ab0.16 ± 0.02 a
Demineralized water2.15 ± 0.04 a17.23 ± 1.52 a0.15 ± 0.06 a0.13 ± 0.01 a
Transformation-f(x) = LN(x)--
PKolmogorov-Smirnov t.0.0550.200 10.200 10.084
PShapiro Wilk test0.1100.2290.0610.170
PLevene test0.0080.1600.2500.494
PANOVA0.0860.6110.0370.431
Post-hoc test--Duncan-
1 This is a lower bound of the true significance; GAE, gallic acid equivalent; RE, rutin equivalent.
Table 13. Total flavor impression of radish cress rated by untrained consumer tests. Different letters within a column indicate significant differences by Friedman tests.
PungencyCrispnessTypical AromaPresence of Off-FlavorsTotal Flavor Impression
100% Hoagland3.33 ± 1.01 a3.59 ± 0.76 a3.83 ± 0.91 a4.31 ± 0.91 ab3.91 ± 0.90 a
50% Hoagland3.50 ± 0.91 a3.76 ± 0.70 a3.74 ± 0.92 ab4.24 ± 0.93 a3.63 ± 0.98 ab
25% Hoagland3.13 ± 1.01 a3.63 ± 0.65 a3.76 ± 0.87 a4.17 ± 0.99 abc3.70 ± 0.96 a
Tap water3.15 ± 1.00 a3.43 ± 0.72 a3.20 ± 0.96 bc3.54 ± 1.27 c3.13 ± 0.91 bc
Demineralized water2.98 ± 0.11 a3.35 ± 0.91 a3.04 ± 0.85 c3.65 ± 1.18 bc3.04 ± 0.89 c
Table 14. Visual appearance of radish cress rated by untrained consumer tests. Different letters within a column indicate significant differences by Friedman tests.
Stem Length (Plant Size)Cotyledon AppearanceColor ImpressionGeneral Visual Appearance
100% Hoagland4.48 ± 0.57 a3.63 ± 0.81 a3.57 ± 0.84 a3.80 ± 0.94 a
50% Hoagland3.93 ± 0.87 ab3.50 ± 0.84 ab3.74 ± 0.80 a3.87 ± 0.75 a
25% Hoagland3.37 ± 0.62 b3.02 ± 0.74 bc3.70 ± 0.72 a3.89 ± 0.72 a
Tap water2.48 ± 0.77 c2.48 ± 0.67 cd3.63 ± 0.92 a3.48 ± 0.93 a
Demineralized water 1.80 ± 0.76 c1.91 ± 0.62 d3.39 ± 1.11 a2.74 ± 0.99 b
Table 15. Total flavor impression of garden cress rated by untrained consumer tests. Different letters within a column indicate significant differences by Friedman tests.
PungencyCrispnessTypical AromaPresence of Off-FlavorsTotal Flavor Impression
100% Hoagland3.24 ± 0.88 ab3.50 ± 0.77 a3.65 ± 0.71 a4.15 ± 0.77 a3.82 ± 0.76 a
50% Hoagland3.39 ± 1.04 a3.56 ± 0.86 a3.70 ± 0.82 a3.88 ± 0.97 a3.62 ± 0.86 a
25% Hoagland3.05 ± 0.97 ab3.23 ± 0.91 ab3.29 ± 0.87 ab3.74 ± 1.04 a3.09 ± 0.94 b
Tap water3.33 ± 1.00 a2.95 ± 0.94 ab3.03 ± 0.86 bc3.55 ± 1.08 a2.89 ± 0.93 bc
Demineralized water 2.79 ± 1.14 b2.74 ± 1.01 b2.59 ± 0.89 c2.71 ± 1.15 b2.36 ± 1.02 c
Table 16. Visual appearance of garden cress rated by untrained consumer tests. Different letters within a column indicate significant differences by Friedman tests.
Stem Length (Plant Size)Cotyledon AppearanceColor ImpressionGeneral Visual Appearance
100% Hoagland3.89 ± 0.70 a3.56 ± 0.75 a3.94 ± 0.76 a4.30 ± 0.63 a
50% Hoagland3.41 ± 0.88 a3.42 ± 0.82 a3.77 ± 0.72 a3.95 ± 0.73 a
25% Hoagland2.45 ± 0.75 b2.61 ± 0.65 b3.14 ± 0.72 b2.86 ± 0.86 b
Tap water2.12 ± 0.67 b2.26 ± 0.64 b2.82 ± 0.88 b2.53 ± 0.92 b
Demineralized water 1.41 ± 0.63 c1.67 ± 0.56 c2.20 ± 0.92 c1.88 ± 0.87 c
Publisher’s Note: MDPI stays neutral with regard to jurisdictional claims in published maps and institutional affiliations.

