Article

Foliar and Root Applications of Vegetal-Derived Protein Hydrolysates Differentially Enhance the Yield and Qualitative Attributes of Two Lettuce Cultivars Grown in Floating System

1
Department of Agricultural Sciences, University of Naples Federico II, 80055 Portici, Italy
2
Department of Agriculture and Forest Sciences, University of Tuscia, Via San Camillo de Lellis, 01100 Viterbo, Italy
*
Author to whom correspondence should be addressed.
Submission received: 9 May 2021 / Revised: 30 May 2021 / Accepted: 9 June 2021 / Published: 11 June 2021

Abstract

:
Lettuce (Lactuca sativa L.) is a leafy vegetable cultivated widely for its fast and year-round production and its beneficial phytochemical content, which may be boosted further by plant biostimulants that are considered eco-sustainable means for enhancing horticultural crop production. A greenhouse experiment was carried out to evaluate the yield and qualitative parameters of two differently pigmented lettuce cultivars grown in a floating raft system either untreated or treated (leaf, root or leaf/root application) with vegetal protein hydrolysates (PHs). For foliar application (F), lettuce plants were sprayed at a dose of 3 mL L−1, whereas for root application, 0.15 (T1) or 0.3 (T2) mL L−1 was applied to the nutrient solution alone or in combination with foliar spray (T1 + F and T2 + F) with the same foliar concentration. Bio-morphometric and production data were collected after harvest. Physiological and plant nutrition assays included leaf gas exchange, leaf fluorescence, SPAD index, mineral content, carotenoids, total phenols, total ascorbic acid content and antioxidant activities. Cultivar-specific reactions to biostimulant application were noted: whilst the green pigmented cultivar thrived under nutrient solution applications and recorded higher yield by 82.7% (T1) or (T1 + F) and 71.7% (T2), the red cultivar thrived under combined treatments, yielding 55.4% (T2 + F) higher than control and providing the most concentrated phytochemical content. These latter treatments also engendered the highest SPAD index, Fv/Fm ratio, CO2 assimilation, stomatal conductance and transpiration. In addition, the T2 + F treatment boosted ‘Canasta’ hydrophilic antioxidant activity (21.9%) and total ascorbic acid (5.6-fold). Nutrient solution treatments alone proved advantageous when compared to foliar treatments, while mixed treatments proved genotype-specific. New research on genotype specificity of biostimulant effects is warranted for future use, in order to rationalize biostimulant application modes and dosages.

1. Introduction

Lettuce (Lactuca sativa L.) is one of the most grown vegetable crops at over 29 million tons harvested in 2019 [1] and in particular it embodies Italy’s most cultivated leafy green [2]. Lettuce consumers benefit from a variety of health improvements, starting from the general lowered risk of diseases due to the consumption of vegetables [3] and the elevated intake of phytochemicals such as vitamins, polyunsaturated fatty acids (PUFA) and antioxidants pertained to this leafy vegetable [4,5]. Whilst commonly grown in soil-based systems, concerns over land, fertilizers abuse and specialized soil-borne pathogens due to intensive cropping [6,7,8] has favored the introduction of soilless farming, of which the floating raft system represent a notable example. Advantages of growing Lettuce in floating systems include low maintenance, higher yield, nutrient and water efficiency and continuous cropping throughout the year [9,10]. Moreover, by virtue of soil absence, floating systems can be employed in urban agriculture projects that provide better food availability, local social and economic development and reduced environmental impact [11]. Lastly, the controlled growing environment makes the obtainment of quality products easier, as the fine tuning of pre-harvest factors like the nutrient solution composition makes increments of the above-mentioned phytochemicals possible [12,13].
Plant biostimulants provide a good fit with floating systems, since their purpose, as defined by the EU Commission, consist of improving nutrient use efficiency, tolerance to abiotic stress, quality traits and availability of confined nutrients in soil or rhizosphere [14]. Protein hydrolysates (PHs) biostimulants are a rather interesting addition to the group: generally employed as foliar spray or substrate drench treatments. PHs products include bioactive molecules like readily absorbed amino acids and a category of small molecules known as signaling peptides [15]. Such molecules provide for a plethora of plant growth and physiological effects, including hormone-like effects, due to auxin and gibberellin-like activity [16], upregulation of carbon and nitrogen metabolism [16,17,18,19] and induction of secondary metabolites production like phenolics and flavonoids having antioxidant capacities of interest for human health [20,21]. Evidence on the use of PHs biostimulants on leafy vegetables seem to give credit to their plant-growth enhancing prowess, as elevated yield and yield parameters such as leaf numbers [22,23] were denoted in lettuce plants and higher marketable yield were seen in rocket [20]. Scientific literature also points out at PHs increasing nutrient efficiency and plant growth when grown in a floating system [24], but to this day application modes and dosages in this particular growing system are still not well defined. PHs application to both roots and leaves has proven to be beneficial to lettuce plants grown in sand substrate [25], but no information is available regarding a growing system with higher root nutrient availability such as the floating system. Furthermore, there is a lack of information about a dosage ceiling or application mode on lettuce, whereby the biostimulant could be either ineffective or downright detrimental to plant growth and quality and whether it is cultivar-specific or not. This last question stems from the availability of multiple lettuce types that provide considerable variation in the Lactuca sativa L. species, from head shape and size [26]. This variation is even more accentuated by the presence of different pigmentations, which may provide health-promoting benefit to consumers; such as red pigments indicating the presence of powerful radical oxygen species (ROS) scavenging molecules [27].
To evaluate these research questions, a greenhouse study was conducted with two differently-pigmented lettuce cultivars, grown in a floating raft system and subjected to either foliar spray, nutrient solution application or combined applications of a vegetal-derived PHs biostimulant. Crop response to treatments was evaluated in terms of morpho-physiological traits, mineral contents and antioxidant activity. The results displayed in this study may provide new horizon for PHs utilization and will contribute in meliorating lettuce quali-quantitative features in hydroponic systems.

2. Materials and Methods

2.1. Growth Conditions, Experimental Design and Plant Material

A greenhouse experiment was carried out at the University of Naples “Federico II”—Department of Agriculture in a passively ventilated greenhouse situated in Portici (Province of Naples, Italy; 40°48′ N, 14°20′ E, 29 m.s.l.) from 20 April until 7 May 2020, for a total of 17 days. Relative humidity and temperature were recorded continuously using WatchDog A150 data loggers (Spectrum Technologies Inc., Aurora, IL, USA; 3%/0.6 °C RH/Temp accuracy) placed at canopy level at different locations of the experimental area (Figure S1). A bi-factorial experimental design was employed, consisting of two lettuce (Lactuca sativa L.) cultivars, a green butterhead ‘Ballerina’ (Rijk Zwaan Italia S.R.L., Bologna (BO), Italy) and a red crisphead ‘Canasta’ (Pagano Costantino & F.lli S.R.L, Scafati (SA), Italy), an untreated control and five distinct levels/modes of biostimulant application. Each treatment was replicated three times and the 12 combinatorial treatments (2 × 6) were arranged in a randomized complete-block design. The two-cultivars seedlings were transplanted, into 24-hole polystyrene trays (52 × 33 cm) at a density of 70 plants m−2. Each tray maintained 12 plants and corresponded to an experimental unit (Figure S2), accounting in total for 36 experimental units. The trays were floating in plastic tanks (35 L maximum capacity) filled with 30 L of nutrient solution (NS) containing the following macro- and micro-nutrients: 9.0 mM Nitrate, 1 mM Phosphorous, 2.0 mM Sulfur, 1.0 mM Ammonium, 4 mM Potassium, 4 mM Calcium, 1 mM Magnesium, 15 μM Iron, 9.0 μM Manganese, 0.3 μM Copper, 1.6 μM Zinc, 20.0 μM Boron and 0.3 μM Molybdenum, accounting for an electrical conductivity of 1.3 mS cm−1. Each experimental unit was supplied with an immersion air pump to prevent plant roots anoxia and NS was checked for pH fluctuations on a daily-basis with a portable pH meter (HI 991301, Hanna Instruments(Italia S.R.L., Ronchi di Villafranca Padovana (PD), Italy) and when needed, it was adjusted at the 5.8 ± 0.2 pH level. The tanks were topped up with freshly prepared NS on a weekly-basis interval.

2.2. Biostimulant Application

The vegetal-derived protein hydrolysates Trainer® (Hello Nature Italia S.R.L., Rivoli Veronese (VR), Italy), a commercially available product obtained through enzymatic hydrolysis of legume biomasses was used for this trial. The components of the PHs are amino acids (Ala, Arg, Asp, Cys, Glu, Gly, His, Ile, Leu, Lys, Met, Phe, Pro, Ser, Thr, Trp, Tyr and Val) and soluble peptides which comprise 5% of the total nitrogen content, along with phenolics and soluble sugars. Detailed analysis of the product was reported by Paul et al. [28] and Rouphael et al. [21], who pointed out that no plant hormones were found in the product. Biostimulant treatments consisted of five distinct levels/modes of application: Foliar application (F) at the rate of 3 mL biostimulant L−1 of solution. For root application, 0.15 (T1) or 0.3 (T2) mL L−1 was applied to the nutrient solution alone or in combination with foliar spray (T1 + F and T2 + F) with the same foliar concentration. Foliar applications were done by the means of a 10 L steel-bottle sprayer. Three treatments during the growing season were adopted starting directly after transplanting and every six days. Equally, for the PHs application in the NS, it was added on transplanting and successively added with the NS when the refill of the tanks was done.

2.3. Sampling, Yield and Growth Assessment

At the end of the experiment, nine plants from each experimental unit were chosen for the biometric measurements, consisting of leaf number, leaf area and shoot fresh yield (leaves + stem). Leaf area of each plant was estimated using ImageJ software 1.50 version (U.S. National Institutes of Health, Bethesda, MD, USA) and quantified in cm2. The aforementioned plants were put in a forced air drying oven at 60 °C until constant weight was reached for the successive determination of shoot dry biomass (leaves + stem) and dry matter percentage (DM %, calculated as (leaf dry weight/leaf fresh weight) × 100). For qualitative analysis, a pool of two plants per experimental unit were harvested and conserved at −80 °C and later on freeze dried in a lyophilizer (model Alpha 1-4, Martin Christ Gefriertrocknungsanlagen GmbH, Osterode am Harz, Germany).

2.4. Soil Plant Analysis Development (SPAD) Index, Chlorophyll Fluorescence and Photosynthetic Parameters

Soil Plant Analysis Development (SPAD) Index was assessed by taking 24 measurements per experimental unit using a Minolta Chlorophyll Meter (model SPAD-502, Minolta Camera Co. Ltd., Osaka, Japan). Leaf chlorophyll fluorescence measurements, expressed as the maximum quantum efficiency of PSII photochemistry (Fv/Fm) were taken using a portable leaf fluorometer (model Fv/Fm meter, Opti-Sciences, Hudson, NH, USA) onto leaves at the same developmental stage. Seven measurements per experimental unit were taken. As for the leaf gas exchange, the measurements per experimental unit were carried out onto fully expanded leaves using a portable gas exchange analyzer (model Li-6400, LI-COR Biosciences, Lincoln, NE, USA) equipped with a 6 cm2 leaf chamber and a programmable LED light source (model 6400-02b). Photosynthetically active radiation (PAR) was kept steady at 2000 μmol m−2 s−1, relative humidity (RH) and CO2 concentration were kept at ambient values, flow rate of air was maintained at 500 mL s−1. Measured parameters consisted of assimilated CO2 (ACO2), stomatal conductance (gs) and transpiration rate (E). All of the physiological measurements were carried out in the 9:00 to 11:00 am timeslot on harvest day.

2.5. Leaf Mineral Content Analysis

Total leaf nitrogen content analyses were conducted on dry, milled samples using the Kjeldahl method [29]. Based on Pannico et al. [30] protocol, a 250 mg aliquot of milled (model MF10.1, IKA-Werke GmbH & Co. KG, Staufen, Germany) dry leaf sample was used for the determination of leaf mineral (NO3, P, K, Ca, Mg, S and Na) composition. Mineral analysis was then carried out after 0.45 µm filtering using an ion chromatographer (model ICS-3000, Dionex, Sunnyvale, CA, USA), quantified using an electrical conductivity detector equipped with an IonPac CS12A and IonPac AS11-HC analytical columns for the analysis of cationic and anionic contents, respectively (Dionex, Sunnyvale, CA, USA). All the minerals were expressed as mg g−1 on dry weight (DW) basis except for nitrate that was expressed as mg kg−1 on fresh weight (FW) basis, based on each sample DM%.

2.6. Leaf Total Chlorophylls and Carotenoids

Leaf pigments content were determined using one g of fresh leaf samples which were extracted in pure acetone and kept in darkness for 15 min. After centrifuging the extracts at 3000 g for five minutes, pigments content was determined by their light absorbance at 662, 645 and 470 nm for chlorophyll a, b and total carotenoids, using a Hach DR 2000 spectrophotometer (Hach Company, Loveland, CO, USA). Total Chlorophylls was calculated as the sum of chlorophyll a and b. The extinction coefficients used for pigment determination were described in Lichtenthaler and Buschmann work [31].

2.7. Total Phenols and Total Ascorbic Acid Analysis

Antioxidant molecules assays were performed on freeze-dried leaf tissue using the Folin–Ciocalteau [32] method for Total Phenols Content and on fresh leaf material using the Kampfenkel [33] method for the determination of Total Ascorbic Acid (TAA). Spectrophotometric measurements of the solutions were carried out at 765 and 525 nm, respectively.

2.8. Antioxidant Activity Analysis

A total of 200 mg of freeze-dried material was analyzed by means of two antioxidant essays. The 2,20′-azinobis 3-ethylbenzothiazoline-6-sulfonic acid (ABTS in short) method was employed as described in Pellegrini et al. [34] and the N,N-dimethyl-p-phenylenediamine (DMPD in short) was implemented as described by Fogliano et al. [35]. In order to measure the reduction in absorbance of the solutions a spectrophotometric assay was carried out at 734 and 505 nm wavelengths, respectively.

2.9. Statistical Processing of the Data

A two-way analysis of variance (Two-way ANOVA) was performed using SPSS 20 for Windows (IBM Corp., Armonk, NY, USA), in order to access the interaction between the two factors (Cultivar-C and Biostimulant-B). The mean effect of the cultivar (C) was compared by Student t-test. Separation of the means was obtained using Duncan’s Multiple Range Test (DMRT). Differences between treatments were deemed significant at p = 0.05.

3. Results

3.1. Growth and Yield Assessment

Table 1 shows the data of the growth and yield of both lettuce cultivars (‘Ballerina’ and ‘Canasta’) grown in floating raft system and subjected to diverse biostimulant application modes and doses. Significant cultivar-specific difference was denoted in some of the evaluated parameters, such as leaf number that was not influenced by biostimulant treatments, with ‘Ballerina’ developing more leaves than the other cultivar. A significant interaction cultivar × biostimulant was denoted for all the studied parameters with the sole exception of leaf number. When considering foliar application only, ‘Ballerina’ recorded 51% higher yield than control, whilst ‘Canasta’ showed a modest 12.5% increase. Nutrient solution additions also showed a different behavior of the two cultivars, as the T1 and T2 treatments exhibited 82.7% and 71.7% increases over the control treatment in ‘Ballerina’, compared to the 7.1% and 23.4% increase obtained by ‘Canasta’. It is when foliar and nutrient solution applications were combined that an interesting phenomenon arose; while a slight increase was recorded in ‘Ballerina’ at the T1 + F level, the T2 + F dosage determined a significant decrease in yield figures when compared to T1 + F by 18.3%, while still being 59.2% higher than the control treatment. Conversely, ‘Canasta’ thrived under the combined treatments, as the T1 + F and T2 + F treatments boosted yield by 42.5 and 55.4%, with the latter treatment being the best performing overall. In addition, plant yield components such as leaf area showed more or less the same range of increase with all the five treatments in ‘Ballerina’, whereas ‘Canasta’ exhibited a gradual increase when passing from nutrient application to combination with foliar. As for leaf dry matter %, ‘Ballerina’ and ‘Canasta’ × control were amongst the highest treatments, in addition to ‘Ballerina’ × combined treatments; all ranging 5.7% on average.

3.2. SPAD Index, Chlorophyll Fluorescence, Photosyntethic Parameters

SPAD index records (Table 2) showed a significant cultivar × treatment interaction. T1 and T1 + F recorded the highest values for ‘Ballerina’, which were 8.2% higher than the untreated control, whereas T1 + F and T2 + F recorded the highest values for ‘Canasta’. Cultivar × biostimulant data showed a distinct behavior of the two tested genotypes in relationship to the tested dosage, as ‘Ballerina’ seemed to favor the T1 and T1 + F treatments, whilst ‘Canasta’ in line with previous data (i.e., yield) recorded the highest values at the most concentrated biostimulant applications, with the T2 + F treatments showing the highest SPAD values overall and an 8.6% increase compared to its control.
Fluorescence data showed significant interaction between the cultivars and biostimulant applications. Again, the ‘Ballerina’ cultivar reported its highest figures at the T1 and T1 + F treatment levels, which were overall the highest recorded along ‘Canasta’ × T2 + F. The latter treatment resulting significantly higher than control and F × ‘Canasta’. In addition, leaf gas exchange measurements (Table 2) showed significant interactions for the CO2 assimilation rate, stomatal conductance and transpiration rate. Similarly to above mentioned data, a familiar pattern arose from the interaction data, as for every studied parameter (ACO2, gs and E) a performance regression was noted at the T2 + F level compared to the T1 + F for the green ‘Ballerina’ cultivar and a general upward trend was noted for the ‘Canasta’ cultivar. A different trend emerged in the latter two indices, as stomatal conductance and transpiration in ‘Ballerina’ were the highest at the T1 + F level compared to all studied combinations, with an increase of 72.0% and 18.4% when compared to its control average.

3.3. Leaf Total Nitrogen, Nitrate and Mineral Content

Leaf mineral content records in Table 3 showed significant cultivar differences in the assimilation of nitrate, calcium and sulfur, with ‘Ballerina’ cultivar being the highest accumulator of nitrate and calcium. Nonetheless, nitrate accumulation was ruled by the interaction of C × B. Where ‘Ballerina’ accumulated the most at T1 + F and T2 + F (around 1769 mg kg−1 FW) and ‘Canasta’ accumulated the most at only T2 + F (1621 mg kg−1 FW). Noting that ‘Canasta’ × control registered 35.3% less nitrate than ‘Ballerina’ × control. In addition, notable, are the recorded decreases in nitrate content in both cultivars at the T2 level, with ‘Ballerina’ accumulating 19% less than its control, in addition to the foliar treatment for ‘Canasta’, though the decrease was not deemed significant for this cultivar. At any rate, none of the tested treatments exceeded the nitrate threshold set by the EU Regulation 1258/2011. Sodium accumulation in both cultivars was the highest at T1 level, with the ‘Canasta’ cultivar showing the highest overall figures and relative increase of 39.4% compared to its control. Nonetheless, T1 + F and control × ‘Ballerina’ were equally rich in sodium. When averaged across cultivars, biostimulant application significantly affected mineral contents, as it is clear for P, K and Mg except for T2 + F treatment. These three macro-minerals increased on average 14.4, 7.7 and 12.0%, respectively, when both cultivars were treated with biostimulants. As for sulfur, only T1 + F and T2 + F induced significant higher accumulation in comparison to the control, which was the same case for total nitrogen %, in addition to T1 treatment.

3.4. Leaf Pigments and Qualitative Parameters

Chlorophyll pigments (Table 4) demonstrated only significant genotype differences, where ‘Ballerina’ cultivar exhibited significantly higher total chlorophyll by 22.1%, respectively compared to ‘Canasta’. Identically, total phenols were as well dominated by the cultivar effect, with ‘Canasta’ being 36.8% denser. Moreover, biostimulant treatments significantly affected total ascorbic acid content, Hydrophilic antioxidant activity, ABTS antioxidant activity and carotenoids content, with significant interactions recorded for every parameter. Stark genotype-derived differences were denoted especially when considering total ascorbic acid content, the combination ‘Ballerina’ and biostimulant foliar application (F) yielded the highest overall total ascorbic acid content, with an increase of 51.2% compared to its control; however, it is the ‘Canasta’ cultivar that recorded the most substantial relative increase, as the T1 + F treatment increase over its untreated control was almost 7-fold and T2 + F 5.6-fold. As for the hydrophilic antioxidant activity, T2 + F treatment boosted by 55.9% the content in ‘Ballerina’ and by 21.9% the content in ‘Canasta’, this later cultivar had as well a great boost by T2 treatment (around 31.1%), with ‘Canasta’ being overall richer in HAA. On the other hand, ABTS results depicted a different trend, as ‘Ballerina’ showed a steady decrease in antioxidant activity beyond the control and F treatment, where biostimulant treatments causing a 15.3% overall decrease. The same cannot be said of ‘Canasta’, where one significantly higher-than-control treatment was found (T2). As for carotenoids content, it largely seemed unaffected by the applied treatments, save for the T1 × ‘Ballerina’, which yielded a 33.3% improvement when considering the average of the control treatments.

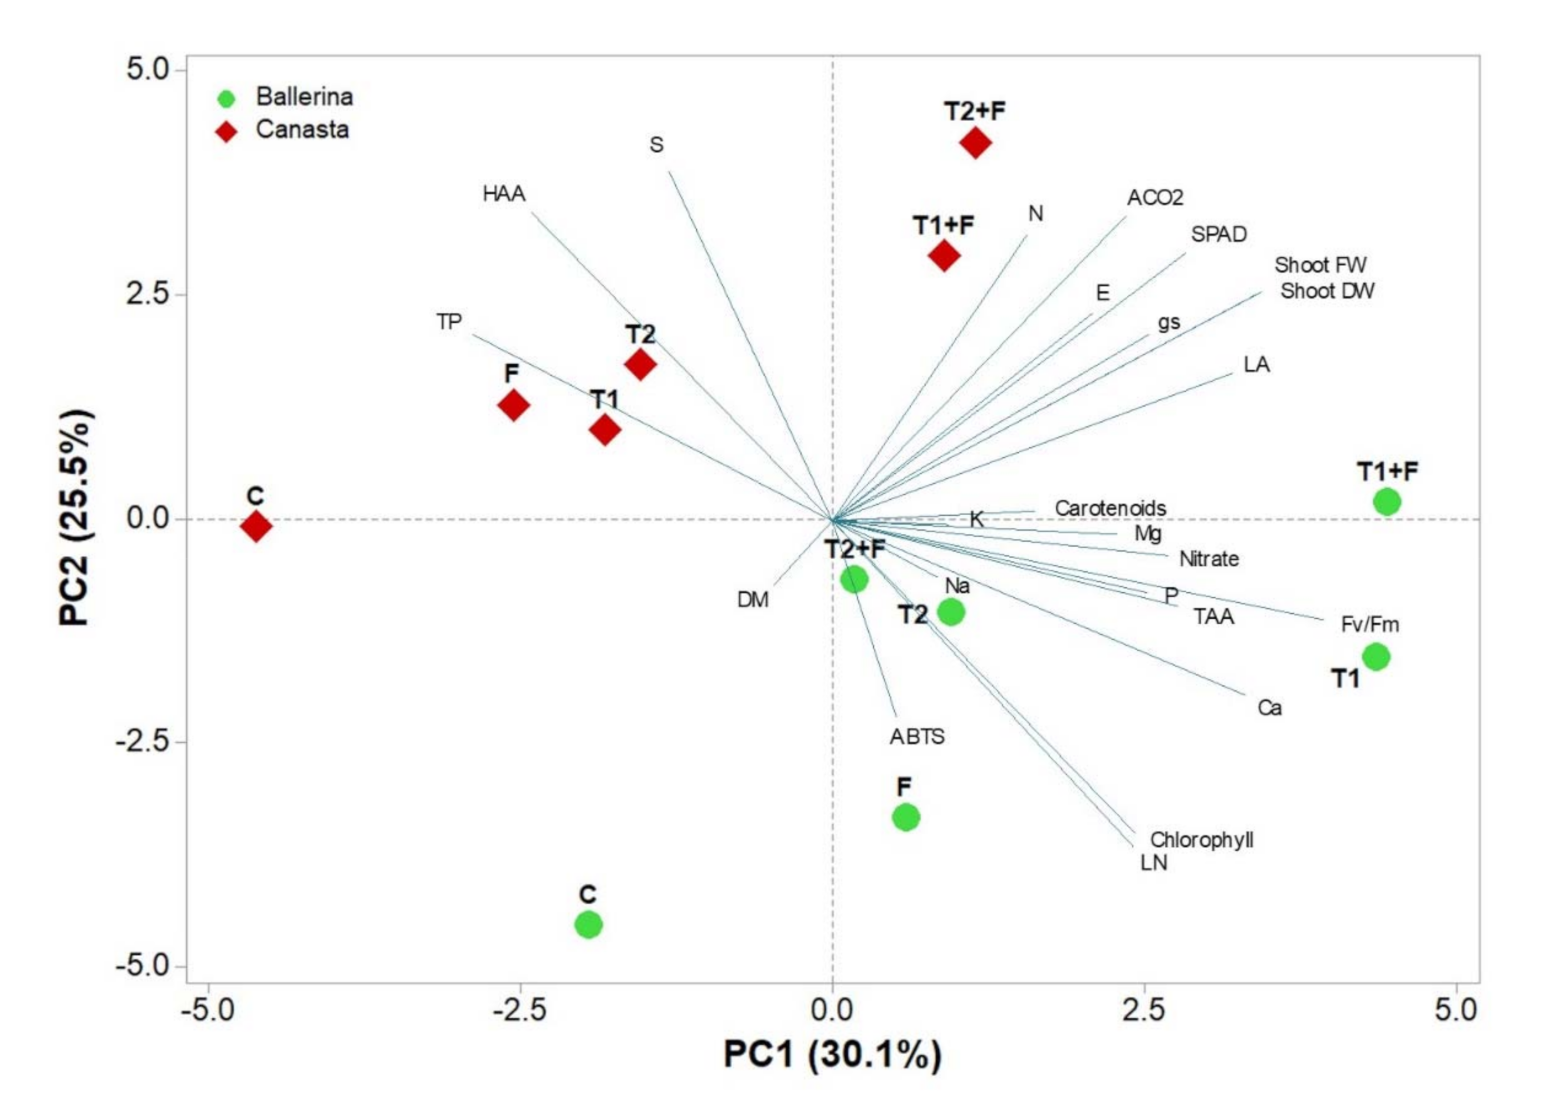
3.5. Principal Component Analysis

A comprehensive view of the biometric, mineral, qualitative and physiological aspects and subdivision of ‘Canasta’ and ‘Ballerina’ lettuce in response to PHs was acquired via principal component analysis (PCA), which helped to further explain the differences in the biostimulant treatment dosage and mode of application. Out of all the obtained principal components (PCs), the first three explained 69.8% of the total variance, where PC1 and PC2 (Figure 1), explained 55.6% of the cumulative variance and were associated with eigen values higher than1. PC1 explained 30.1% of the cumulative variance and was positively correlated with leaf area, shoot fresh and dry weight, all the studied minerals except for sulfur. In addition, it was positively correlated to Fv/Fm, gs, TAA and carotenoids. In contrast, it was negatively correlated with total phenols. On the other hand, PC2 explained 25.5% of the cumulative variance and was found positively correlated with total nitrogen, sulfur, SPAD index, photosynthetic parameters such as CO2 assimilation (ACO2) and transpiration rate (E) and HAA. Whilst it was negatively correlated with leaf number, DM%, total chlorophylls content and ABTS antioxidant activity. Based on the loading matrix, the PCA illustrated that the Shoot FW and DW were closely aligned with SPAD index and photosynthetic parameters (ACO2, E and gs). In addition, the score plot issued from the PCA obviously separated the application mode and dose of the PHs, resulting in ‘Canasta’ × T1 + F or T2 + F and ‘Ballerina’ × T1 + F in the upper right quadrant with high shoot FW and DW, SPAD, ACO2, E and gs. On the other hand, both cultivars × control were diagonally opposite in the lower left quadrant.

4. Discussion

The aim of this paper was to depict the effect of the utilization of PHs in boosting the yield of floating system-grown lettuce, in addition to detecting any physiological and qualitative improvement, especially when testing new combinations of biostimulant application. The obtained results showed that the biostimulant application did indeed prove to be beneficial in boosting crop yield, as T1 and T1 + F treatments on the green ‘Ballerina’ cultivar and the T2 + F on the red ‘Canasta’ cultivar, recorded the highest marketable fresh yield compared to every other treatment and their untreated controls. Such increases can be explained by the modulation of yield parameters by the biostimulant, as they are consistent with leaf area, leaf fresh weight and stem fresh weights (data not shown) increases, which in turn provided for higher dry weights figures (data not shown). Yield increases after PHs biostimulant treatments are in line with currently available literature, as there is evidence of higher lettuce and spinach yield when treated with PHs, independently from nitrogen fertilization levels [21,23]. Physiological results are also in accordance with previous studies, as the increases of photosynthetic and physiological parameters were also recorded in tomato plants treated with the same commercial formulation and were also found to be dosage-dependent [36]. Interestingly, the only biometric parameter proven to be unaffected by the treatments on both cultivars was the leaf number, which comes in contrast with what is found in rocket, spinach and even lettuce studies [20,22,37]. Such a difference may be at least in part explained by addressing two important factors that directly modulate this plant feature. First, as our results clearly showed, cultivar-specific variation had a direct influence on lettuce leaf number and even then, cultivar-specific sensibility to nutrient contents in the growing medium may also come into play, as some varieties may favor leaf expansion over new leaf growth [38]. This finding is supported by the increased leaf area of both cultivars when treated with PHs. Second, the very different growing systems also have an impact on this parameter: a consensus can be found in the available literature of leafy vegetables and in lettuce in particular grown in hydroponics having—other than the already mentioned advantages—higher leaf numbers compared to traditional soil and substrate-based systems [39,40,41], which is due to a variety of factors that are inherent to soil cultivation, such as suboptimal oxygen and moisture contents, competition from soil organisms and biotic and/or abiotic stresses [42,43,44,45] that are the prime culprits of yield losses.
The postulated mechanism for the biostimulant effect of PHs can be traced back to product composition and in particular to the presence of bioactive molecules such as the so-called signaling peptides. Of those, the root hair growth promoting peptide [46] is one of the most widely known and is contained in the tested product [47]. As its name implies, products containing such peptide provide modifications of root architecture in density, length and increases in the number of lateral roots [15]. Nonetheless, the explanation of the inner workings of PHs biostimulants prove more complex than that, as the increases in root growth may partially explain the elevated mineral (N, P, K, Ca, Mg, S) contents seen in this trial by the means of higher effective availability, but does not fully elucidate the recorded, whole-plant effects. A more involved explanation of the inner workings comes from their ability to act as plant physiological primers, by inducing transcription changes that favor the biosynthesis of phytohormones like indol-3-acetic acid (IAA) and abscisic acid (ABA) [16,48] and significantly impact gene expression in areas of plant development and metabolism [18,19], thus stimulating plant growth and yield. PH biostimulants, such as the one used in this trial, are also known to up-regulate nitrogen enzyme transcription both at the transporter and assimilation level [17,18], thereby increasing availability of this critical nutrient for plant growth for metabolic processes and can explain the improved photosynthetic activity which contributed to plant growth. Nevertheless, what this research also provides is a clear insight of a genotype-dependent response to PHs application, in both application mode and dosage. First, a comparatively higher growth response was denoted in the nutrient solution treatments, especially for the ‘Ballerina’ cultivar at its highest performing at T1 level. Differences between foliar and root-zone treatments was previously observed in a tomato study [49], whereby substrate drench application of a PHs biostimulant elicited increases in nitrogen metabolism and nitrogen leaf contents compared to the foliar treatment. The denoted differences in the biostimulant effect of the two application modes may be due to mechanisms at play when considering the means with which the product is taken up by the plants. Roots absorb amino-acids via specialized transporters [50] which, when coupled with the growing system used in this study, renders the availability of the biostimulant easier and daily throughout the growing cycle. Conversely, leaf absorption is a passive process that is mediated by climatic conditions such as wind and humidity levels that influence plant biological responses like stomata opening and cuticle thickness [51] and thus affecting the biostimulant absorption when applied in foliar mode. Therefore, placing T1 and T2 treatments in advantage when compared with F for ‘Ballerina’ and ‘Canasta’, respectively. In these regards, economic factors may also come into play when considering foliar treatments and especially combined applications. Colla [52] and Giordano [53] in their respective papers similarly employed weekly foliar treatments of the Trainer biostimulant on tomato and rocket plants and by operating a partial budget analysis, found that biostimulant-treated plants yielded increases in added net returns per hectare, from ~1260€ for tomato, stemming from a 7% increase in marketable yield, to ~9945€ for rocket which benefitted from a 50.7% yield increase. In this study, the T2 + F treatment elicited a 55.4% increase in yield for “Canasta”, while for “Ballerina” the T1 treatment elicited an 82.7% increase in yield, which prove to be economically advantageous. When these percentages increase of production are calculated per hectare, the additional yield obtained amid the biostimulant treatment render the boosting in tons very clear, where it increases from 35.6 to 65 tons’ ha−1 and from 45.2 to 70.3 tons ha−1 in “Ballerina” and “Canasta”, respectively.
On the other hand, significant yield decreases were also recorded at the T2 and T2 + F level for the ‘Ballerina’ cultivar compared to the best performing T1 level, which comes to a sharp contrast to what was obtained in ‘Canasta’. Insight into the matter comes from the physiological data, as for every studied parameter there was a reduction in the T2 + F × ‘Ballerina’ data compared to the best yielding T1 + F treatment, whereas ‘Canasta’ at the T2 + F level thrived with the elevated dosage by recording the highest recorded data. Growth inhibition by excessive exogenous amino-acid application has been postulated in literature as the phenomenon of “general amino acid inhibition” [54], whereby excess amino acid contents may either interfere with plant growth by inhibiting amino acid biosynthetic pathways [55] or, in a similar fashion, cause a strong phloematic load which in turn may cause plants to reduce nitrate absorption or reduction [47]. The latter case may explain why, in the ‘Ballerina’ × T2 combination the availability of amino acid and peptide contents in the nutrient solution might have reduced nitrate uptake and ultimately growth, phenomenon which was further accentuated by the increase in amino acid content provided by the T2 + F treatment. In the case of the ‘Canasta’ cultivar, amino-acid related stress symptoms may be averted by a combination of factors, all of which may relate to genotype-dependent stress-combating strategies. First and as seen in hydrophilic antioxidant activity data, ‘Canasta’ might originally have adapted a higher degree of stress related defenses due to the presence of anthocyanins, antioxidant molecules known to be induced by stress conditions [56,57,58], that were indirectly revealed by the melioration of the a* red color parameter detected at the same treatment (data not shown). Biostimulant treatments, due to the modulation of the ROS signaling network may have caused a change in antioxidant compounds [59] which manifested as increased HAA which may have provided stress protection. Similarly, to anthocyanins, the drastic change at higher biostimulant dosages in the content of total ascorbic acid, a powerful ROS scavenging molecule [60,61] may have contributed to better protection against performance-decreasing dosage issues. Evidence seems to favor the use of PHs biostimulants to increase the functional quality of produce.
Increased antioxidant activity, which is linked to the combined effects of multiple antioxidants, like vitamin C and phenolic compounds [62], was found in rocket [20], lettuce [23] and may be cultivar and dosage dependent, as seen with tomato fruits [36]. In this trial, quality improvements manifested in higher hydrophilic antioxidants known for their health benefits [63] and vitamin C that take part in this category, is an essential phytochemical for human health [64]. Moreover, enhanced root mineral uptake from the roots also increased leaf K and Mg contents, therefore increasing the nutritional value of the leaves. Our results also showed a significant increase of leaf nitrate contents, which plants use for nitrogen storage in leaves [65] and may have stemmed from the increase in root nitrogen availability and increased nitrogen metabolism after the application of the biostimulant. Nitrate contents in leafy greens is a cause for concern in today’s agriculture, as one of the main dietary sources for humans is vegetable consumption [66] and while there’s conflicting evidence on the role of nitrate on health risks due to long term consumption, a reduction in vegetable-borne contents may be favorable [67]. Still, no treatment out of all the tested combinations exceeded the nitrate threshold set by the EU Regulation 1258/2011, which for lettuce grown in protected environments is set at 4000 mg NO3 kg−1. PCA plotting has being used in previous studies [36,52] to better convey information regarding cultivars and biostimulant applications, especially with the regards of product quality. In this current study, the PCA reflected cultivar-specific varied response to biostimulant treatments tangible. In particular, ‘Canasta’ formed for two distinct groups in the upper quadrants, of which the right one includes higher quality produce with increased antioxidant activity, ascorbic acid and mineral contents. The lower right quadrant includes every other ‘Ballerina’ treatment, save for the control, which are characterized by elevated mineral and ascorbic acid contents, especially the T1 treatment, and low sulfur, phenolic and hydrophilic antioxidant activity. The different changes in functional quality of the two lettuce cultivars after being subjected to biostimulant application can further the hypothesis of these products acting by fine tuning ROS-mediated signaling [59], therefore being variably effective due to different leaf composition in the regards of pigments, ascorbate and phenolic contents.

5. Conclusions

The results obtained in this trial suggest that the application of a legume-derived protein hydrolysates biostimulant on L. sativa has positive effects on crop performance, seen as elevated yield, physiology and quality parameters. In depth, we recorded that the magnitude of the biostimulant effect is cultivar-specific, as the green ‘Ballerina’ cultivar recorded its highest growth performance at the lowest nutrient solution biostimulant application rate, with (T1 + F) or without foliar application (T1), resulting in the latter a staggering additional yield of 29.4 tons ha−1, whereas red ‘Canasta’ exhibited the highest yield and nutraceutical content (in terms of total ascorbic acid and hydrophilic antioxidant activity) at the highest nutrient solution application rate combined with foliar PHs application (T2 + F), resulting as well a staggering additional yield of 25.1 tons ha−1. In the case of ‘Ballerina’, as biostimulant usage has to be pondered against its costs to benefit ratio, these results could translate into monetary savings, in a commercial environment. In fact, not only the T1 treatment saves raw material compared to T2, but compared to F, it requires no further use of machines and manpower for the weekly foliar treatments and still enhance better shoot fresh yield. To conclude, more studies may be needed to figure out which genotypic features may impact performance when biostimulants are used, as to rationalize biostimulant application modes and dosages and guarantee the best crop growth and quality in a persistent manner.

Supplementary Materials

The following are available online at https://0-www-mdpi-com.brum.beds.ac.uk/article/10.3390/agronomy11061194/s1, Figure S1: Hourly average air temperature and air relative humidity values recorded throughout the lettuce crop cycle. Figure S2: Depiction of the experimental unit adopted for the trial.

Author Contributions

Conceptualization, F.C., C.E.-N. and Y.R.; methodology, F.C. and A.P.; software, F.C. and A.P.; validation, F.C., C.E.-N., A.P. and M.G.; formal analysis, F.C., C.E.-N., A.P. and M.G.; investigation, F.C., C.E.-N., A.P. and M.G.; resources, G.C. and Y.R.; data curation, F.C., C.E.-N., A.P. and M.G.; writing—original draft preparation, F.C.; writing—review and editing, F.C., C.E.-N., A.P., M.G., G.C. and Y.R.; visualization, G.C. and Y.R.; supervision, Y.R.; project administration, Y.R.; funding acquisition, G.C. and Y.R. All authors have read and agreed to the published version of the manuscript.

Funding

This research received no external funding.

Institutional Review Board Statement

Not applicable.

Informed Consent Statement

Not applicable.

Data Availability Statement

The datasets generated for this study are available on request to the corresponding author.

Acknowledgments

This work was carried out in the framework of the project ‘PHOBOS-Use of Protein-HydrOlysates as BiOstimulants of vegetable cropS: elucidating their mode of action and optimizing their effectiveness through a multidisciplinary approach’ funded within the PRIN call by the Italian Ministry of Education, University and Research (MIUR) (prot. n. 2017FYBLPP). The authors would like to thank Luigi-Giuseppe Duri, Luigi Formisano and Michele Ciriello for their assistance in the greenhouse technical work.

Conflicts of Interest

The authors declare no conflict of interest.

References

  1. Food and Agricultural Organization of the United Nations Statistical Data (FAOSTAT). Available online: http://www.fao.org/faostat/en/#data/QC (accessed on 2 May 2021).
  2. Stima Delle Superfici E Produzioni Delle Coltivazioni Agrarie, Floricole E Delle Piante Intere Da Vaso. Available online: http://dati.istat.it/Index.aspx?QueryId=33703# (accessed on 2 May 2021).
  3. Van Duyn, M.A.S.; Pivonka, E. Overview of the health benefits of fruit and vegetable consumption for the dietetics professional: Selected literature. J. Am. Diet. Assoc. 2000, 100, 1511–1521. [Google Scholar] [CrossRef]
  4. Kim, M.J.; Moon, Y.; Tou, J.C.; Mou, B.; Waterland, N.L. Nutritional value, bioactive compounds and health benefits of lettuce (Lactuca sativa L.). J. Food Compos. Anal. 2016, 49, 19–34. [Google Scholar] [CrossRef]
  5. Nicolle, C.; Cardinault, N.; Gueux, E.; Jaffrelo, L.; Rock, E.; Mazur, A.; Amouroux, P.; Rémésy, C. Health effect of vegetable-based diet: Lettuce consumption improves cholesterol metabolism and antioxidant status in the rat. Clin. Nutr. 2004, 23, 605–614. [Google Scholar] [CrossRef]
  6. Hernández, T.; Chocano, C.; Moreno, J.L.; García, C. Use of compost as an alternative to conventional inorganic fertilizers in intensive lettuce (Lactuca sativa L.) crops-Effects on soil and plant. Soil Tillage Res. 2016, 160, 14–22. [Google Scholar] [CrossRef]
  7. Gilardi, G.; Gullino, M.L.; Garibaldi, A. New diseases of wild and cultivated rocket in Italy. In Proceedings of the Acta Horticulturae, International Society for Horticultural Science (ISHS), Leuven, Belgium, 15 September 2013; Volume 1005, pp. 569–572. [Google Scholar]
  8. Gomiero, T. Soil degradation, land scarcity and food security: Reviewing a complex challenge. Sustain 2016, 8, 281. [Google Scholar] [CrossRef] [Green Version]
  9. Nicola, S.; Hoeberechts, J.; Fontana, E. Comparison between traditional and soilless culture systems to Produce rocket (Eruca sativa) with Low Nitrate Content. In Proceedings of the Acta Horticulturae, International Society for Horticultural Science (ISHS), Leuven, Belgium, 31 December 2005; Volume 697, pp. 549–555. [Google Scholar]
  10. Barbosa, G.L.; Almeida Gadelha, F.D.; Kublik, N.; Proctor, A.; Reichelm, L.; Weissinger, E.; Wohlleb, G.M.; Halden, R.U. Comparison of land, water, and energy requirements of lettuce grown using hydroponic vs. Conventional agricultural methods. Int. J. Environ. Res. Public Health 2015, 12, 6879–6891. [Google Scholar] [CrossRef] [Green Version]
  11. Orsini, F.; Kahane, R.; Nono-Womdim, R.; Gianquinto, G. Urban agriculture in the developing world: A review. Agron. Sustain. Dev. 2013, 33, 695–720. [Google Scholar] [CrossRef] [Green Version]
  12. El-Nakhel, C.; Petropoulos, S.A.; Pannico, A.; Kyriacou, M.C.; Giordano, M.; Colla, G.; Troise, A.D.; Vitaglione, P.; De Pascale, S.; Rouphael, Y. The bioactive profile of lettuce produced in a closed soilless system as configured by combinatorial effects of genotype and macrocation supply composition. Food Chem. 2020, 309, 125713. [Google Scholar] [CrossRef]
  13. Sambo, P.; Nicoletto, C.; Giro, A.; Pii, Y.; Valentinuzzi, F.; Mimmo, T.; Lugli, P.; Orzes, G.; Mazzetto, F.; Astolfi, S.; et al. Hydroponic Solutions for Soilless Production Systems: Issues and Opportunities in a Smart Agriculture Perspective. Front. Plant Sci. 2019, 10, 923. [Google Scholar] [CrossRef]
  14. Regulation (EU) 2019/1009 of the European Paliament and of the Council of 5 June 2019. Available online: https://eur-lex.europa.eu/eli/reg/2019/1009/oj (accessed on 2 May 2021).
  15. Colla, G.; Hoagland, L.; Ruzzi, M.; Cardarelli, M.; Bonini, P.; Canaguier, R.; Rouphael, Y. Biostimulant action of protein hydrolysates: Unraveling their effects on plant physiology and microbiome. Front. Plant Sci. 2017, 8, 2202. [Google Scholar] [CrossRef] [Green Version]
  16. Colla, G.; Rouphael, Y.; Canaguier, R.; Svecova, E.; Cardarelli, M. Biostimulant action of a plant-derived protein hydrolysate produced through enzymatic hydrolysis. Front. Plant Sci. 2014, 5, 448. [Google Scholar] [CrossRef] [Green Version]
  17. Ertani, A.; Cavani, L.; Pizzeghello, D.; Brandellero, E.; Altissimo, A.; Ciavatta, C.; Nardi, S. Biostimulant activity of two protein hydrolyzates in the growth and nitrogen metabolism of maize seedlings. J. Plant Nutr. Soil Sci. 2009, 172, 237–244. [Google Scholar] [CrossRef]
  18. Ertani, A.; Schiavon, M.; Nardi, S. Transcriptome-wide identification of differentially expressed genes in Solanum lycopersicon L. In response to an Alfalfa-protein hydrolysate using microarrays. Front. Plant Sci. 2017, 8, 1159. [Google Scholar] [CrossRef] [PubMed] [Green Version]
  19. Schiavon, M.; Ertani, A.; Nardi, S. Effects of an alfalfa protein hydrolysate on the gene expression and activity of enzymes of the tricarboxylic acid (TCA) cycle and nitrogen metabolism in Zea mays L. J. Agric. Food Chem. 2008, 56, 11800–11808. [Google Scholar] [CrossRef] [PubMed]
  20. Caruso, G.; De Pascale, S.; Cozzolino, E.; Giordano, M.; El-Nakhel, C.; Cuciniello, A.; Cenvinzo, V.; Colla, G.; Rouphael, Y. Protein hydrolysate or plant extract-based biostimulants enhanced yield and quality performances of greenhouse perennial wall rocket grown in different seasons. Plants 2019, 8, 208. [Google Scholar] [CrossRef] [PubMed] [Green Version]
  21. Rouphael, Y.; Giordano, M.; Cardarelli, M.; Cozzolino, E.; Mori, M.; Kyriacou, M.C.; Bonini, P.; Colla, G. Plant-and seaweed-based extracts increase yield but differentially modulate nutritional quality of greenhouse spinach through biostimulant action. Agronomy 2018, 8, 126. [Google Scholar] [CrossRef] [Green Version]
  22. Xu, C.; Mou, B. Drench application of fish-derived protein hydrolysates affects lettuce growth, chlorophyll content, and gas exchange. Horttechnology 2017, 27, 539–543. [Google Scholar] [CrossRef]
  23. Di Mola, I.; Cozzolino, E.; Ottaiano, L.; Giordano, M.; Rouphael, Y.; Colla, G.; Mori, M. Effect of vegetal- And seaweed extract-based biostimulants on agronomical and leaf quality traits of plastic tunnel-grown baby lettuce under four regimes of nitrogen fertilization. Agronomy 2019, 9, 571. [Google Scholar] [CrossRef] [Green Version]
  24. Vernizzi, P.; Borghesi, E.; Ferrante, A. Application of Biostimulants in Floating System for Improving Rocket Quality Plant responses to biostimulants application View project Bioactive Compounds Biosynthesis and Metabolism in Fruit and Vegetables View project. J. Food Agric. Environ. 2005, 3, 86. [Google Scholar]
  25. Lucini, L.; Rouphael, Y.; Cardarelli, M.; Canaguier, R.; Kumar, P.; Colla, G. The effect of a plant-derived biostimulant on metabolic profiling and crop performance of lettuce grown under saline conditions. Sci. Hortic. 2015, 182, 124–133. [Google Scholar] [CrossRef]
  26. Mou, B. Lettuce. In Vegetables I: Asteraceae, Brassicaceae, Chenopodicaceae, and Cucurbitaceae; Prohens, J., Nuez, F., Eds.; Handbook of Plant Breeding; Springer: New York, NY, USA, 2008; pp. 75–116. ISBN 978-0-387-30443-4. [Google Scholar]
  27. Kim, D.E.; Shang, X.; Assefa, A.D.; Keum, Y.S.; Saini, R.K. Metabolite profiling of green, green/red, and red lettuce cultivars: Variation in health beneficial compounds and antioxidant potential. Food Res. Int. 2018, 105, 361–370. [Google Scholar] [CrossRef]
  28. Paul, K.; Sorrentino, M.; Lucini, L.; Rouphael, Y.; Cardarelli, M.; Bonini, P.; Miras Moreno, M.B.; Reynaud, H.; Canaguier, R.; Trtílek, M.; et al. A combined phenotypic and metabolomic approach for elucidating the biostimulant action of a plant-derived protein hydrolysate on tomato grown under limited water availability. Front. Plant Sci. 2019, 10, 493. [Google Scholar] [CrossRef]
  29. Bremner, J.M. Total nitrogen. In Methods of Soil Analysis. Part 2. CHemical and Microbiological Properties. Agronomy Monograph 9; Black, C.A., Evans, D., White, J.L., Ensminger, L.E., Clark, F.E., Eds.; American Society of Agronomy, Soil Science Society of America: Madison, WI, USA, 1965; pp. 1149–1178. [Google Scholar]
  30. Pannico, A.; El-Nakhel, C.; Kyriacou, M.C.; Giordano, M.; Stazi, S.R.; De Pascale, S.; Rouphael, Y. Combating Micronutrient Deficiency and Enhancing Food Functional Quality Through Selenium Fortification of Select Lettuce Genotypes Grown in a Closed Soilless System. Front. Plant Sci. 2019, 10, 1495. [Google Scholar] [CrossRef] [Green Version]
  31. Lichtenthaler, H.K.; Burkart, S. Photosynthesis and high light stress. Wild 1999, 25, 3–16. [Google Scholar]
  32. Singleton, V.L.; Orthofer, R.; Lamuela-Raventós, R.M. Analysis of total phenols and other oxidation substrates and antioxidants by means of folin-ciocalteu reagent. Methods Enzymol. 1999, 299, 152–178. [Google Scholar] [CrossRef]
  33. Kampfenkel, K.; Van Montagu, M.; Inzé, D. Extraction and determination of ascorbate and dehydroascorbate from plant tissue. Anal. Biochem. 1995, 225, 165–167. [Google Scholar] [CrossRef] [PubMed]
  34. Re, R.; Pellegrini, N.; Proteggente, A.; Pannala, A.; Yang, M.; Rice-Evans, C. Antioxidant activity applying an improved ABTS radical cation decolorization assay. Free Radic. Biol. Med. 1999, 26, 1231–1237. [Google Scholar] [CrossRef]
  35. Fogliano, V.; Verde, V.; Randazzo, G.; Ritieni, A. Method for measuring antioxidant activity and its application to monitoring the antioxidant capacity of wines. J. Agric. Food Chem. 1999, 47, 1035–1040. [Google Scholar] [CrossRef]
  36. Rouphael, Y.; Colla, G.; Giordano, M.; El-Nakhel, C.; Kyriacou, M.C.; De Pascale, S. Foliar applications of a legume-derived protein hydrolysate elicit dose-dependent increases of growth, leaf mineral composition, yield and fruit quality in two greenhouse tomato cultivars. Sci. Hortic. 2017, 226, 353–360. [Google Scholar] [CrossRef]
  37. Carillo, P.; Colla, G.; Fusco, G.M.; Dell’Aversana, E.; El-Nakhel, C.; Giordano, M.; Pannico, A.; Cozzolino, E.; Mori, M.; Reynaud, H.; et al. Morphological and physiological responses induced by protein hydrolysate-based biostimulant and nitrogen rates in greenhouse spinach. Agronomy 2019, 9, 450. [Google Scholar] [CrossRef] [Green Version]
  38. Mampholo, B.M.; Maboko, M.M.; Soundy, P.; Sivakumar, D. Variety-specific responses of lettuce grown in a gravel-film technique closed hydroponic system to N supply on yield, morphology, phytochemicals, mineral content and safety. J. Integr. Agric. 2018, 17, 2447–2457. [Google Scholar] [CrossRef] [Green Version]
  39. Manzocco, L.; Foschia, M.; Tomasi, N.; Maifreni, M.; Dalla Costa, L.; Marino, M.; Cortella, G.; Cesco, S. Influence of hydroponic and soil cultivation on quality and shelf life of ready-to-eat lamb’s lettuce (Valerianella locusta L. Laterr). J. Sci. Food Agric. 2011, 91, 1373–1380. [Google Scholar] [CrossRef]
  40. Abu-Shahba, M.S.; Mansour, M.M.; Mohamed, H.I.; Sofy, M.R. Comparative Cultivation and Biochemical Analysis of Iceberg Lettuce Grown in Sand Soil and Hydroponics With or Without Microbubbles and Macrobubbles. J. Soil Sci. Plant Nutr. 2020, 21, 389–403. [Google Scholar] [CrossRef]
  41. de Souza, P.F.; Borghezan, M.; Zappelini, J.; de Carvalho, L.R.; Ree, J.; Barcelos-Oliveira, J.L.; Pescador, R. Physiological differences of ‘crocantela’ lettuce cultivated in conventional and hydroponic systems. Hortic. Bras. 2019, 37, 101–105. [Google Scholar] [CrossRef]
  42. Ouyang, Z.; Tian, J.; Yan, X.; Shen, H. Effects of different concentrations of dissolved oxygen or temperatures on the growth, photosynthesis, yield and quality of lettuce. Agric. Water Manag. 2020, 228, 105896. [Google Scholar] [CrossRef]
  43. Gupta, A.; Rico-Medina, A.; Caño-Delgado, A.I. The physiology of plant responses to drought. Science 2020, 368, 266–269. [Google Scholar] [CrossRef]
  44. Minhas, P.S.; Rane, J.; Pasala, R.K. Abiotic stresses in agriculture: An overview. In Abiotic Stress Management for Resilient Agriculture; Minhas, P.S., Rane, J., Pasala, R.K., Eds.; Springer: Singapore, 2017; pp. 3–8. ISBN 9789811057441. [Google Scholar]
  45. Oerke, E.C. Crop losses to pests. J. Agric. Sci. 2006, 144, 31–43. [Google Scholar] [CrossRef]
  46. Matsumiya, Y.; Kubo, M. Soybean Peptide: Novel Plant Growth Promoting Peptide from Soybean. Soybean Nutr. 2011, 215–230. [Google Scholar] [CrossRef] [Green Version]
  47. Colla, G.; Nardi, S.; Cardarelli, M.; Ertani, A.; Lucini, L.; Canaguier, R.; Rouphael, Y. Protein hydrolysates as biostimulants in horticulture. Sci. Hortic. 2015, 196, 28–38. [Google Scholar] [CrossRef]
  48. Carletti, P.; Arrigoni, G.; Ebinezer, L.B.; Franchin, C.; Trentin, A.R.; Trevisan, S.; Agrawal, G.K.; Rakwal, R.; Quaggiotti, S.; Masi, A. Quantitative proteomics of maize roots treated with a protein hydrolysate: A comparative study with transcriptomics highlights the molecular mechanisms responsive to biostimulants. J. Agric. Food Chem. 2020, 68, 7541–7553. [Google Scholar] [CrossRef]
  49. Sestili, F.; Rouphael, Y.; Cardarelli, M.; Pucci, A.; Bonini, P.; Canaguier, R.; Colla, G. Protein hydrolysate stimulates growth in tomato coupled with N-dependent gene expression involved in N assimilation. Front. Plant Sci. 2018, 9, 1233. [Google Scholar] [CrossRef] [PubMed] [Green Version]
  50. Näsholm, T.; Kielland, K.; Ganeteg, U. Uptake of organic nitrogen by plants. New Phytol. 2009, 182, 31–48. [Google Scholar] [CrossRef]
  51. Pecha, J.; Fürst, T.; Kolomazník, K.; Friebrová, V.; Svoboda, P. Protein biostimulant foliar uptake modeling: The impact of climatic conditions. AIChE J. 2012, 58, 2010–2019. [Google Scholar] [CrossRef]
  52. Colla, G.; Cardarelli, M.; Bonini, P.; Rouphael, Y. Foliar applications of protein hydrolysate, plant and seaweed extracts increase yield but differentially modulate fruit quality of greenhouse tomato. HortScience 2017, 52, 1214–1220. [Google Scholar] [CrossRef]
  53. Giordano, M.; El-Nakhel, C.; Caruso, G.; Cozzolino, E.; De Pascale, S.; Kyriacou, M.C.; Colla, G.; Rouphael, Y. Stand-alone and combinatorial effects of plant-based biostimulants on the production and leaf quality of perennial wall rocket. Plants 2020, 9, 1–15. [Google Scholar] [CrossRef] [PubMed]
  54. Bonner, C.A.; Jensen, R.A. Recognition of specific patterns of amino acid inhibition of growth in higher plants, uncomplicated by glutamine-reversible “general amino acid inhibition”. Plant Sci. 1997, 130, 133–143. [Google Scholar] [CrossRef]
  55. Fernández-Aparicio, M.; Bernard, A.; Falchetto, L.; Marget, P.; Chauvel, B.; Steinberg, C.; Morris, C.E.; Gibot-Leclerc, S.; Boari, A.; Vurro, M.; et al. Investigation of amino acids as herbicides for control of orobanche minor parasitism in red clover. Front. Plant Sci. 2017, 8. [Google Scholar] [CrossRef]
  56. Kovinich, N.; Kayanja, G.; Chanoca, A.; Otegui, M.S.; Grotewold, E. Abiotic stresses induce different localizations of anthocyanins in Arabidopsis. Plant Signal. Behav. 2015, 10. [Google Scholar] [CrossRef] [Green Version]
  57. Zhang, Q.; Zhai, J.; Shao, L.; Lin, W.; Peng, C. Accumulation of Anthocyanins: An Adaptation Strategy of Mikania micrantha to Low Temperature in Winter. Front. Plant Sci. 2019, 10. [Google Scholar] [CrossRef] [PubMed] [Green Version]
  58. Xu, Z.; Rothstein, S.J. ROS-Induced anthocyanin production provides feedback protection by scavenging ROS and maintaining photosynthetic capacity in Arabidopsis. Plant Signal. Behav. 2018, 13, e1451708. [Google Scholar] [CrossRef] [Green Version]
  59. Paul, K.; Sorrentino, M.; Lucini, L.; Rouphael, Y.; Cardarelli, M.; Bonini, P.; Reynaud, H.; Canaguier, R.; Trtílek, M.; Panzarová, K.; et al. Understanding the biostimulant action of vegetal-derived protein hydrolysates by high-throughput plant phenotyping and metabolomics: A case study on tomato. Front. Plant Sci. 2019, 10, 47. [Google Scholar] [CrossRef]
  60. Das, K.; Roychoudhury, A. Reactive oxygen species (ROS) and response of antioxidants as ROS-scavengers during environmental stress in plants. Front. Environ. Sci. 2014, 2. [Google Scholar] [CrossRef] [Green Version]
  61. Akram, N.A.; Shafiq, F.; Ashraf, M. Ascorbic acid-a potential oxidant scavenger and its role in plant development and abiotic stress tolerance. Front. Plant Sci. 2017, 8. [Google Scholar] [CrossRef] [PubMed]
  62. Colonna, E.; Rouphael, Y.; Barbieri, G.; De Pascale, S. Nutritional quality of ten leafy vegetables harvested at two light intensities. Food Chem. 2016, 199, 702–710. [Google Scholar] [CrossRef]
  63. Li, D.; Wang, P.; Luo, Y.; Zhao, M.; Chen, F. Health benefits of anthocyanins and molecular mechanisms: Update from recent decade. Crit. Rev. Food Sci. Nutr. 2017, 57, 1729–1741. [Google Scholar] [CrossRef] [PubMed]
  64. Naidu, K.A. Vitamin C in human health and disease is still a mystery? An overview. Nutr. J. 2003, 2, 1–10. [Google Scholar] [CrossRef] [Green Version]
  65. Anjana, S.U.; Iqbal, M. Nitrate accumulation in plants, factors affecting the process, and human health implications. A review. Agron. Sustain. Dev. 2007, 27, 45–57. [Google Scholar] [CrossRef]
  66. Alexander, J.; Benford, D.; Cockburn, A.; Cravedi, J.; Dogliotti, E.; Di Domenico, A.; Fernández-cruz, M.L.; Fink-gremmels, J.; Fürst, P.; Galli, C.; et al. Nitrate in vegetables-Scientific Opinion of the Panel on Contaminants in the Food chain. EFSA J. 2008, 6, 689. [Google Scholar] [CrossRef]
  67. Colla, G.; Kim, H.J.; Kyriacou, M.C.; Rouphael, Y. Nitrate in fruits and vegetables. Sci. Hortic. 2018, 237, 221–238. [Google Scholar] [CrossRef]
Figure 1. Principal component loading plot and scores of principal component analysis (PCA) on biometric (shoot fresh weight (FW), shoot dry weight (DW), dry matter % (DM) leaf number (LF) and Leaf Area (LA)), mineral (Nitrate, P, K, Ca, Mg, S and Na), qualitative (Total chlorophylls, Hydrophilic antioxidant activity (HAA), ABTS antioxidant activity, carotenoids, total phenols (TP) and total ascorbic acid (TAA)) and physiological aspects (SPAD index, fluorescence (Fv:Fm ratio), assimilated CO2 (ACO2), stomatal conductance (gs) and transpiration rate (E)) of ‘Canasta’ and ‘Ballerina’ lettuce as influenced by the biostimulant application mode and dose (F: foliar treatment (3 mL L−1), T1: nutrient solution treatment 0.15 mL L−1, T2: nutrient solution treatment 0.3 mL L−1).
Agronomy 11 01194 g001
Table 1. Leaf number, leaf area, fresh and dry biomass and leaf dry matter of ‘Canasta’ and ‘Ballerina’ lettuce as influenced by the biostimulant application.
Source of VarianceLeaf NumberLeaf AreaShoot Fresh YieldDry Shoot BiomassLeaf Dry Matter
(no. plant−1)(cm2 plant−1)(g plant−1)(g plant−1)(%)
Cultivar (C)
Ballerina22.39 ± 0.321603 ± 5080.28 ± 3.64.42 ± 0.215.52 ± 0.08
Canasta17.33 ± 0.571522 ± 3579.86 ± 3.174.34 ± 0.165.43 ± 0.05
t-test***nsnsnsns
Biostimulant (B)
Control20.50 ± 1.671264 ± 44 c57.70 ± 3.17 d3.30 ± 0.19 d5.81 ± 0.04 a
F19.50 ± 1.571515 ± 34 b74.68 ± 1.44 c3.81 ± 0.05 c5.10 ± 0.06 d
T120.00 ± 1.811523 ± 70 b81.01 ± 5.32 b4.39 ± 0.28 b5.39 ± 0.07 c
T220.17 ± 0.951675 ± 54 a83.45 ± 2.01 b4.59 ± 0.11 b5.47 ± 0.05 bc
T1 + F19.83 ± 1.141695 ± 13 a92.95 ± 2.01 a5.14 ± 0.16 a5.51 ± 0.13 bc
T2 + F19.17 ± 1.051702 ± 20 a90.65 ± 4.46 a5.06 ± 0.23 a5.58 ± 0.07 b
ns************
C × B
Ballerina × Control23.67 ± 0.881193 ± 55 f50.79 ± 1.58 h2.88 ± 0.10 f5.86 ± 0.06 a
Ballerina × F22.67 ± 0.331557 ± 58 bc76.69 ± 2.30 de3.82 ± 0.10 e5.00 ± 0.06 f
Ballerina × T123.33 ± 0.671665 ± 33 ab92.81 ± 1.58 b5.02 ± 0.02 b5.36 ± 0.10 de
Ballerina × T221.67 ± 0.881783 ± 52 a87.19 ± 2.59 c4.82 ± 0.08 bc5.51 ± 0.09 bcd
Ballerina × T1 + F22.00 ± 0.581694 ± 28 a93.81 ± 4.03 b5.42 ± 0.23 a5.76 ± 0.14 ab
Ballerina × T2 + F21.00 ± 0.581729 ± 32 a80.86 ± 1.15 de4.58 ± 0.14 cd5.65 ± 0.12 abc
Canasta × Control17.33 ± 1.761335 ± 41 e64.60 ± 0.72 g3.72 ± 0.07 e5.76 ± 0.02 ab
Canasta × F16.33 ± 1.451473 ± 26 cd72.66 ± 0.58 ef3.80 ± 0.02 e5.19 ± 0.05 ef
Canasta × T116.67 ± 2.191382 ± 57 de69.21 ± 1.01 fg3.77 ± 0.10 e5.43 ± 0.10 cde
Canasta × T218.67 ± 1.201568 ± 24 bc79.71 ± 0.43 de4.35 ± 0.05 d5.42 ± 0.06 cde
Canasta × T1 + F17.67 ± 1.201696 ± 8 a92.09 ± 1.58 bc4.87 ± 0.03 bc5.27 ± 0.06 de
Canasta × T2 + F17.33 ± 1.331676 ± 19 ab100.43 ± 1.29 a5.54 ± 0.09 a5.51 ± 0.09 bcd
ns***********
All data are expressed as mean ± standard error, n = 3. ns, **, *** non-significant or significant at p ≤ 0.01 and 0.001, respectively. Cultivars means were compared by t-Test. Different letters within each column indicate significant differences according to Duncan’s multiple-range test (p = 0.05). F: foliar treatment (3 mL L−1), T1: nutrient solution treatment 0.15 mL L−1, T2: nutrient solution treatment 0.3 mL L−1.
Table 2. SPAD index, Fv/Fm ratio and leaf gas exchange (assimilated CO2: ACO2, stomatal conductance: gs and transpiration rate: E) of ‘Canasta’ and ‘Ballerina’ lettuce as influenced by the biostimulant application.
Source of VarianceSPAD IndexFluorescenceACO2gsE
Fv/Fm Ratio(μmol CO2 m−2 s−1)(mol H2O m−2 s−1)(mmol H2O m−2 s−1)
Cultivar (C)
Ballerina32.56 ± 0.250.837 ± 0.0019.64 ± 0.480.64 ± 0.048.86 ± 0.29
Canasta33.01 ± 0.290.830 ± 0.0020.41 ± 0.390.67 ± 0.049.29 ± 0.24
t-testns***nsnsns
Biostimulant (B)
Control31.70 ± 0.40 d0.831 ± 0.00 bc18.27 ± 0.67 c0.50 ± 0.04 c8.41 ± 0.38 c
F32.13 ± 0.24 d0.830 ± 0.00 c18.33 ± 0.67 c0.64 ± 0.07 b8.00 ± 0.41 c
T133.03 ± 0.29 bc0.836 ± 0.00 a19.94 ± 0.50 b0.62 ± 0.03 b9.73 ± 0.15 ab
T232.35 ± 0.14 cd0.835 ± 0.00 ab20.31 ± 0.25 b0.67 ± 0.04 b9.10 ± 0.33 b
T1 + F33.98 ± 0.18 a0.836 ± 0.00 a21.54 ± 0.31 a0.85 ± 0.09 a10.00 ± 0.35 a
T2 + F33.52 ± 0.66 ab0.835 ± 0.00 ab21.76 ± 0.72 a0.66 ± 0.07 b9.22 ± 0.59 b
*************
C × B
Ballerina × Control31.19 ± 0.52 d0.834 ± 0.00 bcd17.12 ± 0.81 f0.58 ± 0.04 cdef8.99 ± 0.28 cde
Ballerina × F32.30 ± 0.31 c0.834 ± 0.00 bcd17.21 ± 0.83 f0.52 ± 0.03 def7.39 ± 0.52 f
Ballerina × T133.62 ± 0.18 b0.842 ± 0.00 a20.93 ± 0.53 bcd0.68 ± 0.04 bcde9.65 ± 0.33 abc
Ballerina × T232.30 ± 0.20 c0.838 ± 0.00 ab20.64 ± 0.42 bcd0.58 ± 0.01 cdef8.41 ± 0.00 def
Ballerina × T1 + F33.88 ± 0.30 b0.842 ± 0.00 a21.78 ± 0.43 b1.00 ± 0.10 a10.65 ± 0.30 a
Ballerina × T2 + F32.08 ± 0.17 cd0.833 ± 0.00 bcd20.16 ± 0.20 cde0.50 ± 0.02 ef8.07 ± 0.61 ef
Canasta × Control32.21 ± 0.51 c0.828 ± 0.00 de19.42 ± 0.53 de0.41 ± 0.03 f7.82 ± 0.55 ef
Canasta × F31.96 ± 0.41 cd0.826 ± 0.00 e19.45 ± 0.52 de0.76 ± 0.11 bc8.61 ± 0.45 cde
Canasta × T132.45 ± 0.21 c0.831 ± 0.00 cde18.95 ± 0.12 e0.57 ± 0.01 def9.81 ± 0.06 abc
Canasta × T232.41 ± 0.23 c0.831 ± 0.00 cde19.98 ± 0.16 cde0.75 ± 0.04 bc9.78 ± 0.27 abc
Canasta × T1 + F34.08 ± 0.26 ab0.830 ± 0.00 cde21.31 ± 0.49 bc0.71 ± 0.08 bcd9.35 ± 0.32 bcd
Canasta × T2 + F34.97 ± 0.26 a0.836 ± 0.00 abc23.36 ± 0.02 a0.81 ± 0.05 b10.36 ± 0.27 ab
*************
All data are expressed as mean ± standard error, n = 3. ns, *, *** non-significant or significant at p ≤ 0.05 and 0.001, respectively. Cultivars means were compared by t-Test. Different letters within each column indicate significant differences according to Duncan’s multiple-range test (p = 0.05). F: foliar treatment (3 mL L−1), T1: nutrient solution treatment 0.15 mL L−1, T2: nutrient solution treatment 0.3 mL L−1.
Table 3. Total nitrogen and mineral leaf content (nitrate, P, K, Ca, Mg, S and Na) of ‘Canasta’ and ‘Ballerina’ lettuce as influenced by the biostimulant application.
Source of VarianceTotal NNitratePKCaMgSNa
(%)(mg kg−1 FW)(mg g−1 DW)(mg g−1 DW)(mg g−1 DW)(mg g−1 DW)(mg g−1 DW)(mg g−1 DW)
Cultivar (C)
Ballerina3.88 ± 0.041446 ± 674.23 ± 0.0943.83 ± 0.6416.58 ± 0.335.91 ± 0.111.04 ± 0.024.45 ± 0.22
Canasta3.99 ± 0.061106 ± 834.02 ± 0.0844.13 ± 0.5814.86 ± 0.205.78 ± 0.081.20 ± 0.024.36 ± 0.18
t-testns**nsns***ns***ns
Biostimulant (B)
Control3.77 ± 0.04 c1087 ± 113 c3.78 ± 0.11 b42.09 ± 0.81 b15.11 ± 0.56 bc5.37 ± 0.10 d1.07 ± 0.05 b4.45 ± 0.38 b
F3.83 ± 0.07 bc1090 ± 157 c4.29 ± 0.12 a45.49 ± 0.83 a16.00 ± 0.54 ab6.04 ± 0.03 ab1.13 ± 0.04 ab4.28 ± 0.29 bc
T14.00 ± 0.09 ab1346 ± 40 b4.40 ± 0.08 a45.79 ± 0.72 a16.21 ± 0.64 ab6.27 ± 0.23 a1.04 ± 0.03 b5.50 ± 0.17 a
T23.89 ± 0.09 bc919 ± 72 d4.18 ± 0.14 a44.48 ± 0.81 a14.58 ± 0.47 c5.93 ± 0.11 abc1.12 ± 0.04 ab3.56 ± 0.20 d
T1 + F4.09 ± 0.09 a1480 ± 101 b4.43 ± 0.10 a45.46 ± 0.61 a16.55 ± 0.61 a5.82 ± 0.09 bc1.17 ± 0.06 a4.76 ± 0.28 b
T2 + F4.03 ± 0.06 ab1733 ± 76 a3.67 ± 0.08 b40.56 ± 0.29 b15.88 ± 0.49 ab5.62 ± 0.10 cd1.20 ± 0.05 a3.89 ± 0.08 cd
*******************
C × B
Ballerina × Control3.76 ± 0.071319 ± 28 c3.84 ± 0.1641.85 ± 1.1116.14 ± 0.555.31 ± 0.151.00 ± 0.015.07 ± 0.57 ab
Ballerina × F3.83 ± 0.131410 ± 91 bc4.42 ± 0.2145.87 ± 1.8117.15 ± 0.336.00 ± 0.031.05 ± 0.003.75 ± 0.07 de
Ballerina × T13.93 ± 0.101338 ± 66 c4.52 ± 0.0745.07 ± 1.1517.54 ± 0.466.63 ± 0.320.97 ± 0.025.37 ± 0.24 ab
Ballerina × T23.76 ± 0.061069 ± 48 de4.41 ± 0.1944.14 ± 1.6114.34 ± 0.555.90 ± 0.131.08 ± 0.043.16 ± 0.12 e
Ballerina × T1 + F4.00 ± 0.051692 ± 70 a4.46 ± 0.0645.59 ± 0.6017.78 ± 0.315.87 ± 0.071.05 ± 0.025.30 ± 0.12 ab
Ballerina × T2 + F4.00 ± 0.071846 ± 123 a3.71 ± 0.1040.48 ± 0.3316.54 ± 0.765.73 ± 0.111.11 ± 0.054.03 ± 0.01 d
Canasta × Control3.77 ± 0.04854 ± 96 ef3.73 ± 0.1842.33 ± 1.4114.08 ± 0.445.44 ± 0.141.15 ± 0.083.83 ± 0.03 de
Canasta × F3.83 ± 0.09770 ± 116 f4.15 ± 0.0745.11 ± 0.1214.85 ± 0.146.08 ± 0.061.21 ± 0.034.81 ± 0.37 bc
Canasta × T14.07 ± 0.151354 ± 59 c4.28 ± 0.1046.51 ± 0.8814.89 ± 0.315.92 ± 0.191.12 ± 0.005.62 ± 0.28 a
Canasta × T24.02 ± 0.14770 ± 32 f3.96 ± 0.1144.83 ± 0.7414.83 ± 0.855.96 ± 0.211.16 ± 0.073.97 ± 0.12 d
Canasta × T1 + F4.18 ± 0.171269 ± 34 cd4.40 ± 0.2145.34 ± 1.2115.33 ± 0.535.77 ± 0.191.29 ± 0.034.22 ± 0.28 cd
Canasta × T2 + F4.07 ± 0.121621 ± 36 ab3.63 ± 0.1540.64 ± 0.5515.21 ± 0.425.51 ± 0.161.28 ± 0.033.74 ± 0.09 de
ns**nsnsnsnsns***
All data are expressed as mean ± standard error, n = 3. ns, *, **, *** non-significant or significant at p ≤ 0.05, 0.01 and 0.001, respectively. Cultivars means were compared by t-Test. Different letters within each column indicate significant differences according to Duncan’s multiple-range test (p = 0.05). F: foliar treatment (3 mL L−1), T1: nutrient solution treatment 0.15 mL L−1, T2: nutrient solution treatment 0.3 mL L−1.
Table 4. Leaf pigments (chlorophylls and carotenoids), total ascorbic acid (TAA), hydrophilic antioxidant activity (HAA), ABTS antioxidant activity (ABTS) and total phenols of ‘Canasta’ and ‘Ballerina’ lettuce as influenced by the biostimulant application.
Source of VarianceTotal ChlorophyllsTAAHAACarotenoidsABTSTotal Phenols
(mg g−1 FW)(mg AA 100 g−1 FW)(mmol AA eq. 100 g−1 DW)(mg g−1 FW)(mmol Trolox eq. 100 g−1 DW)(mg gallic acid eq. g−1 DW)
Cultivar (C)
Ballerina1.49 ± 0.02145.9 ± 7.263.77 ± 0.280.34 ± 0.0127.30 ± 0.663.64 ± 0.14
Canasta1.22 ± 0.0384.45 ± 15.37.40 ± 0.260.34 ± 0.0024.67 ± 0.784.98 ± 0.20
t-test*********nsns***
Biostimulant (B)
Control1.40 ± 0.0581.86 ± 24.6 d5.35 ± 0.73 c0.33 ± 0.00 b27.86 ± 1.31 a4.85 ± 0.68
F1.33 ± 0.09123.7 ± 37.1 c4.75 ± 0.71 c0.32 ± 0.01 b24.92 ± 2.47 b4.18 ± 0.24
T11.38 ± 0.1086.02 ± 16.8 d4.83 ± 0.98 c0.39 ± 0.03 a24.71 ± 1.20 b4.48 ± 0.27
T21.32 ± 0.0586.42 ± 17.8 d6.41 ± 1.18 b0.34 ± 0.00 b27.36 ± 0.91 a4.07 ± 0.50
T1 + F1.34 ± 0.05164.3 ± 12.2 a5.00 ± 0.88 c0.33 ± 0.00 b24.25 ± 0.34 b3.73 ± 0.28
T2 + F1.33 ± 0.06148.9 ± 6.39 b7.16 ± 0.55 a0.34 ± 0.00 b26.79 ± 0.31 a4.54 ± 0.27
ns************ns
C × B
Ballerina × Control1.48 ± 0.03136.6 ± 4.69 bcd3.83 ± 0.57 c0.33 ± 0.00 b30.54 ± 1.12 a3.52 ± 0.48
Ballerina × F1.52 ± 0.02206.5 ± 3.11 a3.23 ± 0.47 cd0.30 ± 0.00 c30.29 ± 1.32 a4.00 ± 0.40
Ballerina × T11.59 ± 0.00121.8 ± 8.29 d2.68 ± 0.08 d0.44 ± 0.02 a27.19 ± 0.64 bc3.90 ± 0.12
Ballerina × T21.44 ± 0.02125.3 ± 8.10 cd3.80 ± 0.16 c0.34 ± 0.01 b25.54 ± 0.66 cde3.10 ± 0.23
Ballerina × T1 + F1.45 ± 0.02139.3 ± 8.60 bcd3.12 ± 0.34 cd0.32 ± 0.00 bc23.81 ± 0.52 ef3.25 ± 0.22
Ballerina × T2 + F1.43 ± 0.03146.2 ± 7.03 bc5.97 ± 0.22 b0.33 ± 0.00 b26.43 ± 0.52 cd4.04 ± 0.21
Canasta × Control1.32 ± 0.0827.09 ± 2.06 f6.88 ± 0.22 b0.34 ± 0.01 b25.19 ± 0.45 cde6.18 ± 0.55
Canasta × F1.13 ± 0.0741.02 ± 4.83 ef6.27 ± 0.15 b0.35 ± 0.01 b19.56 ± 0.18 g4.35 ± 0.32
Canasta × T11.18 ± 0.0450.22 ± 7.49 e6.97 ± 0.40 b0.34 ± 0.01 b22.24 ± 0.79 f5.06 ± 0.12
Canasta × T21.20 ± 0.0247.52 ± 1.32 ef9.02 ± 0.38 a0.34 ± 0.01 b29.18 ± 0.60 ab5.05 ± 0.53
Canasta × T1 + F1.24 ± 0.06189.3 ± 7.01 a6.88 ± 0.44 b0.34 ± 0.01 b24.70 ± 0.33 de4.20 ± 0.32
Canasta× T2 + F1.24 ± 0.08151.6 ± 12.2 b8.36 ± 0.23 a0.34 ± 0.00 b27.14 ± 0.28 bc5.03 ± 0.27
ns***********ns
All data are expressed as mean ± standard error, n = 3. ns, **, *** non-significant or significant at p ≤ 0.01 and 0.001, respectively. Cultivars means were compared by t-Test. Different letters within each column indicate significant differences according to Duncan’s multiple-range test (p = 0.05). F: foliar treatment (3 mL L−1), T1: nutrient solution treatment 0.15 mL L−1, T2: nutrient solution treatment 0.3 mL L−1.
Publisher’s Note: MDPI stays neutral with regard to jurisdictional claims in published maps and institutional affiliations.

