1. Introduction
Hazelnut (
Corylus avellana L.) is the fruit of the hazel tree and belongs to the
Betulaceae family. Due to their organoleptic and nutritional characteristics, hazelnuts are well appreciated worldwide. This fruit is traditionally consumed as a whole nut (raw or roasted) but hazelnut kernels can also be used in bakery products, chocolates, dairy products, snacks, and other confectionary products [
1,
2].
Hazelnuts are a good source of proteins, monounsaturated fatty acids (mainly oleic acid), carbohydrates, fibre, minerals, vitamins (such as vitamin E), phytosterols, and also phenolic antioxidants [
3,
4,
5]. Its consumption is associated with several health benefits such as the prevention of cardiovascular diseases for example [
6].
In Portugal, the dried fruit sector is of great importance in the economic sustainability of rural regions, as well as in the fight against social desertification, as it continues to be based on a regional tradition, is represented by family businesses, and is derived from smaller orchards [
7]. In 2018, hazelnut production in Portugal was equal to 240 tons [
8]. According to a study performed by Ferrão et al. [
9], the main hazelnut varieties cultivated in Portugal are Grada de Viseu, Segorbe, Fertile de Coutard, Butler and Negreta, being Tonda de Giffoni one of the most productive varieties.
There are different standards to measure hazelnuts’ quality in terms of dimensions, aspect, and hidden defects [
10]. Furthermore, hazelnut properties vary according to the cultivar [
11]. Knowledge of hazelnuts’ physical and chemical properties is crucial as they are necessary to determine numerous parameters of extreme importance to guarantee the quality of the product. Moreover, the determination of these parameters also leads to the decision regarding what type of care should be given to the product; for example, regarding whether or not it should undergo any transformation before it is made available to the final consumer [
12]. Food acceptability is influenced by different factors including food intrinsic properties such as taste, texture, aroma, and appearance [
13,
14]. According to Lopes et al. [
4], hazelnuts’ quality is not only related to its nutritional and chemical composition but also to some visual aspects such as the absence of broken cores and presentation of a clear and uniform colour. Thus, to guarantee the food quality of the products, it is of utmost importance to ensure that they are handled and stored under proper conditions [
4,
15]. According to their characteristics, the different varieties may be more suitable for industry or fresh consumption. The varieties of Grada de Viseu, Longa de Espanha, Butler, and Segorbe are more appropriate for fresh consumption, while the variety Negreta is more suitable for industry. Conversely, the varieties Tonda de Giffoni and Segorbe are suitable for both industry and fresh consumption [
16]. Despite the importance of this theme, there are still only few studies on the physical and chemical properties of hazelnut varieties grown in Portugal.
Therefore, the aim of this study was to evaluate the physical and chemical properties of different hazelnut varieties cultivated in Portugal.
2. Materials and Methods
2.1. Hazelnut Samples
The hazelnut samples used in this study were from different varieties, namely Tonda de Giffoni, Grada de Viseu, Segorbe, Longa de Espanha, Butler, Gunslebert, and Negreta, collected in Viseu in central Portugal. Three sets of 1 kg of each hazelnut fruit were harvested in 2019 at the maturity state and then stored (whole hazelnut) until the analysis at 5 °C to guarantee the safety and quality of the product.
2.2. Colour Evaluation
The colour was examined using the colourimeter Konica Minolta CR-400 that evaluates the Cartesian coordinates CIE L*, a*, and b *. The L* coordinate quantifies the lightness variation, ranging from 0 (black) to 100 (white). The a* and b* represent chromaticity coordinates, varying from −60 to +60. The coordinate a* changes from red (+a) to green (−a) and the coordinate b* varies from yellow (+b) to blue (−b) [
4,
12,
17]. For this analysis, 30 hazelnuts of each variety were used and measurements of different parts of the shell (2 on the brown shell and 2 on the hilum) and the kernels (2 on the skin and 2 on the inner core) of each variety were recorded. The measurements on the skin were made on the whole surface of the hazelnuts.
2.3. Analysis of Texture
Texture measurements were conducted using the texturometer TA.XT.Plus (Stable Micro Systems, Godalming, Surrey, UK). For these analyses, 30 fruits from each variety were submitted to two independent tests, namely shell crushing and core cutting. Both tests used a 500 N load cell.
The test performed for shell crushing was a measurement of force in compression using a flat P75 probe (diameter of 75 mm) that compressed the sample against the base of the texturometer. The speeds of the pre-test, test, and post-test were 1.0 mm/s in all cases. The distance was 6 mm and the trigger force considered was 0.2 N. From the test performed for shell crushing, was obtained a curve of force (N) versus distance (mm) which allowed calculating the hardness (the value of the force that corresponded to the crushing of the shell).
For the test of cutting the core, the probe used was the Blade Set HDP/BS (Warner- Bratzler). The pre-test and test speeds were 1.0 mm/s, while the post-test speed was 10.0 mm/s. For this test, the distance was 30 mm and the trigger force was 0.15 N. The obtained curve of force vs. distance allowed for the calculation of two textural properties: hardness (force at first peak) and friability (distance to first peak). Hardness was measured both for shell and unshelled hazelnuts, while friability was only measured for the core.
2.4. Density Evaluation
Density was assessed as described by Guiné et al. [
12] and two types of density were measured: the true density and the apparent density. To assess the apparent density, two samples of 100 g of hazelnuts were weighted: one with the shell and one without the shell. Then, they were placed in two separate beakers: one with a capacity of 500 mL (for the shelled hazelnuts) and the other with a capacity of 250 mL (for the hazelnut kernels) in order to determine the apparent density of both samples. The apparent density was calculated by dividing the mass by the volume measured. In the case of true density, 250 mL of water was placed in two 500 mL beakers. To one beaker, 100 g of hazelnuts with the shells were added, while to the other beaker, 100 g of hazelnuts without the shell were added. In both cases, the initial volume and final volume was measured. The true density was calculated as the ratio between the mass and the differences observed in the volume. All the measurements were conducted in triplicates for each of the hazelnut samples.
2.5. Biometric Evaluation
For the biometric analysis, 50 hazelnuts of each variety were used and the measurements were performed using a calliper rule with a precision scale. The analyses were conducted for the whole fruit and for the corresponding kernels, and the numbers of hollow fruits were also registered.
Different biometric parameters were evaluated, namely width (wider equatorial zone), height (distance between centres), and thickness (narrow equatorial zone perpendicular to the latter). These parameters were evaluated for the whole hazelnuts and the kernels [
18]. With the values obtained, it was possible to calculate the shape ratio and compression ratio as follows [
4]:
The kernel percentage was calculated as (kernel weight/nut weight)
100 [
19].
2.6. Chemical Analyses
To perform the chemical analyses regarding moisture, protein (% Nx5.23), fat, fibre, and ash, standard procedures were followed completely [
20] and only the kernels were analysed after the milling and homogenization of the varieties were evaluated. The procedure was conducted in fresh hazelnuts.
Water activity was determined at a constant temperature using the Hygroscope Rotronic. The Rancimat method for oils and fats is an accelerated aging test and was used to evaluate the oxidation stability of hazelnut fat. [
21]. This method was performed using the Rancimat equipment model 743, Metrohm from Herisau/Switzerland.
2.7. Specific Extinction Coefficients Analysis
The analysis of primary and secondary oxidation of the fat extracted from hazelnut kernels was evaluated using a spectrophotometer (T80 uv-vis spectrophotometer, PG instruments Ltd., Lutterworth, UK) and according to the procedure described at the Annex IV of the Regulation (EU) 2015/1833 [
22]. For the determination of the spectrophotometric indices, each sample of hazelnut fat (0.6 g) was placed in a 10 mL flask and filled up to 10 mL with isooctane as this the stock solution. Then, two dilutions were made from the stock solution: one of 1:20 for the measurement at 232 nm and the other of 1:2 for the measurements at 264 nm, 268 nm, and 272 nm. In all cases, isooctane was added until 10 mL was reached.
The specific extinction coefficients (
K) were calculated as follows:
For each sample, two fat extractions were performed and then the procedure was conducted in duplicates for each extraction.
2.8. Statistical Analysis
The data were analysed using basic descriptive tools such as the mean value and standard deviation of a set of replication measurements. Additionally, one-way ANOVA was used to compare the means of three or more samples and to assess the differences between them using the post-hoc test Tukey HSD (Honestly Significant Difference); this test consists of a multiple comparison process performed in a single step and identifies which means are significantly different from others. The data were further submitted to a discriminant function analysis for the categorical variable VARIETY as the dependent variable and the 43 ratio variables (accounting for all the measured properties) as the independent variables. The analysis was performed using the stepwise method with Mahalanobis distance and the criteria was the probability of F. The tests of equality of co-variance matrices (Box’s M test) and group means were performed to verify the assumptions for the utilization of this analysis.
For all tests, a level of significance of 5% (p < 0.05) was considered and the data analysis was performed with the Statistical Software for Social Sciences (SPSS) software from IBM Inc. (Armonk, NY, USA, version 26).
3. Results and Discussion
3.1. Physical Properties
3.1.1. Biometric Characteristics
Biometric evaluation is important not only to differentiate hazelnuts’ varieties but also to decide their utilization and design for the processing equipment. For example, in the food industry, spherical nuts are preferred because they are easily processed [
23].
Table 1 presents the values obtained for the weight of the shelled hazelnuts and kernels. In terms of the shelled hazelnuts, the fruits of Gunslebert were heavier on average (3.89 ± 0.64 g), while the fruits of Negreta were lighter on average (2.23 ± 0.37 g). In terms of the kernels, Grada de Viseu were considered the heavier fruit (1.70 ± 0.31 g), while Negreta was considered the lightest of all the varieties (1.12 ± 0.24 g). In a study performed by Lopes et al. [
4], it was also found that Negreta appears among the lightest varieties.
It was observed that the differences encountered between some of the varieties were statistically significant (p < 0.05).
Kernel percentage is an important parameter as it identifies which part is edible [
18]. The results demonstrated that, regarding kernel percentage, the varieties can be grouped into three different groups: the first includes the varieties Grada de Viseu (44.14 ± 6.24%), Gunslebert (44.23 ± 9.07%), Tonda de Giffoni (46.19 ± 4.86%), and Butler (53.16 ± 12.39%); the second includes Segorbe (57.27 ± 9.17%); and the third group includes Negreta (63.91 ± 12.05%) and Longa de Espanha (67.68 ± 10.33). In previous studies [
18,
24,
25], it was found that kernel percentages were lower (< 40.00%) than the values obtained in the present study.
As presented in
Table 2, height varies from 1.39 ± 0.18 cm (Negreta) to 1.76 ± 0.14 cm (Longa de Espanha), with significant differences between some of the varieties (
p < 0.05). It is important to highlight that height and thickness have the same variation profile for each variety.
As for width, values ranged from 1.08 ± 0.12 cm for Negreta to 1.60 ± 0.12 cm for Grada de Viseu, again with significant differences between the varieties (
p < 0.05). Thickness assumed values between 1.00 ± 0.12 cm (Negreta), 1.42 ± 0.09 cm (Tonda de Giffoni), and 1.42 ± 0.15 cm (Grada de Viseu). The variety Gunslebert is one of the smaller and thicker varieties, unlike Tonda de Giffoni that is one of the widest and thickest varieties, which translates into a higher shape ratio (1.04 ± 0.09 cm). As for the compression ratio, all the varieties had values higher than 1 and Butler had the highest compression ratio (1.23 ± 0.13 cm). Although there were significant differences between some varieties in the shape ratio, the same did not occur with the compression ratio to which all the varieties had similar values. According to Lopes et al. [
4], higher values of compression ratio indicate that these fruits are more asymmetric and values close to 1 indicate that these fruits are more rounded in the equatorial zone. Nut size is an important parameter as it provides indication about the kernel size. According to Yao and Mehlenbacher [
26], kernels diameters ranging from 11 to 13 mm are the most suitable for kernel market.
3.1.2. Density
Knowledge about physical properties such as porosity in addition to apparent and true densities are very important in order to project storage facilities [
27]. The mean values of the apparent and true densities with and without the shell are presented in
Table 3. By analysing the results obtained, generally the values of the fruits without the shell were higher than those with the shell, which is expected considering there exists an important amount of void between the shell and the core. The results also demonstrated that for all varieties, true density was higher than the apparent density both for shelled and unshelled hazelnuts which can be explained by the fact that the round form of the elements does not allow a great compaction [
12]. It was also observed that there were statistically significant differences between the values of densities among the samples under study (
p < 0.05). Similar results were obtained in the study performed by Guiné et al. [
12].
3.1.3. Colour
Colour assessment is crucial because it is one of the most important food intrinsic properties affecting consumers’ food choices. In fact, a change in food colour can lead to a rejection by consumers [
28]. In
Table 4, the colour coordinates for the shell, hilum, skin, and kernel of the hazelnuts studied are presented. Regarding the lightness of the shell (L* value), the variety with the highest value was Butler (49.34 ± 2.71) (
Table 4), indicating that the shell of those hazelnuts were clear when compared to the others. Conversely, the blackest varieties were of Grada de Viseu (42.56 ± 3.05) and Negreta (45.29 ± 2.04). As for the values of a* on the shell, it was observed that for all varieties, the predominant colour was red with two distinct groups: one with a greater intensity of red (varieties Tonda de Giffoni, Negreta, Grada de Viseu, Butler, and Longa de Espanha) and the other with a lesser intensity (varieties Butler and Segorbe). In the case of the yellowness of the shell (b*), there were more differences found among the varieties and Butler had the highest value (31.77 ± 2.01).
As presented in
Table 4, the hilum had lower values for a* when compared to the shell, indicating that the hilum is less red. In general, there were no differences among the varieties regarding the values of L* with the exception of Tonda de Giffoni that was clearer when compared to the others. As for the values of a* on the hilum, the variety with the highest value was Butler (12.59 ± 1.66), followed by Grada de Viseu (10.60 ± 1.35). Regarding the coordinate b*, it was also possible to distinguish two varieties, namely Grada de Viseu with the lowest value (18.59 ± 3.38) and Butler with the highest (24.71 ± 2.39).
Regarding the skin (
Table 4), Grada de Viseu was the variety with blackest skin (43.75 ± 4.08) and both Tonda de Giffoni and Butler were the varieties with the lightest skin (50.21 ± 5.07 and 49.84 ± 3.62, respectively). Regarding the a* coordinate, the values ranged between 14.40 ± 1.32 (Tonda de Giffoni) and 17.08 ± 1.30 (Butler). The ANOVA test did not show significant differences among the samples for the coordinate b* (
p = 0.418).
As presented in
Table 4, the values of the coordinates L* and a* of the kernel are highly different from those of the shell and the skin. L* presented higher values (between 64.94 ± 6.48 and 77.50 ± 4.04 for Longa de Espanha and Negreta, respectively), indicating that the hazelnut kernels are whiter. For all samples, the values of a* were lower than the ones obtained for the shell, hilum, and skin, indicating that in the kernel, the red colour is less intense. The highest value was 3.82 ± 1.78 for the Longa de Espanha sample. The values of b* were all positive, indicating the presence of the yellow colour. Guiné et al. [
29] reported a value for b* equal to 31.57, thus indicating that the kernels they studied were slightly more yellow than those in the present study. In another study by Mexis and Kontominas [
30], colour parameters were found for hazelnuts of 30.45 for lightness (L*), 6.84 for redness (a*), and 8.70 for yellowness (b*), notably values that are considerably lower than those found in the present study. Lopes et al. [
4] also evaluated the colour of the varieties present in this study with the exception of Longa de Espanha and observed different values than those presented in
Table 4. These differences are perhaps due to the fact that hazelnuts’ properties are dependent on the year and place of harvest, among other factors [
31].
3.1.4. Texture Characteristics
The textural characteristics evaluated were hardness and friability. Hardness is related to the mechanical strength necessary to cause the crushing of a product [
3] that in the case of hazelnuts is linked to the mechanical strength necessary to crush the outer shell, an important consideration as it ensures the physical integrity of the product, as well as ensures its ability to support the mechanical stress involved in the process of packing and transportation. However, if hardness is too high, it may represent a difficulty for industrial workers who need to remove the shell to process the hazelnuts’ kernels. The friability measures the tendency of the products to fracture [
32,
33].
Table 5 presents the mean values obtained for the hazelnuts’ textural properties. The results demonstrated that the hardness of the shell varied considerably according to variety, with Grada de Viseu having a very high value of hardness (389.91 ± 94.31 N) and Longa de Espanha having a lower value (82.56 ± 22.22 N). The hardness of the core also exhibited very high variability from 11.94 ± 3.20 N (Segorbe) to 79.00 ± 32.17 N (Gunslebert). The different values between the samples indicates that the forces necessary to cause the crushing of the kernel and to perform the hazelnut cut are dependent on the variety. In a study performed by Ghirardello et al. [
34], it was found that the rupture force for hazelnut kernels was 91.83 ± 20.91 N, indicating that those hazelnut fruits were harder than the samples evaluated in this study. Thus, these results could be very important for producers and the food industry sector.
Regarding the friability of the core (
Table 5), fruits of the varieties Segorbe, Longa de Espanha, and Butler were less susceptible to fracture (supporting a higher crushing distance before fracture: 11.21 ± 2.75 mm, 10.50 ± 2.70 mm, and 11.09 ± 3.13 mm, respectively), while the variety Tonda de Giffoni exhibited the lowest value of friability and therefore can be fractured more easily (4.42 ± 1.25 mm). This could be also important when the main objective of producers and the food industry is to maintain the whole core.
3.2. Chemical Properties
The results obtained for the chemical analyses of the hazelnuts’ fruits under study are presented in
Table 6. Moisture content varied from 4.77 ± 0.27 g/100 g (Negreta) to 9.78 ± 1.32 g/100 g (Longa de Espanha). According to Silva et al. [
35], hazelnut moisture content in the natural state is about 4% to 6%. As can be observed, some of the analysed samples presented values higher than the above-mentioned limit that can compromise the storage time and quality of the fruits. The ANOVA test showed statistically significant differences among the varieties (
p < 0.05) and this could be due to the intrinsic differences among the varieties, among drying conditions, and handling techniques.
The water activity values ranged from 0.59 ± 0.01 (Negreta sample) to 0.80 ± 0.01 and 0.80 ± 0.03 (Butler and Segorbe samples, respectively). It is considered that the limit for fungal activity corresponds to a value of water activity equal to 0.62, indicating that with higher values, all microbial activity ceases [
36]. Nevertheless, in the evaluated samples, that upper limit was exceeded and therefore some samples might be more susceptible to microbial or mould deterioration.
It is important to highlight that fat was the major component for all varieties, ranging from 46.04 ± 1.53 (Grada de Viseu) to 72.50 ± 3.79 (Tonda de Giffoni). However, considering the statistical analysis, the only result for fat that was significantly different is the result presented for Grada de Viseu with a low value, indicating that the other varieties presented have a similar fat content. These results are similar to those obtained by Oliveira et al. [
5]. According to previous studies, hazelnut kernel composition is composed of 60% fat, 15% crude proteins, 4% ash, and 4% moisture on average, and these values are not very different from those obtained in the present study (
Table 6) [
5,
37].
The ash, fibre, and protein contents showed significant differences between samples (
p < 0.05). Ash was highest for the Gunslebert sample (3.80 ± 0.23 g/100 g) and lowest for the Tonda de Giffoni sample (2.45 ± 0.18 g/100 g). Oliveira et al. [
5] found higher values of ash for hazelnuts in the range of 4.2–5.2 g/100 g. Moreover, the results illustrated that there are three different groups in terms of the ash content: the first is for the varieties Tonda de Giffoni, Grada de Viseu, and Longa de Espanha (2.45 ± 0.18, 2.59 ± 0.14, and 2.61 ± 0.15 g/100 g, respectively); the second for Negreta, Segorbe, and Butler (3.05 ± 0.14, 3.08 ± 0.08, and 3.10 ± 0.05 g/100 g, respectively); and the third for the variety Gunslebert (3.80 ± 0.23 g/100 g). Fibre varied from 5.30 ± 0.46 g/100 g (Negreta) and 5.75 ± 0.41 g/100 g (Gunslebert) to 11.53 ± 0.82 g/100 g (Tonda de Giffoni), 11.11 ± 0.22 g/100 g (Butler), and 10.58 ± 0.77 g/100 g (Grada de Viseu). According to Tunçil [
38], hazelnut is rich in dietary fibre, recognized for its potential to improve bowel function. In his work, the author reported a fibre content value of 17.78 g/100 g for a natural hazelnut, considering this lowered as hazelnuts were roasted. He also reported a very high value of fibre in the hazelnut skin (69.78 g/100 g). Regarding the protein content, it varied from 10.02 ± 0.27 g/100 g (Negreta) to 17.56 ± 0.40 g/100 g (Grada de Viseu). Oliveira et al. [
5] reported values of protein in the range of 14.8–15.7 g/100 g and hence some of the samples evaluated in this work had higher values while others had a lower protein content.
It is very important to assess the oxidation stability of a sample because lipid oxidation is one of the most critical factors that affects the shelf-life and preservation capacity of food products [
12,
39]. The results of the fat oxidation test (Rancimat) presented in
Table 6 demonstrated that the variety with the highest induction time was Tonda de Giffoni (24.21 ± 4.74 h), indicating a higher oxidation stability when compared to the other varieties. Again, there were some statistically significant differences found among the varieties under study.
3.3. Specific Extinction Coefficients
The specific extinction coefficients are used as indicators of oil oxidation, providing information about its quality and preservation state [
40]. The parameter K
232 is indicator of primary oxidation during oxidation processes and it is correlated with the formation of conjugated dienes of polyunsaturated fatty acids [
37,
41,
42,
43,
44]. Conversely, K
270 indicates the level of conjugated trienes that is representative of the secondary oxidation [
45]. Furthermore, the resulting products of the secondary oxidation (aldehydes and ketones) also absorbs at wavelengths of 262, 268, and 274 nm [
46].
Table 7 presents the results for the specific extinction coefficients at 232, 264, and 268 e 272 nm. The values for K
232 varied between 1.66 ± 0.06 (Negreta) and 4.06 ± 0.24 (Segorbe), indicating that Negreta exhibited a lower presence of primary oxidation products than the other hazelnut varieties. Furthermore, significant differences were found among the varieties under study for all the determined parameters. The results also demonstrated that in all cases the values for Segorbe were considered higher and were statistically different from the other samples, indicating that this variety had a higher degree of oxidation that translates into a worse state of conservation. In the study of Pannico et al. [
45], it was stated that K
232 is considered the most important lipid oxidation parameter and that values higher than 2 are attributed to hazelnuts with taste defects, while values above 2.5 are considered rancid. According to Karoui et al. [
47], an inappropriate storage of fruits or incorrect procedures of oil extraction usually correspond to an increase of K
232, while K
270 increases when the oil is not fresh and results are from a previous harvest.
3.4. Discriminant Function Analysis
The discriminant function analysis was performed for variety as dependent variable and considering as independent variables all the properties analysed in the hazelnuts. The results illustrated that only some variables had a significant Wilks’ lambda according to the
p-value of the F test (
p < 0.05): namely L* of the shell, height, width, compression ratio, kernel height, kernel width, kernel thickness, kernel shape ratio, true density of the whole fruit with the shell, true density of the whole fruit without the shell, apparent density of the whole fruit with the shell, apparent density of the whole fruit without the shell, moisture content, ash, fat, fibre, protein, water activity, and specific extinction coefficient at 232 nm (K
232). The variables with a lower value of Wilks’ lambda and therefore those more important for the discriminant analysis were protein (λ = 0.007) and water activity (λ = 0.010). The results for the correlation matrix indicated some very high values of the correlations including three values equal to or higher than 0.990. The results of discriminant function analysis are shown in
Table 8 and they correspond to four functions. The first function with the highest eigenvalue explains 65.2% of variance, followed by F2 explaining 29.1%, which indicates these two functions account for most of the variance explained. Therefore, the other two functions are residual. Nevertheless, all four functions are significant (
p < 0.05). The value of the Wilks’ lambda is considerably lower for F1 that confirms its bet discriminant ability, although F2 also has a very low value of lambda. The canonical correlation coefficients that measure the strength of the association between each function and the dependent variable (VARIETY) are very high for all four functions, although notably highest for F1 and F2 as compared to F3 or F4.
From the 43 independent variables used, only five were considered in the analysis as they had greater discriminant ability (water activity, protein, ash, b*of the shell, and apparent density with the shell). According to the standardized canonical discriminant function coefficients in which the largest absolute values correspond to variables with greater discriminating capacity, variable b*of the shell demonstrated greater discriminant ability in function F1 (4.821) and protein was more discriminating in F2 and F3 (0.874 and 0.863, respectively), while for function F4 the most discriminating variable is ash (1.079).
The results of the structure matrix (
Table 9) show that the greater discriminant ability in functions F1 and F3 is provided by the variable of apparent density with the shell (0.199 and 0.546, respectively), while in F2 it is provided by the variable of protein (0.680) and in F4 it is provided by the variable of ash (0.986).
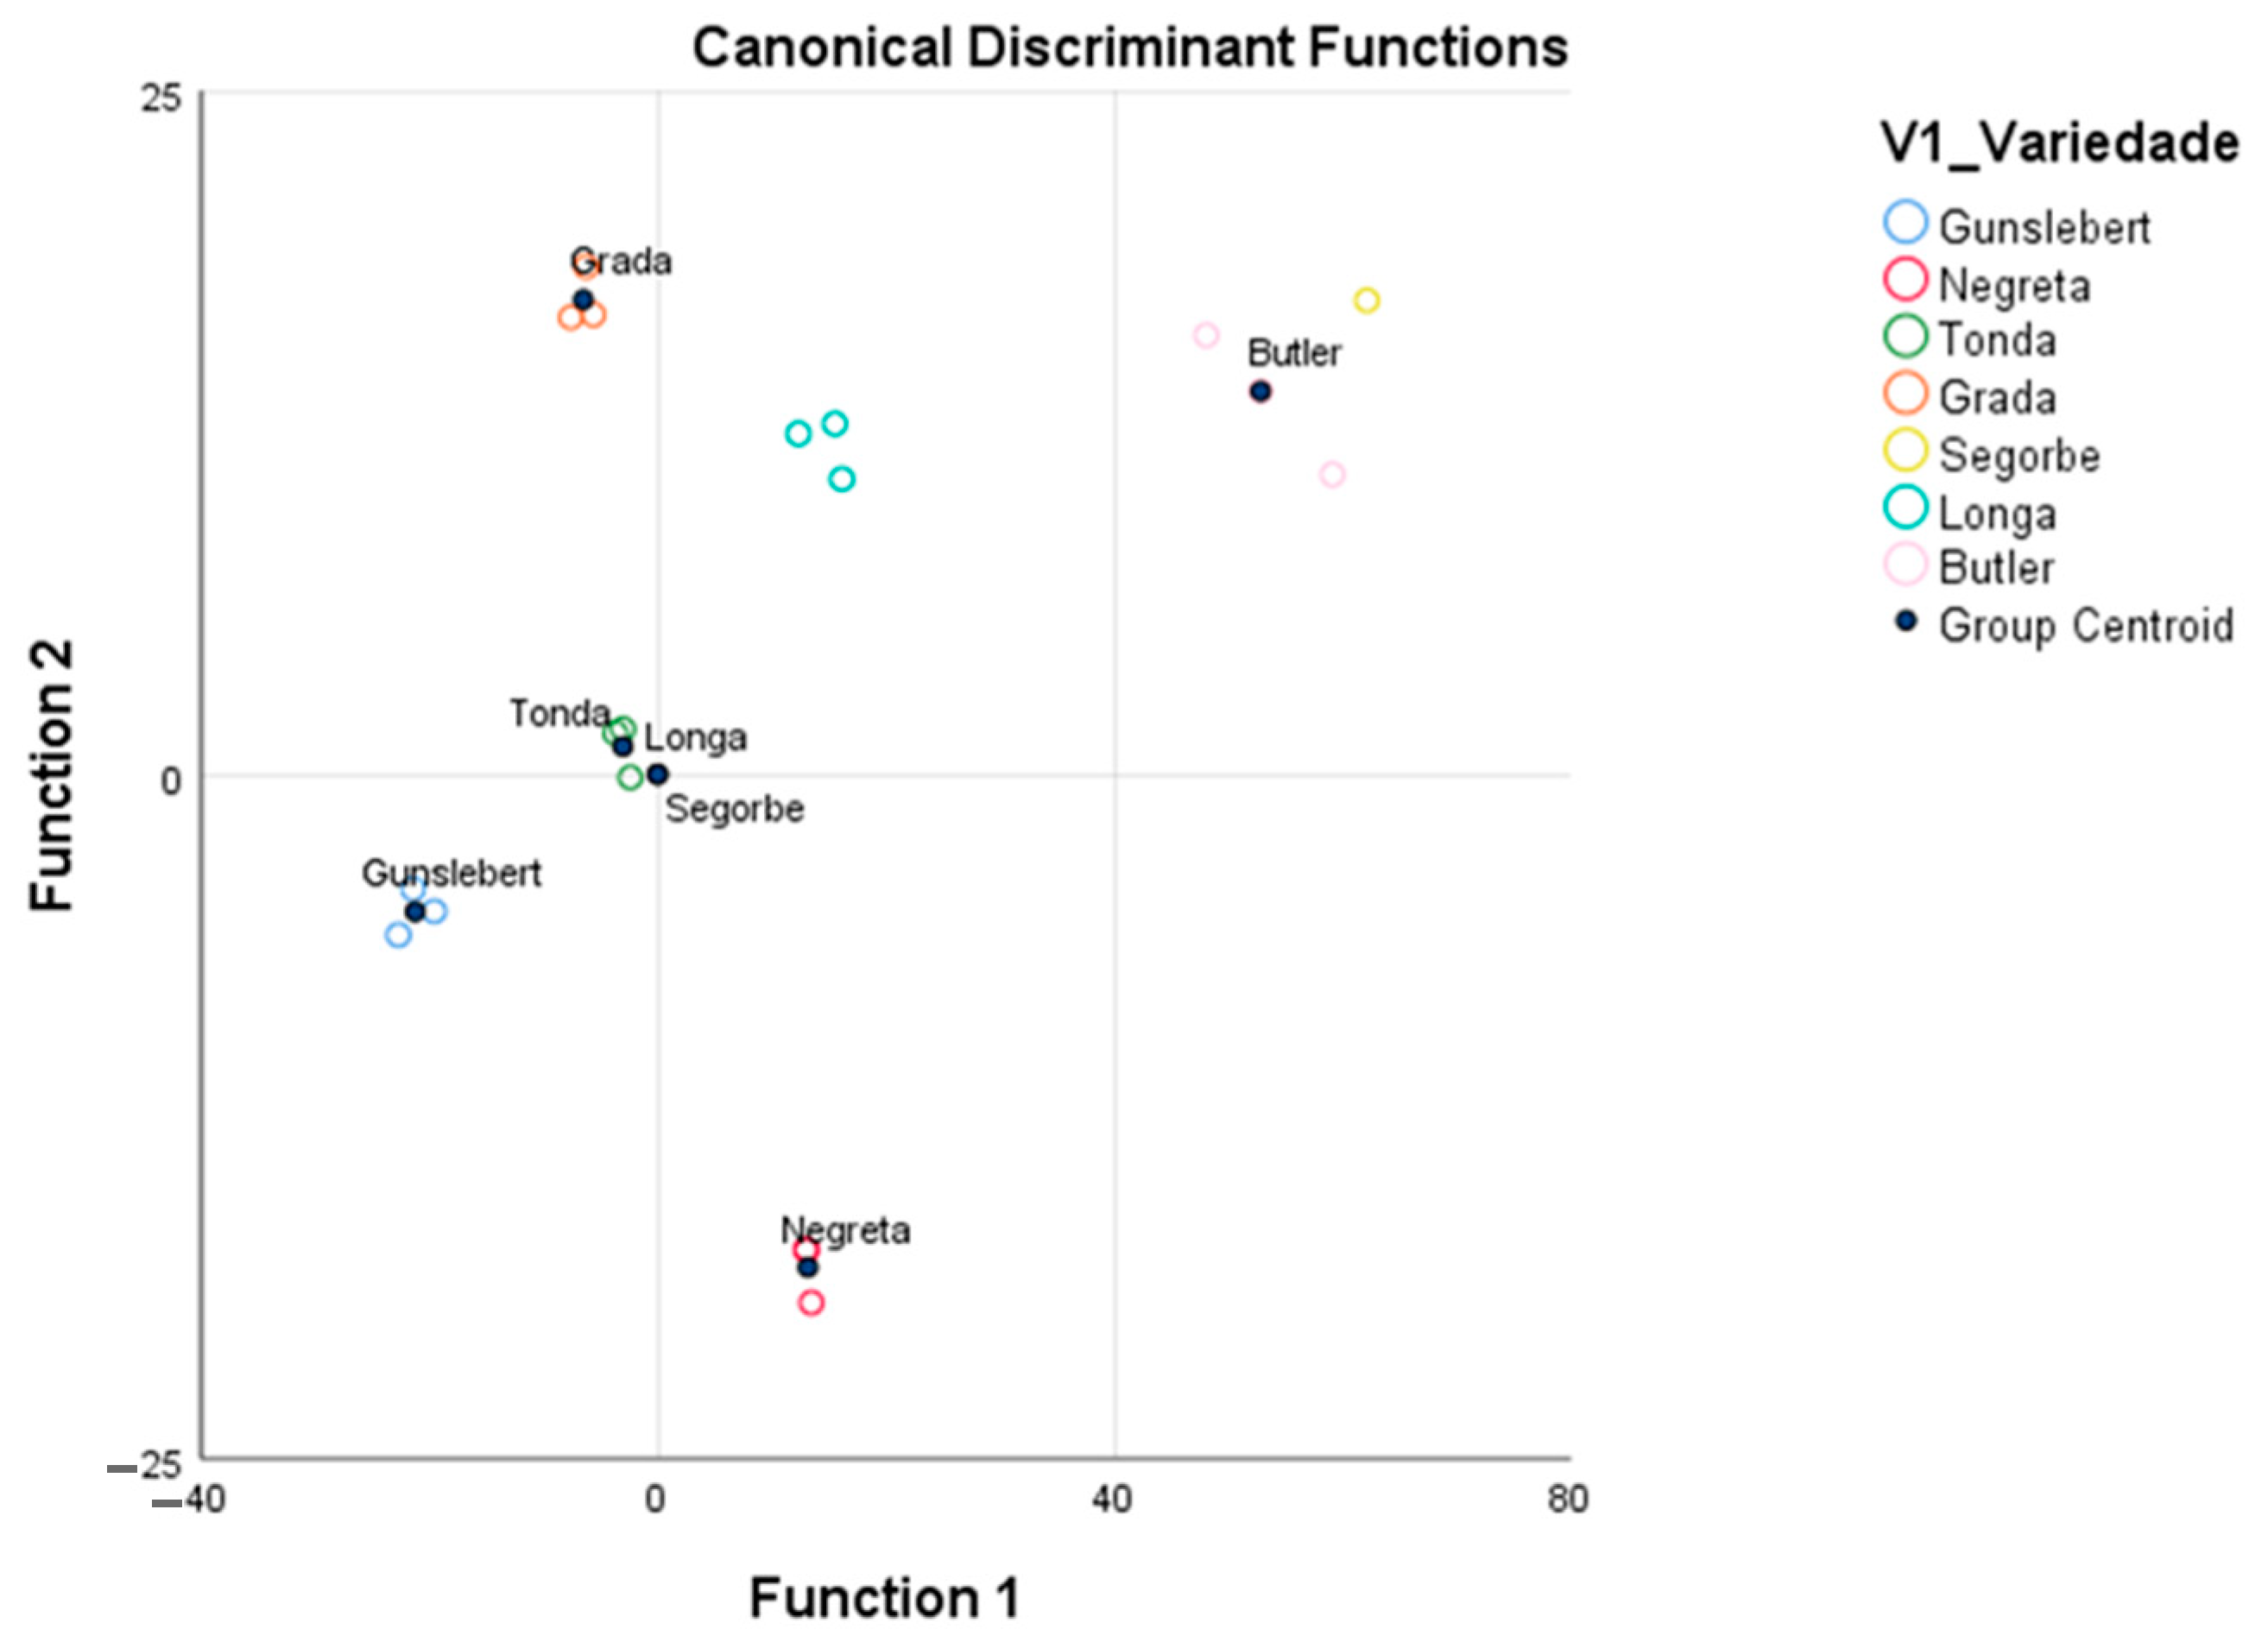
Figure 1 shows the distribution of the different variety groups according to the most relevant discriminant functions (F1 and F2). These results indicate that varieties Tonda de Giffoni, Longa de Espanha, and Segorbe are more similar considering the proximity of their centroids, while varieties Gunslebert, Negreta, Grada de Viseu, and Butler are different from all others.
The model includes four equations built on the basis of the canonical discriminant function coefficients as follows:
where
aw is water activity,
Prt is protein,
DaS is the apparent density with the shell, and
bS is the b* of the shell.
4. Conclusions
This study provided results that allowed for the comparison different hazelnut varieties. Regarding the biometric characteristics, it was concluded that Gunslebert had the heavier fruits while Grada de Viseu had the heavier kernels. In addition, Gunslebert was more elongated and Butler was more rounded in the equatorial zone. For all varieties, the apparent density was lower than the true density.
The results also established the expectable ranges for each colour parameters in the shell, hilum, skin, and kernel, with Butler exhibiting a clearer shell and Tonda de Giffoni exhibiting a clearer hilum and skin. In contrast, Negreta exhibited a clearer kernel. As for texture, Grada de Viseu had a harder shell while Gunslebert had a harder core. Additionally, varieties Segorbe, Longa de Espanha, and Butler were more resistant to fracture.
Regarding the chemical properties, as expected, the major component was fat, followed by protein, and then fibre. Very different values were found for the chemical components according to variety. Negreta exhibited the lowest amount of primary oxidation products, corresponding to a lower K232 value. The values of moisture content were over the recommended values in some cases (varieties Grada de Viseu, Segorbe, Longa de Espanha, and Butler) and the desirable values for water activity were surpassed in some samples (Grada de Viseu, Tonda de Giffoni, Segorbe, Longa de Espanha, and Butler). This indicates that these varieties are more susceptible to mould and microbial deterioration that represents a problem in the hazelnuts’ conservation and storage.
The discriminant analysis illustrated that the variables of protein and water activity were the most important parameters. The distribution of the different variety groups according to the most relevant discriminant functions revealed that varieties Tonda de Giffoni, Longa de Espanha, and Segorbe were more similar, while varieties Gunslebert, Negreta, Grada de Viseu, and Butler were different from all others.
These findings are important for Portuguese producers, retailers, and industry sectors because they are useful to better understand the characteristics of different hazelnuts’ varieties, they can be a tool to facilitate the choices for all players in the hazelnut sector, and they can provide context in view of the particular future usages intended for hazelnuts.
Author Contributions
Conceptualization, P.M.R.C. and R.P.F.G.; methodology, P.M.R.C. and R.P.F.G.; validation, P.M.R.C., R.P.F.G. and A.C.F.; formal analysis, A.C.F., E.R., C.R., H.M., R.G. and R.P.F.G.; investigation, A.C.F., C.R., H.M. and R.G.; resources, P.M.R.C. and A.L.; data curation, P.M.R.C., R.P.F.G. and A.C.F.; writing—original draft preparation, A.C.F. and R.P.F.G.; writing—review and editing, P.M.R.C. and R.P.F.G.; supervision, P.M.R.C.; project administration, P.M.R.C.; funding acquisition, P.M.R.C. All authors have read and agreed to the published version of the manuscript.
Funding
This study was supported by the National Funds through the FCT-Foundation for Science and Technology, I.P., within the scope of the projects Refª UIDB/00681/2020 and UID/AGR/00690/2019.
Institutional Review Board Statement
Not applicable.
Informed Consent Statement
Not applicable.
Data Availability Statement
The data are available from the corresponding author upon request.
Acknowledgments
The authors would like to thank the CERNAS Research Centre, the Polytechnic Institute of Viseu, and the CIMO (Instituto Politécnico de Bragança) for their support. Thanks also to PDR2020 Program through project ValNuts (PDR2020-101-030759 and PDR2020-101-030756).
Conflicts of Interest
The authors declare no conflict of interest.
References
- Petriccione, M.; Ciarmiello, L.F.; Boccacci, P.; De Luca, A.; Piccirillo, P. Evaluation of ‘Tonda Di Giffoni’ Hazelnut (Corylus avellana L.). Clones. Sci. Hortic. 2010, 124, 153–158. [Google Scholar] [CrossRef]
- Ramalhosa, E.; Delgado, T.; Estevinho, L.; Pereira, J.A. Chapter 73—Hazelnut (Corylus avellana L.) Cultivars and Antimicrobial Activity. In Nuts and Seeds in Health and Disease Prevention; Preedy, V.R., Watson, R.R., Patel, V.B., Eds.; Academic Press: San Diego, CA, USA, 2011; pp. 627–636. ISBN 978-0-12-375688-6. [Google Scholar]
- Guiné, R.P.F.; Almeida, C.F.F.; Correia, P.M.R.; Mendes, M. Modelling the Influence of Origin, Packing and Storage on Water Activity, Colour and Texture of Almonds, Hazelnuts and Walnuts Using Artificial Neural Networks. Food Bioprocess Technol. 2015, 8, 1113–1125. [Google Scholar] [CrossRef] [Green Version]
- Lopes, A.; Matos, A.; Guiné, R. Evaluation of morphological and physical characteristics of hazelnut varieties. Millenium-J. Educ. Technol. Health 2016, 13–24. [Google Scholar] [CrossRef] [Green Version]
- Oliveira, I.; Sousa, A.; Morais, J.S.; Ferreira, I.C.F.R.; Bento, A.; Estevinho, L.; Pereira, J.A. Chemical Composition, and Antioxidant and Antimicrobial Activities of Three Hazelnut (Corylus avellana L.) Cultivars. Food Chem. Toxicol. 2008, 46, 1801–1807. [Google Scholar] [CrossRef]
- Perna, S.; Giacosa, A.; Bonitta, G.; Bologna, C.; Isu, A.; Guido, D.; Rondanelli, M. Effects of Hazelnut Consumption on Blood Lipids and Body Weight: A Systematic Review and Bayesian Meta-Analysis. Nutrients 2016, 8, 747. [Google Scholar] [CrossRef]
- Cabo, P.; Ramalhosa, E.; Bento, A. Frutos Secos de Casca Rija Em Portugal: Produção e Mercados; Sociedade de Ciências Agrárias de Portugal: Lisboa, Portugal, 2019; pp. 23–24. [Google Scholar]
- Instituto Nacional de Estatística. Estatísticas Agrícolas: 2018; INE: Lisboa, Portugal, 2019. [Google Scholar]
- Ferrão, A.C.; Guiné, R.; Rodrigues, M.; Droga, R.; Correia, P. Post-Harvest Characterization of the Hazelnut Sector. Rev. Mill. 2020, 6e, 11–20. [Google Scholar] [CrossRef]
- Di Caro, D.; Liguori, C.; Pietrosanto, A.; Sommella, P. Quality Assessment of the Inshell Hazelnuts Based on TD-NMR Analysis. IEEE Trans. Instrum. Meas. 2020, 69, 3770–3779. [Google Scholar] [CrossRef]
- Rovira, M.; Hermoso, J.F.; Romero, A.J. Performance of Hazelnut Cultivars from Oregon, Italy, and Spain, in Northeastern Spain. HortTechnology 2017, 27, 631–638. [Google Scholar] [CrossRef] [Green Version]
- Guiné, R.; Rodrigues, C.; Correia, P.; Ramalhosa, E. Evaluation of Some Physical and Chemical Properties of Hazelnuts. In Proceedings of the FABE 2019: Food and Biosystems Engineering Conference, Crete Island, Greece, 30 May–2 June 2019. [Google Scholar]
- Costell, E.; Tárrega, A.; Bayarri, S. Food Acceptance: The Role of Consumer Perception and Attitudes. Chemosens. Percept. 2009, 3, 42–50. [Google Scholar] [CrossRef] [Green Version]
- Murray, J.M.; Baxter, I.A. SENSORY EVALUATION | Food Acceptability and Sensory Evaluation. In Encyclopedia of Food Sciences and Nutrition, 2nd ed.; Caballero, B., Ed.; Academic Press: Oxford, UK, 2003; pp. 5130–5136. ISBN 978-0-12-227055-0. [Google Scholar]
- Guiné, R.P.F.; Almeida, C.F.F.; Correia, P.M.R. Influence of Packaging and Storage on Some Properties of Hazelnuts. Food Measure 2015, 9, 11–19. [Google Scholar] [CrossRef]
- Silva, A.P.; Santos, F.A.; Santos, A.S.; Sousa, V.; Lopes, A.; Mota, B.S.; Leme, P.; Carvalho, J.; Borges, O.; Ribeiro, R.M.; et al. Variedades de Aveleira; Projecto AGRO 162; 2004. Available online: https://www.drapc.gov.pt/base/documentos/variedades_aveleira.pdf (accessed on 22 July 2021).
- Gómez-Polo, C.; Muñoz, M.P.; Lorenzo Luengo, M.C.; Vicente, P.; Galindo, P.; Martín Casado, A.M. Comparison of the CIELab and CIEDE2000 Color Difference Formulas. J. Prosthet. Dent. 2016, 115, 65–70. [Google Scholar] [CrossRef]
- Correia, P.; Rodrigues, C.; Filipe, A.; Guiné, R. Evaluation of the Biometric Characteristics of Hazelnuts. In Proceedings of the FABE 2019: Food and Biosystems Engineering Conference, Crete Island, Greece, 30 May–2 June 2019. [Google Scholar]
- Ozturk, S.C.; Ozturk, S.E.; Celik, I.; Stampar, F.; Veberic, R.; Doganlar, S.; Solar, A.; Frary, A. Molecular Genetic Diversity and Association Mapping of Nut and Kernel Traits in Slovenian Hazelnut (Corylus avellana) Germplasm. Tree Genet. Genomes 2017, 13, 16. [Google Scholar] [CrossRef]
- AOAC. Official Methods of Analysis of AOAC International; Association of Official Analytical Chemists: Rockville, MD, USA, 2019. [Google Scholar]
- Metrohm, A.G. Oxidation Stability of Oils and Fats-Rancimat Method; Application Bulletin 204/2 e; Metrohm International: Herisau, Switzerland, 2018. [Google Scholar]
- Regulation (EU) 2015/1833. Characteristics of Olive Oil and Olive-Residue Oil and on the Relevant Methods of Analysis; European Union: Brussels, Belgium, 2015. [Google Scholar]
- Król, K.; Gantner, M.; Piotrowska, A. Morphological Traits, Kernel Composition and Sensory Evaluation of Hazelnut (Corylus avellana L.) Cultivars Grown in Poland. Agronomy 2019, 9, 703. [Google Scholar] [CrossRef] [Green Version]
- Miletić, R.; Žikić, M.; Mitić, N.; Nikolić, R. Pomological Characteristics of Superior Selections of European Filbert-C. Avellana L.- and Turkish Hazel-C. Colurna L.-. Genetika 2005, 37, 103–111. [Google Scholar] [CrossRef]
- Mohammadzedeh, M.; Fattahi, R.; Zamani, Z.; Khadivi-Khub, A. Genetic Identity and Relationships of Hazelnut (Corylus avellana L.) Landraces as Revealed by Morphological Characteristics and Molecular Markers. Sci. Hortic. 2014, 167, 17–26. [Google Scholar] [CrossRef]
- Yao, Q.; Mehlenbacher, S. Distribution of Quantitative Traits in Hazelnut Progenies. Acta Hortic. 2001, 143–162. [Google Scholar] [CrossRef]
- Altuntas, E.; Erkol, M. Physical Properties of Shelled and Kernel Walnuts as Affected by the Moisture Content. Czech. J. Food Sci. 2010, 28, 547–556. [Google Scholar] [CrossRef] [Green Version]
- Spence, C. On the Psychological Impact of Food Colour. Flavour 2015, 4, 21. [Google Scholar] [CrossRef] [Green Version]
- Guiné, R.; Almeida, C.; Correia, P. Properties of Hazelnut as Influenced by Packaging and Storage. In Proceedings of the 9th Baltic Conference on Food Science and Technology, Jelgava, Latcia, 8–9 May 2014; p. 142. [Google Scholar]
- Mexis, S.F.; Kontominas, M.G. Effect of γ-Irradiation on the Physicochemical and Sensory Properties of Hazelnuts (Corylus avellana L.). Radiat. Phys. Chem. 2009, 78, 407–413. [Google Scholar] [CrossRef]
- Barreira, J.C.M.; Casal, S.; Ferreira, I.C.F.R.; Peres, A.M.; Pereira, J.A.; Oliveira, M.B.P.P. Chemical Characterization of Chestnut Cultivars from Three Consecutive Years: Chemometrics and Contribution for Authentication. Food Chem. Toxicol. 2012, 50, 2311–2317. [Google Scholar] [CrossRef] [Green Version]
- Almeida, C. Efeitos Das Condições de Conservação Nas Características de Frutos Secos. Trabalho de Estágio; Escola Superior Agrária de Viseu: Viseu, Portugal, 2013. [Google Scholar]
- Gharibzahedi, S.M.T.; Mousavi, S.M.; Hamedi, M.; Khodaiyan, F. Comparative Analysis of New Persian Walnut Cultivars: Nut/Kernel Geometrical, Gravimetrical, Frictional and Mechanical Attributes and Kernel Chemical Composition. Sci. Hortic. 2012, 135, 202–209. [Google Scholar] [CrossRef]
- Ghirardello, D.; Zeppa, G.; Rolle, L.; Gerbi, V.; Contessa, C.; Valentini, N.; Botta, R.; Griseri, G. Effect of Different Storage Conditions on Hazelnut Quality. Acta Hortic. 2014, 1052, 315–318. [Google Scholar] [CrossRef]
- Silva, A.P.; Santos, F.A.; Santos, A.S.; Lopes, A.; Assunção, A.; Carvalho, J.; Borges, O.; Ribeiro, R.M.; Fernandes, S.T.; Santos, T. A Avelã Na Sua Alimentação; O Incremento da Produtividade da Aveleira em Portugal; João Azevedo Editor: Mirandela, Portugal, 2003. [Google Scholar]
- Guiné, R.P.F. Unit Operations for the Food Industry. Volume I: Thermal Processing & Nonconventional Technologies; LAP Lambert Academic Publishing: Saarbrücken, Germany, 2013. [Google Scholar]
- Pannico, A.; Cirillo, C.; Giaccone, M.; Scognamiglio, P.; Romano, R.; Caporaso, N.; Sacchi, R.; Basile, B. Fruit Position within the Canopy Affects Kernel Lipid Composition of Hazelnuts. J. Sci. Food Agric. 2017, 97, 4790–4799. [Google Scholar] [CrossRef] [PubMed] [Green Version]
- Tunçil, Y.E. Dietary Fibre Profiles of Turkish Tombul Hazelnut (Corylus avellana L.) and Hazelnut Skin. Food Chem. 2020, 316, 126338. [Google Scholar] [CrossRef]
- Mateos, R.; Uceda, M.; Aguilera, M.P.; Escuderos, M.E.; Beltrán Maza, G. Relationship of Rancimat Method Values at Varying Temperatures for Virgin Olive Oils. Eur. Food Res. Technol. 2006, 223, 246–252. [Google Scholar] [CrossRef]
- Malvis, A.; Šimon, P.; Dubaj, T.; Sládková, A.; Ház, A.; Jablonský, M.; Sekretár, S.; Schmidt, Š.; Kreps, F.; Burčová, Z.; et al. Determination of the Thermal Oxidation Stability and the Kinetic Parameters of Commercial Extra Virgin Olive Oils from Different Varieties. Available online: https://www.hindawi.com/journals/jchem/2019/4567973/ (accessed on 3 February 2021).
- Casal, S.; Malheiro, R.; Sendas, A.; Oliveira, B.P.P.; Pereira, J.A. Olive Oil Stability under Deep-Frying Conditions. Food Chem. Toxicol. 2010, 48, 2972–2979. [Google Scholar] [CrossRef] [PubMed]
- Kıralan, M.; Bayrak, A. Oxidative and Antiradical Stabilities of Two Important Virgin Olive Oils from Ayvalik and Memecik Olive Cultivars in Turkey. Int. J. Food Prop. 2013, 16, 649–657. [Google Scholar] [CrossRef]
- Knezović, Z.; Trgo, M.; Stipišić, A.; Sutlović, D. Impact of metals from the environment on chemical changes in olive oil. In Proceedings of the 15th Ružička Days-Book of Abstracts, Vukovar, Croatia, 11–12 September 2014. [Google Scholar]
- Salek, R.N.; Burešová, I.; Kráčmar, S.; Lorencová, E.; Zálešáková, L.; Dabash, V. Evaluation of Selected Physicochemical Parameters of Extra Virgin Olive Oil Commercialized in the Czech Market and Stored during a Period of 5 Months. Potravin. Slovak J. Food Sci. 2017, 11, 664–672. [Google Scholar] [CrossRef] [Green Version]
- Pannico, A.; Schouten, R.E.; Basile, B.; Woltering, E.J.; Cirillo, C. Non-Destructive Detection of Flawed Hazelnut Kernels and Lipid Oxidation Assessment Using NIR Spectroscopy. J. Food Eng. 2015, 160, 42–48. [Google Scholar] [CrossRef]
- Sinha, N.K. Handbook of Food Products Manufacturing; John Wiley & Sons: Hoboken, NJ, USA, 2007; ISBN 978-0-470-11354-7. [Google Scholar]
- Karoui, I.J.; Ayari, J.; Ghazouani, N.; Abderrabba, M. Physicochemical and Biochemical Characterizations of Some Tunisian Seed Oils. OCL 2020, 27, 29. [Google Scholar] [CrossRef]
| Publisher’s Note: MDPI stays neutral with regard to jurisdictional claims in published maps and institutional affiliations. |
© 2021 by the authors. Licensee MDPI, Basel, Switzerland. This article is an open access article distributed under the terms and conditions of the Creative Commons Attribution (CC BY) license (https://creativecommons.org/licenses/by/4.0/).


 ,
, 

