Article

Lime and Organic Manure Amendment Enhances Crop Productivity of Wheat–Mungbean–T. Aman Cropping Pattern in Acidic Piedmont Soils

by
Mohammad Rafiqul Islam
1,*,
Rounok Jahan
1,
Shihab Uddin
1,
Israt Jahan Harine
1,
Mohammad Anamul Hoque
1,
Sabry Hassan
2,
Mohamed M. Hassan
2 and
Mohammad Anwar Hossain
3,*
1
Department of Soil Science, Bangladesh Agricultural University, Mymensingh 2202, Bangladesh
2
Department of Biology, College of Science, Taif University, P.O. Box 11099, Taif 21944, Saudi Arabia
3
Department of Genetics and Plant Breeding, Bangladesh Agricultural University, Mymensingh 2202, Bangladesh
*
Authors to whom correspondence should be addressed.
Submission received: 14 June 2021 / Revised: 2 August 2021 / Accepted: 5 August 2021 / Published: 11 August 2021

Abstract

:
Soil acidity is a major problem when it comes to improving crop productivity and nutrient uptake. This experiment was therefore conducted at a farmer’s field—Nalitabari Upazila under AEZ 22 (northern and eastern Piedmont plains) to evaluate the effects of lime and organic manure (OM) amendment on crop productivity and nutrient uptake of the wheat–mungbean–T. Aman cropping pattern in acidic soils of northern and eastern Piedmont plains. The experiment was laid out in a randomized complete block design with three replications. There were nine treatments applied, varying doses of lime (dololime at the rate of 1 and 2 t ha−1), OM (cow dung at the rate of 5 t ha−1, poultry manure at the rate of 3 t ha−1) and a lime–OM combination to the first crop; T. Aman and its residual effects were evaluated in the succeeding second crop, wheat, and the third crop, mungbean. Results demonstrate that application of lime and organic manure to soil had significant effects on the first crop. However, the effects of lime and organic manure were more pronounced in the second and third crops. The increase in grain yield over control ranged from 0.24 to 13.44% in BINA dhan7. However, it varied from 10.14 to 54.38% in BARI Gom30 and 40 to 161.67% in BARI Mung6. The straw yields of the crops also followed a similar trend. The N, P, K, and S uptake by grain and straw of T. Aman, wheat, and mungbean were influenced significantly by the combined application of lime and organic manure. Sole or combined application of lime and manure amendment significantly improved nutrient availability and soil quality. Therefore, application of lime in combination with manure can be practiced for uplifting the crop productivity and improving soil quality in acidic Piedmont soils of northern and eastern Piedmont plains.

1. Introduction

Acidic soils have toxic concentrations of A13+, Fe3+, and Mn2+, lower concentrations of P, and low availability of bases, which cause reduction in crop yield [1,2,3]. Legumes are highly affected due to soil acidity. Acidity limits the survival and persistence of nodule bacteria in soil, and the process of nodulation is hampered. Acidic soils (pH < 5.5) affect plant growth directly or indirectly by influencing the availability of plant nutrients, particularly phosphorus, secondary nutrients (Ca, Mg), and micronutrients (Mo, B, and Zn), reducing microbial activity, and creating toxicity of Fe and Mn (Al in some cases) [4]. Soil acidification may intensify and affect crop production if effective management strategies for amelioration are not implemented [5].
The liming materials contain carbonates, oxides, hydroxides, and silicates of Ca and Mg. The most common liming agents are calcite (CaCO3) and dolomite (CaCO3–MgCO3). Liming reactions start with the neutralization of H+ in the soil solution by either OH- or HCO3 originating from the liming materials. Dolomite, which is called dololime, is now commonly used in Bangladesh. Liming is the most economical method for rectifying soil acidity. Lime requirement depends on the soil pH profile, lime quality, soil type, farming system, and rainfall. Proper liming is beneficial for crop growth and development. Lime is a source of calcium and magnesium (if dolomitic limestone is applied). Nutrient solubility is also improved, so plants have a better nutrient supply. Lime also improves soil quality, such as soil pH, P availability, cation exchange capacity (CEC), and base saturation, while lowering Al concentrations [6]. Furthermore, lime can improve the availability of Ca and Mg in soils [7]. The nodulation process of legumes is enhanced, which improves nitrogen fixation. Liming also increases soil pH and changes soil properties, such as pH, OM, and some plant nutrient availability, which is beneficial to sustain high yield [8]. Increases in soil pH caused by proper liming aid in the release of P anions from Al- and Fe-(hydr) oxide surfaces [9]. Because liming enhances microbial activity, it frequently promotes the mineralization of agricultural wastes and organic manure in the soil [10], which can improve soil accessible plant nutrients, particularly P. Liming, on the other hand, may limit soil P availability by causing more P to precipitate as Ca-phosphate at higher pH [11]. Liming can also help with other nutritional shortages (such as N) [12,13]. Rahman et al. [14] conducted field trials with a wheat-rice cropping pattern and found that applying 2.4 t lime ha−1 boosted crop yields adequately.
Optimum crop growth and efficient use of fertilizer in acid soils require an addition of lime and organic matter to obviate the toxic effects of Fe, Al, H, and Mn. Addition of lime and organic matter in soil is needed to attain a soil pH level at which available Fe, Al, or Mn (non-toxic) are present. Regular application of well-decomposed organic matter in acid soils is effective to prevent sudden fluctuation of soil pH as it ameliorates the buffering capacity of soils. Moreover, it increases the availability of P and reduces the toxicity of Fe and Al in acid soils. Poultry manure (PM), cow dung (CD), compost, and lime may be applied to increase crop yield, maintain soil fertility, and ameliorate soil acidity. It is essential to identify the exact amount of manure to increase the soil pH, fertility, and productivity of acidic soils. Integrated use of lime with organic and chemical fertilizers is considered a good approach for sustainable crop production in acidic soils.
Soil organic matter (SOM) is a key ingredient in ensuring long-term soil fertility because it regulates biological activities that affect nutrient availability. Organic amendments, such as CD and PM, serve to preserve soil fertility by acting as alternate sources of plant nutrients to chemical fertilizers, especially in rice production [15,16]. CD and PM improve the physical, chemical, and biological qualities of the soil, increasing nutrient availability [17,18,19].
In acidic soil regions, a combined application of lime and organic manure may be a preferable alternative for boosting soil fertility. In the old Himalayan Piedmont plain (AEZ-1) and northern and eastern Piedmont plains (AEZ-22), Sultana et al. [20] reported that soil amendment with dololime at the rate of 1 t ha−1, combined with poultry manure at the rate of 3 t ha−1 or FYM at the rate of 5 t ha−1, could be an efficient practice to achieve higher crop yield, due to optimization of soil acidity and nutrient uptake by plants (AEZ-22). In Bangladesh, the wheat–mungbean–T. Aman cropping pattern is the most widely used. However, there are insufficient data on the management of acid soils in northern and eastern Piedmont plains. As a result, the objectives of the study are to (i) evaluate the effect of lime and manure amendment on yield of the wheat–mungbean–T. Aman cropping pattern; (ii) assess the influence of lime and manure amendment on nutrient uptake by the grain and straw of crops; and (iii) see the changes in soil properties due to the application of lime and manure amendments. We attempted to figure out an effective management strategy for profitable crop production in the acidic Piedmont soil of Nalitabari Upazila in the northern and eastern Piedmont plains. This research will aid farmers in increasing crop yields in acid-prone locations.

2. Materials and Methods

2.1. Experimental Site and Soil Properties

The experiment was carried out at the farmer’s field of Ramchandrakura Union, Nalitabari Upazila, Sherpur (25°11′ N, 90°15′ E) from July 2017 to May 2018. The experimental site belongs to the agroecological zone, northern and eastern Piedmont plains (AEZ-22). According to general soil type classification, the site falls under grey terrace soil [21,22]. Topographically, the experimental site was medium-high to high. Before starting the experiment, 20 initial composite soil samples (0–15 cm depth) were collected from the experimental plots and analyzed using standard methods. The soil was sandy loam in texture and strongly acidic in nature, with a pH of 4.66, organic C 0.89%, total N 0.12%, available P 6.99 ppm, exchangeable K 22.94 ppm, and available S 1.67 ppm.

2.2. Plant Materials and Treatments

Three crops: T. Aman rice, wheat, and mungbean were grown in the wheat–mungbean–T. Aman cropping pattern under the field experiment. The crop varieties were Binadhan 7 for T. Aman rice, BARI Gom30 for wheat, and BRRI Mung6 for mungbean. T. Aman rice was grown from July to October (mid monsoon to late monsoon) followed by wheat from mid-November to February (winter), and then mungbean was grown from March to May (late winter to pre-monsoon season). There were nine treatments comprising two levels of lime (dololime at the rate of 1 and 2 t ha−1) and two kinds of organic amendment (cow dung and poultry manure). The following treatments were used in the experiment: T1: control (no lime and organic amendment), T2: Lime-1 (dololime 1 t ha−1), T3: Lime-2 (dololime 2 t ha−1), T4: OM-1 (cow dung 5 t ha−1), T5: OM-2 (poultry manure 3 t ha−1), T6: Lime-1 OM-1 (dololime 1 t ha−1, cow dung 5 t ha−1), T7: Lime-1 OM-2 (dololime 1 t ha−1, poultry manure 3 t ha−1), T8: Lime-2 OM-1 (dololime 2 t ha−1, cow dung 5 t ha−1), T9: Lime-2 OM-2 (dololime 2 t ha−1, poultry manure 3 t ha−1). Nutrient compositions and source of the organic manures and dololime used in the study are presented in Table 1.

2.3. Preparation of Experimental Plots and Growing Crops

With a power tiller, the land was prepped by ploughing and cross ploughing. The soil was then laddered using traditional methods. Before final land preparation and laying out, all weeds and stubbles were removed from the field. To limit the heterogenic effects of soil, the experiment was set up in a randomized complete block design (RCBD), with the experimental area separated into three blocks representing the replications. Each block was subdivided into nine plots and the treatments were randomly distributed to the unit plots in each block. Thus, the total number of unit plots was 27. Each plot was 4 × 2.5 m in size and was separated from the others by ails (30 cm). There was a 1 m drain between the blocks (i.e., it separated the blocks from each other). The fertilizers were applied as per treatments following the Bangladesh Agricultural Research Council (BARC) [23] Fertilizer Recommendation Guide (2012). The recommended doses (RDs) of chemical fertilizers were 90 kg N, 10 kg P, 35 kg K, 8 kg S and 1 kg B per ha for T. Aman rice; 120 kg N, 30 kg P, 60 kg K, 15 kg S, and 1.3 kg Zn for wheat; and 18 kg N, 18 kg P, 24 kg K, 12 kg S, 2 kg Zn, and 1.2 kg B for mungbean. The sources of N, P, K, S, and Zn were urea, triple super phosphate, muriate of potash, gypsum, and zinc sulfate, respectively. The full doses of chemical fertilizers were applied in all the treatments, including the control. All of the chemical fertilizers, except urea, were applied during final land preparation. The urea was applied in three equal splits for T. Aman rice and two equal splits for wheat and mungbean, respectively. Dololime, cow dung, and poultry manure were applied before 2 weeks of planting crops and mixed with soil. Lime, cow dung, and poultry manure were applied to the first crop and their residual effects were evaluated in the succeeding second and third crops. Seedlings were grown in a nursery bed and 30–35-day old seedlings were carefully uprooted and transplanted in the plots, maintaining a spacing of 20 × 20 cm in the case of T. Aman rice. Three seedlings were transplanted at each hill. Wheat and mungbean seeds were sown after final land preparation. Intercultural operations, such as irrigation, weeding, and pest control were done when necessary, to ensure and maintain a favorable environment for normal growth and development of the crops.

2.4. Harvesting and Data Recording

The crops were harvested at maturity. An area of 1 m2 was harvested from each plot and the harvested crop was bundled separately. Then the bundles were brought to the threshing floor and threshed. The grain yield was obtained on a 14% moisture basis while the straw yield was recorded on a sun-dry basis. Grain and straw samples were analyzed for total nitrogen concentration following the semi-micro Kjeldahl method [24], phosphorus was determined by the Olsen method [25], potassium was determined by the flame photometer method, and sulfur was determined by the spectrophotometer method.
The N, P, K, S uptake by grain and straw was determined from grain and straw yield data. The nutrient uptake was determined by formula [26]:
N u t r i e n t   u p t a k e = N u t r i e n t   c o n t e n t   ( % ) × D r y   m a s s   p r o d u c t i o n   ( kg / ha ) 100

2.5. Analysis of Soil Samples before and after the Experiment

The initial and post-harvest soil samples were used to determine the properties of the soil, including soil organic matter (SOM) content, soil total nitrogen (STN), available P, exchangeable Ca and Mg, pH, electrical conductivity (EC), and cation exchange capacity (CEC). SOM content was calculated by multiplying organic carbon (OC) by 1.73, as suggested by Ghosh et al. [27] and OC was determined titrimetrically following the Walkley and Black method [28]. STN was determined by the semi-micro Kjeldahl method [24]; available P was extracted from the soil by shaking with 0.03 M NH4F—0.025 M HCl solution at pH < 7.0 following the Bray and Kurtz method [29]. The exchangeable calcium (Ca) and magnesium (Mg) contents were extracted by the ammonium acetate extraction method and determined by ethylene-di-amine tetra acetic [30]. The pH of the samples was assessed in a soil: water ratio of 1:2.5 with a glass electrode pH meter [30]. The EC of collected soil samples was determined electrometrically (1:5 = soil:water ratio) by a conductivity meter using 0.01 M KCl solution to calibrate the meter following the procedure described by Ghosh et al. [27]. CEC was determined by the NH4OAc extraction method, as suggested by Chapman [31].

2.6. Statistical Analysis

The data were analyzed statistically by the F-test and the mean differences were adjudged by Duncan’s new multiple range test (DMRT), as outlined by Gomez and Gomez [32].

3. Results

3.1. Effect of Lime and Organic Manure Amendment on Yield of Wheat–Mungbean–T. Aman Cropping Pattern

3.1.1. Grain and Straw Yield of T. Aman

The grain yield of first crop (Binadhan 7) responded significantly to the application of dololime, cow dung, and poultry manure, although there was a little difference in grain yield among the treatments (p < 0.05) (Table 2). The grain yield ranged from 4.24 to 4.81 t ha−1. The highest grain yield (4.81 t ha−1) was observed in T7 (Lime-1 OM-2, dololime 1 t ha−1, poultry manure 3 t ha−1) and the lowest value (4.24 t ha−1) was recorded in T1 (control). Based on grain yield, the treatments may be ranked in order of T7 > T8 > T5 > T9 > T4 > T3 > T2 > T6 = T1. The increase in grain yield over the control ranged from 0.24 to 13.44% where the highest increase was obtained in T7 (13.44%) and the lowest one was obtained in T6 (0.24%).
Straw yield of Binadhan 7 was also significantly influenced by different treatments under study. The yields of straw ranged from 4.51 to 4.98 t ha−1 (p < 0.05) (Table 2). The highest straw yield of 4.98 t ha−1 was obtained in T8 (Lime-2 OM-1, dololime 2 t ha−1, cow dung 5 t ha−1) and the lowest value of 4.51 t ha−1 was noted in T1 (control). The treatment may be ranked in the order of T8 > T7 >T5 > T4 > T9 > T2 > T3 > T6 > T1 in terms of straw yield. Regarding the % increase of straw yield, maximum increase (10.42%) was noted in T8 and the minimum one (1.55%) was found in T6.

3.1.2. Grain and Straw Yield of Wheat

The grain yield of BARI Gom30 responded significantly to the residual dololime, cow dung and poultry manure (Table 2). The grain yield ranged from 2.17 to 3.35 t ha−1. The highest grain yield (3.35 t ha−1) was observed in T9 (Lime-2 OM-2, dololime 2 t ha−1, poultry manure 3 t ha−1), which was statistically similar to T8 (Lime-2 OM-1, dololime 2 t ha−1, cow dung 5 t ha−1), and T7 (Lime-1 OM-2, dololime 1 t ha−1, poultry manure 3 t ha−1) whereas the lowest value (2.17 t ha−1) was recorded in T1 (control). The increase in grain yield over control ranged from 10.14 to 54.38% where the highest increase was obtained in T9 and the lowest one was obtained with T4. Based on grain yield, the treatments may be ranked in order of T9 > T8 > T7 > T6 > T3 > T2 > T5 > T4 > T1.
Straw yields of BARI Gom30 also responded significantly to the different treatments under study. The yield of straw ranged from 3.11 to 4.79 t ha−1 (Table 2). The highest straw yield of 4.79 t ha−1 was obtained in T9 (Lime-2 OM-2, dololime 2 t ha−1, poultry manure 3 t ha−1) and the lowest value of 3.11 t ha−1 was noted in T1 (control). The treatments may be ranked in the order of T9 > T8 > T7 > T6 > T3 > T2 > T5 > T4 > T1 in terms of straw yield. Regarding the percent increase of straw yield, maximum increase (54.02%) was noted in T9 and the minimum one (9.65%) was found in T4.

3.1.3. Grain and Straw Yield of Mungbean

Residual effect of lime (dololime) and organic manure (cow dung and poultry manure) showed a significant influence on seed yield of BARI Mung6 (Table 2) (p < 0.05). The seed yield ranged from 0.60 t ha−1 to 1.57 t ha−1. The highest seed yield (1.57 t ha−1) was found in T9 (Lime-2 OM-2, dololime 2 t ha−1, poultry manure 3 t ha−1), which was statistically similar with T7 (Lime-1 OM-2, dololime 1 t ha−1, poultry manure 3 t ha−1) and T8 (Lime-2 OM-1, dololime 2 t ha−1, cow dung 5 t ha−1). The lowest value (0.60 t ha−1) was observed in T1 (control). The increase in seed yield over control ranged from 40 to 161.67%, where the highest increase was obtained in T9 and the lowest one was obtained with T4 (Table 2). The results demonstrated that the application of dololime alone or combination with cow dung or poultry manure increased the seed yield of mungbean to a significant extent. The seed yields obtained from different treatments may be ranked in order of T9 > T8 > T7 > T6 > T3 > T2 > T5 > T4 > T1.
Straw yield of BARI Mung6 was also significantly influenced by different treatments under study. The yields of straw ranged from 1.15 to 3.33 t ha−1 (p < 0.05) (Table 2). The highest straw yield of 3.33 t ha−1 was obtained in T9 (Lime-2 OM-2, dololime 2 t ha−1, poultry manure 3 t ha−1) and the lowest value of 1.15 t ha−1 was noted in T1 (control). The treatment may be ranked in the order of T9 > T8 = T7 > T6 > T3 = T2 > T5 = T4 > T1 in terms of straw yield. Regarding the % increase of straw yield, maximum increase (189.57%) was noted in T9 and the minimum one (40.87%) was found in T4.

3.2. Effect of Lime and Organic Manure Amendment on Nutrient Uptake of Wheat–Mungbean–T. Aman Cropping Pattern

Nutrient contents of grain and straw of all three crops were determined as depicted in Supplementary Table S1, and nutrient uptake by crops was calculated. Nutrient uptake by the wheat–mungbean–T. Aman cropping pattern is described as follows.

3.2.1. Nutrient Uptake by T. Aman

The overall uptake of the macronutrients N, P, K, and S by T. Aman was significantly impacted by the use of lime and organic amendments (p < 0.05). The N uptake by grain and straw of T. Aman rice due to application of lime and organic amendment ranged from 42.78 to 58.21 kg ha−1 and 13.97 to 19.74 kg ha−1 (Table 3). Experimental plots that had T8 (Lime-2 OM-1, dololime 2 t ha−1, cow dung 5 t ha−1) treatment took up the highest total N, which was statistically similar to T7 and T9 in case of grain and T7 in case of straw, whereas the lowest value was observed in T1 (control) in both cases (Table 3). The total P uptake ranged from 8.87 to 11.94 kg ha−1 and 5.39 to 10.06 kg ha−1 in grain and straw, respectively. The highest total P uptake was observed in T7 (Lime-1 OM-2, dololime 1 t ha−1, poultry manure 3 t ha−1) and the lowest value in T1 (control) (Table 3). The value of K uptake by T. Aman ranged from 11.01 to 16.92 kg ha−1 and 50.43, and 61.97 kg ha−1 in grain and straw, respectively. The highest K uptake was recorded in T8 (Lime-2 OM-1, dololime 2 t ha−1, cow dung 5 t ha−1), which was similar to T7 and T9, and the lowest value was observed in T1 (Table 3). Likewise, S uptake by grain and straw ranged from 11.44 to 16.53 kg ha−1 and 8.11 to 13.08 kg ha−1, respectively (Table 3).

3.2.2. Nutrient Uptake by Wheat

In the second crop of the cropping pattern, the residual effect of lime and organic manure application on the nutrient uptake was more prominent. The residual effect of lime and organic manure influenced the uptake of N, P, K, and S by grain and straw of wheat significantly (p < 0.05). Total N uptake by wheat ranged from 36.85 to 63.10 kg ha−1 and 10.25 to 21.05 kg ha−1 in grain and straw, respectively. The T9 (Lime-2 OM-2, dololime 2 t ha−1, poultry manure 3 t ha−1) had the highest N uptake by the grain and straw and T1 (control) had the lowest (Table 3). Similarly, T9 (Lime-2 OM-2, dololime 2 t ha−1, poultry manure 3 t ha−1) had the highest P, K, and S uptake while T1 (control) had the lowest (Table 3). The uptake of P, K, and S ranged from 4.55 to 12.00 kg ha−1, 8.68 to 18.37 kg ha−1 and 4.29 to 9.36 kg ha−1 in grain, and 2.08 to 3.93 kg ha−1, 44.17 to 73.71 kg ha−1 and 4.62 to 10.07 kg ha−1 in straw, respectively (Table 3).

3.2.3. Nutrient Uptake by Mungbean

N, P, K, and S uptake by grain and straw of mungbean was significantly influenced by the residual effect of lime and organic manure application (p < 0.05). The N uptake by mungbean grain and straw ranged from 21.77 to 61.67 kg ha−1 and 5.54 to 6.84 kg ha−1, respectively. The highest N uptake by grain and straw was observed in T9 (Lime-2 OM-2, dololime 2 t ha−1, poultry manure 3 t ha−1) and the lowest value was observed in T1 (control) (Table 3). Likewise, the highest P, K, and S uptake by grain and straw were recorded in T9 (Lime-2 OM-2, dololime 2 t ha−1, poultry manure 3 t ha−1) and the lowest value was observed in T1 (control) (Table 3). The uptake of P, K, and S ranged from 2.40 to 9.60, 8.52 to 25.02 and 2.40 to 8.81 kg ha−1 in grain, and 0.48 to 0.96, 3.56 to 4.04 and 0.32 to 0.51 kg ha−1 in straw, respectively (Table 3).

3.3. Effect of Lime and Manure Amendment on Soil Properties under Wheat–Mungbean–T. Aman Cropping Pattern

Application of lime and manure significantly improved soil fertility and soil properties (Table 4). SOM content ranged from 1.54 to 1.63% and 1.31 to 1.56% before and after the experiment, respectively, exhibiting the highest value in T9 (Lime-2 OM-2, dololime 2 t ha−1, poultry manure 3 t ha−1), which was statistically similar to T7 (Lime-1 OM-2, dololime 1 t ha−1, poultry manure 3 t ha−1) and the lowest value in T1 (control) (Table 4). Similarly, STN varied from 0.11 to 0.16% and 0.09 to 0.19% before and after the experiment, respectively (Table 4). STN decreased about 5–20% after the experiment where there was sole application of chemical fertilizer and lime along with chemical fertilizer, whereas STN increased 1 to 15% due to sole application of manure amendment or combined application of lime and manure amendment, along with chemical fertilizers (Table 4). Available P content in soil was 7.05 to 7.96 ppm before the experiment and 6.77 to 11.54 ppm after the experiment. Available P content after the experiment decreased about 4% in the control, whereas sole or combined application of lime and manure amendment increased available P content about 15 to 45% compared to the initial state. The highest increase was observed in T9 (Lime-2 OM-2, dololime 2 t ha−1, poultry manure 3 t ha−1) and the lowest one in T4 (OM-1, cow dung 5 t ha−1) (Table 4). Exchangeable Ca content in soil ranged from 5.20 to 5.55 cmolc/kg and 4.68 to 6.88 cmolc/kg, respectively, before and after the experiment (Table 4). The increase in exchangeable Ca content in soil ranged from −10 to 24% after the experiment compared to their pre-experiment condition exhibiting the highest increase in T9 (Lime-2 OM-2, dololime 2 t ha−1, poultry manure 3 t ha−1) and a decrease in T1 (control) (Table 4).
Exchangeable Mg content ranged from 1.35 to 1.72 cmolc/kg and 1.22 to 2.11 cmolc/kg before and after the experiment, respectively, exhibiting the highest value in T9 (Lime-2 OM-2, dololime 2 t ha−1, poultry manure 3 t ha−1) and the lowest value in T1 (control) (Table 4). The change in exchangeable Mg content in soil ranged from −10 to 23% after the experiment (Table 4). Likewise, pH of the soil varied from 4.66 to 5.34 and 4.10 to 6.69 before and after the experiment, respectively (Table 4). Soil pH increased about −12 to 26% after the experiment due to application of lime and manure amendment along with chemical fertilizers (Table 4). Soil pH decreased when no lime or manure amendment was applied whereas the highest increase was observed in T9 (Lime-2 OM-2, dololime 2 t ha−1, poultry manure 3 t ha−1). EC of the soil was 0.22 to 0.38 dS/m before the experiment and 0.22 to 0.47 dS/m after the experiment. EC of the soil after the experiment increased 2 to 25% compared to the initial state due to application of lime and manure amendment (Table 4). The highest increase was observed in T9 (Lime-2 OM-2, dololime 2 t ha−1, poultry manure 3 t ha−1) and the lowest in T1 (control) (Table 4). CEC of the soil ranged from 34.97 to 38.22 cmolc/kg and 33.14 to 45.86 cmolc/kg, respectively, before and after the experiment (Table 4). The increase in exchangeable Ca content in soil ranged from −6 to 20% after the experiment compared to their pre-experiment condition exhibiting the highest increase in T9 (Lime-2 OM-2, dololime 2 t ha−1, poultry manure 3 t ha−1) and a decrease in T1 (control) (Table 4).

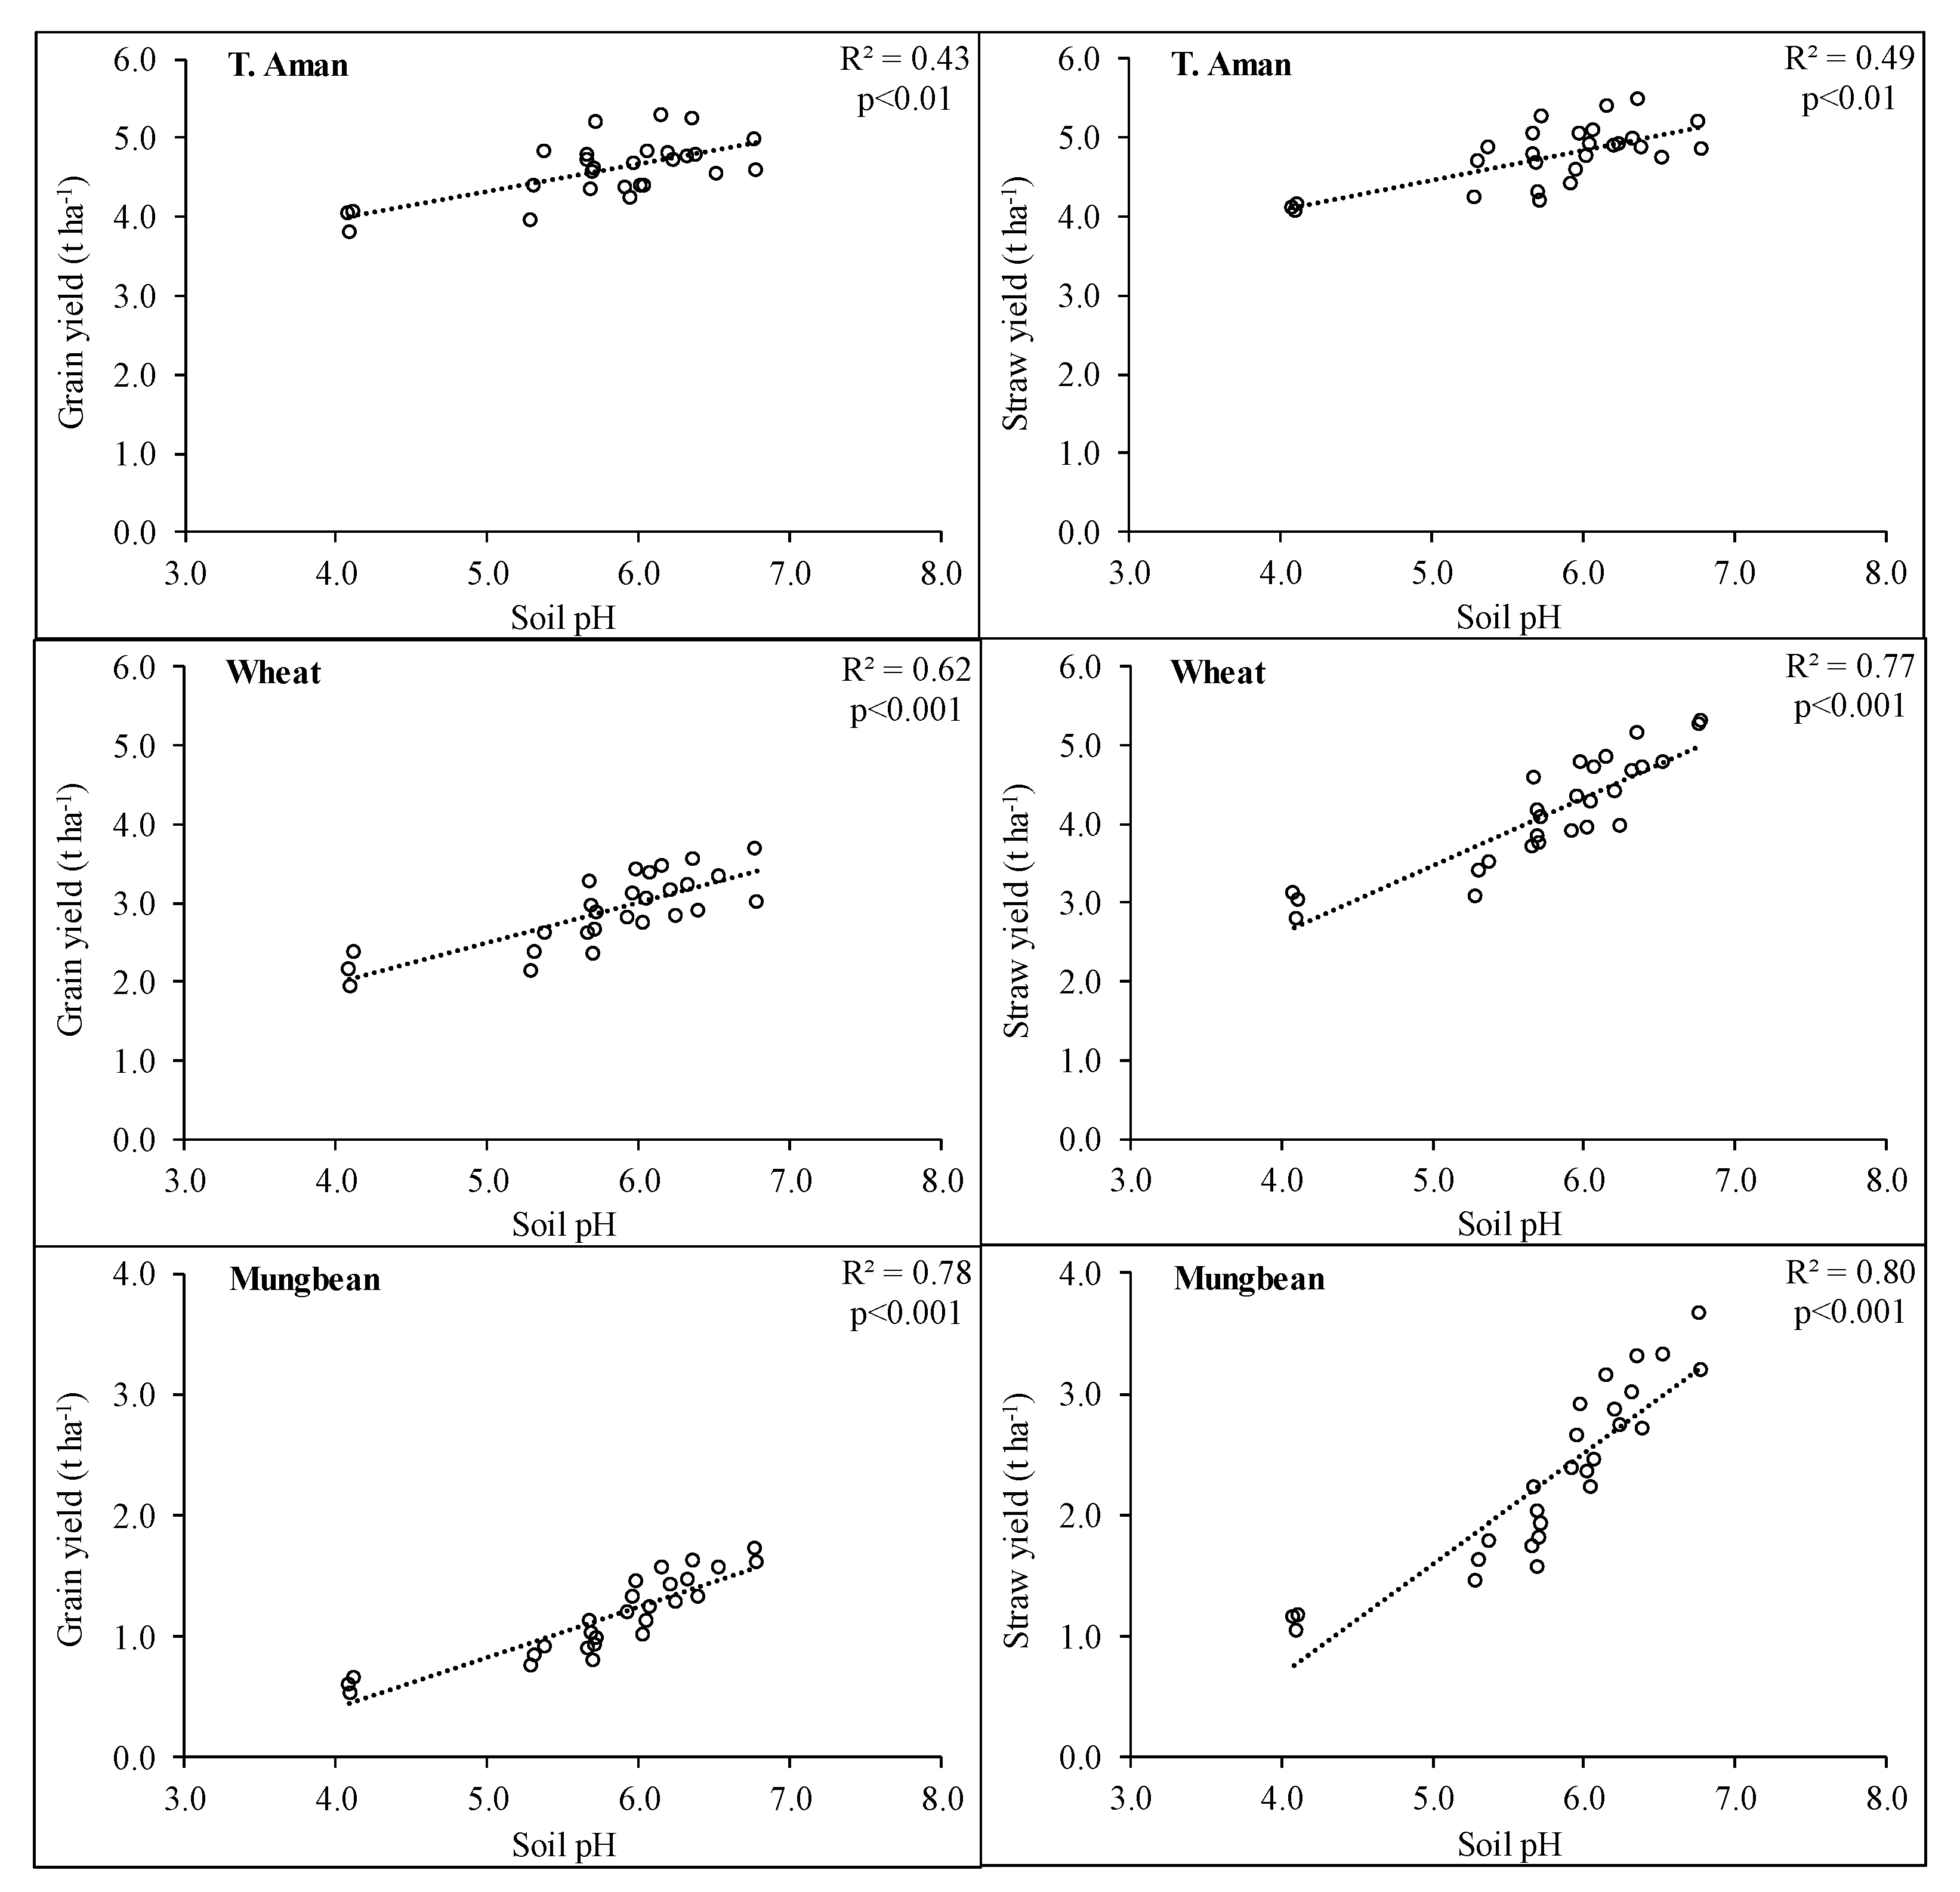
3.4. Correlation among Soil Properties, and between pH and Crop Yield in Wheat–Mungbean–T. Aman Cropping Pattern

Pearson’s correlation matrix among the soil properties is shown in Table 5. The results revealed strong significant positive correlation among the soil properties, i.e., soil fertility indices. With an increase in SOM content (%), soil macronutrients and soil reaction increased and improved other chemical properties (Table 5). Soil reaction had significant positive effects on nutrient availability and improvement of soil quality. With the increase of soil pH, availability of primary and secondary macronutrients increased, and consequently the EC and CEC of the soil improved (Table 5). A synergistic effect was observed among the plant nutrients (i.e., N, P, Ca, and Mg) (Table 5). Availability of exchangeable Ca and Mg was boosted up due to increase in soil EC and CEC.
Soil pH had significant but variable effects on grain and straw yield of all three crops (Figure 1). In regard to T. Aman rice, the response of straw yield (R2 = 0.49) was higher than that of grain yield (R2 = 0.43) (Figure 1). The effect of soil pH on the grain and straw yield was more pronounced in wheat than that in T. Aman rice (Figure 1). The response of straw yield (R2 = 0.77) was greater than grain yield (R2 = 0.62) (Figure 1). The grain and straw yield of mungbean showed the highest responses to the soil pH (Figure 1). Straw yield (R2 = 0.80) showed higher response than grain yield (R2 = 0.78) (Figure 1).

4. Discussion

Soil acidity is a restriction of crop productivity in 30% of the earth surface and 57% of agricultural land all over the world, including Bangladesh [33,34,35]. Soil acidification can be caused by a variety of sources, including natural processes, industrial pollutants, and agricultural output [36]. Acidified soil diminishes the availability of many essential nutrients, and worsens the toxicity of others (e.g., Al3+, Fe2+) via modifying a variety of chemical and biological processes in the soil [35].
Liming is one of the most essential and successful management strategies for reducing soil acidity [37]. The influence of liming on soil pH is highly dependent on the quality of the liming materials, e.g., particle size and material kinds [38], as well as the primary original chemical and physical qualities, e.g., pH buffering capacity and soil organic matter [39]. Moreover, high SOM frequently results in high soil CEC and pH buffer capacity [40]; hence, the impacts of lime tended to be stronger when the original soil SOM was high. This is due to the intricate interactions between soil, plants, and the environment, as well as the variability of the physical and chemical features of soil [37]. Our results showed that the application of lime and organic amendment increased the pH about 26% after the experiment, whereas chemical fertilizer increased soil acidity by 4% (Table 4), which is in line with Ozlu and Kumar [41]. Any of the following processes or combinations might have caused the rise in soil pH with the addition of lime and manure: consumption of proton by functional groups linked to organic materials [42], decarboxylation of organic acid anions during decomposition, specific adsorption of organic molecules by ligand exchange with the release of OH [43], and the release of OH ions during reduction reactions associated with localized anaerobic microsites (these are all examples of proton consumption) [44]. STN and available P content in soil increased due to increase in soil pH as a result of lime and manure application, which was reported earlier by Van Chuong [45]. The availability of exchangeable Ca2+ and Mg2+ increased as soil pH increased due to the application of lime and organic amendment, which was also observed by Mosharrof et al. [46] and Kunhikrishnan et al. [7]. Increased soil pH as a result of lime and manure amendment also increased soil EC and CEC, which was consistent with Yagi et al. [47] and Kisić et al. [48].
Liming can also influence both transformation and uptake of nutrients by plants [49,50] and, additionally, nutrient use efficiency [34]. It is widely accepted that liming can neutralize excessive acidic ions in the soil including proton ions and other acidic mineral cations (e.g., Al3+), while simultaneously supplying basic cations to the root zones e.g., Ca2+ and Mg2+ [51]. Liming can improve soil chemical properties, such as CEC and pH, and enhance the availability and uptake of macronutrients (e.g., P and K) [52]. Liming increases crop production primarily through direct effects on improving soil physical, chemical, and biological characteristics, which lead to increased availability and mobility of many essential nutrients of plants [39,53]. Liming has an active and passive positive influence on soil pH, plant nutrient mobilization, soil aggregates and structure, and soil biological activity [39,54]. Lime treatment in acid soils improves nutrient (NPK) availability and creates a healthier environment in the rhizosphere zone of the plants when the soil pH is low or the acidity is high [55,56,57]. Kemmitt et al. [58] found that changes in soil pH had a substantial impact on the pace of soil C and N cycling, and that liming treatments improved soil microbial activity by elevating the pH. Soil pH and P availability have a considerable relationship [59], which determines how P nutrition for arable crops is optimized. According to Barrow [9], the optimal soil pH for P absorption has to be re-evaluated. However, pH is not the only factor to consider; organic matter content also influences yield response to P [60]. In Ethiopia, Alemu et al. [61] and in Germany, von Tucher et al. [62], the impact of P status on yield response to pH was recently revealed for barley. Our result demonstrated that both grain and straw yield of T. Aman, wheat, and mungbean were strongly correlated with soil pH (Figure 1). Grain and straw yields also had strong positive correlation with other physicochemical properties of soil, as all the soil properties were positively correlated with soil pH (Table 5).
Lime and organic manure amendment have variable effects, i.e., increase in yield and nutrient uptake over control on three different crops of this experiment. In case of the first crop, T. Aman (Binadhan 7) rice, the effect of lime and organic manure was less prominent. However, a significant effect of lime or organic manure alone or in combination was observed in wheat (BARI Gom30) and mungbean (BRRI Mung6). It is particularly noticeable in yields of wheat and mungbean. In the instance of Binadhan 7, the increase in grain production over control varied from 0.24 to 13.44%. Rice yields have also been reported to rise as a result of liming [63,64]. The straw yields of the crops also followed the similar trend. Liming raises the pH of the soil and lowers the acidity, resulting in higher straw yields [65,66,67].
Our results showed that residual effect of lime and organic manure significantly increased yield (Table 2), nutrient content (Table S1), and nutrient uptake (Table 3) of wheat, which was reported earlier by Sultana et al. [68]. The increase in grain yield over control ranged from 10.14 to 54.38%. Caires et al. [63] observed that surface liming caused increases up to 140% in the grain yield of wheat. In another experiment, Arsat et al. [69] reported that combined application of 5 t manure and 2.2 t ha−1 lime increased grain and straw yield by 279% and 187%, respectively, over the control. Kisić et al. [47] discovered that, in addition to mineral and organic fertilization, liming resulted in considerably greater yields than the control and considerably higher yields than mineral fertilizer treatments. According to Jovanovic et al. [70], liming had a significant impact on field crop yields, and using high rates in a single application was preferable to using low rates repeatedly. Similar results were also reported by Samia [71] and Basak [72]. According to Von Tucher et al. [62], Liming in low pH soils with barley (and wheat) boosts fertilizer usage efficiency,
The residual effect of lime and organic manure application was more pronounced in the third crop, mungbean. Our results demonstrated that residual effect of combined application of lime and organic manure significantly increased seed yield (Table 2), and nutrient content and uptake (Table 3) of mungbean, which is in line with previous experimental results [8,73,74,75]. Kasa et al. [76] found that application of different level of lime and phosphorus significantly increased the yield and yield contributing characters of Haricot bean in Ethiopia. Lime in an acid soil not only replaces hydrogen ions, elevates soil pH [8], and increases NPK availability, but it also promotes plant growth and development in legume crops [77]. In an acidic soil, an experiment was carried out on Sesamum, mungbean, and cowpea with lime applications of 0.5, 1.0, 1.5, and 2.0 tons per hectare, respectively. The greatest rate of lime treatment favored lowering soil acidity, increasing NPK availability, neutralizing soil pH, and increasing yield [57].
The combined application of lime and organic amendment greatly boosted the total production and nutrient uptake of each crop in the T. Aman–mustard–boro cropping pattern, according to our findings. Sultana et al. [20] found that applying 1 t ha−1 dololime coupled with 3 t ha−1 poultry manure or 5 t ha−1 FYM boosted crop output and nutrient uptake in the old Himalayan Piedmont plain’s potato–mungbean–rice cropping pattern.

5. Conclusions

The overall results of the study demonstrate that addition of lime and/or organic manure to acid soils significantly increased yield and nutrient uptake of the crops of the wheat–mungbean–T. Aman cropping pattern. Lime or organic manure alone improved crop yield to a significant extent. However, combined application of lime and organic manure remarkably increased the yield and nutrient uptake of the crops as well as improved the nutrient availability and other soil properties. Based on the findings, it can be concluded that combined application of dololime and manure amendment (poultry manure or cow dung) can be practiced for better crop productivity of wheat–mungbean–T. Aman cropping pattern and improvement of soil quality in acidic Piedmont soils. However, similar research in other acid-prone areas of Bangladesh, on the other hand, would be worth considering for broader recommendations.

Supplementary Materials

The following are available online at https://0-www-mdpi-com.brum.beds.ac.uk/article/10.3390/agronomy11081595/s1, Table S1: Nutrient contents of crops in T. Aman-Wheat-Mungbean cropping pattern as influenced by lime and manure amendment.

Author Contributions

Conceptualization, M.R.I. and M.A.H. (Mohammad Anamul Hoque); methodology, M.R.I., R.J. and M.A.H. (Mohammad Anamul Hoque); software, R.J. and S.U.; validation, M.R.I., R.J. and M.A.H. (Mohammad Anamul Hoque); formal analysis, R.J., I.J.H. and S.U.; investigation, M.R.I., R.J., I.J.H. and. M.A.H. (Mohammad Anamul Hoque); resources, M.R.I. and M.A.H. (Mohammad Anamul Hoque); data curation, M.R.I., R.J., S.U. and. M.A.H. (Mohammad Anamul Hoque); writing—original draft preparation, M.R.I., R.J. and S.U.; writing—review and editing, M.R.I., R.J., S.U., M.A.H. (Mohammad Anamul Hoque), I.J.H., M.A.H. (Mohammad Anwar Hossain), S.H. and M.M.H.; visualization, M.R.I. and S.U.; supervision, M.R.I. and M.A.H. (Mohammad Anamul Hoque), S.H. and M.M.H.; project administration, M.R.I., M.A.H. (Mohammad Anamul Hoque), S.H. and M.M.H.; funding acquisition, M.R.I. and M.A.H. (Mohammad Anamul Hoque). All authors have read and agreed to the published version of the manuscript.

Funding

This research was partially supported by National Agricultural Technology Program Phase-II as implemented by Bangladesh Agricultural Research Council (CRG 419). The current work was also funded by Taif University Researchers Supporting Project number (TURSP-2020/142), Taif University, Taif, Saudi Arabia.

Institutional Review Board Statement

Not applicable.

Informed Consent Statement

Not applicable.

Data Availability Statement

The data that support this study will be shared upon reasonable request to the corresponding author.

Acknowledgments

The authors are grateful to the National Agricultural Technology Program Phase-II implemented by Bangladesh Agricultural Research Council for its partial funding support to conduct this research. The authors extend their appreciation to Taif University for funding the current work by Taif University Researchers Supporting Project number (TURSP-2020/142), Taif University, Taif, Saudi Arabia.

Conflicts of Interest

The authors declare that they have no conflict of interest in publishing this manuscript.

References

  1. Nair, K.M.; Anilkumar, K.S.; Srinivas, S.; Sujatha, K.; Venkatesh, D.H.; Naidu, L.G.K.; Sarkar, D.; Rajasekharan, P. Agro-Ecology of Kerala. NBSS Publ. No. 1038; National Bureau of Soil Survey and Land Use Planning: Nagpur, India, 2011; p. 408. [Google Scholar]
  2. Nair, K.M.; Sureshkumar, P.; Narayanankutty, M.C. Soils of Kerala. In Soil Fertility Assessment and Information Management for Enhancing Crop Productivity in Kerala; Rajasekharan, P., Nair, K.M., Rajasree, G., Sureshkumar, P., Narayanankutty, M.C., Eds.; Kerala State Planning Board: Thiruvananthapuram, India, 2013; pp. 72–92. [Google Scholar]
  3. Ryan, P.R.; Tyerman, S.D.; Sasaki, T.; Furuichi, T.; Yamamoto, Y.; Zhang, W.H.; Delhaize, E. The identification of aluminium-resistance genes provides opportunities for enhancing crop production on acid soils. J. Exp. Bot. 2011, 62, 9–20. [Google Scholar] [CrossRef] [Green Version]
  4. Havlin, J.L.; Tisdale, S.L.; Nelson, W.L.; Beaton, J.D. Soil Fertility and Fertilizers; Pearson Education: Chennai, India, 2016. [Google Scholar]
  5. Rossel, R.V.; McBratney, A.B. A response-surface calibration model for rapid and versatile site-specific lime-requirement predictions in southeastern Australia. Soil Res. 2011, 39, 185–201. [Google Scholar] [CrossRef]
  6. Jafer, D.G.; Hailu, G. Application of lime for acid soil amelioration and better soybean performance in South Western Ethiopia. J. Biol. Agric. Healthc. 2017, 7, 95–100. [Google Scholar]
  7. Kunhikrishnan, A.; Thangarajan, R.; Bolan, N.; Xu, Y.; Mandal, S.; Gleeson, D.; Seshadri, B.; Zaman, M.; Barton, L.; Tang, C.; et al. Functional relationships of soil acidification, liming, and greenhouse gas flux. Adv. Agron. 2016, 139, 1–71. [Google Scholar]
  8. Halim, A.; Siddique, M.N.E.A.; Sarker, B.C.; Islam, M.J.; Hossain, M.F.; Kamaruzzaman, M. Assessment of Nutrient Dynamics Affected by Different Levels of Lime in a Mungbean Field of the Old Himalayan Piedmont Soil in Bangladesh. J. Agric. Vet. Sci. 2014, 7, 101–112. [Google Scholar] [CrossRef]
  9. Barrow, N.J. The effects of pH on phosphate uptake from the soil. Plant Soil 2017, 410, 401–410. [Google Scholar] [CrossRef]
  10. Aye, N.S.; Sale, P.W.G.; Tang, C.X. The impact of long-term liming on soil organic carbon and aggregate stability in low-input acid soils. Biol. Fert. Soils 2016, 52, 697–709. [Google Scholar] [CrossRef]
  11. Penn, C.J.; Camberato, J.J. A critical review on soil chemical processes that control how soil pH affects phosphorus availability to plants. Agriculture 2019, 9, 120. [Google Scholar] [CrossRef] [Green Version]
  12. Liao, P.; Huang, S.; Van Gestel, N.C.; Zeng, Y.J.; Wu, Z.M.; Van Groenigen, K.J. Liming and straw retention interact to increase nitrogen uptake and grain yield in a double rice-cropping system. Field Crops Res. 2018, 216, 217–224. [Google Scholar] [CrossRef]
  13. Liao, P.; Liu, L.; He, Y.X.; Tang, G.; Zhang, J.; Zeng, Y.J.; Wu, Z.M.; Huang, S. Interactive effects of liming and straw incorporation on yield and nitrogen uptake in a double rice cropping system. Acta Agron. Sinica 2020, 46, 84–92. [Google Scholar] [CrossRef]
  14. Rahman, M.A.; Chikushi, J.; Duxbury, J.M.; Meisner, C.A.; Lauren, J.G.; Yasunaga, E. Chemical control of soil environment by lime and nutrients to improve the productivity of acidic alluvial soils under rice-wheat cropping system in Bangladesh. Environ. Control Biol. 2005, 43, 259–266. [Google Scholar] [CrossRef]
  15. Banik, P.; Ghosal, P.K.; Sasmal, T.K.; Bhattacharya, S.; Sarkar, B.K.; Bagchi, D.K. Effect of Organic and Inorganic Nutrients for Soil Quality Conservation and Yield of Rainfed Low Land Rice in Sub-tropical Plateau Region. J. Agron. Crop Sci. 2006, 192, 331–343. [Google Scholar] [CrossRef]
  16. Siavoshi, M.; Nasiri, A.; Laware, S.L. Effect of organic fertilizer on growth and yield component in rice. J. Agric. Sci. 2011, 3, 217–224. [Google Scholar] [CrossRef] [Green Version]
  17. Kobierski, M.; Bartkowiak, A.; Lemanowicz, J.; Piekarczyk, M. Impact of poultry manure fertilization on chemical and biochemical properties of soils. Plant Soil Environ. 2017, 63, 558–563. [Google Scholar] [CrossRef] [Green Version]
  18. Nweke, I.A.; Nsoanya, L.N. Effect of Cowdung and Urea Fertilization on Soil Properties, Growth, and Yield of Cucumber (Cucumis sativus L). J. Agric. Ecol. Res. Int. 2015, 3, 81–88. [Google Scholar] [CrossRef]
  19. Swain, M.R.; Laxminarayana, K.; Ray, R.C. Phosphorus solubilization by thermotolerant Bacillus subtilis isolated from cowdung microflora. Agric. Res. 2012, 1, 273–279. [Google Scholar] [CrossRef] [Green Version]
  20. Sultana, B.S.; Mian, M.H.; Jahiruddin, M.; Rahman, M.M.; Siddique, M.N.E.A.; Sultana, J. Liming and Soil Amendments for Acidity Regulation and Nutrients Uptake by Potato-Mungbean-Rice Cropping Pattern in the Old Himalayan Piedmont Plain. Asian J. Agric. Hort Res. 2019, 3, 1–15. [Google Scholar] [CrossRef] [Green Version]
  21. FAO. Land Resources Appraisal of Bangladesh for Agricultural Development. Report 2; Agro-ecological Regions of Bangladesh, Food and Agriculture Organization: Rome, Italy, 1988; pp. 212–221. [Google Scholar]
  22. Khan, M.S.H.; Abedin Mian, M.J.; Akhter, A.; Hosain, M.F.; Sikder, M.S.I. Effect of long-term fertilization and cropping on micronutrient cations of soils in Bangladesh. Pak. J. Biol. Sci. 2002, 5, 543–544. [Google Scholar] [CrossRef] [Green Version]
  23. BARC. Fertilizer Recommendation Guide. Bangladesh Agricultural Research Council, BARC, Soils Pub.; Bangladesh Agricultural Research Council: Dhaka, Bangladesh, 2005.
  24. Bremner, J.M.; Mulvaney, C.S. Nitrogen-total. In Methods of Soil Analysis Part 2; Page, A.L., Miller, R.H., Keeney, D.R., Eds.; Amer. Soc. Agron., Inc. Publ.: Madison, WI, USA, 1982; pp. 595–624. [Google Scholar]
  25. Olsen, S.R.; Cole, C.U.; Watanable, F.S.; Deun, L.A. Estimation of Available P in Soil Extraction with Sodium Bicarbonate; US Department of Agriculture, Circular No. 939; US Government Print Office: Washington, DC, USA, 1954; p. 929.
  26. Rani, S.; Sukumari, P. Root Growth, Nutrient Uptake and Yield of Medicinal Rice Njavara under Different Establishment Techniques and Nutrient Sources. Am. J. Plant Sci. 2013, 4, 35343. [Google Scholar] [CrossRef] [Green Version]
  27. Ghosh, A.B.; Bajaj, J.C.; Hasan, R.; Singh, D. Soil and Water Testing Methods; A Laboratory Manual; Division of Soil Science and Agricultural Chemistry, IARI: New Delhi, India, 1983; pp. 1–45. [Google Scholar]
  28. Walkey, A.J.; Black, A.I. Estimation of organic carbon by chromic acid titration method. J. Soil Sci. 1934, 25, 259–260. [Google Scholar]
  29. Bray, H.R.; Kurtz, L.T. Determination of total organic and available forms of phosphorus in soil. Soil Sci. 1945, 59, 39–45. [Google Scholar] [CrossRef]
  30. Jackson, M.L. Soil Chemical Analysis; Prentice Hall of India Pvt. Ltd.: New Delhi, India, 1973; pp. 69–182. [Google Scholar]
  31. Chapman, H.D. Cation-exchange capacity. In Methods of Soil Analysis—Chemical and Microbiological Properties; Black, C.A., Ed.; American Society of Agronomy: Madison, WI, USA, 1965; Volume 9, pp. 891–901. [Google Scholar]
  32. Gomez, K.A.; Gomez, A.A. Statistical Procedures for Agricultural Research; John Wiley and Sons: New York, NY, USA, 1984. [Google Scholar]
  33. Dai, Z.; Zhang, X.; Tang, C.; Muhammad, N.; Wu, J.; Brookes, P.C.; Xu, J. Potential role of biochars in decreasing soil acidification-a critical review. Sci. Total Environ. 2017, 581–582, 601–611. [Google Scholar] [CrossRef]
  34. Fageria, N.K.; Nascente, A.S. Management of soil acidity of South American soils for sustainable crop production. Adv. Agron. 2014, 128, 221–275. [Google Scholar] [CrossRef]
  35. Sumner, M.; Noble, A. Handbook of Soil Acidity; Rengel, Z., Ed.; Marcel Dekker: New York, NY, USA, 2003; pp. 1–28. [Google Scholar] [CrossRef] [Green Version]
  36. Holland, J.E.; Bennett, A.E.; Newton, A.C.; White, P.J.; McKenzie, B.M.; George, T.S.; Pakeman, R.J.; Bailey, J.S.; Fornara, D.A.; Hayes, R.C. Liming impacts on soils, crops and biodiversity in the UK: A review. Sci. Total Environ. 2018, 610–611, 316–332. [Google Scholar] [CrossRef] [PubMed]
  37. Pagani, A.; Mallarino, A.P. Soil pH and crop grain yield as affected by the source and rate of lime. Soil Sci. Soc. Am. J. 2012, 76, 1877–1886. [Google Scholar] [CrossRef]
  38. Álvarez, E.; Viadé, A.; Fernández-Marcos, M.L. Effect of liming with different sized limestone on the forms of aluminium in a Galician soil (NW Spain). Geoderma 2009, 152, 1–8. [Google Scholar] [CrossRef]
  39. Bolan, N.S.; Adriano, D.C.; Curtin, D. Soil acidification and liming interactions with nutrient and heavy metal transformation and bioavailability. Adv. Agron. 2003, 78, 215–272. [Google Scholar]
  40. Briedis, C.; De Moraes, J.C.; Caires, E.F.; De Fátima, J.; Inagaki, T.M.; Boer, A.; De Oliveira, A.; Neto, C.Q.; Canalli, L.B.; Bürkner dos Santos, J. Changes in organic matter pools and increases in carbon sequestration in response to surface liming in an Oxisol under long-term no-till. Soil Sci. Soc. Am. J. 2012, 76, 151–160. [Google Scholar] [CrossRef]
  41. Ozlu, E.; Kumar, S. Response of surface GHG fluxes to long-term manure and inorganic fertilizer application in corn and soybean rotation. Sci. Total Environ. 2018, 626, 817–825. [Google Scholar] [CrossRef]
  42. Dong, J.; Yao, L.; Zhang, J.; Feng, J.; Sa, R. Feed Additive Manual; China Agricultural University Press: Beijing, China, 2001; p. 289. (In Chinese) [Google Scholar]
  43. Hue, N.; Craddock, G.; Adams, F. Effect of organic acids on aluminum toxicity in subsoils. Soil Sci. Soc. Am. J. 1986, 50, 28–34. [Google Scholar] [CrossRef]
  44. Eghball, B. Liming effects of beef cattle feedlot manure or compost. Commun. Soil Sci. Plant Anal. 1999, 30, 2563–2570. [Google Scholar] [CrossRef]
  45. Van Chuong, N. Effect of lime, organic and inorganic fertilizers on soil chemical properties and yield of chilli (Capsicum frutescens L.). AGU Int. J. Sci. 2019, 7, 84–90. [Google Scholar]
  46. Mosharrof, M.; Uddin, M.K.; Jusop, S.; Sulaiman, M.F.; Shamsuzzaman, S.M.; Haque, A.N. Changes in Acidic Soil Chemical Properties and Carbon Dioxide Emission Due to Biochar and Lime Treatments. Agriculture 2021, 11, 219. [Google Scholar] [CrossRef]
  47. Yagi, R.; Ferreira, M.E.; Cruz, M.; Barbosa, J. Organic matter fractions and soil fertility under the influence of liming, vermicompost and cattle manure. Sci. Agric. 2003, 60, 549–557. [Google Scholar] [CrossRef]
  48. Kisić, I.; Bašić, F.; Mešić, M.; Butorac, A.; Vađić, Ž. The Effect of Fertilization and Limingon Some Soil Chemical Properties of Eutric Gleysol. AGRIS 2004, 69, 43–49. [Google Scholar]
  49. Fageria, N.K. Soil quality vs. environmentally-based agricultural management practices. Commun. Soil Sci. Plant Anal. 2002, 33, 2301–2329. [Google Scholar] [CrossRef]
  50. Cheng, Y.; Wang, J.; Mary, B.; Zhang, J.B.; Cai, Z.C.; Chang, S.X. Soil pH has contrasting effects on gross and net nitrogen mineralizations in adjacent forest and grassland soils in central Alberta, Canada. Soil Biol. Biochem. 2013, 57, 848–857. [Google Scholar] [CrossRef]
  51. Fageria, N.K.; Baligar, V.C. Ameliorating soil acidity of tropical Oxisols by liming for sustainable crop production. Adv. Agron. 2008, 99, 345–399. [Google Scholar] [CrossRef]
  52. Li, Y.; Cui, S.; Chang, S.X.; Zhang, Q. Liming effects on soil pH and crop yield depend on lime material type, application method and rate, and crop species: A global meta-analysis. J. Soils Sediments 2018, 19, 1393–1406. [Google Scholar] [CrossRef]
  53. Jaskulska, I.; Jaskulski, D.; Kobierski, M. Effect of liming on the change of some agrochemical soil properties in a long-term fertilization experiment. Plant Soil Environ. 2014, 60, 146–150. [Google Scholar] [CrossRef] [Green Version]
  54. Meena, R.S.; Dhakal, Y.; Bohra, J.S.; Singh., S.P.; Singh, M.K.; Sanodiya, P. Influence of Bioinorganic Combinations on Yield, Quality and Economics of Mungbean. Am. J. Exp. Agric. 2015, 8, 159–166. [Google Scholar] [CrossRef]
  55. Bekere, W. Liming effects on yield and yield attributes of nitrogen fertilizer and bradyrhizobia inoculated soybean (Glycine max L.) grown in acidic soil at Jimma, South Western Ethiopia. J. Biol. 2013, 3, 139–143. [Google Scholar]
  56. Kisinyo, J.A.; Kebeney, S.J.; Too, E.J.; Opile, W.R. Immediate and residual effects of lime and phosphorus fertilizer on soil acidity and maize production in western Kenya. Exp. Agric. 2014, 50, 128–143. [Google Scholar] [CrossRef]
  57. Kumar, S.; Meena, R.S.; Yadav, G.S.; Pandey, A. Response of sesame (Sesamum indicum L.) to sulphur and lime application under soil acidity. Int. J. Plant Soil Sci. 2017, 14, 1–9. [Google Scholar] [CrossRef]
  58. Kemmitt, S.J.; Wright, D.; Goulding, K.W.T.; Jones, D.L. pH regulation of carbon and nitrogen dynamics in two agricultural soils. Soil Biol. Biochem. 2006, 38, 898–911. [Google Scholar] [CrossRef]
  59. Simonsson, M.; Östlund, A.; Renfjäll, L.; Sigtryggsson, C.; Börjesson, G.; Kätterer, T. Pools and solubility of soil phosphorus as affected by liming in long-term agricultural field experiments. Geoderma 2018, 315, 208–219. [Google Scholar] [CrossRef]
  60. Johnston, A.; Poulton, P. The importance of long-term experiments in agriculture: Their management to ensure continued crop production and soil fertility; the Rothamsted experience. Eur. J. Soil Sci. 2013, 69, 113–125. [Google Scholar] [CrossRef] [PubMed] [Green Version]
  61. Alemu, G.; Desalegn, T.; Debele, T.; Adela, A.; Taye, G.; Yirga, C. Effect of lime and phosphorus fertilizer on acid soil properties and barley grain yield at Bedi in Western Ethiopia. Afr. J. Agric. Res. 2017, 12, 3005–3012. [Google Scholar] [CrossRef] [Green Version]
  62. Von Tucher, S.; Hörndl, D.; Schmidhalter, U. Interaction of soil pH and phosphorus efficacy: Long-term effects of P fertilizer and lime applications on wheat, barley, and sugar beet. Ambio 2018, 47, 41–49. [Google Scholar] [CrossRef] [Green Version]
  63. Caires, E.F.; Garhuio, F.J.; Churka, S.; Barth, G.; Correa, J.C.L. Effects of Soil Acidity Amelioration by Surface Liming on No-till corn, soybean and wheat root growth and yield. Eur. J. Agron. 2008, 28, 57–64. [Google Scholar] [CrossRef]
  64. Ernani, P.R.; Bayer, C.; Maestri, L. Corn yield as affected by liming and tillage system on an acid Brazilian Oxisol. Agron. J. 2002, 94, 305–309. [Google Scholar] [CrossRef]
  65. Murphy, P.N.C.; Sims, J.T. Effects of Lime and Phosphorus Application on Phosphorus Runoff Risk. Water Air Soil Pollut. 2012, 2012, 223. [Google Scholar] [CrossRef]
  66. Tang, C.; Rene, Z.; Diatloff, E.; Gazey, C. Response of wheat and barley to liming on a sandy soil with subsoil acidity. Field Crop Res. 2003, 80, 235–244. [Google Scholar] [CrossRef]
  67. Tsakelidou, K. Effect of calcium carbonate as determined by lime requirement buffer pH methods on soil characteristics and yield of sorghum plants. Commun. Soil Sci. Plant Anal. 2000, 31, 1249–1260. [Google Scholar] [CrossRef]
  68. Sultana, B.S.; Mian, M.M.H.; Islam, M.R.; Rahman, M.M.; Sarker, B.C.; Zoha, M.S. Effect of liming on soil properties, yield and nutrient uptake by wheat. Curr. World Environ. 2009, 4, 39–47. [Google Scholar] [CrossRef]
  69. Arsat, M.; Gebrekidan, H.; Yli-Halla, M.; Bedadi, B.; Negassa, W. Effect of Integrated Use of Lime, Manure and Mineral P Fertilizer on Bread Wheat (Triticum aestivum) Yield, P uptake and Status of Residual Soil P on Acidic Soils of Gozamin District, North-Western Ethiopia. Agric. For. Fish. 2014, 3, 76–85. [Google Scholar] [CrossRef] [Green Version]
  70. Jovanovic, Ž.; Djalovic, I.; Komljenovic, I.; Kovacevic, V.; Cvijović, M. Influences of Liming on Vertisol Properties and Yields of The Field Crops. Cereal Res. Commun. 2006, 34, 517–520. [Google Scholar] [CrossRef]
  71. Samia, B.S. Effect of Liming on Soil Properties and Yield of Wheat. Master’s Thesis, HSTU, Dinajpur, Bangladesh, 2009. [Google Scholar]
  72. Basak, V. Nutrient Dynamics and Chemical Properties of Acid Soil under Different Liming Conditions in Mungbean Field Followed by Transplanted Aman. Master’s Thesis, HSTU, Dinajpur, Bangladesh, 2010. [Google Scholar]
  73. Varma, D.; Meena, R.S.; Kumar, S. Response of Mungbean to Fertility and Lime Levels under Soil Acidity in an Alley Cropping System of Vindhyan Region, India. Int. J. Chem. Stud. 2017, 5, 1558–1560. Available online: https://www.chemijournal.com/archives/?year=2017&vol=5&issue=4&ArticleId=851 (accessed on 3 June 2021).
  74. Meena, R.S.; Varma, D. Mungbean yield and nutrient uptake performance in response of NPK and lime levels under acid soil in Vindhyan region, India. J. Appl. Nat. Sci. 2016, 8, 860–863. [Google Scholar] [CrossRef]
  75. Cifu, M.; Xiaonan, L.; Zhihong, C.; Zhengyi, H.; Wanzhu, M. Long-term effects of lime application on soil acidity and crop yields on a red soil in Central Zhejiang. Plant Soil 2004, 265, 101–109. [Google Scholar] [CrossRef]
  76. Kasa, M.; Yebo, B.; Habte, A. Effects of liming and Phosphorus levels on yield and yield components of Haricot bean (Pharsalus vulgarism L.) varieties on Nitosols at Wolaita zone, Ethiopia. Asian J. Crop. Sci. 2014, 6, 245–253. [Google Scholar] [CrossRef] [Green Version]
  77. Zhao, J.; Michalk, L.Y.; Wen, Y.; Kemp, K.R.; Gand, D.; Helen, N. Effect of phosphorus, potassium and lime application on pasture in acidic soils in Yunnan province, China. New Zealand J. Agric. Res. 2007, 50, 523–535. [Google Scholar] [CrossRef]
Figure 1. Relationship between soil pH and crop yield in the wheat–mungbean–T. Aman cropping pattern as influenced by lime and manure amendment.
Agronomy 11 01595 g001
Table 1. Nutrient compositions and source of the organic manures and dololime used in the study.
ManureC
(g kg−1)
N
(g kg−1)
P
(g kg−1)
S
(g kg−1)
Ca
(g kg−1)
Mg
(g kg−1)
pH
(Water)
Source
Cow dung331.412.74.962.84.216.27.6Local household
Poultry manure335.430.823.35.66.218.58.1Local poultry farm
Dololime----2011078.3Local market
Table 2. Effect of lime and manure amendment on grain and straw yield (mean ± SE; n = 3) of wheat–mungbean–T. Aman cropping pattern.
TreatmentsT. AmanWheatMungbean
Grain Yield
(t ha−1)
Straw Yield
(t ha−1)
Grain Yield
(t ha−1)
Straw Yield
(t ha−1)
Grain Yield
(t ha−1)
Straw Yield
(t ha−1)
T1: Control4.24 ± 0.2 f4.51 ± 0.26 d2.17 ± 0.13 f3.11 ± 0.18 e0.60 ± 0.03 f1.15 ± 0.04 f
T2: Lime-14.36 ± 0.3 e4.67 ± 0.27 bcd2.97 ± 0.17 c4.16 ± 0.24 c1.03 ± 0.06 cd2.02 ± 0.12 d
T3: Lime-24.39 ± 0.3 e4.62 ± 0.27 cd3.07 ± 0.18 bc4.28 ± 0.25 bc1.13 ± 0.07 c2.23 ± 0.06 d
T4: OM-14.4 ± 0.25 e4.7 ± 0.27 bcd2.39 ± 0.14 e3.41 ± 0.20 de0.84 ± 0.05 e1.62 ± 0.09 e
T5: OM-24.73 ± 0.27 c4.78 ± 0.28 abc2.62 ± 0.15 d3.70 ± 0.21 d0.90 ± 0.05 de1.75 ± 0.10 e
T6: Lime-1 OM-14.25 ± 0.25 f4.58 ± 0.26 cd3.12 ± 0.18 bc4.35 ± 0.25 abc1.33 ± 0.08 b2.65 ± 0.15 c
T7: Lime-1 OM-24.81 ± 0.28 a4.9 ± 0.28 ab3.16 ± 0.18 abc4.4 ± 0.25 abc1.43 ± 0.08 ab2.86 ± 0.12 b
T8: Lime-2 OM-14.77 ± 0.28 b4.98 ± 0.29 a3.23 ± 0.19 ab4.68 ± 0.27 ab1.48 ± 0.09 ab3.00 ± 0.17 b
T9: Lime-2 OM-24.54 ± 0.26 d4.73 ± 0.27 abc3.35 ± 0.19 a4.79 ± 0.28 a1.57 ± 0.09 a3.33 ± 0.14 a
SE (±)0.020.110.090.200.050.14
CV (%)4.34.94.05.94.43.16
Figures in a column having common letters do not differ significantly at 5% level of significance. CV (%) = Coefficient of variation; SE = Standard error of means; Lime-1 = Dololime 1 t ha-1; Lime-2 = Dololime 2 t ha-1; OM-1 = Cowdung 5 t ha-1; OM-2 = Poultry manure 3 t ha-1
Table 3. Nutrient uptake (mean ± SE; n = 3) by crops in wheat–mungbean–T. Aman cropping pattern as influenced by lime and manure amendment.
T. Aman
TreatmentsN Uptake (kg ha−1)P Uptake (kg ha−1)K Uptake (kg ha−1)S Uptake (kg ha−1)
GrainStrawGrainStrawGrainStrawGrainStraw
T1: Control42.78 ± 2.23 f13.97 ± 0.73 e8.87 ± 0.46 e5.39 ± 0.28 e11.01 ± 0.57 f50.43 ± 2.62 e11.44 ± 0.59 f8.11 ± 0.42 f
T2: Lime-148.09 ± 2.42 e15.81 ± 0.80 d10.52 ± 0.53 d7.00 ± 0.35 d13.57 ± 0.68 e55.43 ± 2.79 d12.30 ± 0.59 e9.70 ± 0.47 e
T3: Lime-249.96 ± 2.51 d15.85 ± 0.80 d10.83 ± 0.55 c7.84 ± 0.40 c14.84 ± 0.75 d55.27 ± 2.79 d13.12 ± 0.66 d9.77 ± 0.49 e
T4: OM-149.35 ± 2.47 de17.34 ± 0.87 c10.58 ± 0.53 cd6.57 ± 0.33 d13.70 ± 0.68 e54.51 ± 2.72 d13.35 ± 0.62 e10.32 ± 0.52 d
T5: OM-255.07 ± 2.60 b18.87 ± 0.89 b11.14 ± 0.53 b7.90 ± 0.37 c15.45 ± 0.75 c56.54 ± 2.74 c13.40 ± 0.64 d11.30 ± 0.54 c
T6: Lime-1 OM-151.86 ± 2.69 c17.18 ± 0.89 c10.63 ± 0.55 cd7.69 ± 0.40 c15.01 ± 0.77 cd55.18 ± 2.84 d14.07 ± 0.73 c10.43 ± 0.54 d
T7: Lime-1 OM-258.07 ± 2.69 a19.74 ± 0.91 a11.82 ± 0.55 a10.06 ± 0.47 a16.28 ± 0.77 b61.84 ± 2.93 a16.53 ± 0.77 a12.56 ± 0.59 b
T8: Lime-2 OM-158.42 ± 2.71 a19.70 ± 0.90 a11.94 ± 0.56 a9.14 ± 0.42 b16.92 ± 0.79 a61.97 ± 2.91 a15.61 ± 0.73 b13.08 ± 0.61 a
T9: Lime-2 OM-258.21 ± 2.82 a18.87 ± 0.91 b11.35 ± 0.56 b9.66 ± 0.47 a16.09 ± 0.79 b60.40 ± 2.98 b16.21 ± 0.79 a12.93 ± 0.63 ab
SE (±)3.931.390.730.921.233.471.221.08
CV (%)1.031.140.831.901.220.671.310.56
Wheat
TreatmentsN Uptake (kg ha−1)P Uptake (kg ha−1)K Uptake (kg ha−1)S Uptake (kg ha−1)
GrainStrawGrainStrawGrainStrawStrawGrain
T1: Control36.85 ± 1.92 h10.25 ± 0.53 f4.55 ± 0.25 g2.08 ± 0.11 g8.68 ± 0.45 g44.17 ± 2.29 g4.29 ± 0.23 g4.62 ± 0.24 g
T2: Lime-151.54 ± 1.95 e16.22 ± 0.61 c8.12 d ± 0.33 e2.81 ± 0.11 e12.83 ± 0.50 e60.58 ± 2.34 d6.40 ± 0.25 d7.50 ± 0.29 de
T3: Lime-255.20 ± 2.04 d17.04 ± 0.63 c8.68 ± 0.33 d3.43 ± 0.13 c13.21 ± 0.50 e62.83 ± 2.36 d7.35 ± 0.27 c8.34 ± 0.31 c
T4: OM-142.52 ± 2.01 g13.35 ± 0.63 e6.43 ± 0.29 f2.48 ± 0.11 f9.98 ± 0.47 f49.72 ± 2.36 f5.06 ± 0.24 f5.18 ± 0.24 f
T5: OM-247.71 ± 2.06 f14.95 ± 0.65 d7.79 ± 0.33 e2.31 ± 0.10 f12.43 ± 0.54 e55.31 ± 2.41 e5.66 ± 0.25 e7.01 ± 0.31 e
T6: Lime-1 OM-157.34 ± 2.09 cd19.10 ± 0.69 b9.84 ± 0.35 c3.18 ± 0.11 d14.96 ± 0.55 d66.93 ± 2.47 c7.39 ± 0.27 c7.50 ± 0.27 de
T7: Lime-1 OM-259.25 ± 2.12 bc19.87 ± 0.71 b10.87 ± 0.37 b3.31 ± 0.11 cd16.06 ± 0.58 c69.48 ± 2.49 bc7.72 ± 0.28 c7.52 ± 0.27 d
T8: Lime-2 OM-161.33 ± 2.13 ab20.00 ± 0.69 b10.98 ± 0.38 b3.70 ± 0.13 b17.24 ± 0.60 b71.33 ± 2.47 ab8.38 ± 0.29 b9.24 ± 0.32 b
T9: Lime-2 OM-263.10 ± 2.13 a21.05 ± 0.71 a12.00 ± 0.39 a3.93 ± 0.13 a18.37 ± 0.62 a73.71 ± 2.49 a9.36 ± 0.32 a10.07 ± 0.34 a
SE (±)5.572.141.390.91.916.360.971.03
CV (%)1.692.112.712.112.341.642.372.31
Mungbean
TreatmentsN Uptake (kg ha−1)P Uptake (kg ha−1)K Uptake (kg ha−1)S Uptake (kg ha−1)
GrainStrawGrainStrawGrainStrawGrainStraw
T1: Control21.77 ± 1.26 i5.54 ± 0.32 e2.40 ± 0.14 i0.48 ± 0.03 g8.52 ± 0.49 i3.56 ± 0.21 e2.40 ± 0.14 i0.32 ± 0.02 g
T2: Lime-138.62 ± 2.23 f5.99 ± 0.35 d5.47 ± 0.32 f0.72 ± 0.04 e15.28 ± 0.88 f3.70 ± 0.21 d4.85 ± 0.28 f0.34 ± 0.02 fg
T3: Lime-242.86 ± 2.47 e6.16 ± 0.36 c6.56 ± 0.38 e0.79 ± 0.05 cd16.74 ± 0.97 e3.73 ± 0.22 d5.88 ± 0.34 e0.34 ± 0.02 ef
T4: OM-130.76 ± 1.78 h5.55 ± 0.32 e3.84 ± 0.22 h0.55 ± 0.03 f12.45 ± 0.72 h3.80 ± 0.22 c3.59 ± 0.21 h0.35 ± 0.23 ef
T5: OM-233.65 ± 1.94 g5.88 ± 0.35 d4.34 ± 0.25 g0.58 ± 0.03 f13.75 ± 0.79 g3.83 ± 0.22 c4.25 ± 0.25 g0.36 ± 0.23 e
T6: Lime-1 OM-150.45 ± 2.92 d6.23 ± 0.36 c7.43 ± 0.43 d0.75 ± 0.04 de20.31 ± 1.17 d3.83 ± 0.22 c6.90 ± 0.40 d0.38 ± 0.23 d
T7: Lime-1 OM-254.75 ± 3.16 c6.43 ± 0.37 b8.40 ± 0.49 c0.82 ± 0.05 c21.96 ± 1.27 c3.93 ± 0.23 b7.56 ± 0.44 c0.42 ± 0.22 c
T8: Lime-2 OM-157.67 ± 3.33 b6.74 ± 0.39 a8.85 ± 0.51 b0.89 ± 0.05 b23.01 ± 1.33 b3.97 ± 0.23 b7.97 ± 0.46 b0.46 ± 0.23 b
T9: Lime-2 OM-261.67 ± 3.56 a6.84 ± 0.42 a9.60 ± 0.55 a0.96 ± 0.06 a25.02 ± 1.44 a4.04 ± 0.23 a8.81 ± 0.51 a0.51 ± 0.24 a
SE (±)0.860.130.160.030.350.070.140.01
CV (%)2.410.763.042.142.440.442.911.67
Figures in a column having common letters do not differ significantly at 5% level of significance. CV (%) = Coefficient of variation; SE = Standard error of means; Lime-1 = Dololime 1 t ha-1; Lime-2 = Dololime 2 t ha-1; OM-1 = Cowdung 5 t ha-1; OM-2 = Poultry manure 3 t ha-1
Table 4. Effect of lime and manure amendment on changes of soil properties (mean ± SE; n = 3) under wheat–mungbean–T. Aman cropping pattern.
TreatmentsSOM Content (%)STN (%)Available P (ppm)Exchangeable Ca (cmolc/kg)
BeforeAfterBeforeAfterBeforeAfterBeforeAfter
T1: Control1.54 ± 0.01 c1.31 ± 0.01 e0.11 ± 0.01 b0.09 ± 0.01 c7.05 ± 0.04 g6.77 ± 0.04 i5.20 ± 0.02 f4.68 ± 0.02 h
T2: Lime-11.54 ± 0.01 c1.42 ± 0.01 d0.12 ± 0.01 b0.11 ± 0.01 c7.31 ± 0.02 f9.14 ± 0.03 g5.36 ± 0.01 de5.90 ± 0.02 f
T3: Lime-21.56 ± 0.01 c1.44 ± 0.01 d0.12 ± 0.01 b0.11 ± 0.01 c7.47 ± 0.02 de10.08 ± 0.03 d5.49 ± 0.01 ab6.21 ± 0.01 c
T4: OM-11.58 ± 0.01 b1.50 ± 0.01 c0.15 ± 0.01 a0.16 ± 0.01 b7.41 ± 0.01 ef8.52 ± 0.01 h5.29 ± 0.02 e5.71 ± 0.02 g
T5: OM-21.60 ± 0.01 b1.54 ± 0.01 b0.16 ± 0.01 a0.17 ± 0.01 ab7.54 ± 0.02 cd9.42 ± 0.02 f5.34 ± 0.01 de6.04 ± 0.01 e
T6: Lime-1 OM-11.60 ± 0.01 b1.52 ± 0.01 c0.15 ± 0.01 a0.16 ± 0.01 ab7.63 ± 0.02 bc9.92 ± 0.02 e5.37 ± 0.01 d6.12 ± 0.01 de
T7: Lime-1 OM-21.63 ± 0.02 a1.56 ± 0.02 a0.16 ± 0.01 a0.19 ± 0.02 a7.72 ± 0.02 b10.42 ± 0.02 c5.41 ± 0.01 cd6.16 ± 0.01 cd
T8: Lime-2 OM-11.59 ± 0.02 b1.51 ± 0.01 c0.15 ± 0.01 a0.17 ± 0.01 ab7.86 ± 0.02 a11.00 ± 0.03 b5.47 ± 0.02 bc6.40 ± 0.02 b
T9: Lime-2 OM-21.63 ± 0.02 a1.56 ± 0.02 a0.16 ± 0.01 a0.19 ± 0.02 a7.96 ± 0.01 a11.54 ± 0.02 a5.55 ± 0.02 a6.88 ± 0.03 a
SE (±)0.010.020.010.010.050.260.020.11
CV (%)0.410.394.106.120.460.440.470.49
TreatmentsExchangeable Mg (cmolc/kg)pHEC (dS/m)CEC (cmolc/kg)
BeforeAfterBeforeAfterBeforeAfterBeforeAfter
T1: Control1.35 ± 0.01 g1.22 ± 0.01 h4.66 ± 0.01 g4.10 ± 0.01 g0.22 ± 0.01 g0.22 ± 0.01 g34.97 ± 0.02 b33.14 ± 1.43 d
T2: Lime-11.45 ± 0.01 f1.60 ± 0.01 f5.13 ± 0.01 d5.69 ± 0.01 e0.26 ± 0.01 f0.29 ± 0.01 f35.23 ± 0.01 b38.75 ± 0.01 bc
T3: Lime-21.51 ± 0.02 e1.70 ± 0.01 e5.26 ± 0.01 ab6.05 ± 0.01 cd0.28 ± 0.01 e0.33 ± 0.01 e35.41 ± 0.01 b40.01 ± 0.02 bc
T4: OM-11.37 ± 0.01 g1.48 ± 0.01 g4.84 ± 0.02 f5.33 ± 0.03 f0.29 ± 0.02 de0.32 ± 0.02 ef35.40 ± 0.33 b37.63 ± 0.84 c
T5: OM-21.40 ± 0.01 g1.58 ± 0.01 f4.96 ± 0.01 e5.70 ± 0.02 e0.30 ± 0.01 de0.34 ± 0.02 de35.15 ± 0.01 b38.53 ± 1.18 bc
T6: Lime-1 OM-11.55 ± 0.02 d1.77 ± 0.02 d5.18 ± 0.01 cd5.95 ± 0.02 d0.31 ± 0.01 cd0.36 ± 0.01 cd35.33 ± 0.01 b40.28 ± 0.01 bc
T7: Lime-1 OM-21.61 ± 0.02 c1.83 ± 0.02 c5.26 ± 0.02 bc6.20 ± 0.02 c0.34 ± 0.01 bc0.40 ± 0.01 bc35.42 ± 0.02 b40.38 ± 0.02 bc
T8: Lime-2 OM-11.66 ± 0.03 b1.94 ± 0.03 b5.26 ± 0.01 bc6.36 ± 0.02 b0.35 ± 0.01 ab0.43 ± 0.01 b35.54 ± 0.01 b41.58 ± 0.01 b
T9: Lime-2 OM-21.72 ± 0.03 a2.11 ± 0.03 a5.34 ± 0.02 a6.69 ± 0.08 a0.38 ± 0.02 a0.47 ± 0.02 a38.22 ± 0.30 a45.86 ± 0.36 a
SE (±)0.020.050.040.0140.010.010.190.66
CV (%)0.991.120.550.922.973.340.692.86
Figures in a column having common letters do not differ significantly at 5% level of significance. CV (%) = Coefficient of variation; SE = Standard error of means; Lime-1 = Dololime 1 t ha-1; Lime-2 = Dololime 2 t ha-1; OM-1 = Cowdung 5 t ha-1; OM-2 = Poultry manure 3 t ha-1.
Table 5. Relationship among soil properties as influenced by lime and manure amendment.
SOM Content
(%)
STN (%)Available P
(ppm)
Exchangeable Ca (cmolc/kg)Exchangeable Mg (cmolc/kg)Soil pHEC
(dS/m)
CEC
(cmolc/kg)
SOM content
(%)
1
STN (%)0.398 *1
Available P (ppm)0.790 ***0.513 **1
Exchangeable Ca (cmolc/kg)0.817 ***0.434 *0.974 ***1
Exchangeable Mg (cmolc/kg)0.756 ***0.610 ***0.980 ***0.944 ***1
Soil pH0.813 ***0.487 **0.985 ***0.984 ***0.951 ***1
EC (dS/m)0.854 ***0.582 **0.932 ***0.904 ***0.948 ***0.895 ***1
CEC
(cmolc/kg)
0.732 ***0.524 **0.916 ***0.926 ***0.930 ***0.905 ***0.886 ***1
r value: 0.0 to 0.2—very weak fit, 0.2 to 0.4—weak fit, 0.4 to 0.7 –moderate fit, 0.7 to 0.9—strong fit, 0.9 to 1.0—very strong fit. * indicates significant at 5% level of significane, ** indicates significant at 1% level of significance, *** indicates significant at 0.1% level of significance.
Publisher’s Note: MDPI stays neutral with regard to jurisdictional claims in published maps and institutional affiliations.

