
Water-Centric Nexus Approach for the Agriculture and Forest Sectors in Response to Climate Change in the Korean Peninsula


1
College of General Education, Kookmin University, 77 Jeongneungro, Seongbukgu, Seoul 02707, Korea
2
Institute of Forest Science, Kookmin University, 77 Jeongneungro, Seongbukgu, Seoul 02707, Korea
Agronomy 2021, 11(8), 1657; https://0-doi-org.brum.beds.ac.uk/10.3390/agronomy11081657
Submission received: 15 July 2021
/
Revised: 11 August 2021
/
Accepted: 18 August 2021
/
Published: 20 August 2021
(This article belongs to the Special Issue Simulating the Impacts of Climate Change on Hydrology and Crop Production)
Abstract
:Climate change has inherent multidisciplinary characteristics, and predicting the future of a single field of work has a limit. Therefore, this study proposes a water-centric nexus approach for the agriculture and forest sectors for improving the response to climate change in the Korean Peninsula. Two spatial models, i.e., Environmental Policy Integrated Climate and Integrated Valuation of Ecosystem Services and Tradeoffs, were used to assess the extent of changes in agricultural water demand, forest water supply, and their balance at the watershed level in the current and future climatic conditions. Climate changed has increased the agricultural water demand and forest water supply significantly in all future scenarios and periods. Comparing the results with RCP8.5 2070s and the baseline, the agricultural water demand and forest water supply increased by 35% and 28%, respectively. Water balance assessment at the main watershed level in the Korean Peninsula revealed that although most scenarios of the future water supply increases offset the demand growth, a risk to water balance exists in case of a low forest ratio or smaller watershed. For instance, the western plains, which are the granary regions of South and North Korea, indicate a higher risk than other areas. These results show that the land-use balance can be an essential factor in a water-centric adaptation to climate change. Ultimately, the water-centric nexus approach can make synergies by overcoming increasing water demands attributable to climate change.
1. Introduction
Since the first climate change study by Callendar [1], various such studies have been conducted. The motivation for further climate change research has continued to evolve with the IPCC Assessment Reports, the adoption of the Paris Agreement, and the acceleration of climate change itself [2,3]. Climate change has inherent multidisciplinary characteristics, and the future predictions of a single field of study has limits [4,5]. In particular, risks in one area are often transferred to another, and recently, experts have tried to adopt a nexus approach to respond to and supplement such occurrences [6,7,8]. Several types of nexus approach, such as water-food-energy, have emerged, and these multidirectional linkages contribute to the impact of climate change and set the direction of adaptation [6,7]. However, most studies dealt with policy and theoretical design or understanding the linkage using statistical indicators [6,9,10]. In other words, research on climate change adaptation through an empirical nexus approach, such as the use of physical models, is continuously needed.
Most climate change-related disasters or large-scale events are caused by hydrological changes, such as droughts and floods [11,12]. For instance, the Korean Peninsula experienced heavy flooding and landslides in 2011 because of record heavy torrential rains [13] and record droughts for 2014 to 2015 and 2017, which led to a shortage of agricultural water [14,15]. Such hydrological changes can affect different areas, such as agriculture, manufacturing, and settlement environments, and the importance of water will increase around the world [16,17].
The incorporation of water-related adaptations to climate change requires understanding of the supply and demand of water. In terms of terrestrial ecosystems, agriculture has the largest water demand and forests are the largest source [18]. The hydrological changes caused by climate change can affect this supply–demand balance [19,20]. In North Korea, the supply–demand balance of such water has collapsed in the past because of deforestation [21], and the Korean Peninsula is expected to experience increased agricultural droughts attributable to climate change [22,23].
The assessment of water supply and demand requires a developing model that can produce estimates in spatial units. The agricultural sector has used crop models to estimate crop productivity and related variables based on climate and agricultural management, such as the Environmental Policy Integrated Climate (EPIC) model, the Decision Support System for Agrotechnology Transfer (DSSAT), and the Agricultural Production Systems sIMulator, to estimate crop water demand or irrigation requirements [24,25]. Lim et al. [25] predicted virtual water of crops according to climate change in the Korean Peninsula through the EPIC model. Yoon and Choi [26] simulated crop water requirements according to climate change in South Korea through the DSSAT model. They predicted that the amount of precipitation increased; however, the water required would increase owing to a decrease in effective precipitation during the growing season.
In terms of forest sectors, hydrological models, such as the Soil and Water Assessment Tool (SWAT) and the Integrated Valuation of Ecosystem Services and Tradeoffs (InVEST), can determine the amount of water supplied from forest areas [27,28]. Although forest hydrological future climate change studies were not conducted on the Korean Peninsula, Yu et al. [29] analyzed the future forest water supply of China as a SWAT model. Additionally, Kim et al. [27] used InVEST to estimate forest water supply considering past climate change in South Korea. These cases show the effectiveness of EPIC and InVEST in terms of applicability to the Korean Peninsula, implying that highly connected research between several sectors is required. The use of these models and the nexus approach can facilitate directional changes to adapt to climate change.
In this study, a water-centric nexus approach of agriculture and forest is proposed for an improved response to climate change in the Korean Peninsula. To this end, two spatially explicit models i.e., EPIC and InVEST to evaluate the changes in agricultural water demand and forest water supply in current and future climate conditions are used. We focus on assessing the water supply–demand balance at the watershed level in the Korean Peninsula, and its modification attributable to climate change. Ultimately, it is expected that these efforts will contribute to the enhancement of water-related adaptation to climate change.
2. Data and Methods
2.1. Study Area
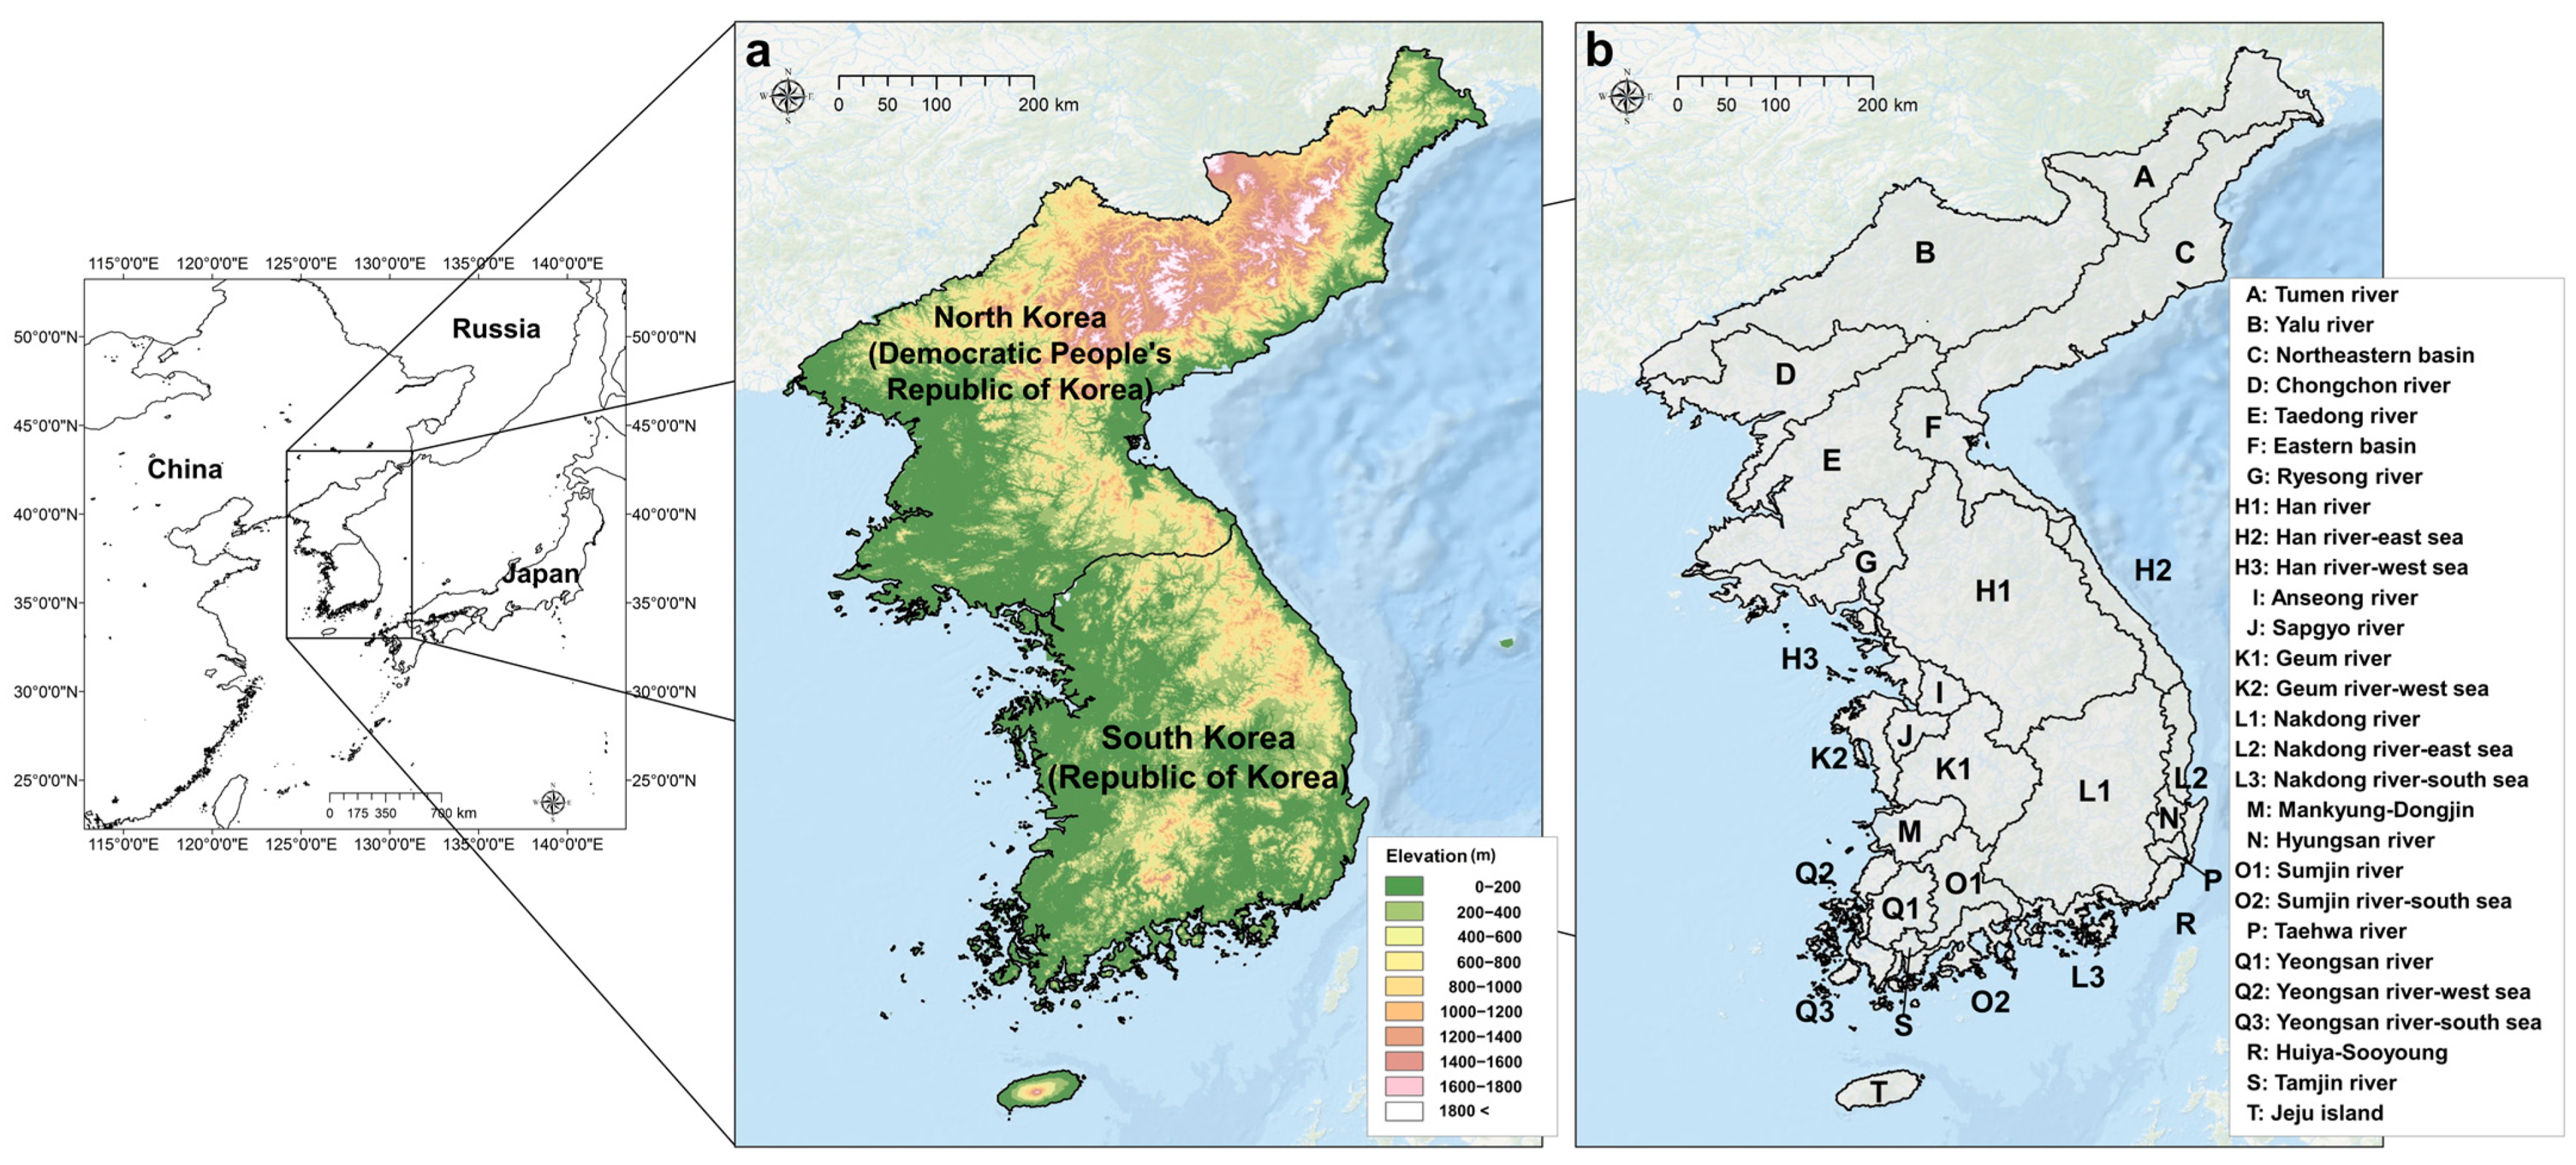
Our study examined the entire Korean Peninsula, which consists of the Republic of Korea (hereafter called South Korea) and the Democratic People’s Republic of Korea (hereafter called North Korea). The territorial area of the Korean Peninsula includes the land between the latitudes of 33.23° N and 43.01° N and the longitudes of 124.14° E and 130.93° E (Figure 1). Located in a temperate monsoon climate zone, the Korean Peninsula has hot humid summers and cold dry winters. The annual average temperature in this region is 10–16 °C, and the annual precipitation is approximately 1000–1400 mm [26]. Because the Korean Peninsula is located in the mid-latitude, a region highly affected by climate change, the increase in temperature and variability in precipitation is expected to increase significantly [23,25]. If the current greenhouse gas emission continues, the average temperature will rise by 7 °C at the end of the 21st century and the precipitation will increase by 14%; however, drought is also expected to increase significantly [30]. Geographically, a wide range of plains is distributed in the western regions, and mountainous areas are formed by the Taebaek Mountains and the Kaema Plateau in the eastern and northern regions, respectively [25,31].
The Korean Peninsula has an area of 221,000 km2, of which 55,000 km2 is occupied by croplands. Approximately 20,000 km2 of such croplands is in South Korea, and the remaining 35,000 km2 is in North Korea. The cropland areas in North Korea have increased significantly in the past two decades [32,33] as a result of the food shortages in the 1990s, which resulted in rapid deforestation as a response [33]. Topographically, many forest areas exist in the eastern mountainous region, and the proportion of cropland increases toward the western and southern regions. However, in terms of land use by watershed, the small western coastal watershed has a relatively low forest ratio, and watersheds located in North Korea have a low ratio of the forest than cropland and high grassland (Table S1).
Rice cultivation is the most popular agricultural activity, which accounts for approximately 50% of the croplands in the Korean Peninsula [19,34], as rice is a traditional staple food in both countries. Although temperate forests dominate in the temperate climate of the Korean Peninsula, there are also subtropical evergreen forests on the southern coasts and subalpine forests distributed in the mountainous regions [31]. In North Korea, the Tumen River and Yalu River, which originate from Mt. Baekdu, form a large basin, whereas the Chongchon River and Taedong River supply most of the water to the western plains [21]. In South Korea, the Han River and Nakdong River are the largest basins, with most of the large rivers flowing into the western and southern plains.
Although South Korea and North Korea have similar natural environments, approximately 70 years of division between the two countries has resulted in significant socioeconomic differences.
2.2. Method
2.2.1. The Concept of Water-Centric Nexus and Spatiotemporal Setting
The proposed water-centric nexus approach is attributed to the water–food–ecosystem nexus to respond to climate change [35,36]. Because the connecting link between forest ecosystems and food is in “water”, our study is directed toward a water-centric empirical nexus. Here, water connects agriculture and forests and becomes the main component of the nexus affected by land use and climate. Therefore, our water-centric nexus approach covers water supply and demand for forests and croplands, the two largest land covers in the terrestrial ecosystems of the Korean Peninsula and the world as per the water–food–ecosystem nexus perspectives [37]. Forests are the largest source of water in the terrestrial ecosystem, and it has been confirmed that the flow of water through forests can be dealt with in terms of supply [21,27]. However, croplands, which are the most used landscape of water, can be addressed in terms of water demand. Therefore, forests and croplands are used as supply and demand, respectively, to assess the current and future water supply–demand balance changes.
For the water-centric nexus approach, the main watershed of the Korean Peninsula is used as a basic space unit of the nexus, which is an area where water is collected geographically, making it appropriate to assess water-centric balance and its related changes. The balance between forest water supply and agricultural water demand in the watershed can be assessed, and adaptation measures can be derived through changes in the balance resulting from climate change (Figure 2). This is a simplified evaluation compared with the process of estimating numerical values with a physical model, but it suggests a new approach to address the increasing demand for water resources in terms of adapting to climate change. In particular, this approach can identify the potential of forest water resources in terms of supply. It can also assess the potential of creating synergy between the two major land covers in the spatial unit of the watershed. However, for agricultural water demand, a wide variety of crops that are grown in the peninsula are not taken into account. The research was conducted by assuming the cultivation of rice on the entire cropland, which is the representative food crop of the Korean Peninsula.
This study covered three periods: the baseline period, the near future, and the far future. The baseline period was from 1981 to 2010. The near and far future were denoted as the 2050s and 2070s, respectively, which were obtained by averaging results from 2041 to 2060 and from 2061 to 2080 for the former and latter, respectively. In terms of space units, the entire Korean Peninsula was set at a spatial resolution of 1 km2, and whole forests and cropland covers were evaluated. Although some weather data had a coarser spatial resolution, they were given a spatial resolution of 1 km2 to determine the spatial difference and quantification of water supply and demand. Previous research also indicated that a spatial resolution of 1 km2 was appropriate for agriculture and forestry in studies of the Korean Peninsula [23,31].
2.2.2. Model and Input Data Description for the Agriculture Sector
EPIC is an extensively used global crop model developed in the United States [38]. The EPIC crop model is widely used in estimating crop productivity and other variables relevant to the overall agricultural environment, such as water use, soil carbon, hydrological cycle, and nitrogen cycle [39,40]. It has been used universally to estimate changes in regional and global agricultural conditions in Europe, Asia, and the United States [41,42]. In particular, recent studies related to changes in agricultural production and water use in the Korean Peninsula attributable to climate change [25,43,44] as well as studies related to changes in the agricultural environment caused by deforestation in North Korea have also used the EPIC model [21,33]. In this study, the EPIC0810 version was used.
The EPIC model converts the required crop growth from daily meteorological energy and biomass growth in a simulation [38]. The daily potential biomass growth is calculated using climate parameters, such as biomass–energy conversion rates and solar radiation for individual crops. Factors related to plant stress (nutrient level, temperature, water, salinity, and aeration) operate daily and reduce the potential biomass. Eventually, crop yields are simulated based on the crop harvest index and actual biomass accumulation [45].
The EPIC model has been used in a number of studies on the Korean Peninsula and East Asia to estimate crop productivity and water use [21,25,42]. In the present study, the calibrated model methodology of Lim et al. [25] and Lim et al. [21] was adopted for the estimation of rice production and water demand. This methodology has been previously applied to the Korean Peninsula. Accordingly, the harvest index was set to 0.55, the biomass–energy ratio was 30 kg MJ−1, the base temperature was 10 °C, the optimal temperature was 25 °C, and the potential heat unit (PHU) was 1300–1500 °C, which was based on the climate experienced in the specific grid level [21,25,44].
Rice needs an extensive irrigation system. Thus, it is the optimal crop to calculate the water demand for croplands. The EPIC model can be used to calculate the amount of irrigation water for specific irrigation settings by each crop. In our research, the crop irrigation requirement calculated by the EPIC crop model was defined as the “agricultural water demand”. For estimating the total amount of water required for maximum crop production, the irrigation setting was “optimal irrigation”.
In terms of input data, daily meteorological data and monthly statistical data are required as inputs for the EPIC model. Six meteorological variables are necessary from the daily weather data: minimum temperature, maximum temperature, precipitation, solar radiation, wind speed, and relative humidity (Table 1).
The meteorological data were acquired from the online portal system for the climate data of the Korean Meteorological Administration, and 102 weather stations were used from 1981–2010. The variables were determined for points without any records, by applying the Kriging and inverse distance weighted (IDW) interpolation techniques for a 1 km2 spatial resolution. From previous interpolation comparison studies, the Kriging method was applied to interpolate the maximum and minimum temperatures; the IDW method was used to interpolate precipitation, wind speed, relative humidity, and solar radiation [19,46,47]. Two representative climate change scenarios were selected to estimate future agriculture water demand: representative concentration pathways (RCPs) of 4.5 and 8.5. This study used data from the HadGEM2-AO global climate model (GCM) and the HadGEM3-RA regional climate model, developed by the Hadley Centre for Climate Prediction and Research. The climate model data for the study area were acquired through the Coordinated Regional Climate Downscaling Experiment–East Asia. Originally, future climate data from HadGEM2-RA used a 12.5 km2 spatial resolution. However, for this study, the data were resampled with a spatial resolution of 1 km2 using the nearest neighbor methodology considering the small patch characteristics of Korean croplands. Although an increased number of weather stations or forecasting data are required throughout the Korean Peninsula to interpolate the 1 km2 grid, it was applied with the highest-resolution data available owing to the difficulties in acquiring data from South and North Korea. Despite these limitations, the meteorological data were interpolated at a 1 km2 spatial resolution to verify uniformity and consider agricultural specifics.
The PHU data represent cumulative columns where plants can reach maturity obtained for each grid using the PHU calculator of the Blackland Research Center [48]. The PHU used in the simulation also reflected the difference between the average and crop-specific base temperatures for the growing season [49].
The EPIC crop model requires diverse soil-related parameters such as pH, bulk density (t m−3), cation exchange capacity (cmol kg−1), OC (%), electrical conductivity (mS cm−1), sand (%), and silt (%). These can be acquired from the Digital Soil Map of the World [50] and spatially modified using the International Soil Reference and Information Centre–World Inventory of Soil Emission database [51].
The amounts of irrigation water and fertilizer required for each area and crop were simulated to determine the spatiotemporal differences in the required amounts. Owing to the regional variance in planting and harvest dates, these periods were automatically allotted based on local climate conditions by setting the first planting start date, which considers the agricultural practices in the Korean Peninsula. The first farming start date for rice was set to 1 March.
2.2.3. Model and Input Data Description for the Forest Sector
The InVEST model is an effective instrument for spatially quantifying ecosystem functions and services. Since its development in the United States [52], it has been widely applied at the regional scale and in many countries, such as South Korea [27,53] and North Korea [21]. The InVEST model covers diverse ecosystem functions and contains dozens of submodels, such as water yield, habitat quality, carbon storage, and sequestration, marine water quality, and timber production.
This study used the water-yield submodel of InVEST (InVEST-WY) to calculate the water supply of forests in the Korean Peninsula. The annual water yield was estimated on each grid in the whole study area using InVEST-WY. In this study, the annual water yield by forests was defined as the “forest water supply”. Equation (1) followed the Budyko curve, which can simulate grid-based water supply Y(x) using several variables such as average annual precipitation. Here, P(x) represents the annual precipitation in a pixel, and AET(x) denotes the actual annual evapotranspiration of a pixel. Using Equation (2), the model can estimate the amount of water loss through evapotranspiration. From Equations (3) and (4), the porous ratio w(x) under the seasonality factor Z and the potential evapotranspiration to precipitation R(x) ratio were calculated. The final AET(x) was obtained using Equation (5) [52].
The main factors in InVEST-WY that can be used for output calibration to reflect regional characteristics are Z (seasonality constant) and Kc (coefficient). First, the seasonality constant Z was calculated by 0.2 × N, where N represents the average number of rainy days (>1 mm d−1) per year during the study period [54,55]. The value of N was calculated as ~80 from the dataset of the Korean Meteorological Administration, and Z was calculated as ~16. Kc is listed in the biophysical table of InVEST model. It is used to estimate actual evapotranspiration, reflecting the water used by plants. Kc for forested areas was set to 0.77 based on a recent study on forest Kc coefficients in South Korea [56]. Other factors of the biophysical table were applied to the non-adjusted value according to the InVEST model manual [52].
For simulating with InVEST-WY, six input data were required: potential evapotranspiration (PET), annual precipitation, plant available water content (AWC), depth-to-root restricting layer, watersheds, land use (Table 1). Additionally, two main components were also required such as seasonality factor, and biophysical table. These data represent the physical conditions, meteorological characteristics, and spatial attributes in each grid. The biophysical table, which includes data on land-cover types, species-specific Kc, and the maximum root depth by land-cover types, was used to simulate water yield [39]. The input data were constructed following the InVEST user guide. If some input data were not available to simulate the model in the Korean Peninsula, global data or the default dataset of the InVEST model was applied.
Meteorological data were collected from the climatologies at high resolution for the Earth’s land surface areas (CHELSA) data portal system [57] for the baseline and future periods. The annual precipitation was used directly, and the monthly maximum temperature, minimum temperature, average temperature, and solar radiation were used to estimate the PET. For the two future periods, two RCP scenarios (RCP4.5 and RCP8.5) were used from the HadGEM2-AO GCM. The CHELSA climate dataset provided various GCM data, such as HadGEM2-AO, and constructed with a spatial resolution of 30 arc-second. Thus it was reprocessed to 1 km2 using the nearest neighbor resampling technique.
The Hargreaves method was used to estimate the PET of the baseline and future periods. The Hargreaves equation is a temperature-based empirical method that was proposed in 1975 and modified in 1985 [58]:
where TD denotes the monthly temperatures range based on the minimum and maximum temperatures (°C), Ra is solar radiance (MJ m−2), and TC is the monthly average temperature (°C). The Hargreaves method has been described in previous literature [25,58]; therefore, it is not described herein.
The depth-to-root restricting layer represents the soil depth where the root penetration is inhibited by chemical and physical characteristics. No detailed spatial data exist for this parameter for the Korean Peninsula. Therefore, the maximum root depth dataset from Canadell et al. [59] was used for the categories of a coniferous tree (3.9 m), mixed forest (3.4 m), broadleaf trees (2.9 m), grass lands (2.6 m), and croplands (2.1 m). Based on these values, spatial depth-to-root data using spatial joins with adjusted land cover data proposed by Jeon et al. [60] were regenerated to assess forest ecosystem services. This approach was used to simulate the forest water supply of South Korea estimated by Kim et al. [27] and North Korea estimated by Lim et al. [21]. The AWC can be used to identify the pore-space ratio of plant soils determined by the soil porosities of sand, silt, and clay. North Korea does not disclose such data. Therefore, the soil map data by the Rural Development Administration (RDA) of South Korea [61] for the Korean Peninsula were used.
2.2.4. Validation
To calculate the water supply to the forests, accessing quantitative observations of water supply amount is impossible, and internal data are restricted. Therefore, this study employed the concept of water supply potential proposed by Kim et al. [27] for evaluation. The water supply potential is the difference between AET and the annual precipitation in forest areas. The annual precipitation is interpreted as the total amount of water input, and AET indicates the total amount of water used by the forest. Therefore, this difference refers to the maximum amount of water supply by forests [27]. The accuracy of the calculated water yield in forests was assessed using a simple linear regression model applied to the water supply potential.
To evaluate the estimated water demand by agriculture, statistical validation was conducted using the estimated irrigated rice yield and national statistics of rice production. Because agricultural water demand cannot be quantified by observation, the accuracy of water demand was evaluated using irrigated rice productivity. The data of rice yield per hectare for North Korea were obtained from the Food and Agriculture Organization Statistics (FAOSTAT). However, for South Korea, the data were obtained as local level statistics from the Korean Statistical Information Service (KOSIS). The accuracy of the estimated rice yield was assessed using a simple linear regression model.
2.3. Land-Cover Data
The 2010 Global Land Cover 30 (GLC30) dataset, developed by the National Geomatics Center of China, was used to extract the current agriculture and forest areas of the Korean Peninsula. The land cover of GLC30 has a spatial resolution of 30 m2 and includes 10 land-cover types based on Landsat 7 satellite imagery from 2010 [21,62]. The land-cover types include forests, cultivated lands, grasslands, shrublands, wetlands, water bodies, tundra, artificial surfaces, bare lands, and permanent snow and ice. The reported accuracy of the GLC30 dataset is 80% across most of the testing area; it is 97.2% across the Southeastern Canada testing area, which is comparable to the environment of the Korean Peninsula (Kappa coefficient: 0.950) [62]. The nearest resampling technique was used to resample the land cover data to a resolution of 1 km2 to spatially match the resolution of other input variables.
3. Results and Discussion
3.1. Evaluation of Model Performance in the Baseline Period
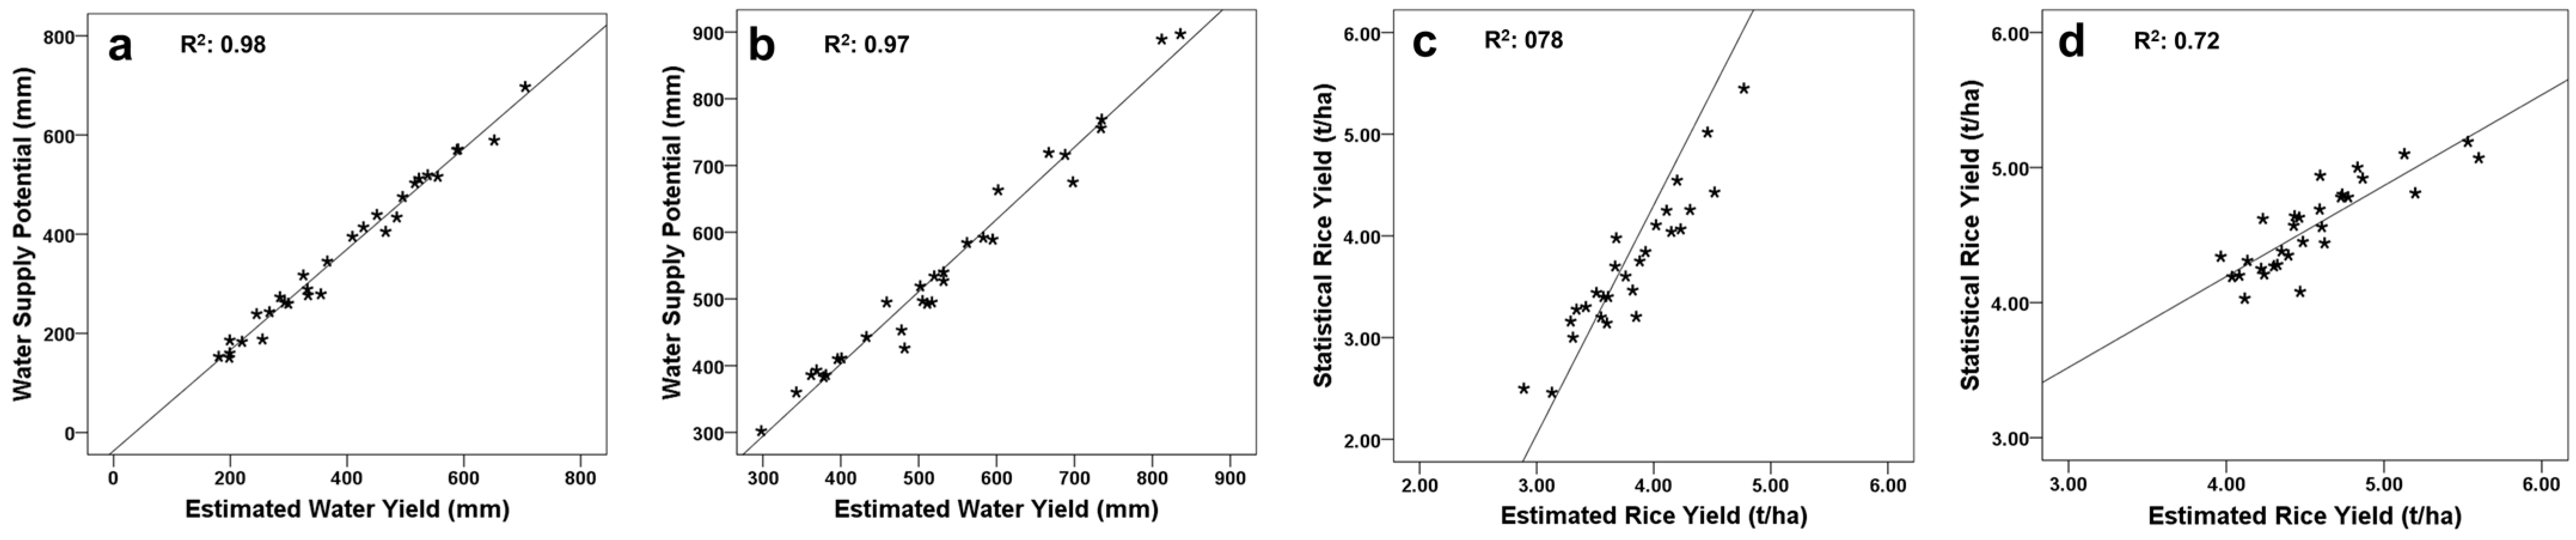
The two models accurately estimated forest water supply and irrigated rice yield in terms of the coefficients of determination. The water supply potential, calculated by annual precipitation and AET, and the estimated water supply from the forest are well fitted: the coefficients of determination for both North and South Korea are 0.98 and 0.97, respectively (Figure 3a,b).
The rice yield statistics and estimated rice yields data in this study estimated similar trends on productivity. The coefficient of determination based on the evaluation results for North Korea using FAOSTAT rice yield is 0.78 (Figure 3c), and the coefficient of determination using KOSIS based on the evaluation results for South Korea is 0.72. Both regions demonstrated high accuracy (Figure 3d). The agricultural water demand data were unavailable for validation and, therefore, the performance of the simulation model was evaluated indirectly by applying irrigated rice yields.
3.2. Assessment of Climate Change Impact on Crop Productivity and Agricultural Water Demand
3.2.1. Assessment of Climate Change Impact on Crop Productivity
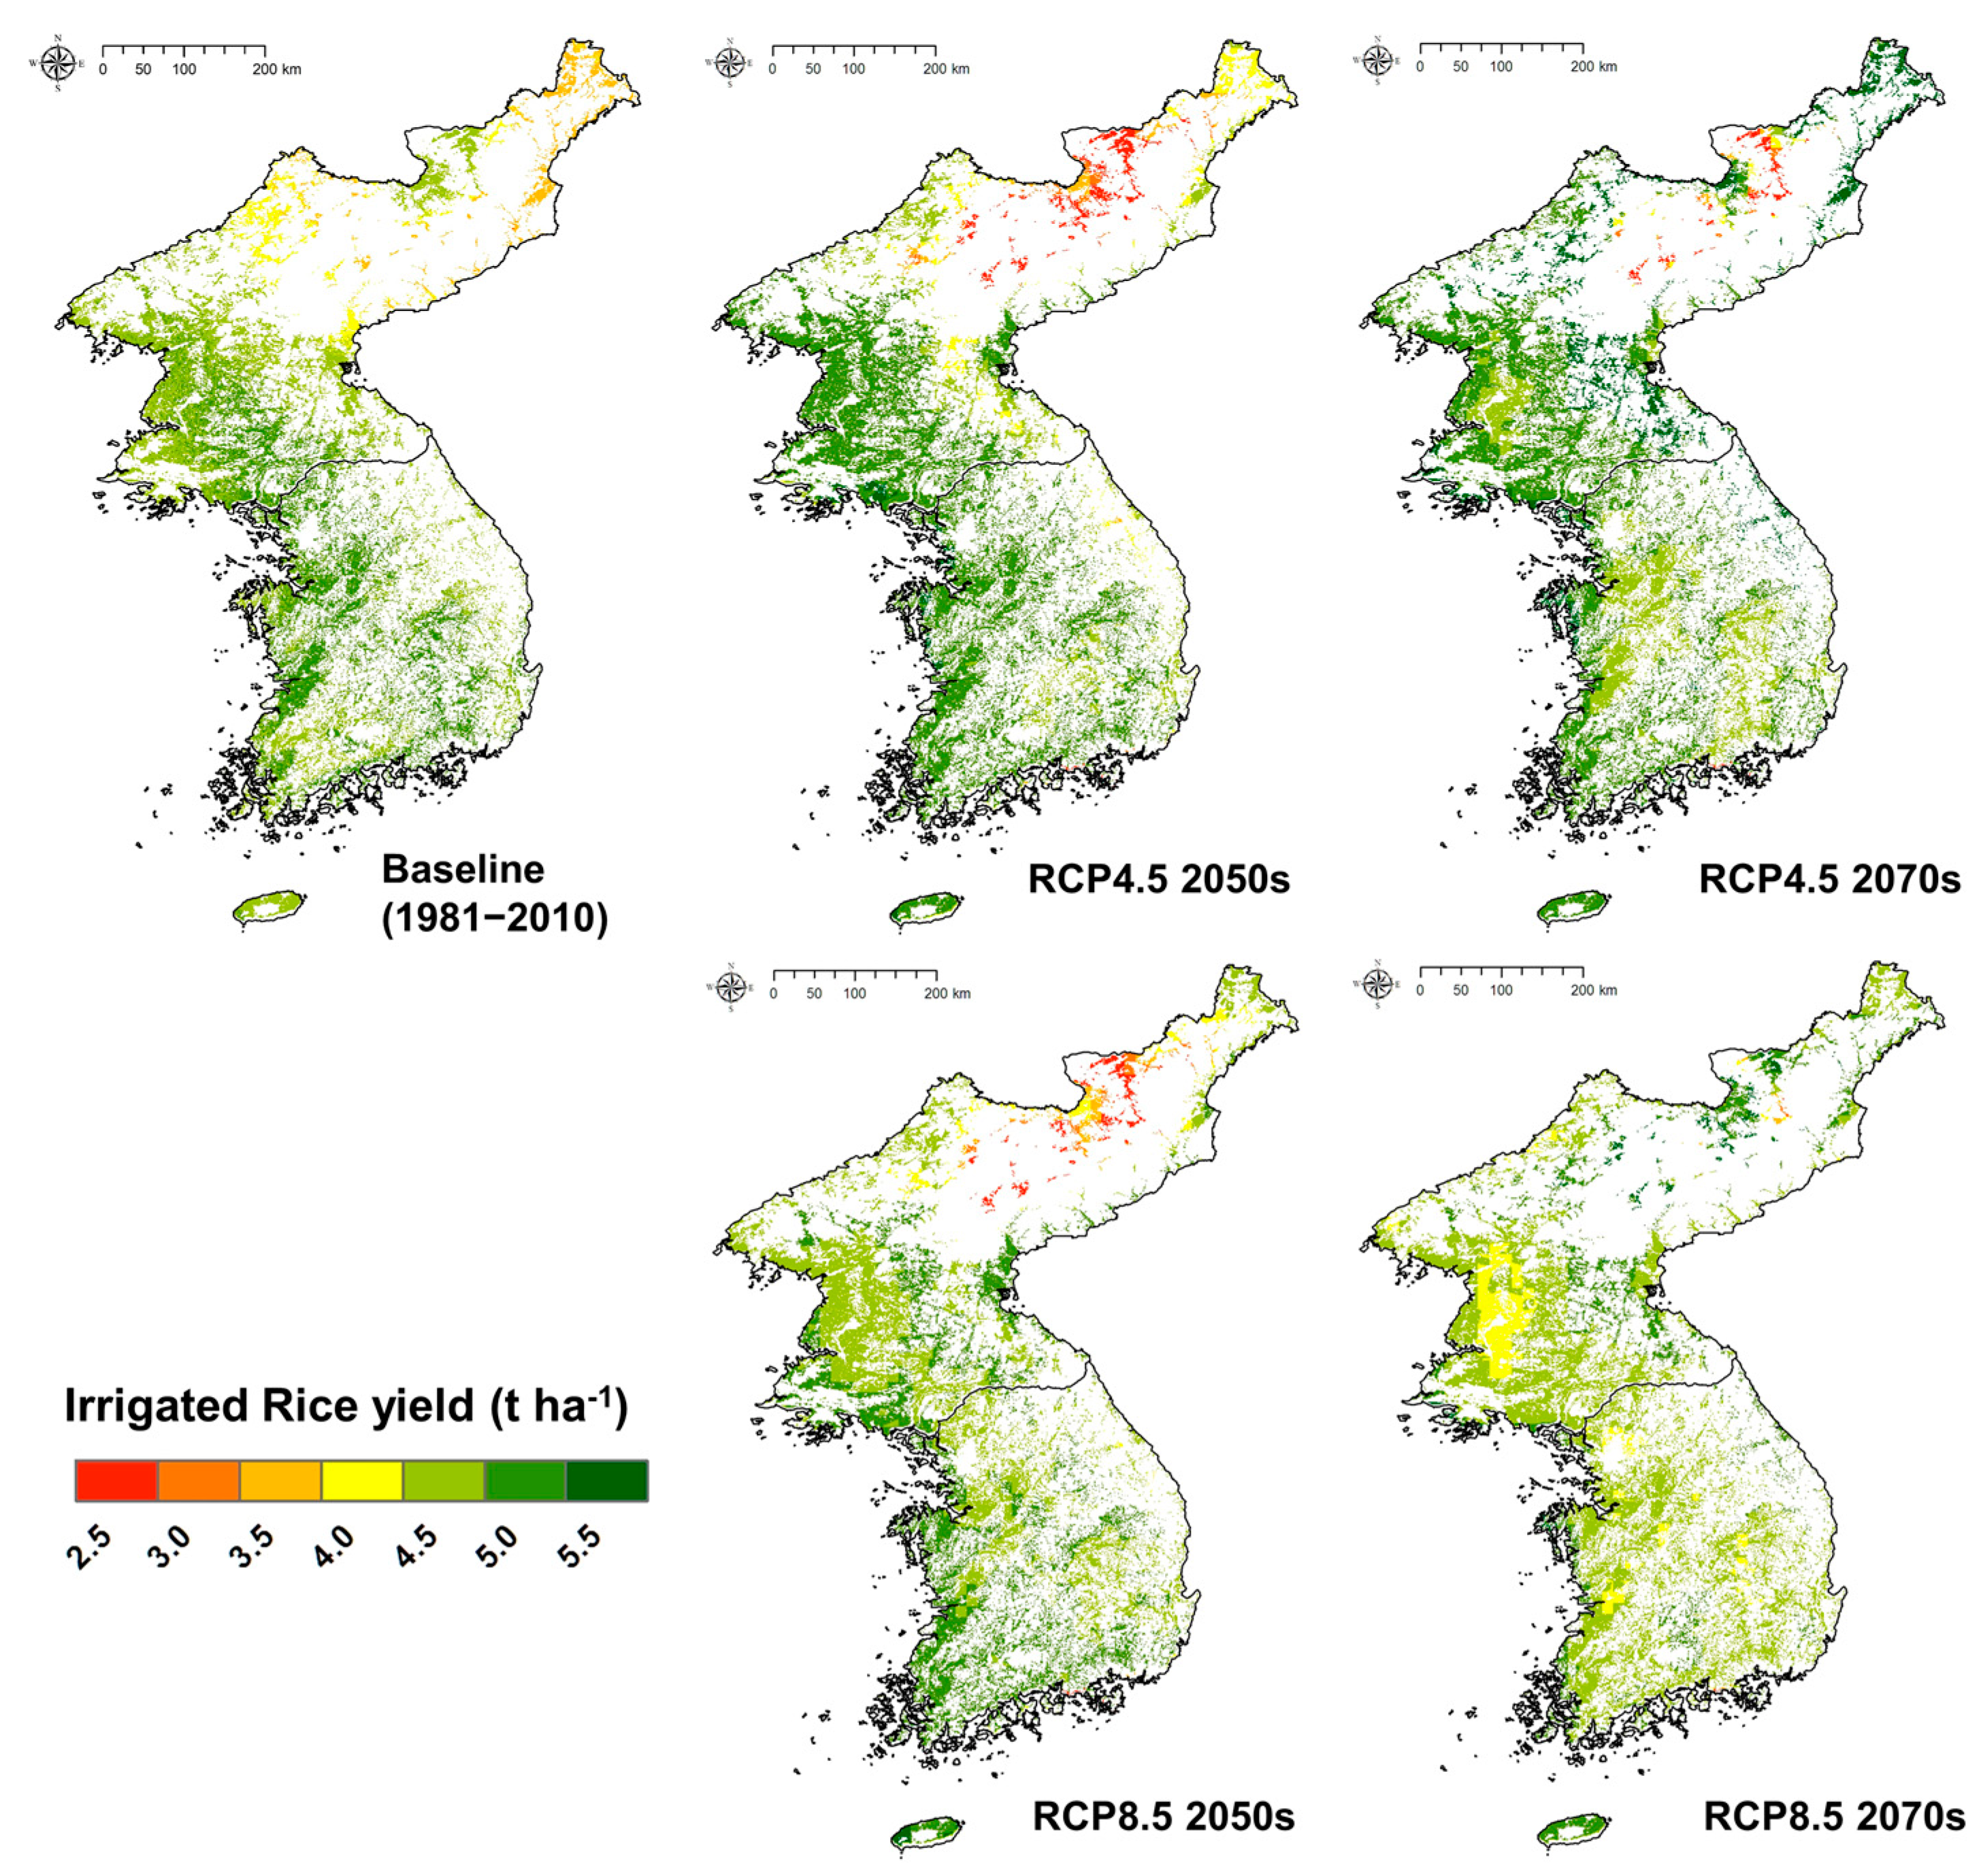
The irrigated rice yield was estimated to be 4–5 t ha−1 (Table 2), with overall high productivity in South Korea. The case of northeast North Korea, which is generally disadvantageous for rice production owing to low summer temperature, low precipitation, and high altitude showed relatively low productivity. (Figure 4). The two climate change scenarios generally had positive effects on irrigated rice production. In the RCP4.5 scenario, the productivity of the entire Korean Peninsula increased over time, whereas in the RCP8.5 scenario, it increased until the 2050s and decreased thereafter. This suggests that an increased temperature increases the land area suitable for cultivating rice and rice productivity, with irrigation compensating for any negative impacts on water-related balance. This trend is similar to previous studies on irrigated rice yields [25,63]. However, the spatial resolution of this study is higher than that of others, to observe detailed regional differences.
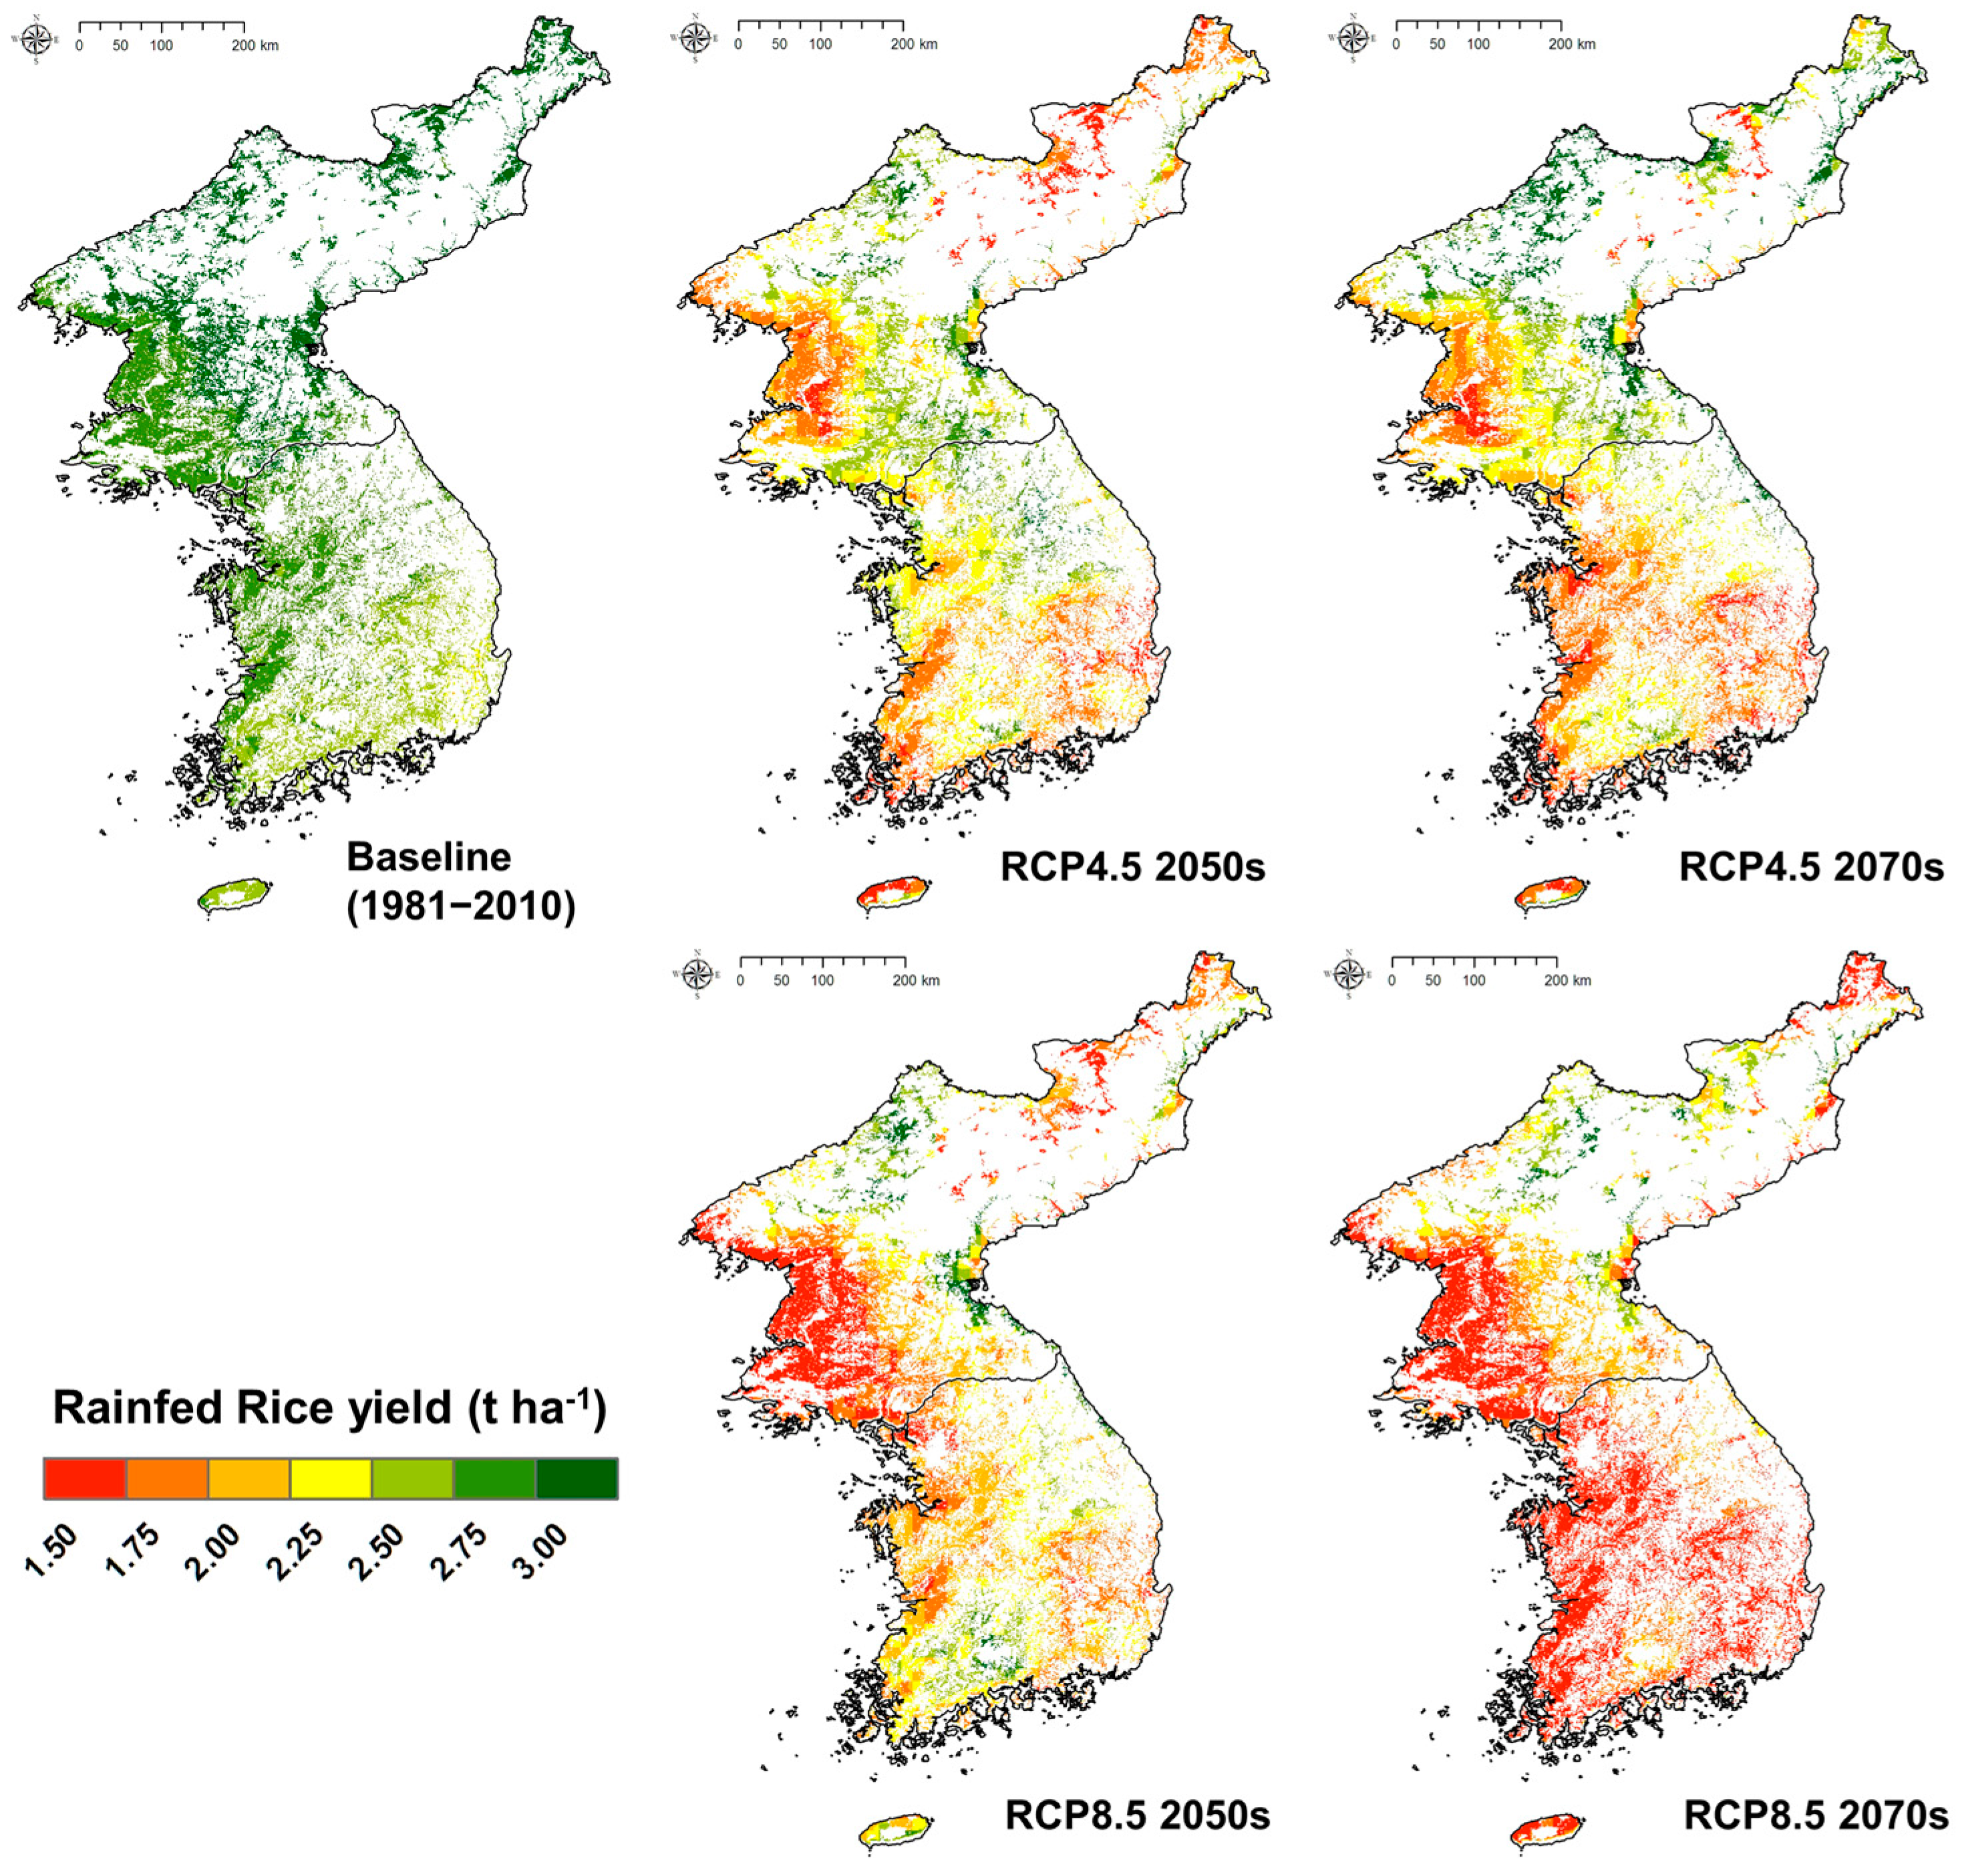
Rain-fed rice was directly affected by climate change. The baseline yield of rain-fed rice was only 60% of that of irrigated rice, but the yield was relatively uniform across the Korean Peninsula (Figure 5). In the RCP4.5 scenario for both the 2050s and 2070s, it was predicted that low-productivity areas would be widespread on the western coastal plains and in the southeastern regions, which are the main food-production zones in the Korean Peninsula. In the RCP8.5 scenario, a significant decrease was observed in the western plains of North Korea for the 2050s, and it was found that this decrease would expand to include the entire peninsula by 2070. Indeed, the temperature rise and associated increase in precipitation volatility are expected to cause significant damage to non-irrigated rice paddies. These results are remarkably similar to previous agriculture/drought cases for the same periods and areas [23], which suggests that they accurately reflect the impact of drought or disrupted water balance on productivity. In particular, the decline in productivity in the western plains is likely to be a major threat to food security. Therefore, more aggressive irrigation is required in the future.
3.2.2. Assessment of Climate Change Impact on Agricultural Water Demand
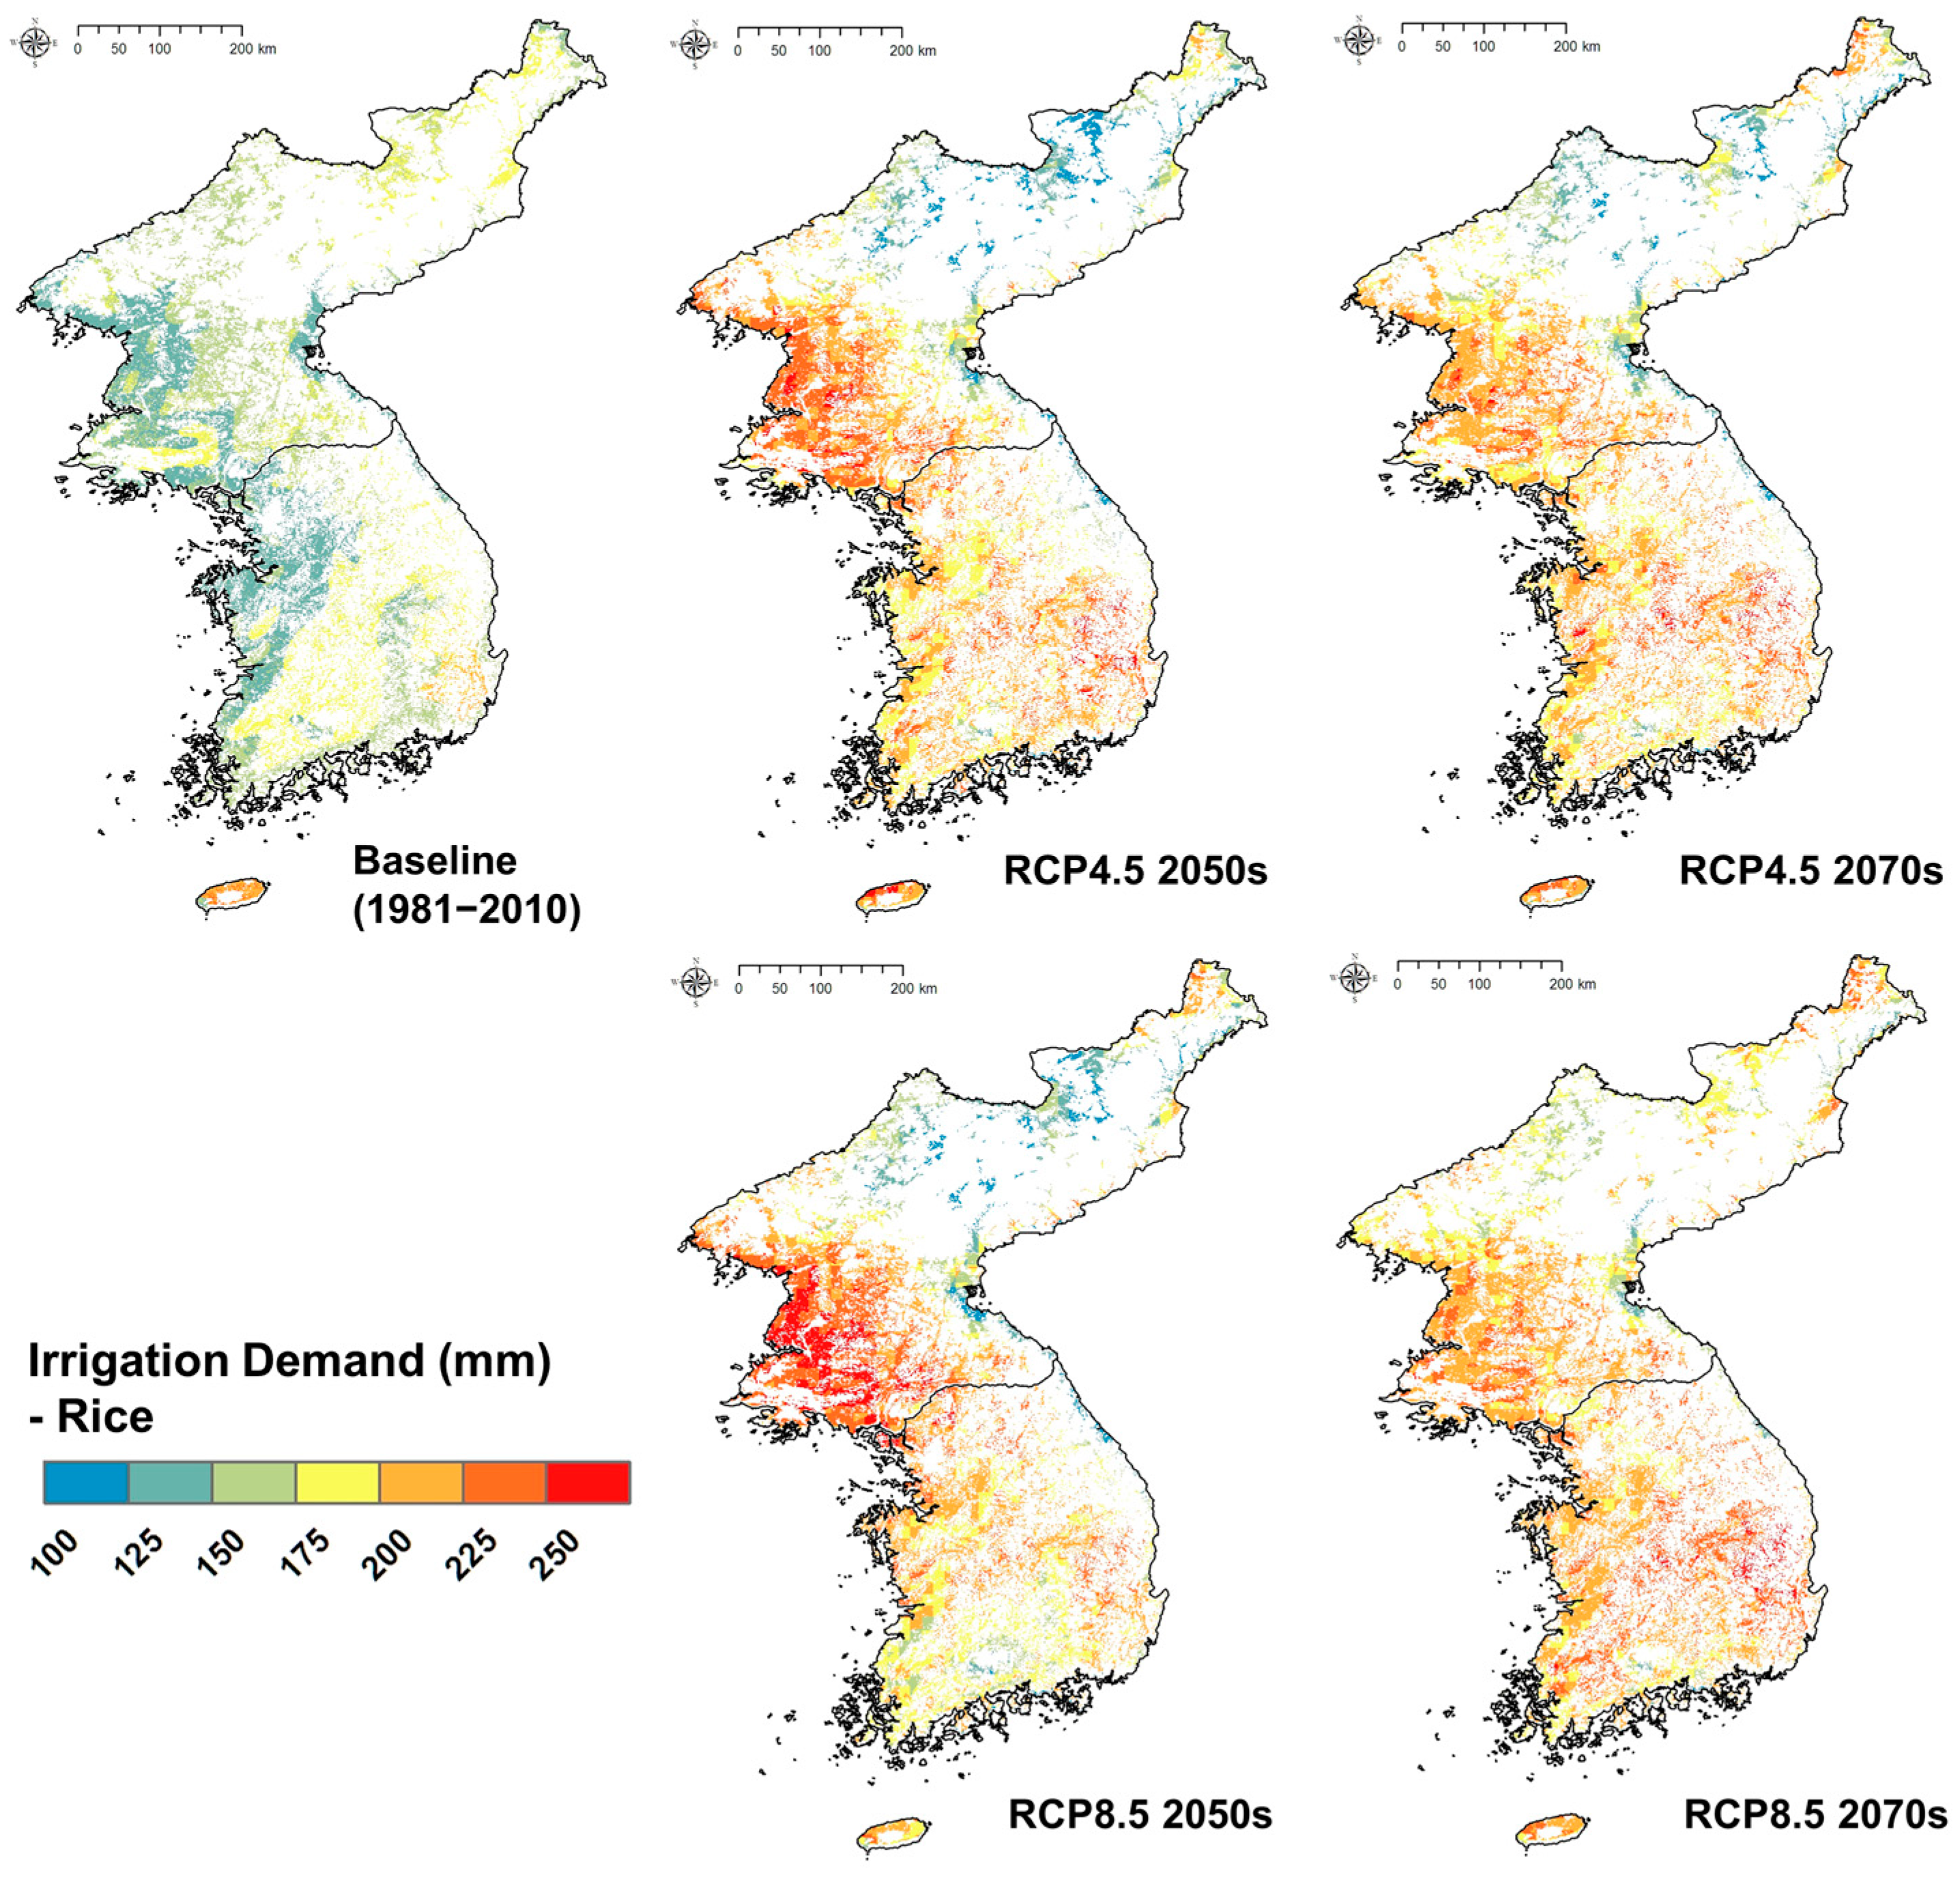
The baseline irrigation demand for rice for the peninsula ranges from 120 to 180 mm (Figure 6). This does not differ significantly between South and North Korea. Jeju Island, which is a volcanic island with highly permeable soil [64], has the highest demand. Each spatial grid imposes an average water demand of 136 mm y−1, and a total of 8943 million m3 y−1 of water is required for agriculture throughout the Korean Peninsula (Table 3). North Korea had 13% more water demand than South Korea because of its inherent larger cropland area.
The future irrigation demands are predicted to increase significantly, in general, for both climate change scenarios, with the demand being the highest under the RCP8.5 scenario. By the 2050s, local changes were obvious, and by the 2070s, nationwide changes were predicted (Figure 6). In the 2050s, there was a particularly dramatic increase in the irrigation demand in the western plains of North Korea, which would place a significant pressure on the water supply. In the RCP8.5 scenario for the 2070s, which is the highest demand period, the average water demand in each grid is 183 mm y−1, and a total water volume of 12,043 million m3 y−1 is required for agriculture throughout the Korean Peninsula (Table 3). This is an increase of approximately 35% compared with the baseline period, suggesting that climate change alone can lead to a large demand change without land-use change. When both countries were compared, the demands in North Korea and South Korea increased by 31% and 38%, respectively. This could be interpreted to mean that an increase in future irrigated rice yield (Section 3.2.1) is possible if it satisfies the condition on which the irrigation demand increased. The total precipitation increases under the RCP 4.5 and 8.5 scenarios [30]; however, this result shows that the effective precipitation during the crop growing season decreases due to increased precipitation variability. In the same context, Lim et al. [23] argued that agricultural drought in the Korean Peninsula would increase under the RCP scenario.
Under the RCP scenario, unexpectedly low demand was observed in the northeastern region of North Korea, which is unfavorable to rice production (Figure 6). This can be understood as a positive change in water demand as the temperature rises due to climate change. However, it is not easy for wide cultivation caused by rugged mountainous regions. Because the influence of heavy rains and the like moves north from the south, it is considered that the effect of hydrological disasters is less reflected. Although it is a positive result, the effectiveness of the actual cultivation should be evaluated from various angles because it was not an existing suitable area.
3.3. Assessment of Climate Change Impact on Forest Water Supply
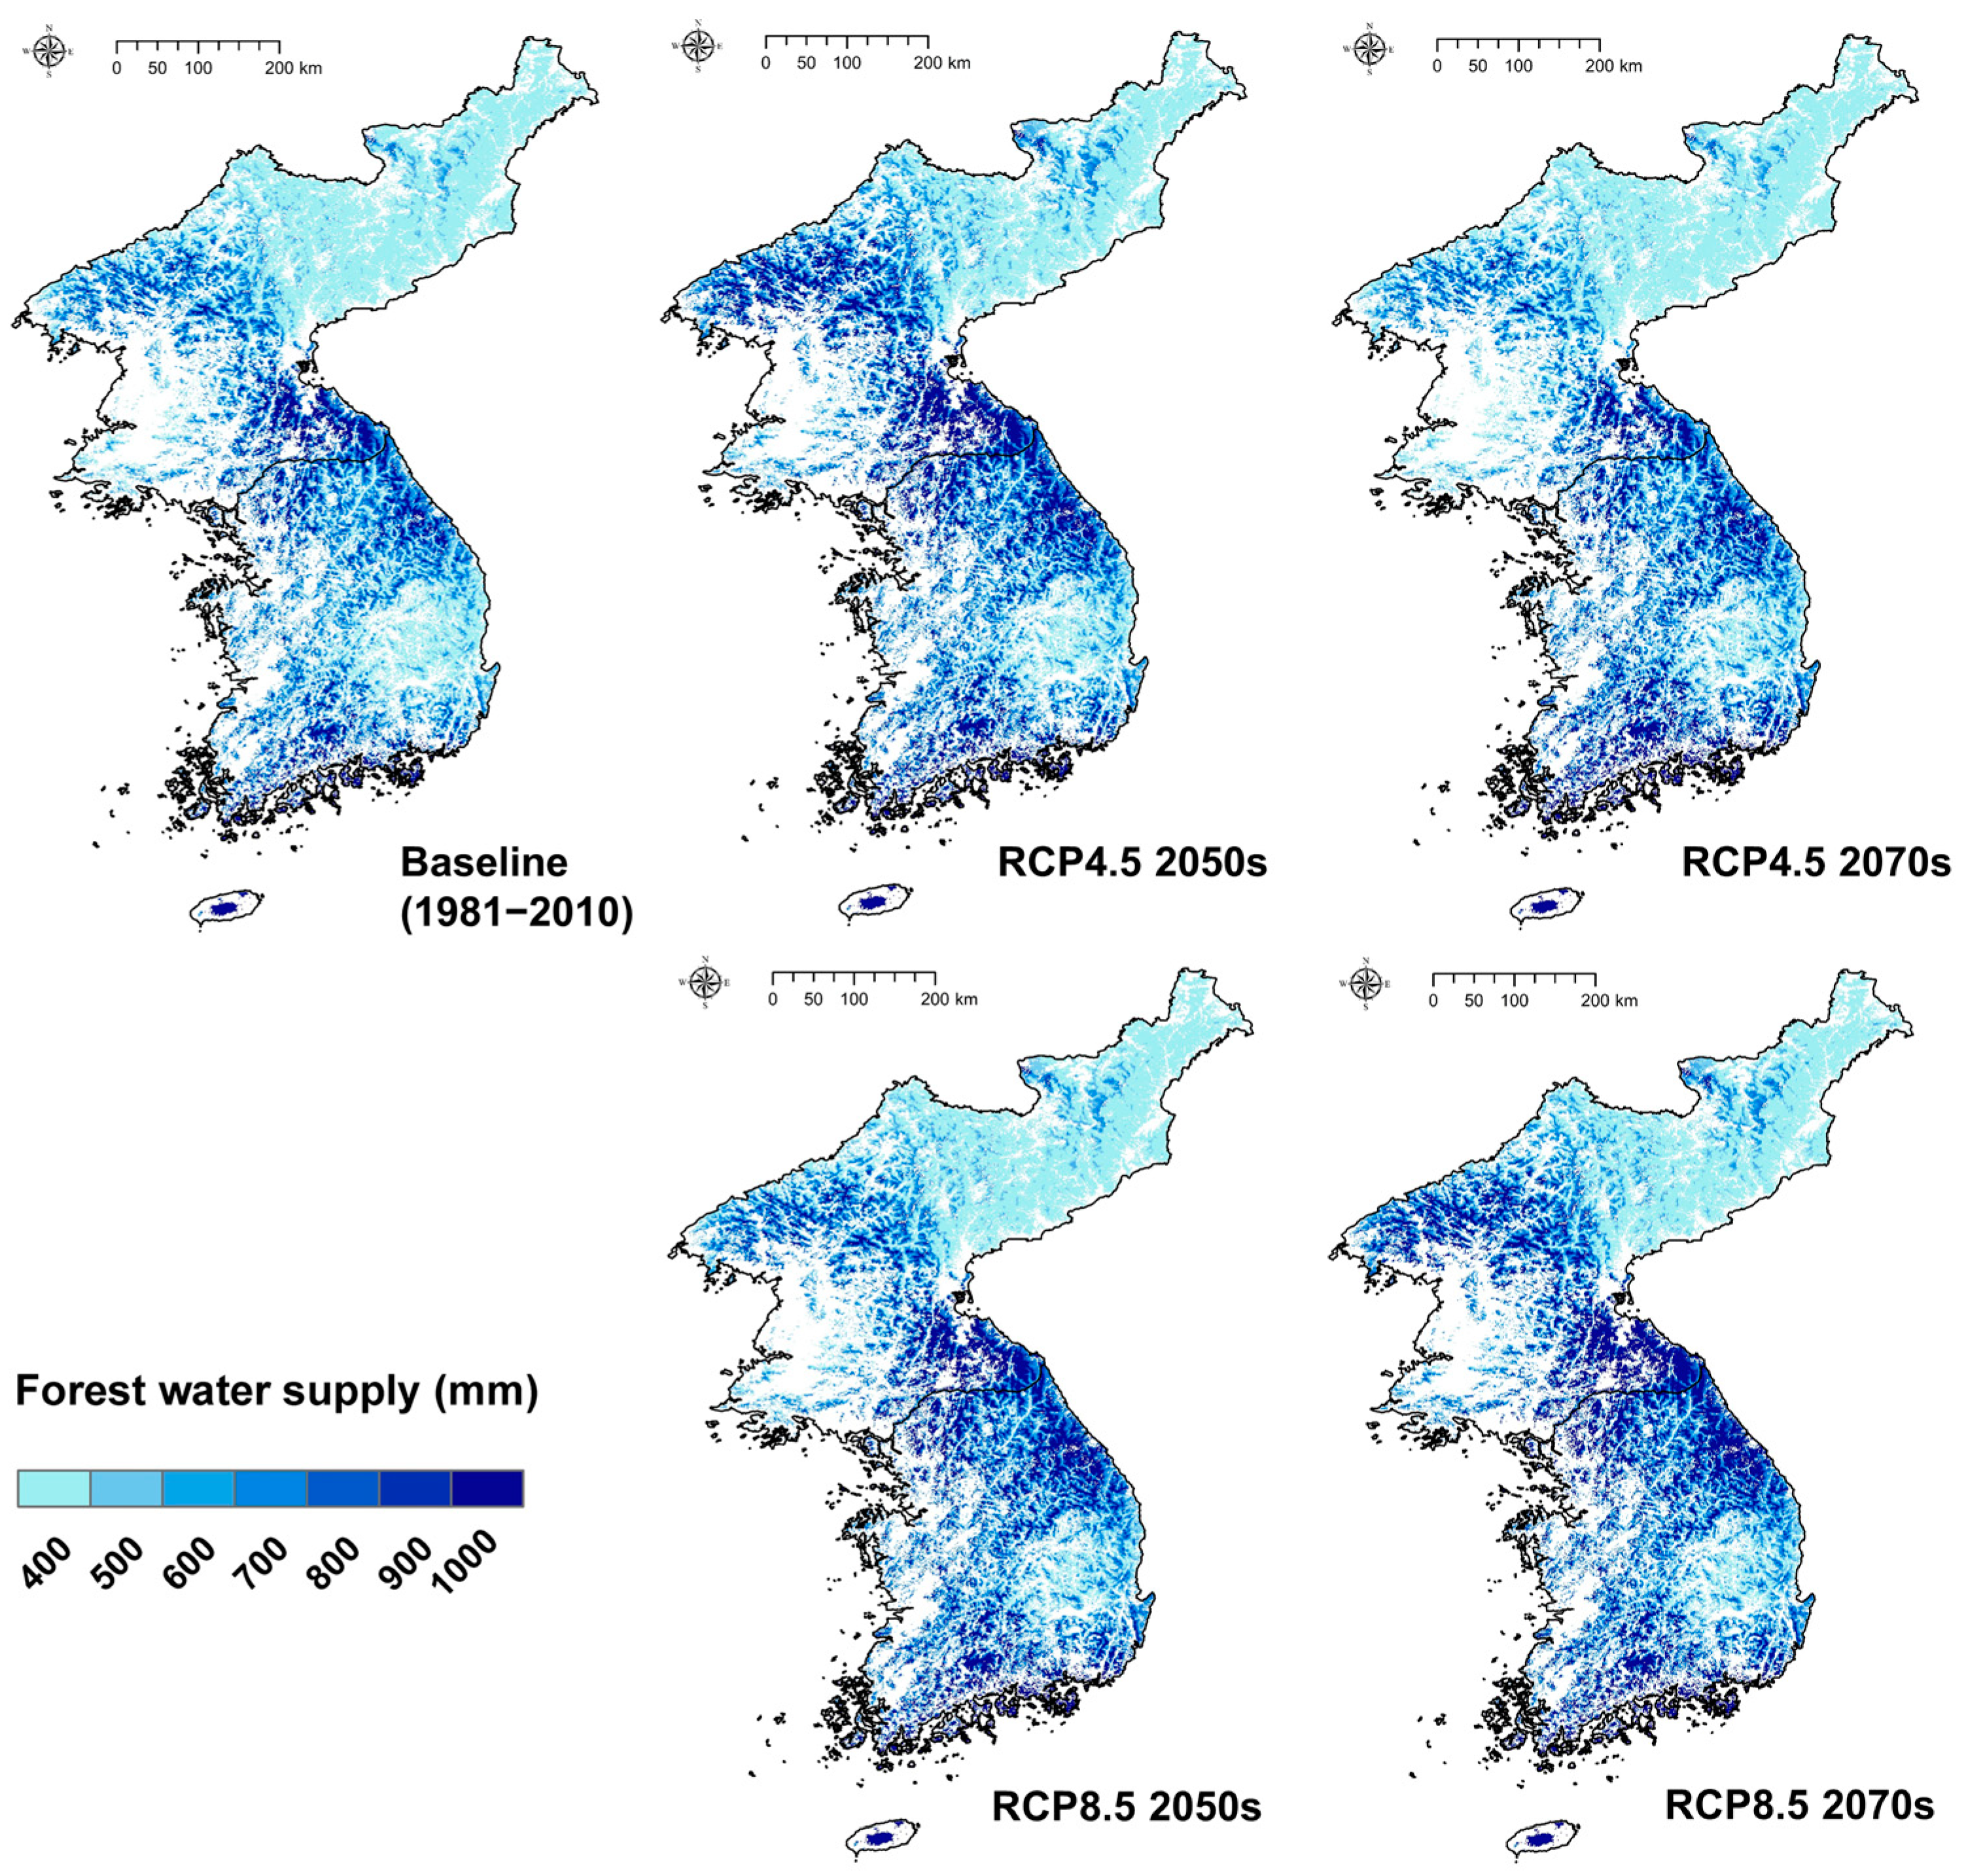
Estimates indicate that the overall water supply for the future climate scenarios will increase significantly (Figure 7). Although differences can be observed in the size of the increase, water supply is larger than the current baseline for all scenario and time-period combinations. This reflects a greater rise in precipitation compared with evapotranspiration in the Korean Peninsula due to climate change [65,66]. Currently, the total amount of water supplied by forests to the Korean Peninsula is 63,458 million m3 y−1, which is 81,208 million m3 y−1 in the 2070s for the RCP8.5 scenario (Table 3). This is approximately 28% higher than the baseline conditions. In the RCP4.5 scenario, water supply in the 2050s is expected to be higher than that in the 2070s, and in the RCP8.5 scenario, it increases even further.
In terms of geographical distribution, the higher water supply area expands northward over time (Figure 7). In the RCP8.5 scenario, most of North Korea produces levels similar to South Korea, except the northeastern region. However, in the North Korean areas where water supply increased, forests have remained devastated for the last 30 years [33]. This lack of forests can have a negative impact on the long-term water supply [21]. In South Korea’s Gyeongsang Basin and North Korea’s northeast regions, the water supply is currently relatively low, and this will remain the case compared with other regions.
Although the total forest water supply increases significantly because of the rise in total precipitation, in the present study, water supply is based on the annual hydrological cycle, so the total forest water supply amount can be interpreted as the potential water supply.
3.4. Assessment of Water Balance of Agricultural Water Demand and Forest Water Supply at the Watershed Level
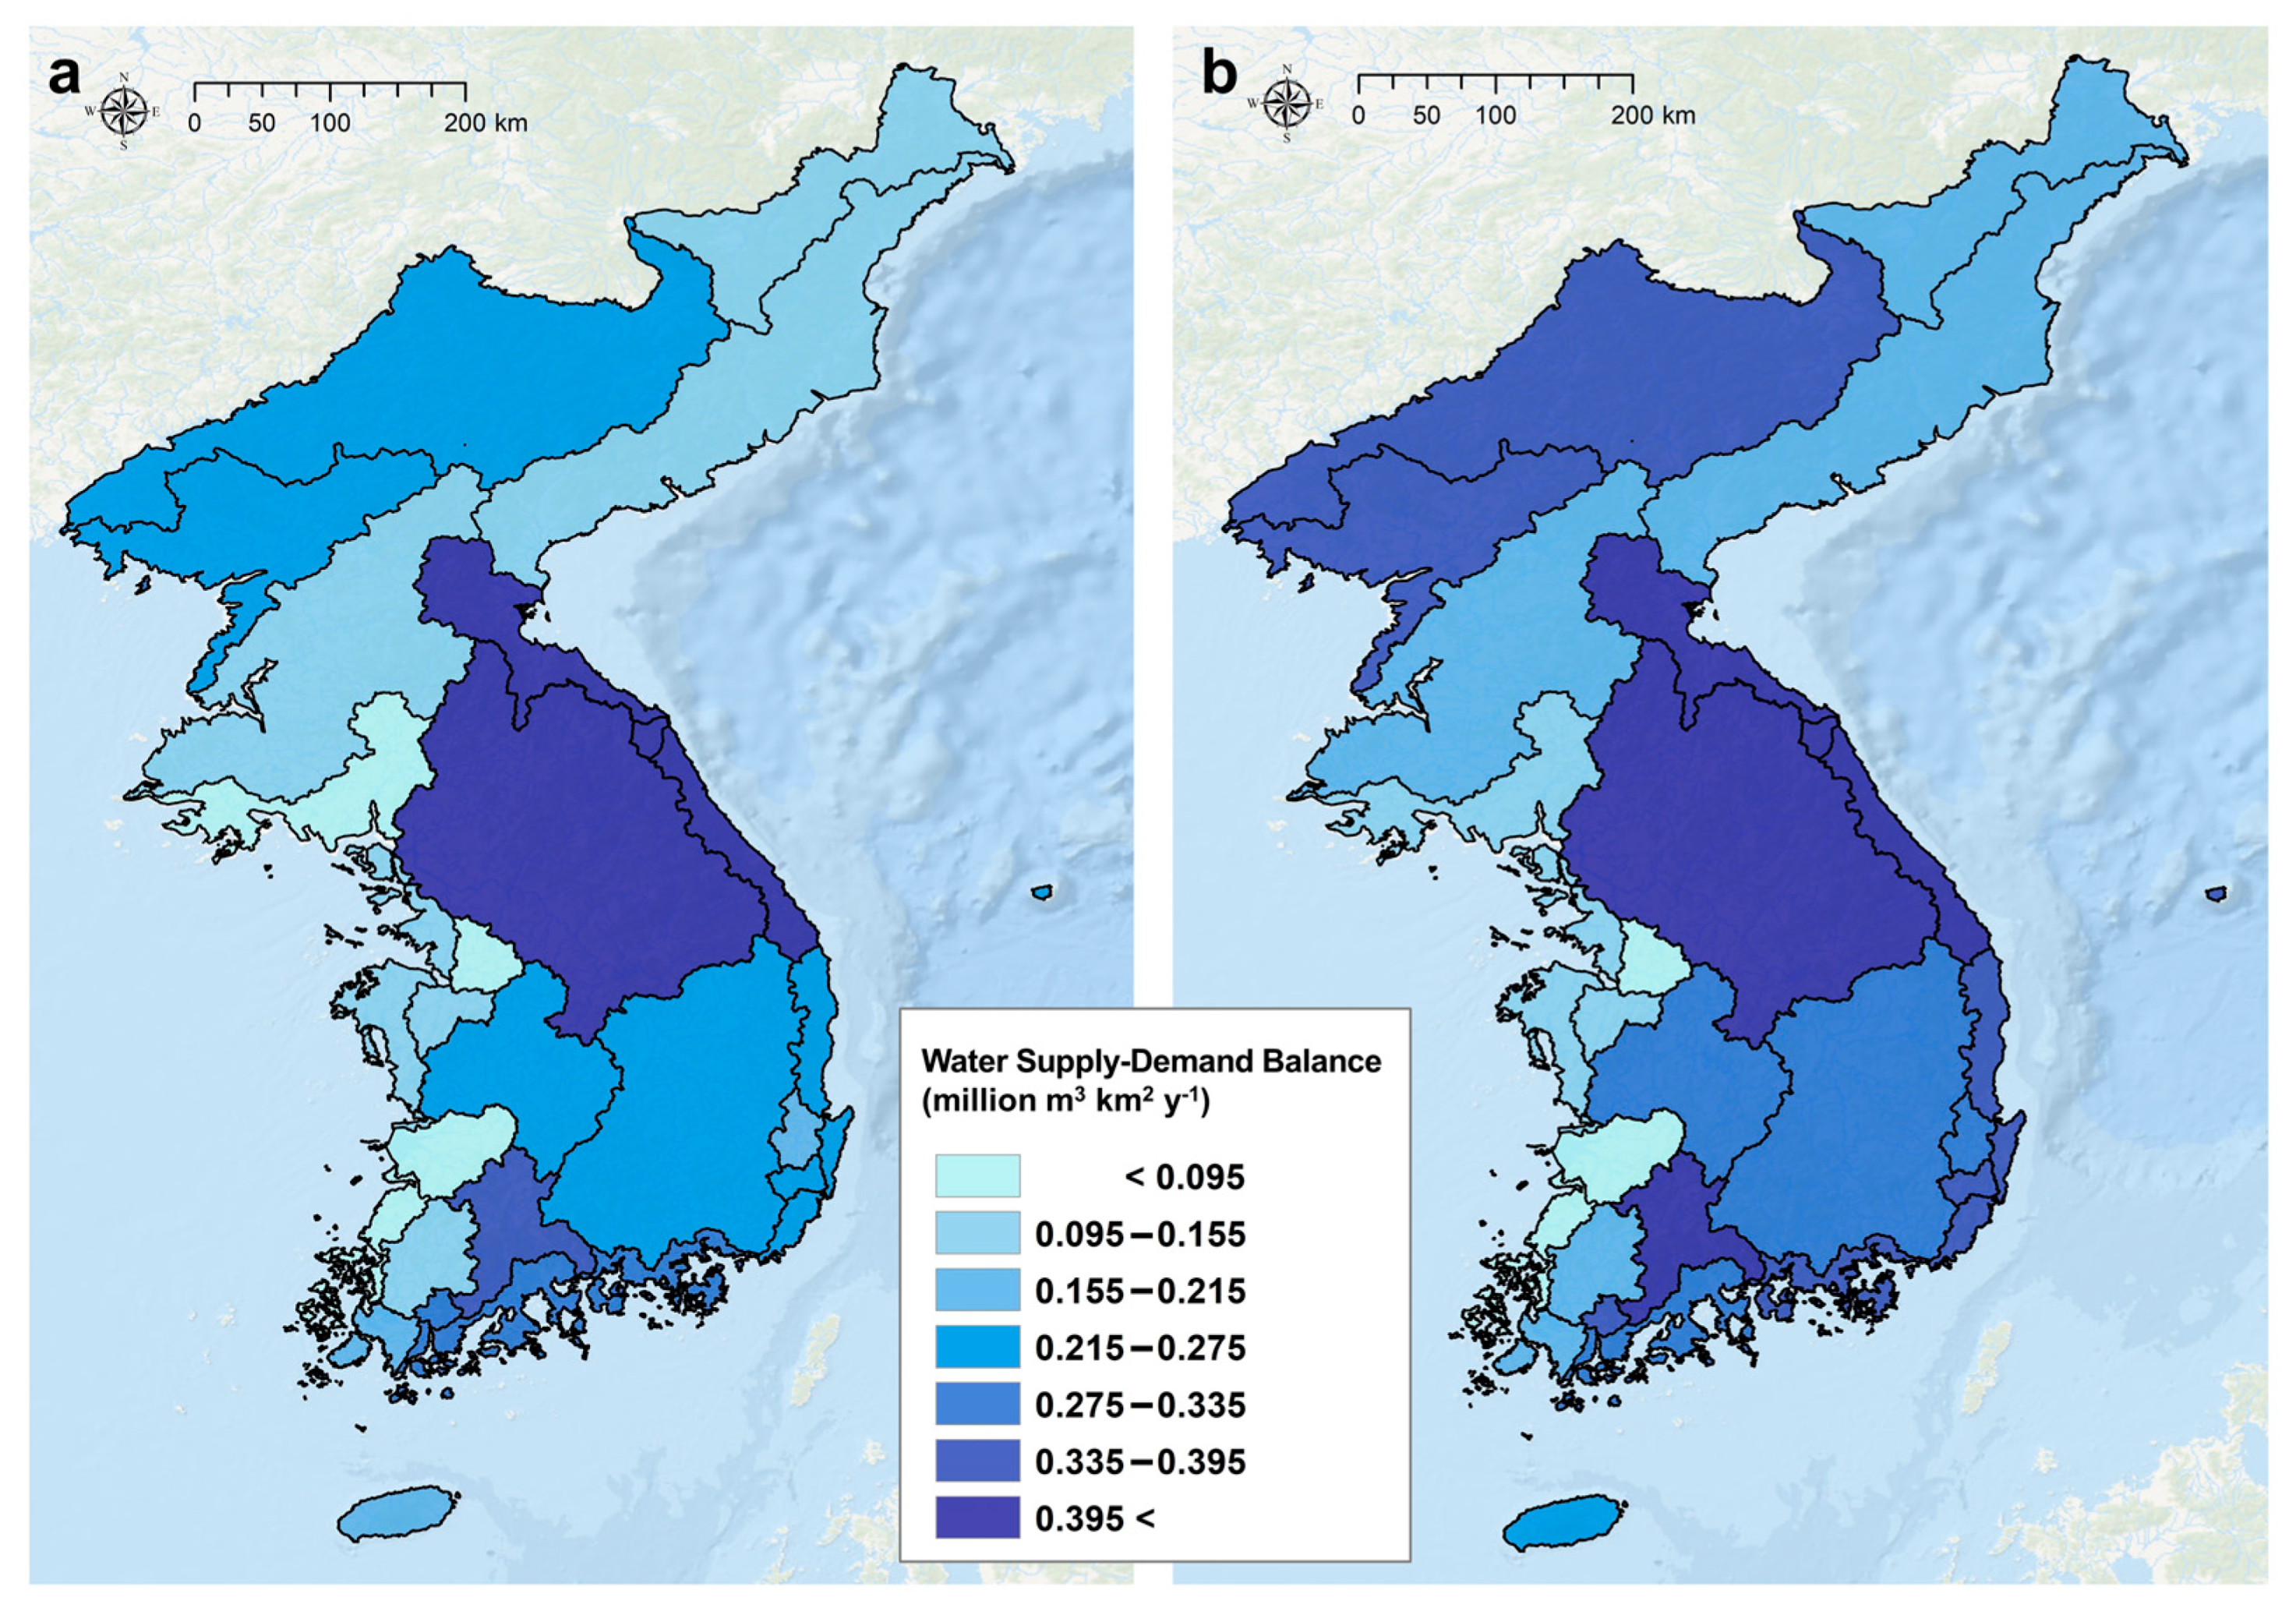
From the assessment of the water supply–demand for each watershed for the water-centric nexus between agriculture and forest, it was predicted that, although water demand increased in most watersheds, it can be offset by forest water supply. In watershed-level assessment, the baseline was compared with the 2070s under the RCP8.5 scenario, which showed the most significant change.
Water supply and demand increased in all watersheds. In particular, in the watersheds located on the western part of the Korean Peninsula, significant changes can be observed in both supply and demand (Figure 8). Forest water supply increased by more than 20% in all regions, and agricultural water demand showed a large deviation, where it increased and decreased (Table 4). In North Korea, agricultural water demand increased significantly in the major regions for food production especially in the Chongchon River, Taedong River, and Ryesong River basins. In South Korea, the demand for water from the Han River, Anseong River, Sapgyo River, Geum River, and Mankyung–Dongjin Rivers basins located in the western plains increased significantly (Table 4). Specifically, in the western plains, owing to low forest ratio, the increase in water supply is small, which is expected to pose a threat to water balance in the future.
The result of the current and future assessment for the watershed-level water demand-supply balance per unit area reveal that the increase in forest water supply exceeds the increase in agricultural water demand, and the future balance changes more positively (Table 5). However, this is only the case when all water supply sources are used. The balance decreased only in the two watersheds of the Anseong River and Sapgyo River in South Korea. These watersheds were found to have a smaller watershed size and lower forest ratio than others, which resulted in a greater demand than available supply. Except for the small watershed, it is noteworthy that the water balance increased in most of the watersheds. In North Korea, the Taedong River and Ryesong River basins have a relatively low balance because the water supply growth rate is not high compared with the increase in agricultural water demand. This area is one of North Korea’s representative granary areas, and it is an area where croplands have increased significantly because of deforestation. In South Korea, for the Geum River, Mankyung–Dongjin Rivers, and Yeongsan River basins, water balance increases slightly. This region is also a western plain granary and has a low forest ratio basin.
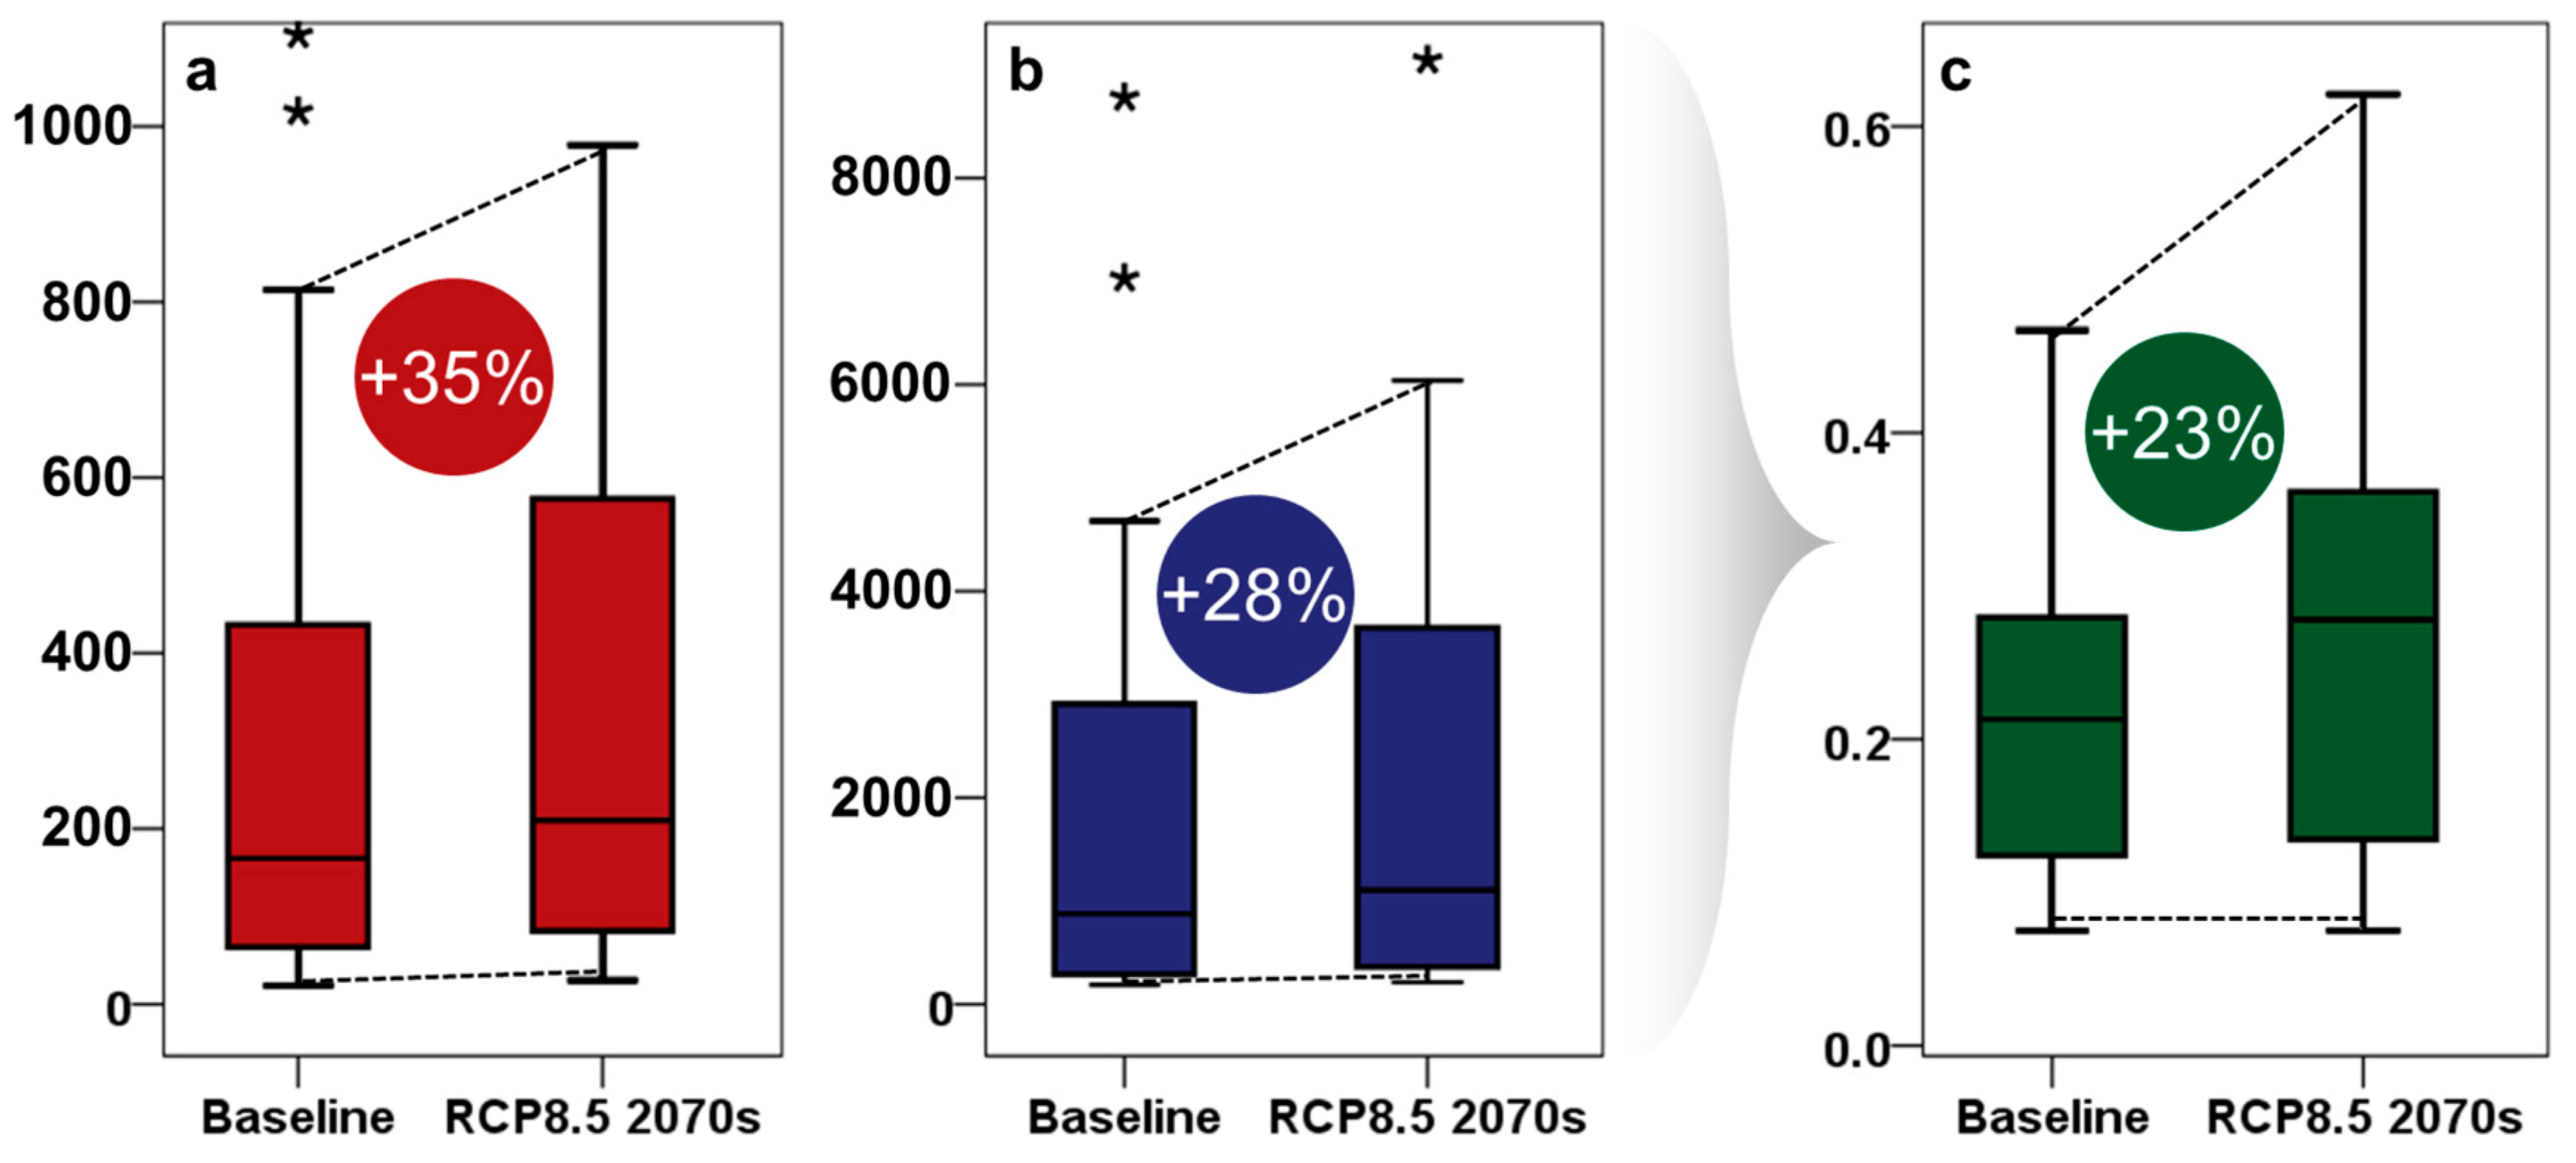
Overall, agricultural water demand increased by 35%, but the forest water supply increased by 28%, with most of the increase in demand being covered by the increase in supply (Figure 9). Therefore, the balance of water supply–demand increased by 23%. In particular, it was confirmed that it is possible to respond to the increasing water demand in agriculture through water-centric adaptation.
3.5. Water-Centric Nexus Approach to Adaptation for Climate Change
Although the expected precipitation in the Korean Peninsula increases because of climate change, rainfall intensity and heat waves will also increase [12,44,67]. Therefore, the irrigation requirements for the forecasted crop production will also increase. This result implies the importance of irrigation-related adaptation to agriculture. Previous studies in East Asia have also suggested that irrigation issues due to climate change would be a major threat to agricultural production [68,69]. The positive aspect is that the potential water supply from the forests could offset the increasing agricultural water demand. It is also encouraging that future food production can be increased if the water supply is sufficient.
To utilize a potential water supply, a watershed is expected to play an important role in irrigation systems and pumping-related infrastructure in a region. Because the supply of water by forest is a potential supply, the level of construction with respect to irrigation systems and pumping-related infrastructure will have a direct impact on its utilization for actual agricultural activities [70]. The water-centric nexus approach in this study showed this possibility, and a technical application in agricultural fields is necessary for actual linkage.
From the assessment of the water supply–demand balance for each watershed in the Korean Peninsula, it was found that, in general, a low forest ratio and small watershed necessitate a need for focused attempts at adaptation. In a forest-rich watershed, there is a high possibility of adaptation due to the increased potential supply, whereas regions with a low forest ratio will be unable to cope with the increasing demand. Rich and well-managed forests could have a positive impact on the forest-to-agriculture water-centric nexus. Such a phenomenon has represented the deterioration in water balance attributable to deforestation in North Korea [21].
For North Korea, which has remained degraded in recent decades, it is necessary to restore the forests and manage them wisely to make the water-centric supply–demand system a tool of adaptation. South Korea should also maintain and increase the water supply by suppressing urban expansion and managing forests continuously. Ultimately, land-use balance will result in an increase in water balance between forest and agriculture and will play an important role in adapting to climate change.
3.6. Limitations and Uncertainties of the Nexus Approach
The water-centric nexus approach of this study has several limitations. First, forest water supply is understood as a potential supply, and heavy rain and irrigation systems are not considered. This results in implications at a macro level, and further research is required for detailed linkages. In terms of agricultural water demand, only one representative crop, i.e., rice, was applied to the whole cropland. This means that the paper does not represent the diversity of the actual agricultural field conditions. In addition, it does not consider the adaptation method through phenological changes in crops but rather the water-oriented demand–supply aspects. Additional studies are required to consider more complex adaptations. In terms of climate change, the uncertainty of the climate model could not be solved using a single GCM. However, it is designed to be compared with (and support the joint use of) existing studies by utilizing GCM, which is extensively used in the Korean Peninsula. Although the identical GCM data were used in both models, data downscaled by different institutions had to be used owing to the limitations of the spatiotemporal resolution of climate data. This study tried to use identical data as much as possible, but the difference in downscaling techniques may lead to uncertainty in model prediction due to data differences. However, the basic trend is expected to be equal using the identical GCM.
Despite the above limitations, the water-centric nexus proposed in this study suggests the importance of the direction of macroscopic climate change adaptation and land-use balance.
4. Conclusions
A comprehensive water-centric nexus approach for assessing water supply–demand balance at the main watershed level in the Korean Peninsula has significant implications for broadening perspectives on climate change adaptation. In terms of crop production, productivity could increase because of climate change if sufficient irrigation is possible. The changes of forest water supply and agricultural water demand under baseline and future climate conditions were estimated through the EPIC and InVEST-WY models, respectively. Both agricultural water demand and forest water supply showed a significant increase in all future scenarios and periods due to climate change. Comparing the RCP8.5 2070s and baseline scenarios, the agricultural water demand and forest water supply increased by 35% and 28%, respectively. Although most future water supply increases offset demand growth, the water balance assessment at the main watershed level in the Korean Peninsula is expected to be a risk due to the low forest ratio and/or small watersheds. Specifically, the Taedong River and Ryesong River basins (North Korea) and the Anseong River and Sapgyo River basins (South Korea) in the western granary region are where active adaptations are required. These results imply that land-use balance could be an important factor in water-centric adaptation to climate change. Ultimately, although the water supply of this study has potential, the water-centric nexus approach can be expected to introduce synergies by overcoming the increasing water demand attributable to climate change.
Supplementary Materials
The following are available online at https://0-www-mdpi-com.brum.beds.ac.uk/article/10.3390/agronomy11081657/s1, Table S1: Land- use statistics of each watershed.
Author Contributions
Conceptualization, methodology, investigation and Writing, C.-H.L. The author has read and agreed to the published version of the manuscript.
Funding
This research was funded by the National Research Foundation of Korea grant of the Ministry of Science and ICT (No. 2019R1C1C1004979), and Kookmin University grant.
Institutional Review Board Statement
Not applicable.
Informed Consent Statement
Not applicable.
Data Availability Statement
Not applicable.
Acknowledgments
We appreciate the support of the research member of the environmental GIS/RS laboratory of the Korea University.
Conflicts of Interest
The author declares no conflict of interest.
References
- Callendar, G.S. The artificial production of carbon dioxide and its influence on temperature. Q. J. Royal Meteorol. Soc. 1938, 64, 223–240. [Google Scholar] [CrossRef]
- IPCC. Climate Change 2014—Impacts, Adaptation and Vulnerability: Regional Aspects. Intergovernmental Panel on Climate Change; Cambridge University Press: Cambridge, UK, 2014. [Google Scholar]
- IPCC. Climate Change and Land: An IPCC Special Report on Climate Change, Desertification, Land Degradation, Sustainable Land Management, Food Security, and Greenhouse Gas Fluxes in Terrestrial Ecosystems; Shukla, P.R., Skea, J., Buendia, E.C., Masson-Delmotte, V., Pörtner, H.-O., Roberts, D.C., Zhai, P., Slade, R., Connors, S., van Diemen, R., et al., Eds.; IPCC: Geneva, Switzerland, 2019. [Google Scholar]
- Burroughs, W.J. Climate Change: A Multidisciplinary Approach; Cambridge University Press: Cambridge, UK, 2007. [Google Scholar]
- Van Vuuren, D.P.; Bijl, D.L.; Bogaart, P.; Stehfest, E.; Biemans, H.; Dekker, S.C.; Doelman, J.C.; Gernaat, D.E.H.J.; Harmsen, M. Integrated scenarios to support analysis of the food-energy-water nexus. Nat. Sustain. 2019, 2, 1132–1141. [Google Scholar] [CrossRef]
- Rasul, G.; Sharma, B. The nexus approach to water-energy-food security: An option for adaptation to climate change. Clim. Policy 2016, 16, 682–702. [Google Scholar] [CrossRef] [Green Version]
- Berardy, A.; Chester, M.V. Climate change vulnerability in the food, energy, and water nexus: Concerns for agricultural production in Arizona and its urban export supply. Environ. Res. Lett. 2017, 12, 035004. [Google Scholar] [CrossRef]
- Chiabai, A.; Quiroga, S.; Martinez-Juarez, P.; Higgins, S.; Taylor, T. The nexus between climate change, ecosystem services and human health: Towards a conceptual framework. Sci. Total. Environ. 2018, 635, 1191–1204. [Google Scholar] [CrossRef]
- Pardoe, J.; Conway, D.; Namaganda, E.; Vincent, K.; Dougill, A.J.; Kashaigili, J.J. Climate change and the water-energy-food nexus: Insights from policy and practice in Tanzania. Clim. Policy 2018, 18, 863–877. [Google Scholar] [CrossRef] [Green Version]
- Zhang, X.; Li, H.Y.; Deng, Z.D.; Ringler, C.; Gao, Y.; Hejazi, M.I.; Leung, L.R. Impacts of climate change, policy and water-energy-food nexus on hydropower development. Renew. Energy 2018, 116, 827–834. [Google Scholar] [CrossRef]
- Winsemius, H.C.; Aerts, J.C.; Van Beek, L.P.; Bierkens, M.F.; Bouwman, A.; Jongman, B.; Ward, P.J. Global drivers of future river flood risk. Nat. Clim. Chan. 2016, 6, 381–385. [Google Scholar] [CrossRef]
- Choi, Y.; Lim, C.H.; Chung, H.I.; Ryu, J.; Jeon, S.W. Novel index for bioclimatic zone-based biodiversity conservation strategies under climate change in Northeast Asia. Environ. Res. Lett. 2019, 14, 124048. [Google Scholar] [CrossRef]
- Cha, S.; Lim, C.H.; Kim, J.; Kim, M.; Song, C.; Lee, W.K. Analysis of landslide hazard area due to heavy rainfall in the Seoul Metropolitan Area. J. Korean Soc. Geospat. Inform. Sci. 2018, 26, 3–11. [Google Scholar]
- Nam, W.H.; Hong, E.M.; Choi, J.Y.; Kim, T.; Hayes, M.J.; Svoboda, M.D. Assessment of the extreme 2014–2015 drought events in North Korea using weekly standardized precipitation evapotranspiration index (SPEI). J. Kor. Soc. Agric. Engin. 2017, 59, 65–74. [Google Scholar]
- Bang, N.K.; Nam, W.H.; Hong, E.M.; Michael, J.H.; Mark, D.S. Assessment of the meteorological characteristics and statistical drought frequency for the extreme 2017 spring drought event across South Korea. J. Korean Soc. Agric. Engin. 2018, 60, 37–48. [Google Scholar]
- Kuwayama, Y.; Thompson, A.; Bernknopf, R.; Zaitchik, B.; Vail, P. Estimating the impact of drought on agriculture using the US drought Monitor. Am. J. Agric. Econ. 2019, 101, 193–210. [Google Scholar] [CrossRef]
- Li, W.; Wen, J.; Xu, B.; Li, X.; Du, S. Integrated assessment of economic losses in manufacturing industry in Shanghai metropolitan area under an extreme storm flood scenario. Sustainability 2019, 11, 126. [Google Scholar] [CrossRef] [Green Version]
- Elliott, K.J.; Caldwell, P.V.; Brantley, S.T.; Miniat, C.F.; Vose, J.M.; Swank, W.T. Water yield following forest-grass-forest transitions. Hydrol. Earth Syst. Sci. 2017, 21, 981–997. [Google Scholar] [CrossRef] [Green Version]
- Lim, C.-H.; Choi, Y.; Kim, M.; Lee, S.J.; Folberth, C.; Lee, W.-K. Spatially explicit assessment of agricultural water equilibrium in the Korean Peninsula. Sustainability 2018, 10, 201. [Google Scholar] [CrossRef] [Green Version]
- Brêda, J.P.L.F.; de Paiva, R.C.D.; Collischon, W.; Bravo, J.M.; Siqueira, V.A.; Steinke, E.B. Climate change impacts on South American water balance from a continental-scale hydrological model driven by CMIP5 projections. Clim. Chang. 2020, 159, 1–20. [Google Scholar] [CrossRef]
- Lim, C.H.; Song, C.; Choi, Y.; Jeon, S.W.; Lee, W.K. Decoupling of forest water supply and agricultural water demand attributable to deforestation in North Korea. J. Environ. Manag. 2019, 248, 109256. [Google Scholar] [CrossRef] [PubMed]
- Lee, M.H.; Im, E.S.; Bae, D.H. A comparative assessment of climate change impacts on drought over Korea based on multiple climate projections and multiple drought indices. Clim. Dyn. 2019, 53, 389–404. [Google Scholar] [CrossRef]
- Lim, C.-H.; Kim, S.H.; Chun, J.A.; Kafatos, M.C.; Lee, W.-K. Assessment of agricultural drought considering the hydrological cycle and crop phenology in the Korean Peninsula. Water 2019, 11, 1105. [Google Scholar] [CrossRef] [Green Version]
- Jiang, Y.; Zhang, L.; Zhang, B.; He, C.; Jin, X.; Bai, X. Modeling irrigation management for water conservation by DSSAT-maize model in arid northwestern China. Agric. Water Manag. 2016, 177, 37–45. [Google Scholar] [CrossRef]
- Lim, C.-H.; Kim, S.H.; Choi, Y.; Kafatos, M.C.; Lee, W.-K. Estimation of the virtual water content of main crops on the Korean Peninsula using multiple regional climate models and evapotranspiration methods. Sustainability 2017, 9, 1172. [Google Scholar] [CrossRef] [Green Version]
- Yoon, P.R.; Choi, J.Y. Effects of shift in growing season due to climate change on rice yield and crop water requirements. Paddy Water Environ. 2019, 18, 1–17. [Google Scholar] [CrossRef]
- Kim, G.S.; Lim, C.-H.; Kim, S.J.; Lee, J.; Son, Y.; Lee, W.K. Effect of national-scale afforestation on forest water supply and soil loss in South Korea, 1971–2010. Sustainability 2017, 9, 1017. [Google Scholar] [CrossRef] [Green Version]
- Yang, Q.; Almendinger, J.E.; Zhang, X.; Huang, M.; Chen, X.; Leng, G.; Li, X. Enhancing SWAT simulation of forest ecosystems for water resource assessment: A case study in the St. Croix River basin. Ecol. Engin. 2018, 120, 422–431. [Google Scholar] [CrossRef]
- Yu, Z.; Man, X.; Duan, L.; Cai, T. Assessments of impacts of climate and forest change on water resources using swat model in a subboreal watershed in Northern Da Hinggan Mountains. Water 2020, 12, 1565. [Google Scholar] [CrossRef]
- National Institute of Meteorological Science. Climate Change Projection Report of Korean Peninsula; National Institute of Meteorological Science: Jeju City, Korea, 2020.
- Lim, C.H.; Yoo, S.; Choi, Y.; Jeon, S.W.; Son, Y.; Lee, W.K. Assessing climate change impact on forest habitat suitability and diversity in the Korean Peninsula. Forests 2018, 9, 259. [Google Scholar] [CrossRef] [Green Version]
- Kim, D.; Lim, C.H.; Song, C.; Lee, W.K.; Piao, D.; Heo, S.; Jeon, S. Estimation of future carbon budget with climate change and reforestation scenario in North Korea. Adv. Space Res. 2016, 58, 1002–1016. [Google Scholar] [CrossRef]
- Lim, C.-H.; Choi, Y.; Kim, M.; Jeon, S.W.; Lee, W.-K. Impact of deforestation on agro-environmental variables in cropland, North Korea. Sustainability 2017, 9, 1354. [Google Scholar] [CrossRef] [Green Version]
- Jo, H.W.; Lee, S.; Park, E.; Lim, C.H.; Song, C.; Lee, H.; Ko, Y.; Cha, S.; Yoon, H.; Lee, W.K. Deep learning applications on multitemporal SAR (Sentinel-1) image classification using confined labeled data: The case of detecting rice paddy in South Korea. IEEE Trans. Geosci. Remote. Sens. 2020, 58, 7589–7601. [Google Scholar] [CrossRef]
- Leemhuis, C.; Thonfeld, F.; Näschen, K.; Steinbach, S.; Muro, J.; Strauch, A.; López, A.; Daconto, G.; Games, I.; Diekkrüger, B. Sustainability in the food-water-ecosystem nexus: The role of land use and land cover change for water resources and ecosystems in the Kilombero Wetland, Tanzania. Sustainability 2017, 9, 1513. [Google Scholar] [CrossRef] [Green Version]
- Zhao, Y.; Jiang, C.; Dong, X.; Yang, Z.; Wen, M.; Yang, J. Understanding the complex environmental management through a len of food-water-ecosystem nexus: Insights from an ecosystem restoration hotspot in dryland. Sci. Total. Environ. 2021, 783, 147029. [Google Scholar] [CrossRef]
- Food Agriculture Organization (FAO). FAOSTAT Land Use Domain; FAO: Rome, Italy, 2019; Available online: http://www.fao.org/faostat/en/#data/RL (accessed on 15 September 2019).
- Williams, J.R.; Jones, C.A.; Kiniry, J.R.; Spanel, D.A. The EPIC crop growth model. Trans. ASAE 1989, 32, 497–511. [Google Scholar] [CrossRef]
- Song, Y.; Lim, C.H.; Lee, W.K.; Eom, K.C.; Choi, S.E.; Lee, E.J.; Kim, E. Applicability analysis of major crop models on Korea for the adaptation to climate change. J. Clim. Chang. Res. 2014, 5, 109–125. [Google Scholar] [CrossRef]
- Folberth, C.; Skalský, R.; Moltchanova, E.; Balkovič, J.; Azevedo, L.B.; Obersteiner, M.; Van Der Velde, M. Uncertainty in soil data can outweigh climate impact signals in global crop yield simulations. Nat. Commun. 2016, 7, 11872. [Google Scholar] [CrossRef] [PubMed] [Green Version]
- Balkovič, J.; van der Velde, M.; Schmid, E.; Skalský, R.; Khabarov, N.; Obersteiner, M.; Xiong, W. Pan-European crop modelling with EPIC: Implementation, up-scaling and regional crop yield validation. Agric. Syst. 2013, 120, 61–75. [Google Scholar] [CrossRef]
- Xiong, W.; Balkovič, J.; van der Velde, M.; Zhang, X.; Izaurralde, R.C.; Skalský, R.; Lin, E.; Mueller, N.; Obersteiner, M. A calibration procedure to improve global rice yield simulations with EPIC. Ecol. Model. 2014, 273, 128–139. [Google Scholar] [CrossRef]
- Lim, C.-H.; Lee, W.K.; Song, Y.; Eom, K.C. Assessing the EPIC model for estimation of future crops yield in South Korea. J. Clim. Chang. Res. 2015, 6, 21–31. [Google Scholar] [CrossRef]
- Kafatos, M.C.; Kim, S.H.; Lim, C.-H.; Kim, J.; Lee, W.-K. Responses of agroecosystems to climate change: Specifics of resilience in the mid-latitude region. Sustainability 2017, 9, 1361. [Google Scholar] [CrossRef] [Green Version]
- Wang, X.; Williams, J.R.; Gassman, P.W.; Baffaut, C.; Izaurralde, R.C.; Jeong, J.; Kiniry, J.R. EPIC and APEX: Model use, calibration, and validation. Trans. ASABE 2012, 55, 1447–1462. [Google Scholar] [CrossRef]
- Lim, C.-H.; Kim, Y.S.; Won, M.; Kim, S.J.; Lee, W.K. Can satellite-based data substitute for surveyed data to predict the spatial probability of forest fire? A geostatistical approach to forest fire in the Republic of Korea. Geomat. Nat. Haz. Risk 2019, 10, 719–739. [Google Scholar] [CrossRef] [Green Version]
- Kim, S.J.; Lim, C.H.; Kim, G.S.; Lee, J.; Geiger, T.; Rahmati, O.; Son, Y.; Lee, W.K. Multi-temporal analysis of forest fire probability using socio-economic and environmental variables. Remote. Sens. 2019, 11, 86. [Google Scholar] [CrossRef] [Green Version]
- Blackland Research Center. Potential Heat Unit Program. 2010. Available online: http://swatmodel.tamu.edu/software/potential-heat-unit-program (accessed on 14 July 2014).
- Folberth, C.; Yang, H.; Gaiser, T.; Abbaspour, K.C.; Schulin, R. Modeling maize yield responses to improvement in nutrient, water and cultivar inputs in sub-Saharan Africa. Agric. Syst. 2013, 119, 22–34. [Google Scholar] [CrossRef]
- Food Agriculture Organization (FAO). FAO Digital Soil Map of the World; FAO: Rome, Italy, 1995. [Google Scholar]
- Food Agriculture Organization (FAO). FertiSTAT—Fertilizer Use Statistics; FAO: Rome, Italy, 2007; Available online: http://www.fao.org/ag/agl/fertistat/index_en.htm (accessed on 11 December 2014).
- Sharp, R.; Tallis, H.T.; Ricketts, T.; Guerry, A.D.; Wood, S.A.; Chaplin-Kramer, R.; Nelson, E.; Ennaanay, D.; Wolny, S.; Olwero, N.; et al. InVEST 3.2.0 User’s Guide; The Natural Capital Project: Stanford, CA, USA, 2015. [Google Scholar]
- Lee, S.J.; Yoo, S.; Ham, B.; Lim, C.H.; Song, C.; Kim, M.; Kim, S.J.; Lee, W.K. Ecosystem service assessment of urban forest for water supply and climate mitigation of Seoul Metropolitan Area. Korean. J. Remote Sens. 2017, 33, 1119–1137. [Google Scholar]
- Donohue, R.J.; Roderick, M.L.; McVicar, T.R. Roots, storms and soil pores: Incorporating key ecohydrological processes into Budyko’s hydrological model. J. Hydrol. 2012, 436, 35–50. [Google Scholar] [CrossRef]
- Hamel, P.; Guswa, A.J. Uncertainty analysis of a spatially explicit annual water-balance model: Case study of the Cape Fear Basin, North Carolina. Hydrol. Earth. Syst. Sci. 2015, 19, 839–853. [Google Scholar] [CrossRef] [Green Version]
- National Institute of Forest Science (NIFoS). Development of Management Technology and Long-Term Monitoring of Forest Water Resources; NIFoS: Seoul, Korea, 2010.
- Karger, D.N.; Conrad, O.; Böhner, J.; Kawohl, T.; Kreft, H.; Soria-Auza, R.W.; Kessler, M. Climatologies at high resolution for the earth’s land surface areas. Sci. Data 2017, 4, 170122. [Google Scholar] [CrossRef] [Green Version]
- Hargreaves, G.H.; Samani, Z.A. Reference crop evapotranspiration from temperature. Appl. Engin. Agric. 1985, 1, 96–99. [Google Scholar] [CrossRef]
- Canadell, J.; Jackson, R.B.; Ehleringer, J.B.; Mooney, H.A.; Sala, O.E.; Schulze, E.D. Maximum rooting depth of vegetation types at the global scale. Oecologia 1996, 108, 583–595. [Google Scholar] [CrossRef]
- Jeon, S.W.; Kim, J.; Jung, H. A study on the forest classification for ecosystem services valuation focused on forest type map and land cover map. J. Korea Soc. Environ. Restor. Tech. 2013, 16, 31–39. [Google Scholar] [CrossRef] [Green Version]
- National Institute of Agricultural Science. Soil Environmental Maps User Manual; Rural Development Administration: Jeonju, Korea, 2018.
- Chen, J.; Chen, J.; Liao, A.; Cao, X.; Chen, L.; Chen, X.; He, C.; Han, G.; Peng, S.; Lu, M.; et al. Global land cover mapping at 30 m resolution: A POK-based operational approach. ISPRS J. Photogramm. Remote. Sens. 2015, 103, 7–27. [Google Scholar] [CrossRef] [Green Version]
- Shin, Y.; Lee, E.J.; Im, E.S.; Jung, I.W. Spatially distinct response of rice yield to autonomous adaptation under the CMIP5 multi-model projections. Asia Pac. J. Atmos. Sci. 2017, 53, 21–30. [Google Scholar] [CrossRef]
- Lee, K.S.; Kim, J.M.; Lee, D.R.; Kim, Y.; Lee, D. Analysis of water movement through an unsaturated soil zone in Jeju Island, Korea using stable oxygen and hydrogen isotopes. J. Hydrol. 2007, 345, 199–211. [Google Scholar] [CrossRef]
- Huang, B.; Polanski, S.; Cubasch, U. Assessment of precipitation climatology in an ensemble of CORDEX-East Asia regional climate simulations. Clim. Res. 2015, 64, 141–158. [Google Scholar] [CrossRef] [Green Version]
- Park, C.; Min, S.K.; Lee, D.; Cha, D.H.; Suh, M.S.; Kang, H.S.; Kwon, W.T. Evaluation of multiple regional climate models for summer climate extremes over East Asia. Clim. Dyn. 2016, 46, 2469–2486. [Google Scholar] [CrossRef]
- Yoon, E.J.; Thorne, J.H.; Park, C.; Lee, D.K.; Kim, K.S.; Yoon, H.; Seo, C.; Lim, C.H.; Kim, H.; Song, Y.I. Modeling spatial climate change landuse adaptation with multi-objective genetic algorithms to improve resilience for rice yield and species richness and to mitigate disaster risk. Environ. Res. Lett. 2019, 14, 024001. [Google Scholar] [CrossRef]
- Lee, S.H.; Yoo, S.H.; Choi, J.Y.; Engel, B.A. Effects of climate change on paddy water use efficiency with temporal change in the transplanting and growing season in South Korea. Irrig. Sci. 2016, 34, 443–463. [Google Scholar] [CrossRef]
- Kang, S.; Eltahir, E.A. North China Plain threatened by deadly heatwaves due to climate change and irrigation. Nat. Commun. 2018, 9, 1–9. [Google Scholar] [CrossRef] [Green Version]
- Zheng, X.; Chen, C.; Liu, A.; Wei, H.; Zhang, H.; Huang, G.; Wu, Y. Planning a sustainable regional irrigated production and forest protection under land and water stresses with multiple uncertainties. J. Clean. Prod. 2018, 188, 751–762. [Google Scholar] [CrossRef]
Figure 1.
Basic spatial information of the Korean Peninsula: (a) national boundary with elevation and (b) major watershed map.
Figure 1.
Basic spatial information of the Korean Peninsula: (a) national boundary with elevation and (b) major watershed map.

Figure 2.
Conceptual diagram of the water-centric nexus for agriculture and forest attributable to climate change.
Figure 2.
Conceptual diagram of the water-centric nexus for agriculture and forest attributable to climate change.

Figure 3.
Evaluation results of each model and region: InVEST-WY for (a) North Korea and (b) South Korea; EPIC model for (c) North Korea and (d) South Korea.
Figure 3.
Evaluation results of each model and region: InVEST-WY for (a) North Korea and (b) South Korea; EPIC model for (c) North Korea and (d) South Korea.

Figure 4.
Irrigated rice yields under baseline and future climate conditions in the Korean Peninsula.
Figure 4.
Irrigated rice yields under baseline and future climate conditions in the Korean Peninsula.

Figure 5.
Rain-fed rice yields under baseline and future climate conditions in the Korean Peninsula.
Figure 5.
Rain-fed rice yields under baseline and future climate conditions in the Korean Peninsula.

Figure 6.
Agricultural water demand under baseline and future climate conditions in the Korean Peninsula.
Figure 6.
Agricultural water demand under baseline and future climate conditions in the Korean Peninsula.

Figure 7.
Forest water supply under baseline and future climate conditions in the Korean Peninsula.

Figure 8.
Water supply–demand balance under climate change at the main watershed level: (a) baseline period and (b) RCP8.5 2070s.
Figure 8.
Water supply–demand balance under climate change at the main watershed level: (a) baseline period and (b) RCP8.5 2070s.

Figure 9.
Overall water supply–demand and balance change attributable to climate change: (a) agricultural water demand (unit: million m3 y−1), (b) forest water supply (unit: million m3 y−1), and (c) water supply–demand balance (unit: million m3 km2 y−1). (*: outliers).
Figure 9.
Overall water supply–demand and balance change attributable to climate change: (a) agricultural water demand (unit: million m3 y−1), (b) forest water supply (unit: million m3 y−1), and (c) water supply–demand balance (unit: million m3 km2 y−1). (*: outliers).


Table 1.
Input variables used for each model.
| Sector | Variables | Source |
|---|---|---|
| Agriculture sector (EPIC model) | Daily maximum temperature | Historical: KMA Climate Change Scenario: CORDEX-East Asia (GCM: HadGEM2-AO) |
| Daily minimum temperature | ||
| Daily precipitation | ||
| Daily solar radiation | ||
| Daily wind speed | ||
| Daily relative humidity | ||
| Potential heat unit | Blackland Research Center [48] | |
| Soil pH | Digital Soil Map of the World [50] | |
| bulk density | ||
| Cation exchange capacity | ||
| Electrical conductivity | ||
| Sand | ||
| Silt | ||
| Forest sector (InVEST model) | Potential evapotranspiration | CHELSA [57] (GCM: HadGEM2-AO) |
| Annual precipitation | ||
| Plant available water content | RDA [61] | |
| Depth-to-root restricting layer | Canadell et al. [59] | |
| Land use | GLC30 [62] |
Table 2.
Rain-fed and irrigated rice yields under baseline and future climate conditions.
| Rain-Fed Rice Yield (Average) | Irrigated Rice Yield (Average) | |||||
|---|---|---|---|---|---|---|
| South Korea (t ha−1) | North Korea (t ha−1) | Korean Peninsula (t ha−1) | South Korea (t ha−1) | North Korea (t ha−1) | Korean Peninsula (t ha−1) | |
| Baseline | 2.53 | 2.80 | 2.67 | 4.56 | 4.24 | 4.39 |
| RCP4.5 2050s | 1.94 | 1.99 | 1.96 | 4.66 | 4.29 | 4.44 |
| RCP4.5 2070s | 1.77 | 2.24 | 2.02 | 4.60 | 4.73 | 4.66 |
| RCP8.5 2050s | 1.91 | 1.69 | 1.79 | 4.57 | 4.25 | 4.38 |
| RCP8.5 2070s | 1.26 | 1.68 | 1.48 | 4.29 | 4.33 | 4.30 |
Table 3.
Statistics of agricultural water demand and forest water supply under baseline and future climate conditions.
Table 3.
Statistics of agricultural water demand and forest water supply under baseline and future climate conditions.
| Forest Water Supply | Agricultural Water Demand | |||||||
|---|---|---|---|---|---|---|---|---|
| Mean (mm y−1) | South Korea (million m3 y−1) | North Korea (million m3 y−1) | Korean Peninsula (million m3 y−1) | Mean (mm y−1) | South Korea (million m3 y−1) | North Korea (million m3 y−1) | Korean Peninsula (million m3 y−1) | |
| Baseline | 495.65 | 33,269 | 30,189 | 63,458 | 136.75 | 4198 | 4745 | 8943 |
| RCP4.5 2050s | 594.57 | 37,990 | 38,620 | 76,610 | 174.90 | 5477 | 5985 | 11,462 |
| RCP4.5 2070s | 513.70 | 38,724 | 27,874 | 66,598 | 175.22 | 5543 | 5939 | 11,482 |
| RCP8.5 2050s | 573.64 | 40,774 | 33,367 | 74,141 | 179.80 | 5322 | 6491 | 11,813 |
| RCP8.5 2070s | 629.59 | 42,096 | 39,112 | 81,208 | 183.93 | 5766 | 6277 | 12,043 |
Table 4.
Agricultural water demand and forest water supply under climate change at the main watershed level.
Table 4.
Agricultural water demand and forest water supply under climate change at the main watershed level.
| Main Watershed | Forest Water Supply | Agricultural Water Demand | ||||
|---|---|---|---|---|---|---|
| Baseline (million m3 y−1) | RCP8.5 2070s (million m3 y−1) | Change Rate (%) | Baseline (million m3 y−1) | RCP8.5 2070s (million m3 y−1) | Change Rate (%) | |
| Tumen River | 1969.6 | 2559.4 | +29.9 | 390.0 | 469.2 | +20.3 |
| Yalu River | 8779.1 | 11,918.7 | +35.8 | 813.9 | 898.9 | +10.4 |
| Northeastern Basin | 3454.5 | 4168.7 | +20.7 | 324.9 | 369.5 | +13.7 |
| Chongchon River | 4118.7 | 5426.8 | +31.8 | 694.9 | 978.9 | +40.9 |
| Taedong River | 4677.8 | 6039.4 | +29.1 | 1401.7 | 2048.5 | +46.1 |
| Eastern Basin | 3032.4 | 3809.8 | +25.6 | 271.2 | 326.6 | +20.4 |
| Ryesong River | 1116.9 | 1436.6 | +28.6 | 474.5 | 682.7 | +43.9 |
| Han River | 17,150.9 | 21,943.0 | +27.9 | 1104.4 | 1541.3 | +39.6 |
| Han River: east sea | 1860.2 | 2462.3 | +32.4 | 42.8 | 47.9 | +11.9 |
| Han River: west sea | 266.0 | 326.5 | +22.7 | 69.4 | 110.8 | +59.7 |
| Anseong River | 251.3 | 318.4 | +26.7 | 126.3 | 194.3 | +53.8 |
| Sapgyo River | 288.8 | 353.2 | +22.3 | 115.5 | 180.8 | +56.5 |
| Geum River | 2785.3 | 3484.1 | +25.1 | 489.5 | 720.2 | +47.1 |
| Geum River: west sea | 452.3 | 541.3 | +19.7 | 144.8 | 224.7 | +55.2 |
| Nakdong River | 7029.4 | 9141.8 | +30.0 | 1016.8 | 1374.6 | +35.2 |
| Nakdong River: east sea | 866.3 | 1177.4 | +35.9 | 54.6 | 74.8 | +37.0 |
| Nakdong River: south sea | 885.0 | 1031.8 | +16.6 | 67.8 | 82.1 | +21.1 |
| Mankyung–Dongjin Rivers | 529.6 | 635.5 | +20.0 | 216.9 | 318.4 | +46.8 |
| Hyungsan River | 281.0 | 389.1 | +38.5 | 59.4 | 73.7 | +24.1 |
| Sumjin River | 2055.3 | 2395.7 | +16.6 | 243.4 | 298.4 | +22.6 |
| Sumjin River: south sea | 1089.7 | 1212.1 | +11.2 | 125.0 | 157.0 | +25.6 |
| Taehwa River | 198.6 | 266.9 | +34.4 | 28.7 | 33.6 | +17.1 |
| Yeongsan River | 745.6 | 881.3 | +18.2 | 246.5 | 324.7 | +31.7 |
| Yeongsan River: west sea | 289.7 | 337.0 | +16.4 | 98.0 | 138.1 | +40.9 |
| Yeongsan River: south sea | 319.9 | 369.1 | +15.4 | 62.2 | 84.6 | +36.0 |
| Huiya–Sooyoung | 260.9 | 337.7 | +29.5 | 25.7 | 31.1 | +21.0 |
| Tamjin River | 187.7 | 213.5 | +13.7 | 21.4 | 27.3 | +27.6 |
| Jeju Island | 537.9 | 631.2 | +17.4 | 187.8 | 188.0 | +0.1 |
Table 5.
Water supply–demand balance under climate change at the main watershed level.
| Main Watershed | Baseline (1981–2010) | RCP8.5 (2070s) | Change Rate (%) | ||
|---|---|---|---|---|---|
| million m3 y−1 | million m3 km2 y−1 | million m3 y−1 | million m3 km2 y−1 | ||
| Tumen River | 1579.6 | 0.151 | 2090.2 | 0.200 | +32.3 |
| Yalu River | 7965.2 | 0.251 | 11,019.8 | 0.347 | +38.3 |
| Northeastern Basin | 3129.6 | 0.147 | 3799.1 | 0.179 | +21.4 |
| Chongchon River | 3423.7 | 0.270 | 4447.9 | 0.351 | +29.9 |
| Taedong River | 3276.1 | 0.153 | 3990.9 | 0.186 | +21.8 |
| Eastern Basin | 2761.2 | 0.428 | 3483.1 | 0.539 | +26.1 |
| Ryesong River | 642.4 | 0.092 | 753.9 | 0.108 | +17.4 |
| Han River | 16,046.5 | 0.466 | 20,401.7 | 0.593 | +27.1 |
| Han River: east sea | 1817.4 | 0.467 | 2414.4 | 0.621 | +32.9 |
| Han River: west sea | 196.6 | 0.100 | 215.6 | 0.109 | +9.7 |
| Anseong River | 125.1 | 0.075 | 124.1 | 0.075 | −0.7 |
| Sapgyo River | 173.3 | 0.104 | 172.4 | 0.103 | −0.5 |
| Geum River | 2295.8 | 0.232 | 2763.9 | 0.279 | +20.4 |
| Geum River: west sea | 307.5 | 0.103 | 316.6 | 0.106 | +3.0 |
| Nakdong River | 6012.7 | 0.254 | 7767.2 | 0.328 | +29.2 |
| Nakdong River: east sea | 811.7 | 0.274 | 1102.7 | 0.372 | +35.8 |
| Nakdong River: south sea | 817.2 | 0.332 | 949.7 | 0.386 | +16.2 |
| Mankyung–Dongjin Rivers | 312.6 | 0.093 | 317.1 | 0.094 | +1.4 |
| Hyungsan River | 221.5 | 0.194 | 315.4 | 0.277 | +42.4 |
| Sumjin River | 1811.9 | 0.369 | 2097.3 | 0.427 | +15.8 |
| Sumjin River: south sea | 964.7 | 0.285 | 1055.1 | 0.312 | +9.4 |
| Taehwa River | 169.8 | 0.257 | 233.3 | 0.353 | +37.4 |
| Yeongsan River | 499.1 | 0.144 | 556.6 | 0.160 | +11.5 |
| Yeongsan River: west sea | 191.7 | 0.090 | 199.0 | 0.094 | +3.8 |
| Yeongsan River: south sea | 254.7 | 0.169 | 284.5 | 0.189 | +11.7 |
| Huiya–Sooyoung | 235.1 | 0.272 | 306.6 | 0.354 | +30.4 |
| Tamjin River | 166.3 | 0.329 | 186.2 | 0.369 | +12.0 |
| Jeju Island | 350.1 | 0.189 | 443.2 | 0.239 | +26.6 |
Publisher’s Note: MDPI stays neutral with regard to jurisdictional claims in published maps and institutional affiliations. |
© 2021 by the author. Licensee MDPI, Basel, Switzerland. This article is an open access article distributed under the terms and conditions of the Creative Commons Attribution (CC BY) license (https://creativecommons.org/licenses/by/4.0/).
Share and Cite
MDPI and ACS Style
Lim, C.-H. Water-Centric Nexus Approach for the Agriculture and Forest Sectors in Response to Climate Change in the Korean Peninsula. Agronomy 2021, 11, 1657. https://0-doi-org.brum.beds.ac.uk/10.3390/agronomy11081657
AMA Style
Lim C-H. Water-Centric Nexus Approach for the Agriculture and Forest Sectors in Response to Climate Change in the Korean Peninsula. Agronomy. 2021; 11(8):1657. https://0-doi-org.brum.beds.ac.uk/10.3390/agronomy11081657
Chicago/Turabian StyleLim, Chul-Hee. 2021. "Water-Centric Nexus Approach for the Agriculture and Forest Sectors in Response to Climate Change in the Korean Peninsula" Agronomy 11, no. 8: 1657. https://0-doi-org.brum.beds.ac.uk/10.3390/agronomy11081657
Note that from the first issue of 2016, this journal uses article numbers instead of page numbers. See further details here.