
Climate Change Adaptation Measures in the Irrigation of a Super-Intensive Olive Orchard in the South of Portugal


1
Instituto Superior de Agronomia, Universidade de Lisboa, Tapada da Ajuda, 1349-017 Lisbon, Portugal
2
LEAF—Linking Landscape, Environment, Agriculture and Food, Instituto Superior de Agronomia, Universidade de Lisboa, Tapada da Ajuda, 1349-017 Lisbon, Portugal
*
Author to whom correspondence should be addressed.
Agronomy 2021, 11(8), 1658; https://0-doi-org.brum.beds.ac.uk/10.3390/agronomy11081658
Submission received: 10 July 2021
/
Revised: 17 August 2021
/
Accepted: 18 August 2021
/
Published: 20 August 2021
(This article belongs to the Special Issue Water Saving in Irrigated Agriculture)
Abstract
:The south of Portugal is one of the regions that will be most affected by the impacts of climate change (CC), with an expected increase in water scarcity. Irrigated super-intensive olive orchards occupy a large area of the used agricultural surface in the Alentejo region, south of Portugal, making it necessary to adapt this crop to the effects of CC. This study assessed the impacts of CC and defined adaptation measures concerning irrigation management of the super-intensive olive orchard. To compute the crop irrigation requirement (CIR), the soil water balance model ISAREG was combined with climate data relative to the reference period 1971–2000 and to the representative concentration pathways RCP4.5 and RCP8.5 for the periods 2011–2040, 2041–2070, and 2071–2100. The growing degree-days (GDD) approach was used to estimate olive phenology for these CC scenarios. Unchanged irrigation management with an average CIR increase up to 16% in RCP4.5 and 31% in RCP8.5 is expected. By adopting higher levels of water deficit, water savings of up to 22% can be realized. The results showed that the anticipated CIR increase for the CC scenarios can be mitigated through regulated deficit irrigation strategies.
1. Introduction
The Mediterranean region is an area that will be most affected by climate change [1,2]. In Portugal, for example, the climate has already warmed by 0.85 °C in relation to the pre-industrial period [3], precipitation has fallen by 20–25 mm/decade [4], and intensified heat waves and droughts have aggravated water scarcity [3,4,5,6].
The problem is particularly relevant in the Alentejo region, south of Portugal, where olive orchards are one of the most important crops, having undergone an enormous expansion in recent years, with an area of 178,679 ha in 2018 [7]. The olive is a traditional crop, but orchard management changed sharply in the last decade as planting density was intensified and irrigation was adopted. In fact, olives are the irrigated crop that occupy the largest area in the Alqueva irrigation project in Alentejo (68,346 ha in 2020) [7]. Since water in this region is expected to decrease [6] as crop water requirements increase [8,9], it is necessary to define CC adaptation measures to ensure crop sustainability.
Assessing the impacts of CC on agriculture is usually performed using crop production or soil water balance models associated with climatic data produced by regional climate models (RCM) [8,9,10,11,12,13,14,15,16,17]. In the case of olive orchards, several studies based on the soil water balance approach have been carried out [8,10,11,12]. Tanasijevic et al. [11] applied a simplified water balance computed as the difference between crop evapotranspiration and effective precipitation to estimate CC impacts on the olive crop irrigation requirements (CIR) for the entire Mediterranean basin. The increase was estimated at 18.5% (70 ± 28 mm season−1). In this study, the phenological cycle of the olive trees was adjusted, taking into account the growing degree-days (GDD) accumulated since 1 February following the methodology proposed in Melo-Abreu et al. [18]. Another example of the use of soil water balance models to assess the CC impacts on the olive orchard was developed by Paulo and Pinto [8] using the ISAREG model to evaluate CC impacts on the rainfed olive groves in the Alentejo region and projected a significant increase in regional crop water requirements.
The soil water balance model ISAREG [19] is widely used to estimate crop irrigation requirements and has been validated for many crops and regions [20,21,22,23,24,25]. It has also been widely used in studies to assess the impacts of climate change on the CIR, such as the work developed by Popova [26] for maize in Bulgaria, the study conducted by Valverde et al. [12] for several crops, including olive orchards, in the Alentejo region, and a study applied to forages in central Portugal developed by Soares et al. [16]. Another example of the use of a soil water balance model to estimate the olive orchards CIR was carried out by [27] using the SIMDualKc model.
To assess the CC impacts on agriculture, climate change scenarios data are used. These climatic data are usually produced by RCM (dynamic downscaling) for different emission scenarios [3,28]. Those currently used are the Representative Concentration Pathways (RCPs), which are greenhouse gas concentration scenarios defined by the IPCC [29]: RCP2.6, RCP4.5, RCP6.0, and RCP8.5. These scenarios are defined for a given level of radiative forcing with the RCP4.5 (4.5 W m−2), an intermediate stabilization emissions scenario, and RCP8.5 (8.5 W m−2), a high emissions scenario, being the most used.
In the assessment of CC impacts on the CIR, it is necessary to take into account the uncertainties arising from the approaches adopted, namely, simplifications used in the soil water balance model, crop cycle adjustments according to the GDD, and a lack of knowledge on the effects of higher CO2 concentrations on crop evapotranspiration [8,10,11,30]. The climatic data produced by the RCM models introduce another layer of uncertainty in the CIR estimation due to the uncertainty in climate modeling, the downscaling method, and the evolution of future emission scenarios [3,6,29,31].
Given the expected negative effects of CC, it is necessary to develop adaptation measures, and the main ones, according to the literature, entail converting rainfed olive groves to irrigated intensive olive orchards, migrating this crop northward, adopting early flowering cultivars to reduce water stress during the critical flowering period, increasing irrigation efficiency, and establishing regulated deficit irrigation [8,11,14,32,33].
The present study assessed the impact of climate change on the super-intensive olive orchard irrigation requirements in the Alentejo region throughout the 21st century, and it also defined and evaluated adaptation measures based on regulated deficit irrigation, while allowing for the efficient and sustainable use of water.
2. Materials and Methods
2.1. Study Area
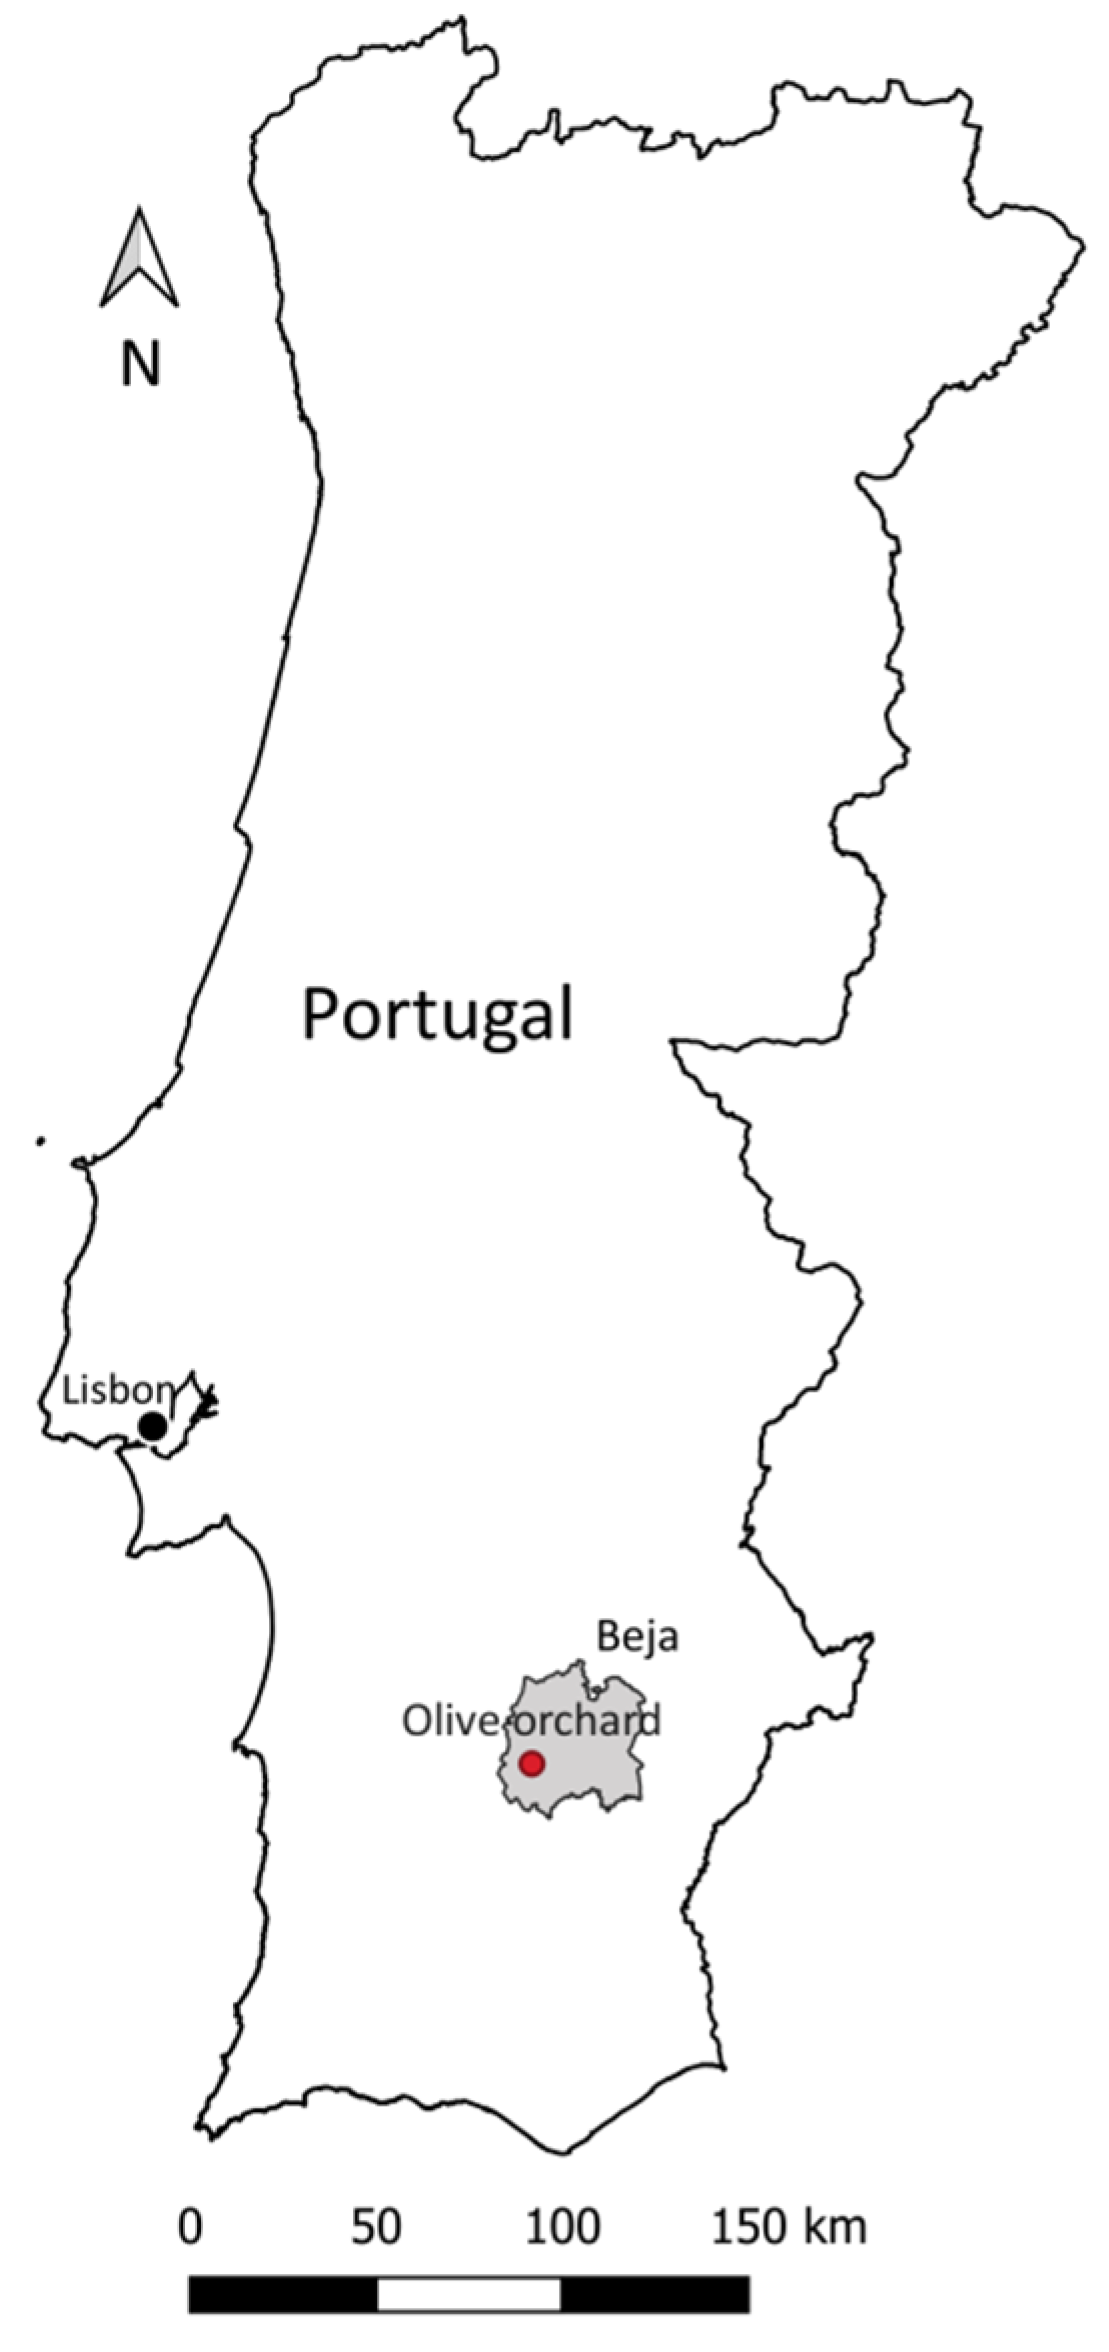
This study was performed in a super-intensive olive orchard (37°54′27″ N; 7°56′53″ W) in the municipality of Beja, Alentejo region, southern Portugal (Figure 1). The orchard comprises 285 hectares and two olive varieties, Arbequina and Arbosana, which are two of the most common used in super-high density olive orchards in the region. In this study, only the Arbosana variety was considered. The planting of the Arbosana sector was performed in 2015 with a very high density of 3.75 m × 1.35 m corresponding to 1975 trees ha−1. The olive orchard was irrigated using a drip irrigation system with one lateral per crop row equipped with emitters having a nominal flow rate of 2.3 L h−1 spaced 75 cm apart. In the most demanding period, irrigation was applied daily.
2.2. Soil
2.3. Climate
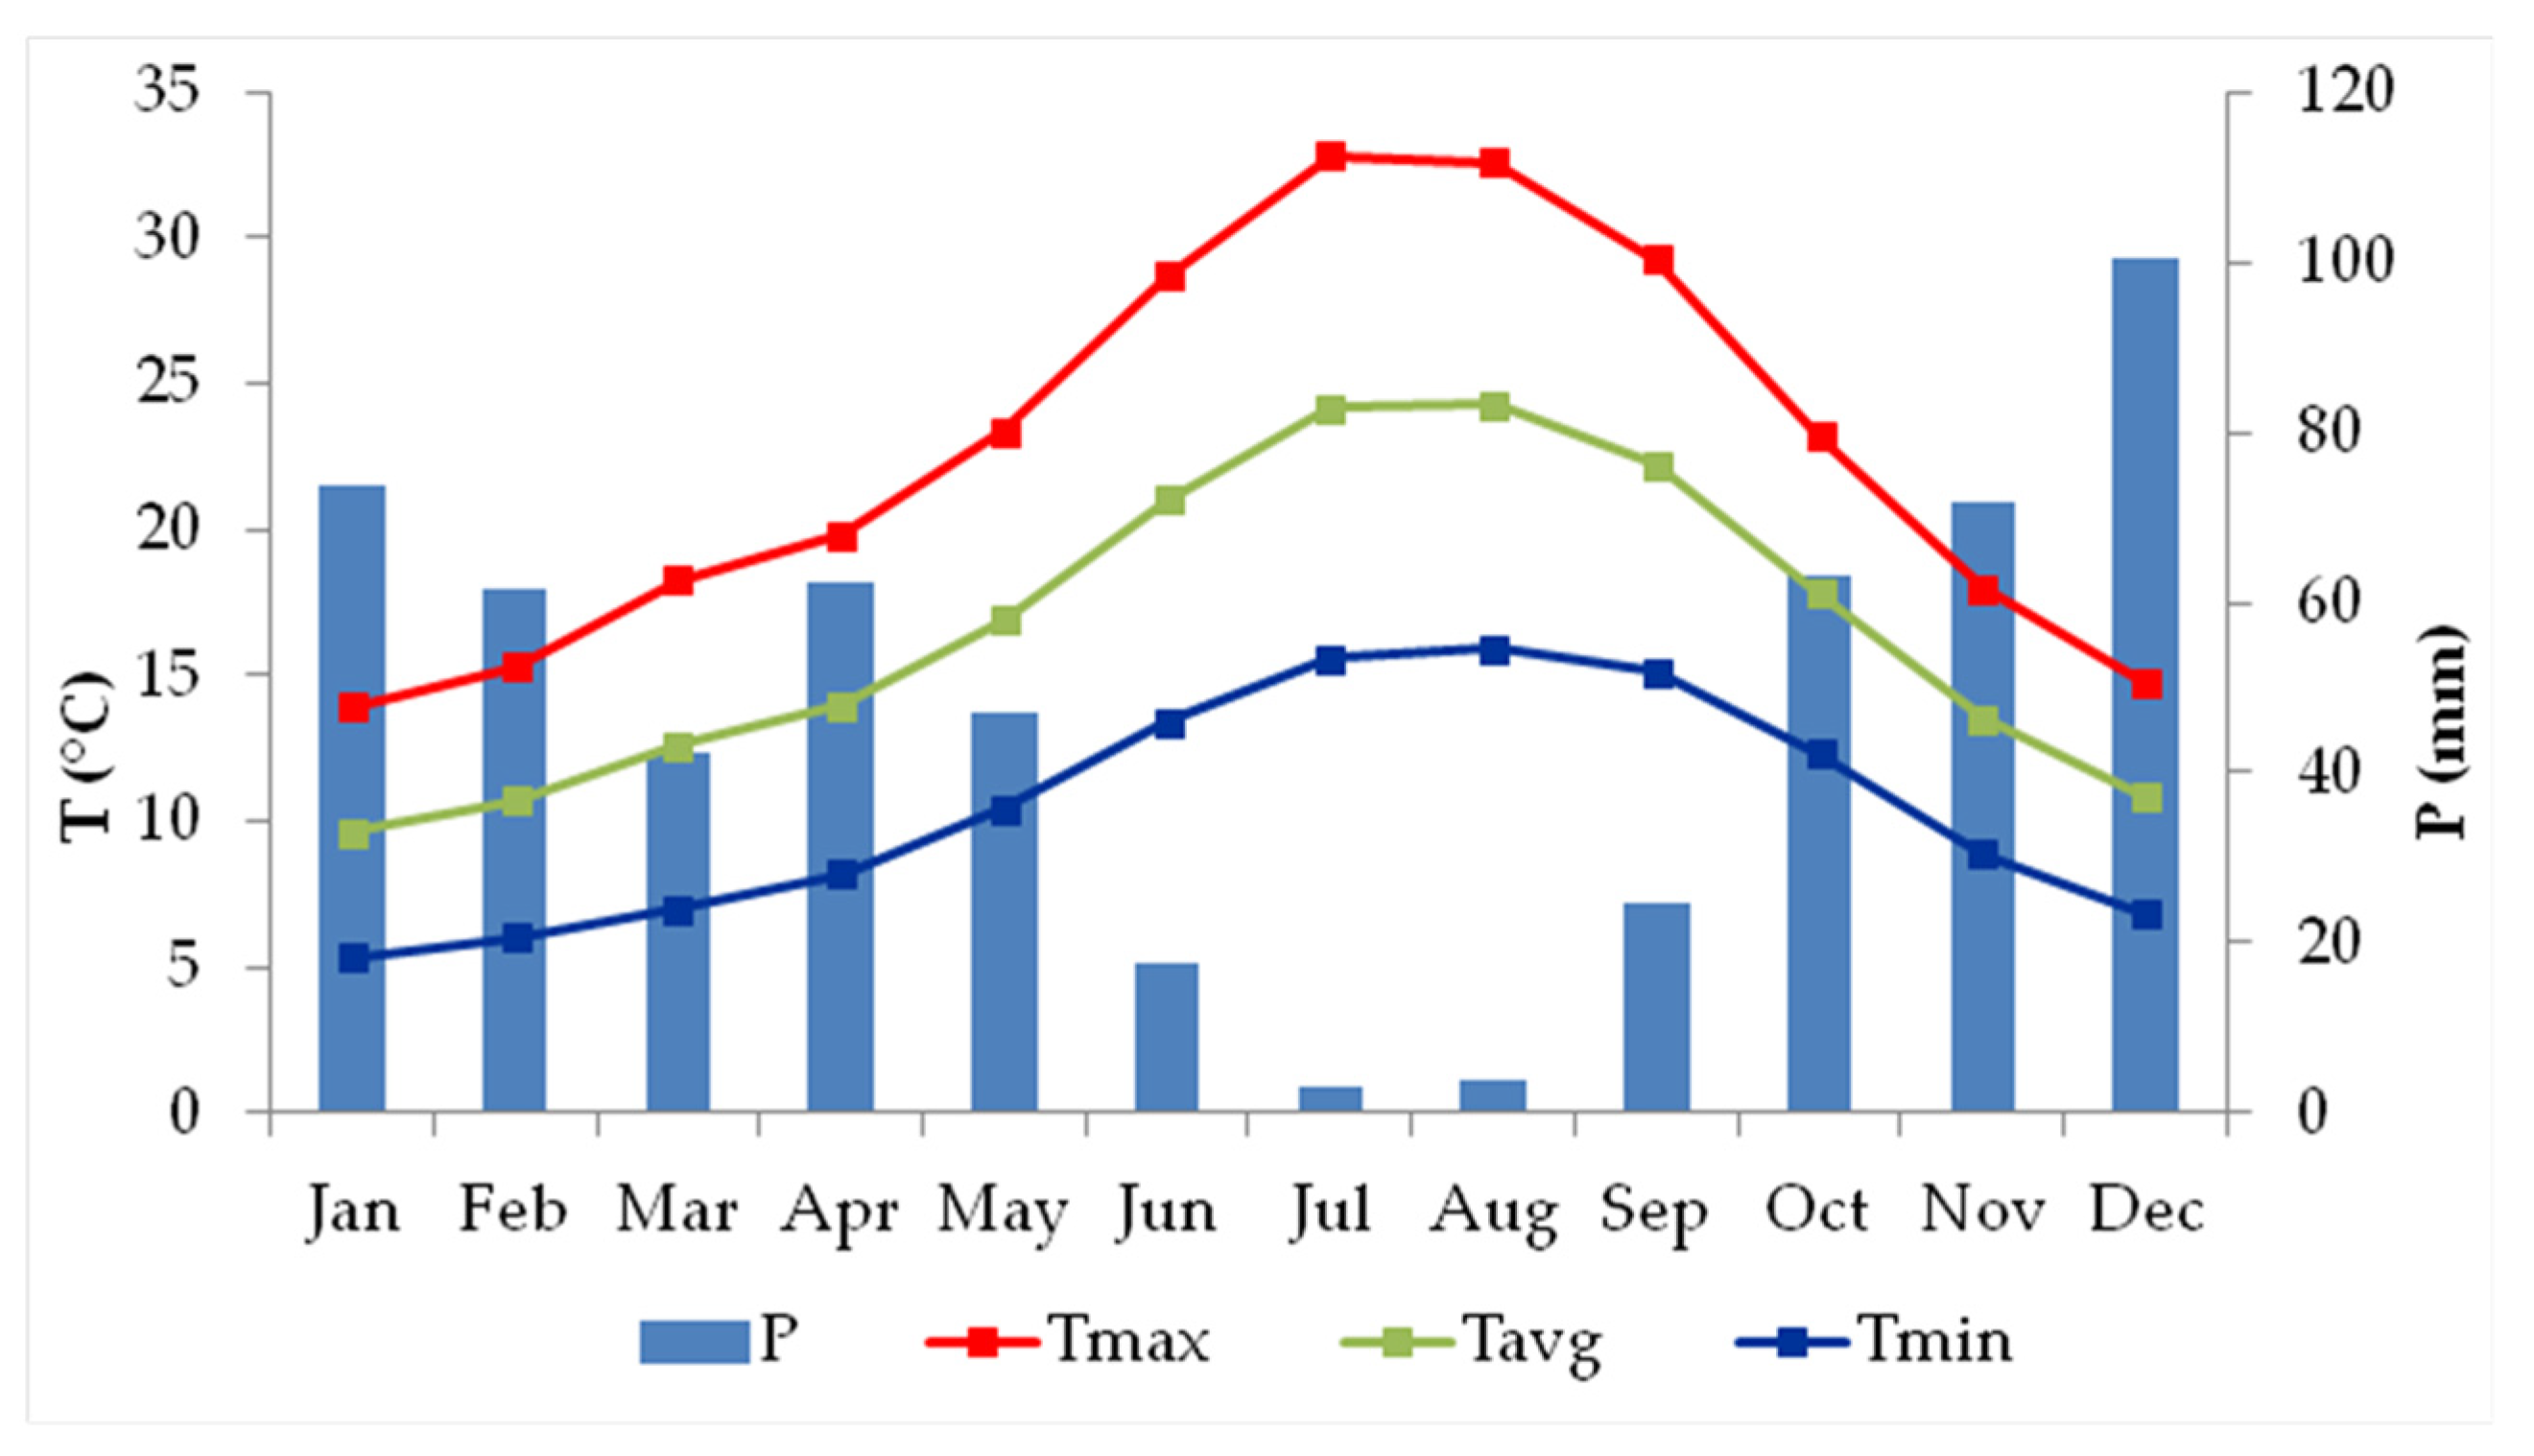
The climate in the Beja region according to the Köppen–Geiger classification system is Csa: temperate climate with hot dry summers and rainy winters [36,37]. The climate normals, for the period between 1971 and 2000 (reference scenario), from the Portuguese Institute for Sea and Atmosphere (IPMA) and registered at the Beja weather station (38°1′ N; 7°52′ W; 246 m a.s.l.) are shown in Figure 2. The average annual rainfall is 571.8 mm, which is mainly concentrated in the autumn and winter, with December and January the months with the highest precipitation: 100.6 mm and 73.7 mm, respectively. The monthly average temperatures range from a minimum of 9.6 °C in January to a maximum of 24.3 °C in August [37].
Climate Data Sets
Observed meteorological and climate change scenarios data were used to simulate the CC impacts on CIR. Daily climatic data relative to the reference period (1971–2000) came from the Beja weather station, which was the closest station. The climate variables were the maximum and minimum air temperature (Tmax and Tmin) and precipitation (P). Since all the meteorological variables required to compute reference evapotranspiration (ETo) with the FAO Penman–Monteith equation [38] were not available, the Hargreaves–Samani method (based on air temperature and on the extraterrestrial radiation) was used [39]:
where ETo is the reference evapotranspiration (mm day−1); Tm is the average daily temperature (°C); Tmax and Tmin are, respectively, the maximum and minimum daily temperature (°C); and Ra is extraterrestrial radiation (mm day−1). This equation presented good results in the estimation of ETo with reduced climatic parameters [40] and was applied in the Alentejo region by Teixeira et al. [41], demonstrating a good regional estimate of ETo.
Data for 2018 and 2019 from weather station Quinta da Saúde in Beja, belonging to the SAGRA (Sistema Agrometeorológico para a Gestão da Rega no Alentejo) network of COTR (Centro Operativo e de Tecnologia de Regadio), were used to parameterize the ISAREG model and to calculate the thermal time required for the olive phenological stages, namely, full flowering. This period corresponded to the available data relative to the farm irrigation scheduling (2018) and crop phenology (2018 and 2019).
For climate change scenarios until the end of the century, RCP4.5 and RCP8.5, corresponding to a radiative forcing of 4.5 and 8.5 W m−2, respectively, were considered [29,42]. RCP4.5, a controlled emissions scenario, and RCP8.5, a more pessimistic scenario, provided a range of possible impacts, considering the uncertainty in emissions scenarios evolution.
For these scenarios, we used climate data produced by RCM models under the EURO-CORDEX Project [28] and made available through the Climate Portal of IPMA [43]. The data of the Baixo Alentejo region were selected, consisting of an ensemble of models provided by the portal corresponding to the best scenario projection accordingly to IPMA [43]. In the portal [43], the monthly climatic anomalies for the RCP4.5 and RCP8.5 scenarios for all three projection periods available (2011–2040, 2041–2070, and 2071–2100) were considered. All three periods were used because the more distant scenario, 2071–2100, allowed for a clearer sign of the changes expected in olive orchard CIR until the end of the century, while the near future period, 2011–2040, provided information about which adaptation measures to take now to mitigate the impact of climate change.
The climatic anomalies were used to disturb the reference period (1971–2000) data of minimum and maximum temperature (°C) and precipitation (mm) recorded at the Beja weather station with the purpose of correcting bias in the future climate scenarios. These corrections were made using the delta change method [6,9,44,45,46], which assumed the following expression for air temperature:
where Tscenario is the corrected temperature for the climate change scenario (°C); Thistorical is the temperature observed in the reference period (1971–2000) (°C); and Tanomaly corresponds to the difference between the air temperature simulated by the RCM for climate change scenarios (RCP4.5 and RCP8.5) and the temperature simulated by the RCM for the reference period (1971–2000) (°C).
For the precipitation variable, the delta change method is given by the following equation:
where Pscenario is the corrected precipitation regarding the climate change scenario (mm); Phistorical is the precipitation observed in the reference period (1971–2000) (mm); PRCMscenario is the average monthly precipitation simulated by the RCM for the climate change scenario (mm); and PRCMreference is the average monthly precipitation simulated by the RCM for the reference period (1971–2000) (mm).
2.4. Crop
To simulate the soil water balance, the crop coefficient (Kc) values defined in Pastor [47] were considered. These values, shown in Table 2, were defined for Córdoba for an olive orchard having 60% ground cover. These values ranged from 0.45 to 0.65, with the highest values corresponding to the periods more sensitive to water stress. A root depth of 0.6 m and a depletion fraction of 0.4 were considered [38].
The olive crop cycle was adjusted to the different climate change scenarios according to the methodology described by Melo-Abreu et al. [18], which was also followed by Tanasijevic et al. [11] as detailed in the next section. After determining the olive crop phenology for each climate scenario, the Kc curves were constructed.
2.5. Phenology
To characterize the olive orchard growth cycle, the main phenological stages of olive trees described by Sanz-Cortés, et al. [48] were used. These stages were separated into A—the beginning of the cycle, B—the last phase of blossom, C—full flowering, D—the first phase of the fruit development, E—fruit set, F—the peak of oil accumulation, G—the end of the peak of oil accumulation, H—the end of pit hardening, and I—fruit ripening/harvest.
The three periods when the olive crop is more sensitive to water stress, as described by Fernández et al. [49], are from cycle beginning until full blossom (stages A until C), from the end of the first phase of fruit development until the fruit set (stages D until E), and from peak of oil accumulation until the end of pit hardening (stages F until H) when a marked increase in oil accumulation occurs. Consequently, the periods when irrigation depths can be reduced are from the end of full flowering until the beginning of fruit development (stages C until D), and mainly from fruit set until the beginning of oil accumulation (stages E until F). Although fruit size can be affected by a reduction in water supply in this period, the olive tree is highly resistant to drought during the summer dormancy period and can easily recover with a reduced impact on crop yield [49].
The olive phenology was adjusted to the CC scenarios using the methodology described by Melo-Abreu et al. [18], as mentioned before. To estimate the full flowering date, only the forcing phase was considered, with the thermal time accumulated from 1 February as in Tanasijevic et al. [11]. The thermal units required for Arbosana full flowering were estimated based on the phenological data registered for 2018 and 2019. Based on these values, full flowering dates were estimated for the future CC scenarios. To calculate the thermal time, expressed in GDD, the method described by McMaster and Wilhelm [50] was used:
where Tmax is the daily maximum air temperature(°C); Tmin is the daily minimum air temperature (°C); and Tb is the base temperature (°C) corresponding to the temperature below which the accumulation of thermal time does not occur. Was used a Tb of 8.5 °C as recommended by Melo-Abreu et al. [18] to accumulate the GDD until the full flowering for 2018 and 2019, and based on the GDD values, the full flowering dates for the future CC scenarios were predicted. The dates of the following phenological stages were also estimated for the CC scenarios using the GDD obtained for 2018 and 2019. These data were complemented by information obtained from Sanz-Cortés et al. [48] and Fernández [51].
2.6. Adaptation Measures
Olive orchard adaptation to the climate change in the Mediterranean will involve several adaptation measures [11,33]. One of the most suitable is deficit irrigation to adjust the expected increase in climate demand (ETo) to the reduction in water availability. In this study, two adaptation measures to CC corresponding to different irrigation management strategies were evaluated.
2.6.1. Current Irrigation Management (CIM)
This adaptation measure considered present base conditions and current irrigation management in a scenario of water availability for irrigation in which current olive production is maintained. It corresponded to the upper limit of the impacts on the CIR in future CC scenarios.
2.6.2. Deficit Irrigation Management (DIM)
This adaptation measure presumed a water shortage scenario because of climate change, with considerable impacts on water availability for irrigation, so a regulated deficit irrigation management strategy was adopted. In this adaptation measure, water deficit levels were increased in crop periods that were less sensitive. The main period when irrigation can be reduced is from fruit set to the beginning of oil accumulation.
2.7. Crop Irrigation Requirements Modeling–Climate Change Impacts and Adaptation Measures Evaluation
To assess the impact of CC on the CIR of the super-intensive olive orchard, the soil water balance simulation was performed using the ISAREG model [19], which is based on the single Kc approach and uses daily or monthly meteorological data [38]. This model allows the determination of the CIR, the definition and evaluation of irrigation scheduling, and the calculation of the irrigation system design parameters, seasonal irrigation requirements, and design flow rate. This model simulated the soil water balance according to the following equation [19]:
where ΔS is the variation of the soil water storage (mm); P is precipitation (mm); ETc is crop evapotranspiration (mm); Ir is irrigation depth (mm); Ro is surface runoff (mm); CR is the capillary rise (mm); and DP is deep percolation (mm).
ΔS = P − ETc + Ir − Ro + CR − DP
2.7.1. Model Parameterization
The ISAREG model was parameterized for olive orchard field conditions prior to simulating the CIR for the different climate scenarios and projection periods. The irrigation depths applied by the farmer in 2018 were used as inputs in the soil water balance to produce a daily time series of simulated soil water content (SWC) values to be compared with the SWC measured by one capacitive soil probe installed in the irrigation sector. The fraction of surface wetted by irrigation (fw), as defined by Allen et al. [38], was the adjustment parameter that was used to adjust the irrigation depths to the fraction of the wetted soil surface. This parameter (fw) was estimated iteratively until the SWC values simulated by the model were in agreement with the values observed by the probe. The capacitive soil probe was installed in the wet bulb area, in the trees row, located between two olive trees and between two drippers. The probe uses the Frequency Domain Reflectometry (FDR) method and had three soil moisture sensors at 0.10, 0.30, and 0.60 m.
2.7.2. Irrigation Requirements Modeling
The impact of climate change on the CIR of a super-high density olive orchard in Beja was simulated considering three different climate scenarios, the reference scenario (1971–2000), and the CC scenarios RCP4.5 and RCP8.5 for the three projection periods 2011–2040, 2041–2070, and 2071–2100. For each RCP scenario, the phenology of the olive orchard was adjusted according to the thermal time. Additionally, for the climate change scenarios, two adaptation measures, CIM and DIM, corresponding to two different irrigations management strategies, were applied. In DIM, a regulated deficit irrigation strategy was simulated, since there were several studies that indicated that this strategy seemed to produce the best balance between water saving and yield loss. In addition to water saving, it also constituted a way to control the vegetative development that tends to be excessive in the super-intensive olive production system and to improve the quality of the olive oil [51,52].
In all, 14 simulations were performed: two involved the reference scenario (1971–2000) and the two adaptation measures (CIM and DIM); the other 12 corresponded to combinations of the two climate scenarios (RCP4.5 and RCP8.5), the three projection periods (2011–2040; 2041–2070; 2071–2100), and the two adaptation measures (CIM and DIM).
In the CIM adaptation measure, full irrigation was provided considering the Kc values proposed by Pastor [47]. In the second adaptation measure (DIM), water stress was increased as a way to reduce irrigation water consumption. Table 3 presents the percentages of irrigation requirements supplied during each crop period in the DIM adaptation measure. These values were based on the definition of the most sensitive water stress periods by Fernández et al. [49], which correspond to those where irrigation requirements must be fulfilled at 100%: up to full blossom (A–C) and from the peak of oil accumulation to the end of pit hardening (F–H). In the first phase of fruit development until the fruit set (D–E), an excess of water stress can decrease the fruit size [53]; therefore, the CIR was provided at 80% as recommended by Fernández et al. [49]. Compared to the values proposed by Fernández et al. [49], the CIR was reduced by 40% instead of 20% in some periods to avoid high yield losses corresponding to a more moderate deficit strategy.
3. Discussion and Results
3.1. Climatic Data (Climate Change Scenarios)
As a consequence of CC, increases in average air temperature and reference evapotranspiration (ETo) associated with a decrease in annual precipitation are expected by the end of the century for the Alentejo region. The expected anomalies for the two scenarios in the three periods considered are shown in Table 4.
Compared to the reference period, average temperature increases of 0.8–1.9 °C are expected for the RCP4.5 scenario and increases of 1.0–3.8 °C are expected for RCP8.5 (Table 4). These anomalies are within the range of the IPCC [42] and Miranda et al. [3] toward the end of the 21st century (2071–2100), in which temperature increases will be 1.1–1.6 °C for the RCP4.5 scenario and 2.6–4.8 °C for RCP8.5.
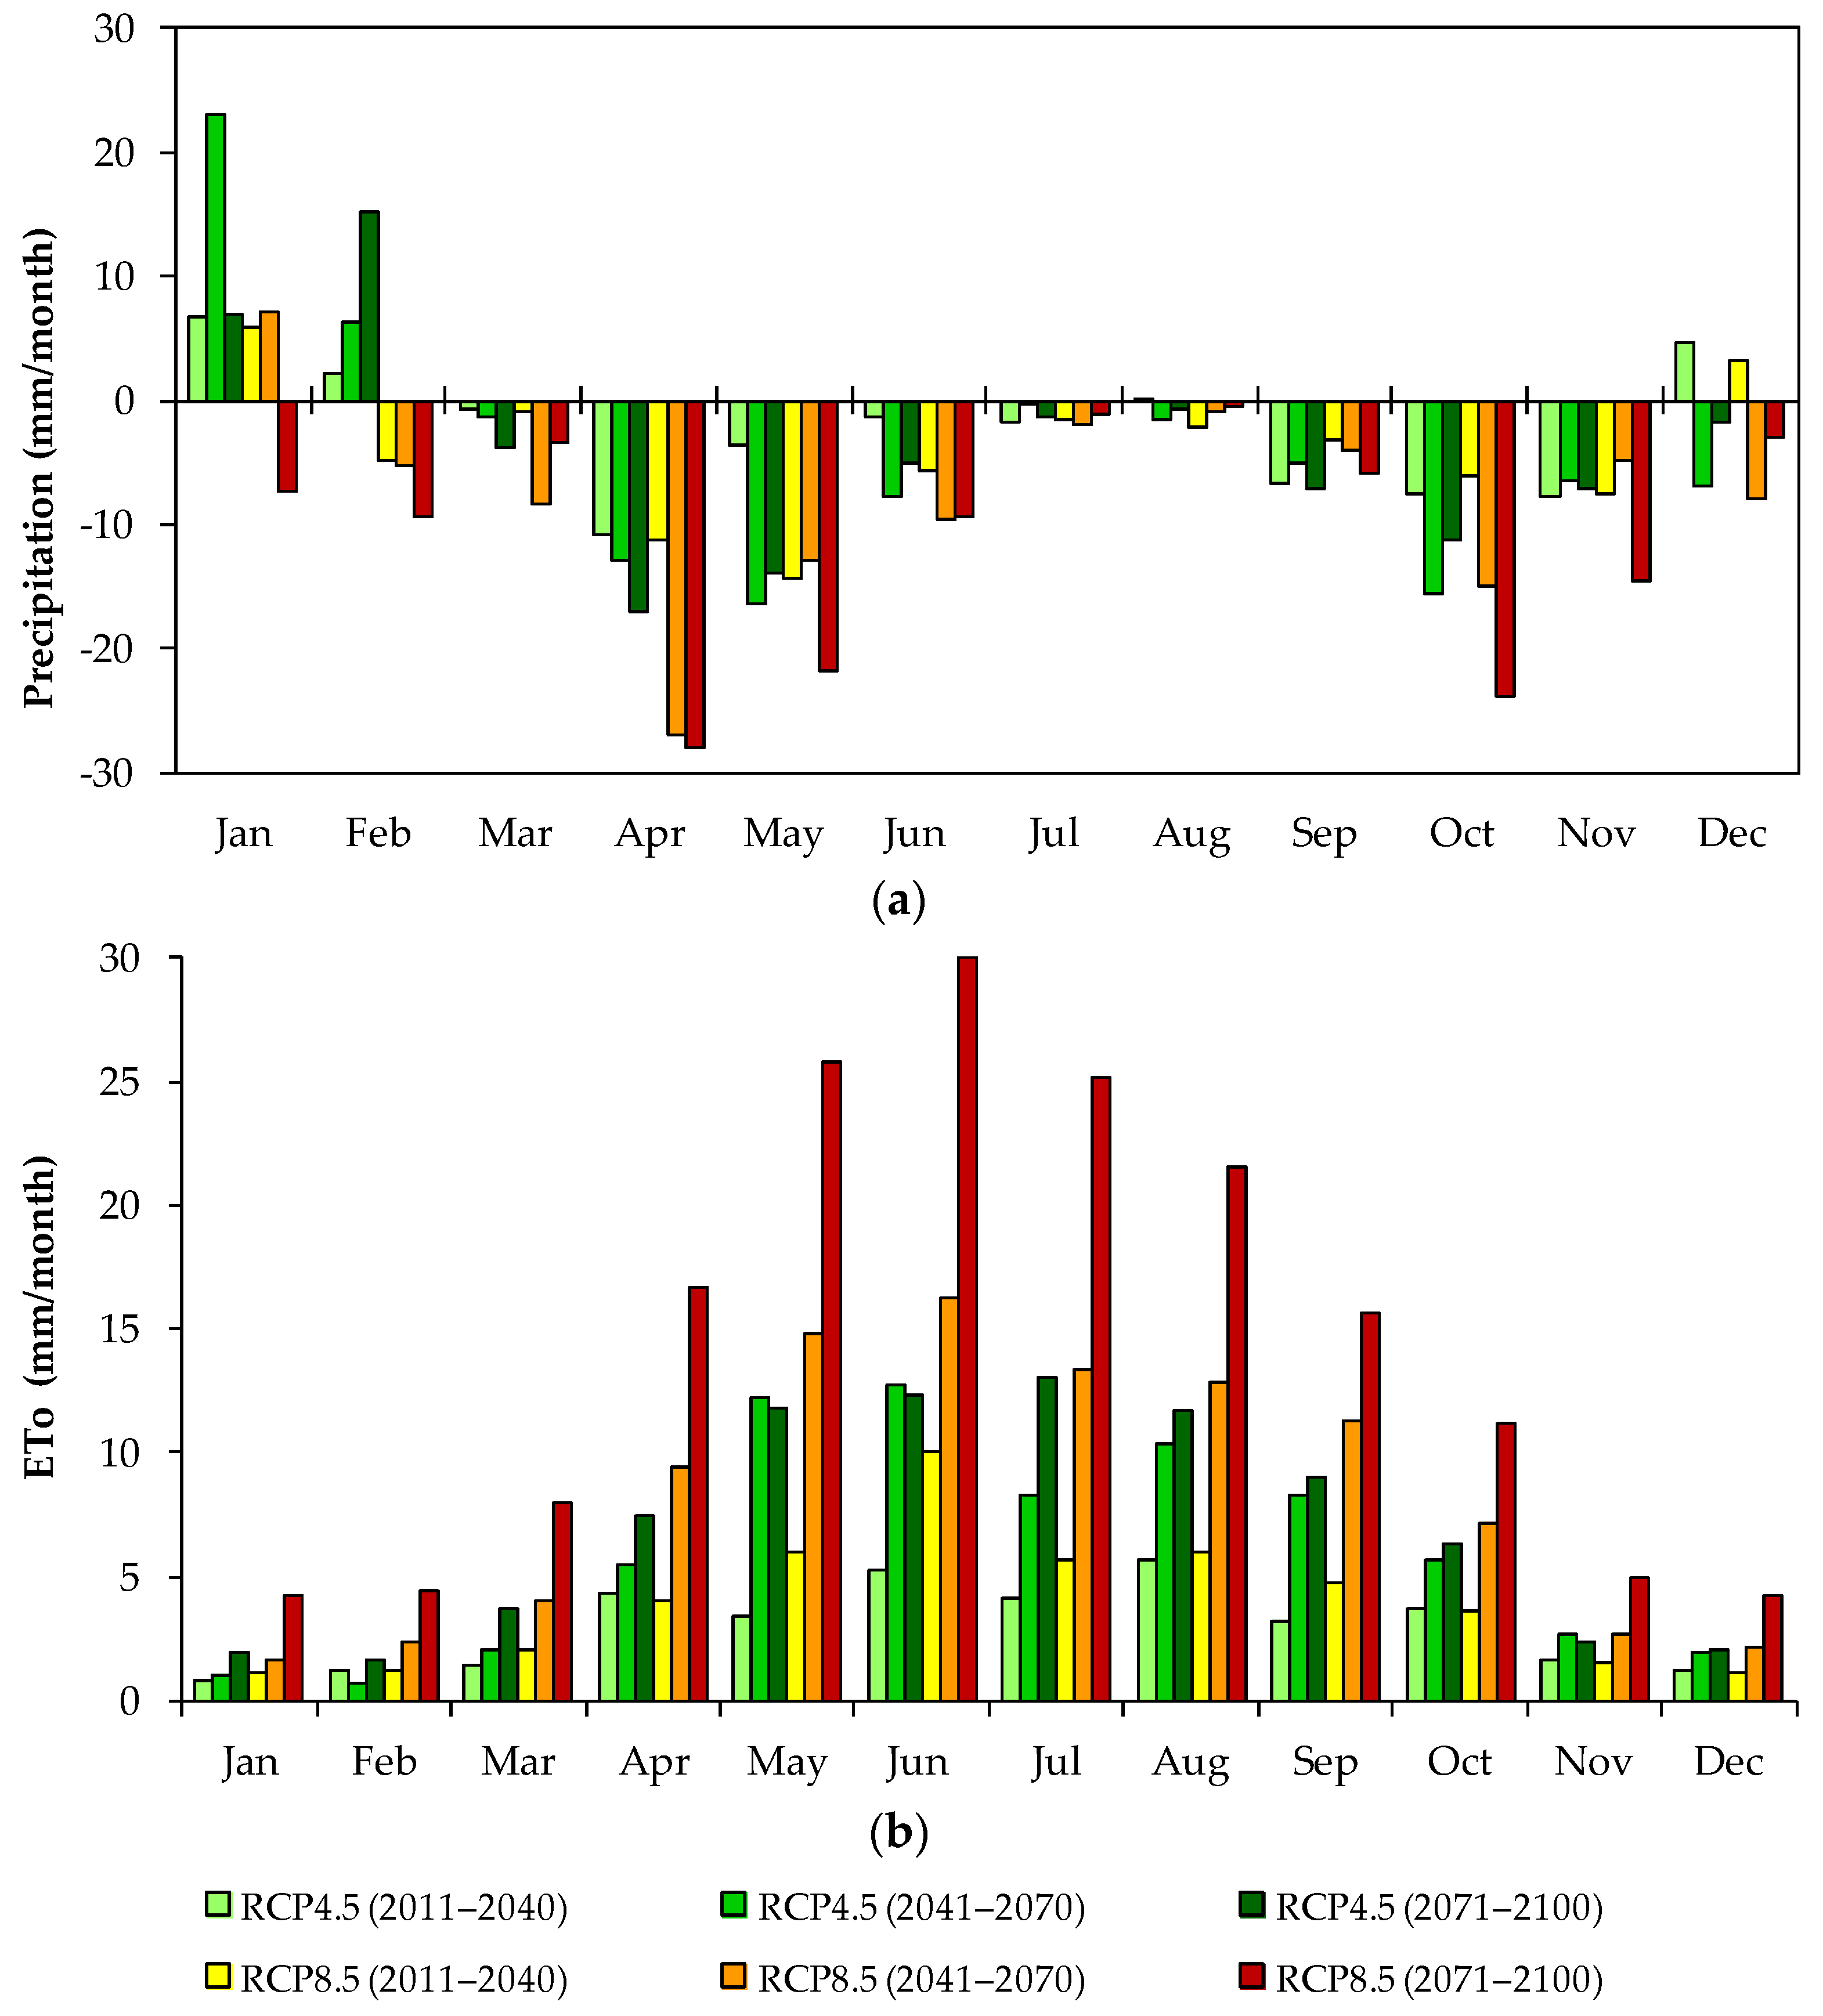
In the RCP4.5 scenario, by 2100, the average annual precipitation is expected to fall by 8.3%, while in the RCP8.5 scenario, a reduction of 22.4% is predicted. The annual decreases for Beja between the reference period and the CC scenarios fall within the range of values described by Pires et al. [4]: 5–10% (25 to 60 mm) for RCP4.5 and 10–30% (up to 170 mm) for RCP8.5. As Figure 3a shows, the precipitation reduction for the CC scenarios is not uniform throughout the year, with an very expressive reduction in the spring (April and May) and autumn (October and November), but an increase in the winter, especially in RCP4.5. Thus, an increase in the length of the dry season with irrigation starting earlier can be anticipated. Increases from the reference evapotranspiration (ETo) for 2071–2100 will vary between 6.6% for RCP4.5 and 13.5% for RCP8.5 (Table 4) with the greater increases observed in the summer, especially for RCP8.5 (Figure 3b).
3.2. Phenology
The dates of the phenological stages were estimated for the reference period and the CC scenarios using the average sum of the GDD observed in the field in 2018 and 2019. To reach full flowering, it was necessary to accumulate, on average, 540 °C.
The estimation of the full flowering date for the different climate scenarios is presented in Table 5, where an earlier onset of up to 29 days is obtained in the most severe scenario. These results are in line with those described in the bibliography, which projected an earlier full flowering date in the Mediterranean region due to warmer air temperature of up to 34 days in the most unfavorable scenario (RCP8.5) [11,54,55,56,57,58].
It is important to note that until full flowering, a stage that is highly sensitive to water stress, irrigation requirements must be fully met. In the CC scenarios, the full flowering date can be up to 1 month early, which means that the Alentejo region can expect olive full flowering to occur on average more frequently in early May (Table 5). Since a significant decrease in precipitation is projected for April and May for both RCP scenarios (Figure 3a), this will translate into an earlier start to the irrigation season.
3.3. Model Parametrization
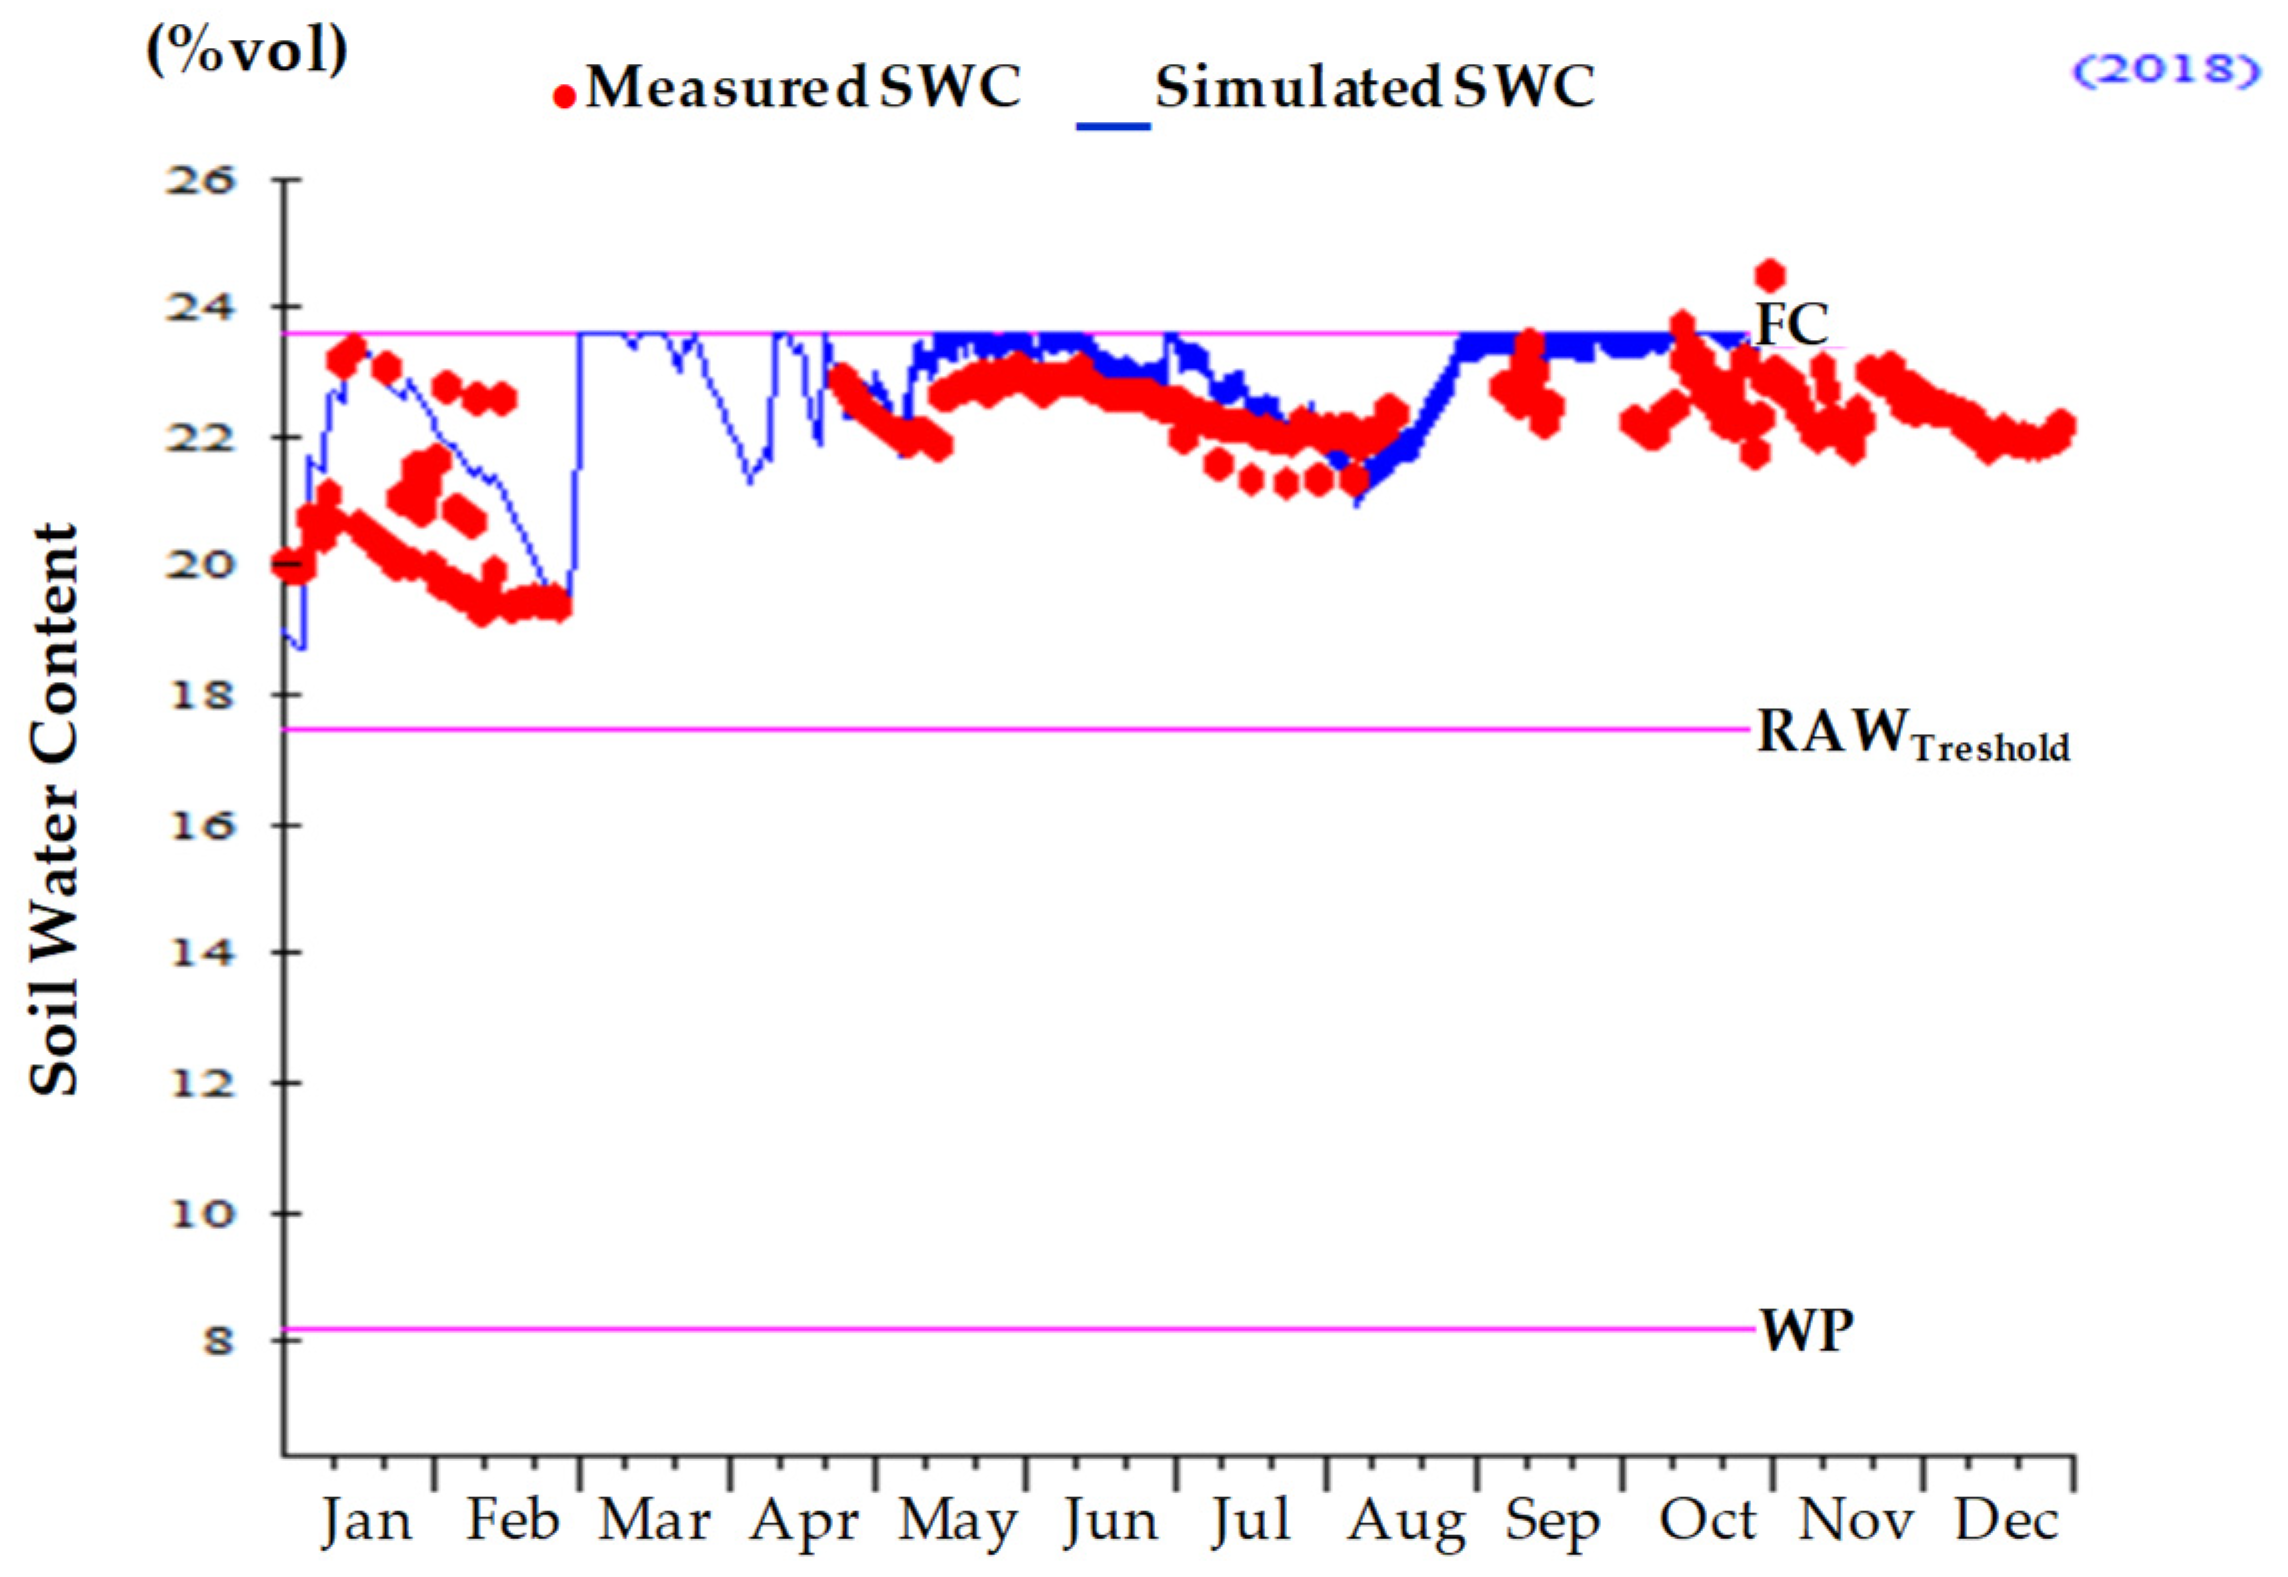
The soil water balance simulation model ISAREG was parameterized for the conditions of the olive orchard, and the result for the 2018 irrigation season is presented in Figure 4. There was good agreement between the observed SWC data measured by the capacitive probe (red dots) and the SWC simulation of the ISAREG model (blue line) based on the irrigation depths applied by the farmer. The root mean square error (RMSE) between the simulated and observed values was 1.00% (volumetric fraction) and the mean relative absolute error (MRAE) was 0.03, which confirmed the good agreement between the two datasets. Hence, the suitability of the ISAREG model to perform the calculation of the CIR for the studied olive orchard was confirmed. The reduction factor fw = 0.55 was used to adjust the CIR simulated by the model to the total field area.
3.4. Crop Irrigation Requirements Simulation
3.4.1. Current Irrigation Management (CIM)
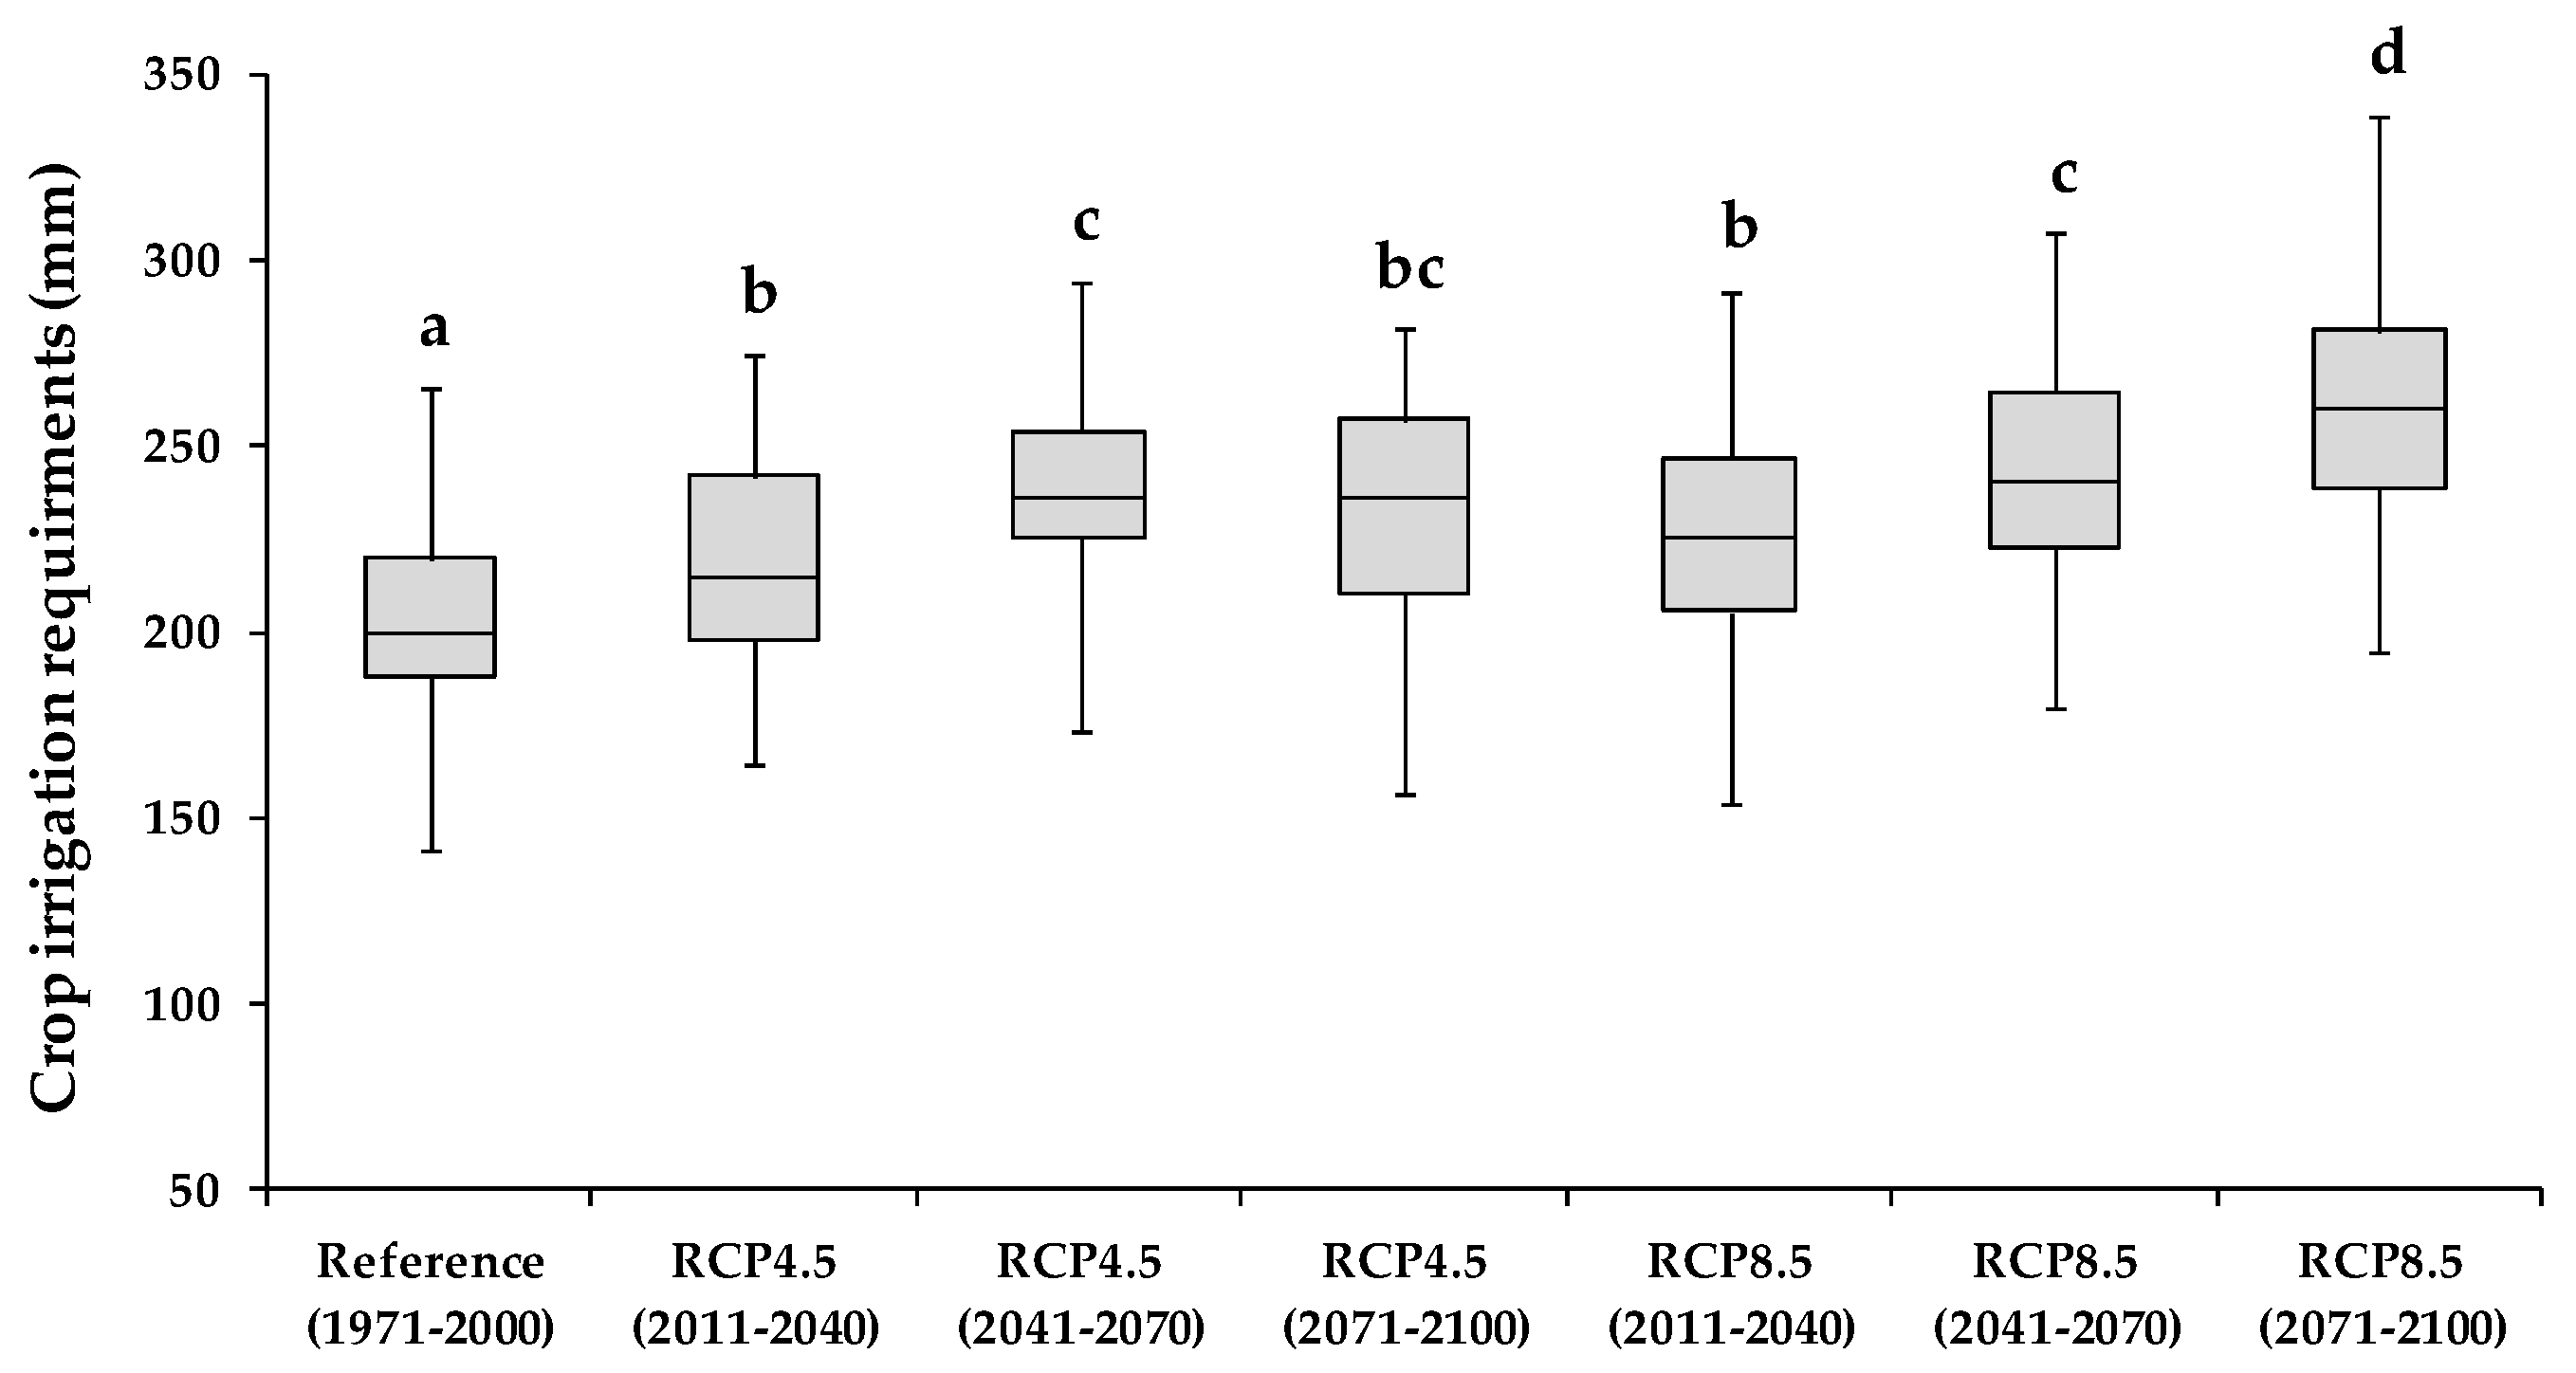
The results for the CC scenarios showed that irrigation requirements will increase, compared to the reference scenario if the current irrigation management is maintained (Figure 5). On average, the annual net irrigation requirements in the reference period (1971–2000) was 199.9 mm, and for 2071–2100, it will be 232.1 mm in the RCP4.5 scenario and 262.7 mm in the RCP8.5. It was found through an ANOVA one-way analysis (not shown) that in the case of the CIM, all the scenarios presented significant differences compared to the reference scenario at a significance level of p = 0.05.
If current irrigation management (CIM) is maintained, irrigation requirements will increase from 9.6% to 17.7% in the RCP4.5 scenario and from 12.8% to 31.4% in RCP8.5. The highest CIR values occur in the last period (2071−2100) of the RCP8.5 scenario (Figure 5), which is a result of higher temperatures that will lead to higher ETo values and the highest reduction in projected precipitation (Table 4), with RCP4.5 presenting a reduction of −8.3% and RCP8.5 presenting more than double −22.4%.
The results were in accordance with the study conducted by Tanasijevic et al. [11] where an average increase in the CIR of 18.5% was projected for the Mediterranean for the period 2036–2065, which corresponds to an average increase of 70 ± 28 mm. Paulo and Pinto [8] reported increases in the CIR, for 2071–2100 of more than 40% for the olive crop in the Alentejo region, which can be explained by the higher precipitation reduction in the climate scenarios data (A2 and B2). Tanasijevic et al. [11] and Paulo and Pinto [8] stated that the CIR increases projected for the CC scenarios are mainly due to the increase in ETo and reduction in precipitation, which are results that the present study confirmed.
3.4.2. Deficit Irrigation Management (DIM)
The second irrigation management adaptation measure (DIM) assumed that CC would affect water availability, and as such, irrigation would have to be performed with water stress. The Kc values used to simulate this adaptation were adjusted iteratively for each climatic scenario and crop growth period until the water stress levels corresponding to the percentage of irrigation requirements presented in Table 3 were obtained. The adjusted Kc values are shown in Table 6.
The highest values of adjusted Kc occurred until the full flowering stage and again in periods F–G and G–H, which correspond from the peak of oil accumulation until the end of pit hardening, which is a period when the olive grove is very sensitive to water shortage. On the other hand, the lowest adjusted Kc values corresponded to period E–F, when summer dormancy occurs and the olive tree is highly resistant to water stress [49,59,60,61,62,63]. The CIR projected to the CC scenarios considering the DIM adaption measure is shown in Figure 6.
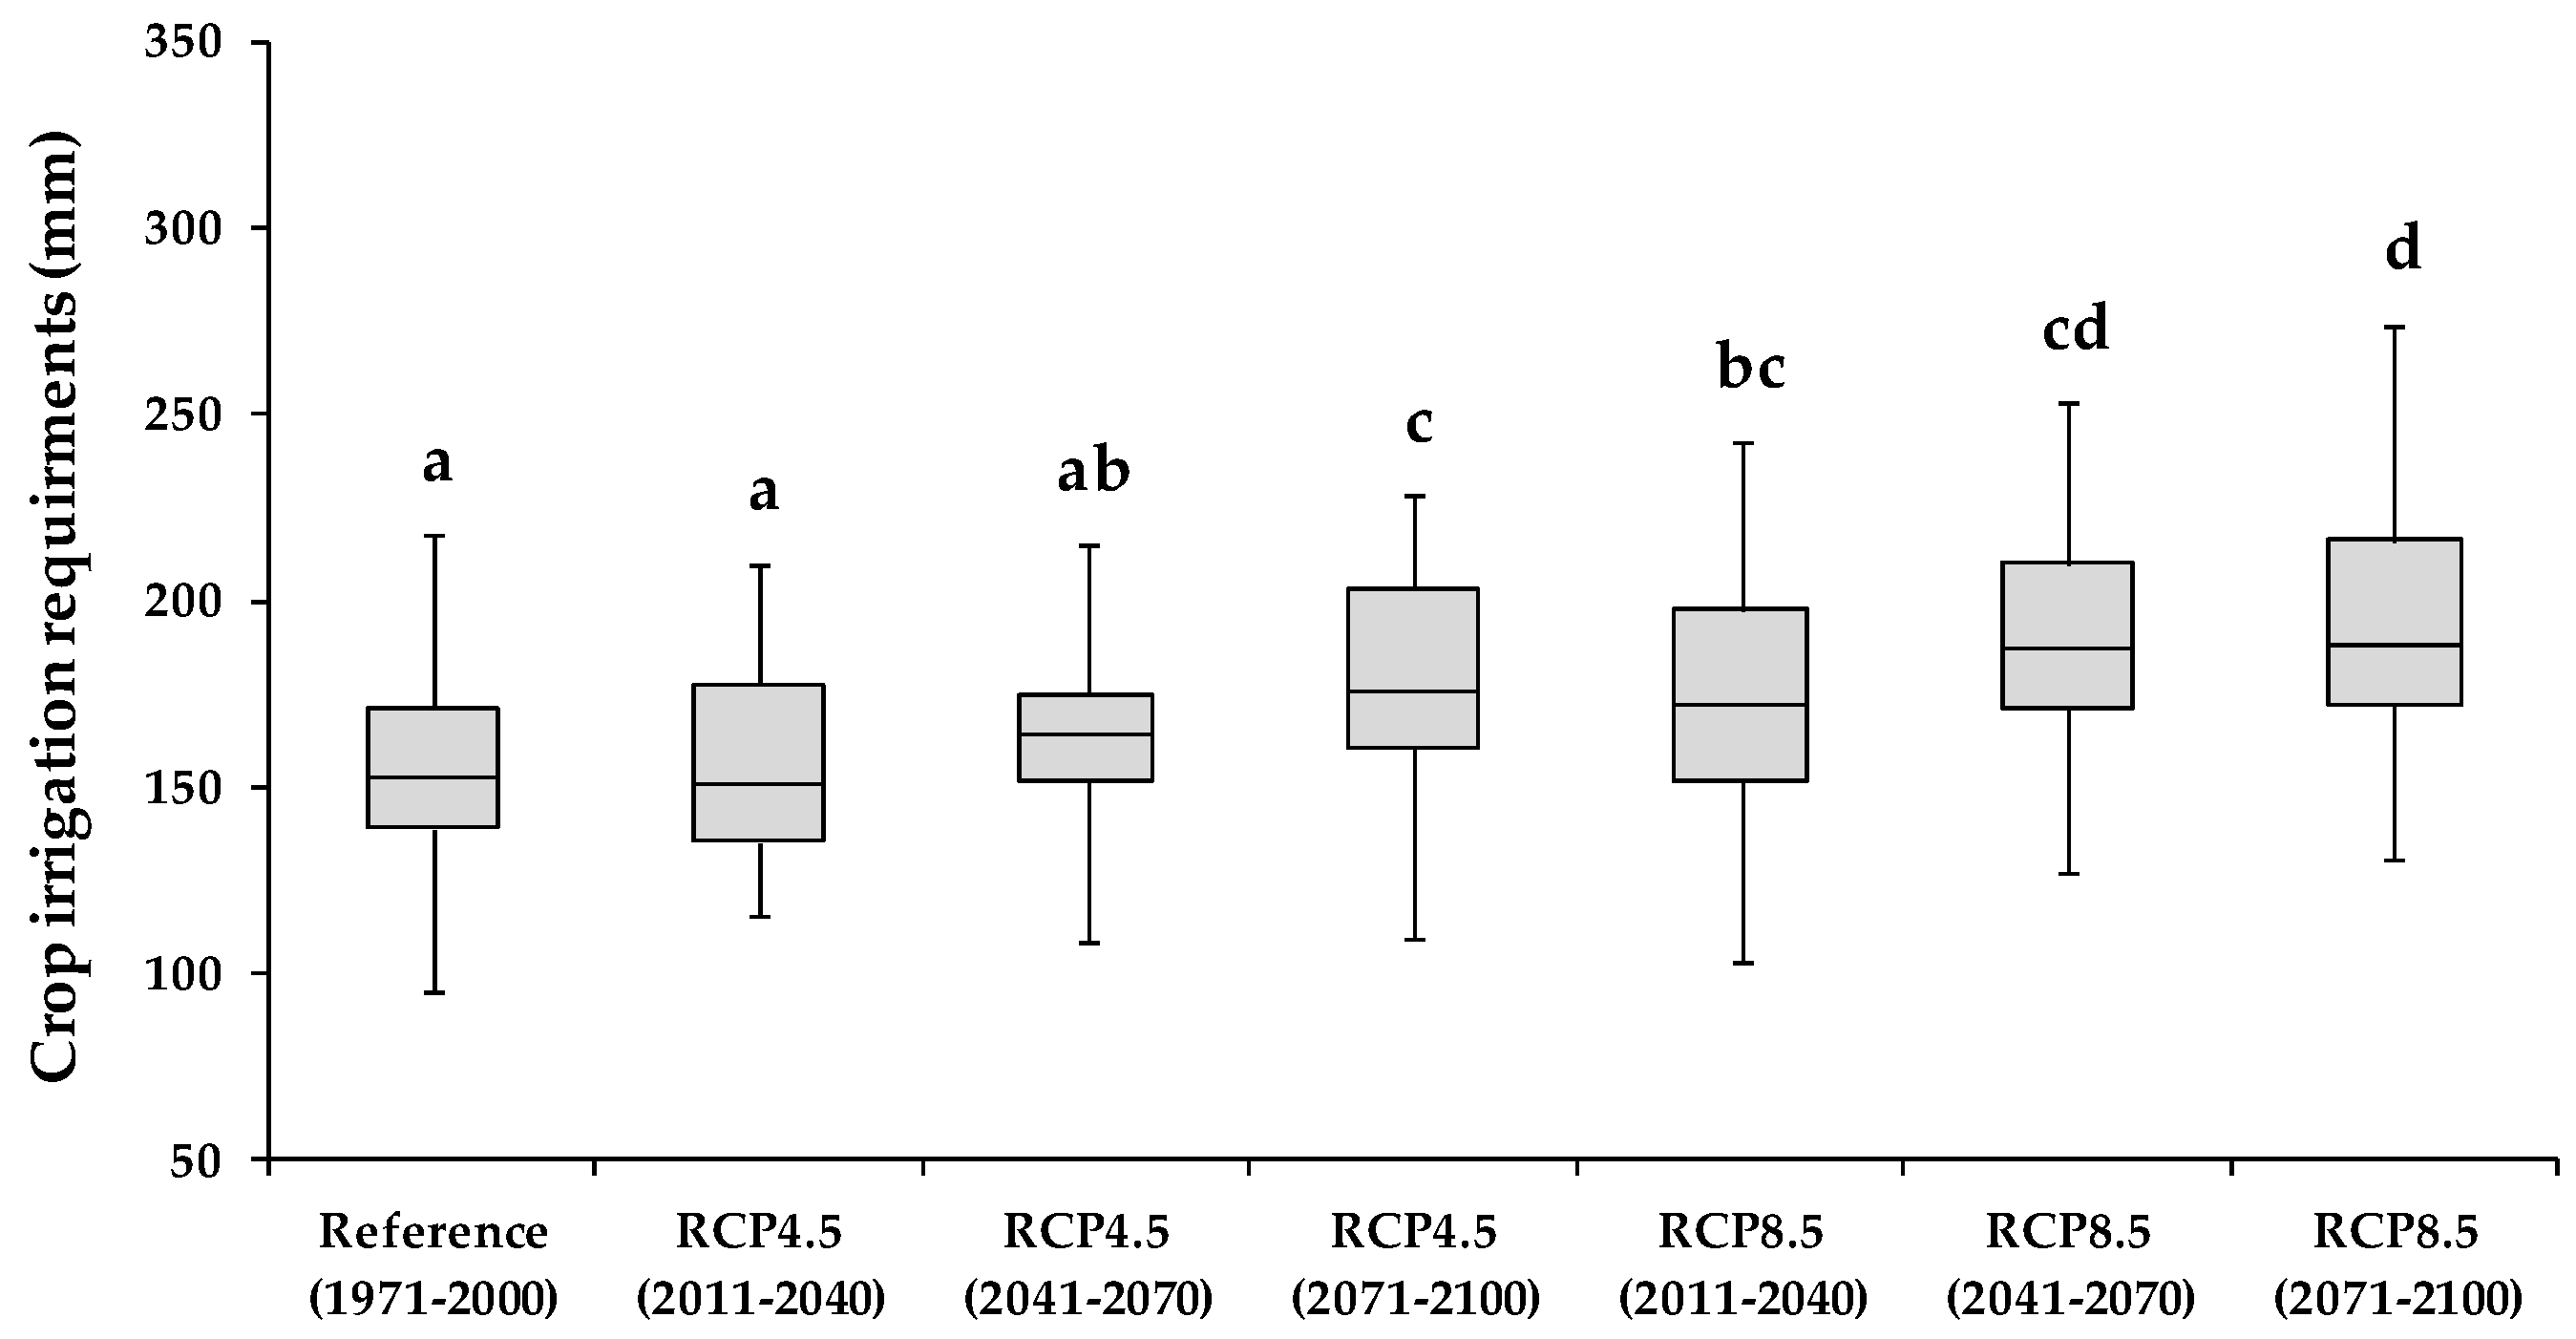
Figure 6 shows that the CIR increased in the CC scenarios within the DIM option. The average annual net irrigation requirements for the DIM adaptation measure were 154.9 mm for the reference period (1971–2000), and 178.9 mm for RCP4.5 and 193.2 mm for RCP8.5 for the period 2071–2100 (Table 7). After comparing these CIR values to those obtained for the reference period (1971–2000) for the CIM adaptation measure (199.9 mm), regulated deficit irrigation proved to be effective at reducing the CC impacts on CIR. The ANOVA one-way analysis showed for the DIM option that CIR were significantly different for all scenarios compared to the reference scenario, with the exception of RCP4.5 (2011–2040) and RCP4.5 (2041–2070), at a significance level of 0.05. In the water scarcity scenario (DIM), the applied irrigation volume was reduced, especially between July and August, before maturation in period E–F. According to several authors [49,59,60,61,62], reductions in the applied irrigation depths at this stage did not significantly reduce fruit production and may even have contributed to improved olive oil quality. The water saved by adopting DIM represented on average about 53.2 mm in scenario RCP4.5 and 69.5 mm in RCP8.5 (2071–2100) compared to CIM.
The CC impacts on the CIR, expressed as a percentage of variation between the reference scenario (present conditions) and future CC scenarios under the two adaptation measures (CIM and DIM) are summarized in Table 7. It shows that DIM can reduce irrigation water consumption by −22 to −11% in RCP4.5 and −13 to −3% in RCP8.5.
Contrary to what is projected for annual crops where an increase in net irrigation requirements is expected, when the current crop growing season is maintained [9], for the olive crop, being a permanent crop well adapted to the Mediterranean region [52], with the capacity to tolerate water stress, the CIR can be reduced by adopting regulated deficit irrigation strategies even if the irrigation season is lengthened because the phenological stages start earlier. In fact, the CC impacts simulations showed that there is a considerable margin to adjust irrigation water consumption to the expected reduction in water availability, thereby maintaining crop production in this region in the future. Therefore, it is verified that the CC impacts on super-intensive olive production will depend to a large extent on the farmers’ capacity to adapt.
4. Conclusions
In this study, an assessment of climate change impacts on the irrigation requirements of a super-high-density olive orchard in the Alentejo region was performed, and an adaptation measure based on regulated deficit irrigation was proposed and evaluated.
The climate change scenarios data projected an average temperature increase for the Alentejo region until 2100 of 1.9 °C in the RCP4.5 scenario and 3.8 °C in the RCP8.5 compared to the reference scenario (1971–2000). Due to a predicted increase in average air temperature, an average increase in reference evapotranspiration of 6.6% in the RCP4.5 scenario and 13.5% in RCP8.5 was projected. A reduction in average annual precipitation was also projected at the end of the century: −8.3% for the RCP4.5 scenario and −22.4% for RCP8.5. These climate changes point to an increase in the crop irrigation requirements associated with less water availability.
The results projected that until 2100, the full flowering date will be earlier between 16 days on average for RCP4.5 and 29 days for RCP8.5, which means that olive trees blooms in the Alentejo region will occur more frequently in early May. For the CC scenarios, the earlier full flowering combined with the marked reduction in precipitation in April and May will lead to an earlier start of the irrigation season. Regarding this earlier bloom date and the more rapid accumulation of thermal time, it would seem important to study in the future the impacts on super-intensive olive orchards regarding cold accumulation.
The projected CC will lead to an increase in the CIR; however olive orchards, unlike other crops, can withstand pronounced deficit irrigation strategies. Maintaining current irrigation management practices will lead to an average increase in the CIR of 16% (RCP4.5) to 31% (RCP8.5) until the end of the century. Adopting higher levels of water deficit, in less sensitive periods, water savings between −11% (RCP4.5) and −3% (RCP8.5) can be achieved in 2071–2100 when compared to the reference period. The results obtained show that the CIR increase due to CC can be mitigated through regulated deficit irrigation strategies, making it possible to reduce CIR when compared to the reference scenario; therefore, there exists some margin for the farmers to adjust the irrigation water consumption to the expected reduction in water availability.
Author Contributions
Conceptualization, J.R. and J.L.T.; methodology, J.R., J.L.T. and S.B.; software, J.L.T.; validation, S.B. and J.R.; formal analysis, S.B. and J.R.; data curation, S.B.; writing—original draft preparation, S.B. and J.R.; writing—review and editing, J.R. and J.L.T.; supervision, J.L.T. All authors have read and agreed to the published version of the manuscript.
Funding
This work has been funded by national funds through FCT—Fundação para a Ciência e a Tecnologia, I.P., in the scope of the projects of the Linking Landscape, Environment, Agriculture And Food (LEAF) Research Centre Ref. UIDB/04129/2020 and UIDP/04129/2020. João Rolim was funded by the FCT—Fundação para a Ciência e a Tecnologia, I.P., through the researcher contract DL 57/2016/CP1382/CT0021.
Data Availability Statement
Climate change scenarios data was obtained from the Portal do clima of IPMA which is publicly available on http://portaldoclima.pt/pt/ (accessed on 21 May 2021). Soil water balance simulations results produced in this study may be available on the request from the corresponding author.
Acknowledgments
The authors would like to thank the ELAIA company and especially Isabel Ribeiro and António Mateus for their support and for providing field data for the development of this work.
Conflicts of Interest
The authors declare no conflict of interest.
References
- Giorgi, F. Climate change hot-spots. Geophys. Res. Lett. 2006, 33, L08707. [Google Scholar] [CrossRef]
- Kovats, R.S.; Valentini, R.; Bouwer, L.M.; Georgopoulou, E.; Jacob, D.; Martin, E.; Rounsevell, M.; Soussana, J.-F. Europe. In Climate Change 2014: Impacts, Adaptation, and Vulnerability. Part B: Regional Aspects. Contribution of Working Group II to the Fifth Assessment Report of the Intergovernmental Panel on Climate Change; Barros, V.R., Field, C.B., Dokken, D.J., Mastrandrea, M.D., Mach, K.J., Bilir, T.E., Chatterjee, M., Ebi, K.L., Estrada, Y.O., Genova, R.C., et al., Eds.; Cambridge University Press: Cambridge, UK; New York, NY, USA, 2014; pp. 1267–1326. [Google Scholar]
- Miranda, P.M.; Cardoso, R.M.; Soares, P.M.M.; Valente, M.A.; Viterbo, P.A. Mudança Climática. In Cultivar. Cadernos de Análise e Prospective; Gabinete de Planeamento, Políticas e Administração Gera: Lisbon, Portugal, 2018; Volume 12, pp. 29–37. [Google Scholar]
- Pires, V.; Cota, T.M.; Silva, A. Observações Alteradas no Clima Atual e Cenários Climáticos em Portugal Continental-Influência no Setor Agrícola. In Cultivar. Cadernos de Análise e Prospective; Gabinete de Planeamento, Políticas e Administração Gera: Lisbon, Portugal, 2018; Volume 12, pp. 57–67. [Google Scholar]
- Jiménez Cisneros, B.E.; Oki, T.; Arnell, N.W.; Benito, G.; Cogley, J.G.; Döll, P.; Jiang, T.; Mwakalila, S.S. Freshwater Resources. In Climate Change 2014: Impacts, Adaptation, and Vulnerability. Part A: Global and Sectoral Aspects. Contribution of Working Group II to the Fifth Assessment Report of the Intergovernmental Panel on Climate Change; Field, C.B., Barros, V.R., Dokken, D.J., Mach, K.J., Mastrandrea, M.D., Bilir, T.E., Chatterjee, M., Ebi, K.L., Estrada, Y.O., Genova, R.C., et al., Eds.; Cambridge University Press: Cambridge, UK; New York, NY, USA, 2014; pp. 229–269. [Google Scholar]
- Mourato, S.; Moreira, M.; Cortereal, J.A.M. Water Resources Impact Assessment Under Climate Change Scenarios in Mediterranean Watersheds. Water Resour. Manag. 2015, 29, 2377–2391. [Google Scholar] [CrossRef]
- Empresa de Desenvolvimento e Infra-Estruturas do Alqueva. Anuário Agrícola de Alqueva 2020. Available online: https://www.edia.pt/wp-content/uploads/2021/01/Anuario_Agricola_Alqueva_2020_ii.pdf (accessed on 21 May 2021).
- Paulo, A.; Pinto, H. Necessidades hídricas do olival no Alentejo e projecções para o período 2071–2100. Rev. Unidade Investig. Inst. Politécnico St. 2014, 4, 148–162. [Google Scholar]
- Rolim, J.; Teixeira, J.L.; Catalão, J.; Shahidian, S. The Impacts of Climate Change on Irrigated Agriculture in Southern Portugal. Irrig. Drain. 2016, 66, 3–18. [Google Scholar] [CrossRef]
- Díaz, J.A.R.; Weatherhead, E.K.; Knox, J.; Camacho, E. Climate change impacts on irrigation water requirements in the Guadalquivir river basin in Spain. Reg. Environ. Chang. 2007, 7, 149–159. [Google Scholar] [CrossRef]
- Tanasijevic, L.; Todorovic, M.; Pereira, L.S.; Pizzigalli, C.; Lionello, P. Impacts of climate change on olive crop evapotranspiration and irrigation requirements in the Mediterranean region. Agric. Water Manag. 2014, 144, 54–68. [Google Scholar] [CrossRef]
- Valverde, P.; Serralheiro, R.; Carvalho, M.; Maia, R.; Oliveira, B.; Ramos, V. Climate change impacts on irrigated agriculture in the Guadiana river basin (Portugal). Agric. Water Manag. 2015, 152, 17–30. [Google Scholar] [CrossRef] [Green Version]
- Saadi, S.; Todorovic, M.; Tanasijevic, L.; Pereira, L.S.; Pizzigalli, C.; Lionello, P. Climate change and Mediterranean agriculture: Impacts on winter wheat and tomato crop evapotranspiration, irrigation requirements and yield. Agric. Water Manag. 2014, 147, 103–115. [Google Scholar] [CrossRef]
- Lorite, I.; Gabaldón-Leal, C.; Ruiz-Ramos, M.; Belaj, A.; de la Rosa, R.; León, L.; Santos, C. Evaluation of olive response and adaptation strategies to climate change under semi-arid conditions. Agric. Water Manag. 2018, 204, 247–261. [Google Scholar] [CrossRef]
- Fraga, H.; Pinto, J.G.; Santos, J.A. Olive tree irrigation as a climate change adaptation measure in Alentejo, Portugal. Agric. Water Manag. 2020, 237, 106193. [Google Scholar] [CrossRef]
- Soares, D.; Rolim, J.; Fradinho, M.J.; Paço, T.A.D. Climate Change Impacts on Irrigation Requirements of Preserved Forage for Horses under Mediterranean Conditions. Agronomy 2020, 10, 1758. [Google Scholar] [CrossRef]
- Zeleke, K. Simulating Agronomic Adaptation Strategies to Mitigate the Impacts of Climate Change on Wheat Yield in South-Eastern Australia. Agronomy 2021, 11, 337. [Google Scholar] [CrossRef]
- Abreu, J.P.D.M.E. Modelling olive flowering date using chilling for dormancy release and thermal time. Agric. For. Meteorol. 2004, 125, 117–127. [Google Scholar] [CrossRef]
- Teixeira, J.L.; Pereira, L.S. ISAREG an irrigation scheduling model. ICID Bull. 1992, 41, 29–48. [Google Scholar]
- Liu, Y.; Fernando, R.M.; Pereira, L.S. Water Balance Simulation with ISAREG Considering Water Table Interactions. Proc. World Congr. Comput. Agric. Nat. Resour. USA 2013, 857. [Google Scholar] [CrossRef]
- Oweis, T.; Rodrigues, P.N.; Pereira, L.S. Simulation of Supplemental Irrigation Strategies for Wheat in Near East to Cope with Water Scarcity. In Tools for Drought Mitigation in Mediterranean Regions; Rossi, G., Cancelliere, A., Pereira, L.S., Oweis, T., Shatanawi, M., Zairi, A., Eds.; Water Science and Technology Library, Springer: Dordrecht, The Netherlands, 2003; Volume 44, pp. 259–272. [Google Scholar] [CrossRef]
- Al-Zu’Bi, Y.A.; Al-Kharabsheh, A. Multicriteria Analysis For Water Productivity in the Jordan Valley. Water Int. 2003, 28, 501–511. [Google Scholar] [CrossRef]
- Cancela, J.J.; Cuesta, T.S.; Neira, X.; Pereira, L.S. Modelling for Improved Irrigation Water Management in a Temperate Region of Northern Spain. Biosyst. Eng. 2006, 94, 151–163. [Google Scholar] [CrossRef]
- Cholpankulov, E.D.; Inchenkova, O.P.; Paredes, P.; Pereira, L.S. Cotton irrigation scheduling in central Asia: Model calibration and validation with consideration of groundwater contribution. Irrig. Drain. 2008, 57, 516–532. [Google Scholar] [CrossRef] [Green Version]
- Popova, Z.; Pereira, L.S. Modelling for maize irrigation scheduling using long term experimental data from Plovdiv region, Bulgaria. Agric. Water Manag. 2011, 98, 675–683. [Google Scholar] [CrossRef]
- Popova, Z. Impact of climate change on maize yield in South Bulgaria. Bulg. J. Meteorol. Hydrol. 2010, 15, 62–71. [Google Scholar]
- Paço, T.A.; Paredes, P.; Pereira, L.S.; Silvestre, J.; Santos, F.L. Crop Coefficients and Transpiration of a Super Intensive Arbequina Olive Orchard using the Dual Kc Approach and the Kcb Computation with the Fraction of Ground Cover and Height. Water 2019, 11, 383. [Google Scholar] [CrossRef] [Green Version]
- Jacob, D.; Petersen, J.; Eggert, B.; Alias, A.; Christensen, O.B.; Bouwer, L.M.; Braun, A.; Colette, A.; Déqué, M.; Georgievski, G.; et al. EURO-CORDEX: New high-resolution climate change projections for European impact research. Reg. Environ. Chang. 2013, 14, 563–578. [Google Scholar] [CrossRef]
- Intergovernmental Panel on Climate Change. The Physical Science Basis. Contribution of Working Group I to the Fifth Assessment Report of the Intergovernmental Panel on Climate Change; Stocker, T.F., Qin, D., Plattner, G.-K., Tignor, M., Allen, S.K., Boschung, J., Nauels, A., Xia, Y., Bex, V., Midgley, P.M., Eds.; Cambridge University Press: Cambridge, UK; New York, NY, USA, 2013; p. 1535. [Google Scholar]
- Hunsaker, D.; Kimball, B.; Pinter, P.; Wall, G.; Lamorte, R.; Adamsen, F.; Leavitt, S.; Thompson, T.; Matthias, A.; Brooks, T. CO2 enrichment and soil nitrogen effects on wheat evapotranspiration and water use efficiency. Agric. For. Meteorol. 2000, 104, 85–105. [Google Scholar] [CrossRef]
- Martins, J.; Fraga, H.; Fonseca, A.; Santos, J. Climate Projections for Precipitation and Temperature Indicators in the Douro Wine Region: The Importance of Bias Correction. Agronomy 2021, 11, 990. [Google Scholar] [CrossRef]
- European Environment Agency. Climate Change Adaptation in the Agriculture Sector in Europe; EEA Report No 04/2019; Eionet—European Environment Information and Observation Network: Copenhagen, Denmark, 2019; p. 108. [Google Scholar]
- Fraga, H.; Moriondo, M.; Leolini, L.; Santos, J.A. Mediterranean Olive Orchards under Climate Change: A Review of Future Impacts and Adaptation Strategies. Agronomy 2021, 11, 56. [Google Scholar] [CrossRef]
- Food and Agriculture Organization of the United Nations; International Union of Soil Sciences. World Reference Base for Soil Resources 2014. International Soil Classification System for Naming Soils and Creating Legends for Soil Maps-Update 2015; World Soil Resources Reports No. 106; Food and Agriculture Organization: Rome, Italy, 2015; p. 192. [Google Scholar]
- Cardoso, J.V.J.C. Os Solos de Portugal. Sua Classificação, Caracterização e Génese. Secretaria de Estado da Agricultura; Direcção-Geral dos Serviços Agrícolas: Lisbon, Portugal, 1965; p. 310. [Google Scholar]
- Beck, H.E.; Zimmermann, N.E.; McVicar, T.; Vergopolan, N.; Berg, A.; Wood, E.F. Present and future Köppen-Geiger climate classification maps at 1-km resolution. Sci. Data 2018, 5, 180214. [Google Scholar] [CrossRef] [Green Version]
- International Project Management Association. Climate Normals—1971–2000. Available online: https://www.ipma.pt/en/oclima/normais.clima/1971-2000/#557 (accessed on 12 May 2021).
- Allen, R.G.; Pereira, L.S.; Raes, D.; Smith, M. Crop Evapotranspiration. Guidelines for Computing Crop Water Requirements; Food and Agriculture Organization Irrigation and Drainage Paper 56; Food and Agriculture Organization: Rome, Italy, 2008; p. 300. [Google Scholar]
- Abu-Hamdeh, N.H.; Al-Widyan, M.I. Effect of axle load, tire inflation pressure, and tillage system on soil physical properties and crop yield of a jordanian soil. Trans. ASAE 2000, 43, 13–21. [Google Scholar] [CrossRef]
- Shahidian, S.; Serralheiro, R.; Teixeira, J.; Serrano, J. Parametric calibration of the Hargreaves-Samani equation for use at new locations. Hydrol. Process. 2013, 27, 605–616. [Google Scholar] [CrossRef]
- Teixeira, J.; Shahidian, S.; Rolim, J. Regional analysis and calibration for the South of Portugal of a simple evapotranspiration model for use in an autonomous landscape irrigation controller. WSEAS Trans. Environ. Dev. 2008, 8, 676–686. [Google Scholar]
- Intergovernmental Panel on Climate Change. Synthesis Report. Contribution of Working Groups I, II and III to the Fifth Assessment Report of the Intergovernmental Panel on Climate Change. In Climate Change 2014; Pachauri, R.K., Meyer, L.A., Eds.; Intergovernmental Panel on Climate Change: Geneva, Switzerland, 2014; p. 151. [Google Scholar]
- Instituto Português do Mar e da Atmosfera; Faculdade de Ciências da Universidade de Lisboa. Portal do Clima, Alterações Climáticas em Portugal. Available online: http://portaldoclima.pt/pt/ (accessed on 21 May 2021).
- Graham, L.P.; Andréasson, J.; Carlsson, B. Assessing climate change impacts on hydrology from an ensemble of regional climate models, model scales and linking methods—A case study on the Lule River basin. Clim. Chang. 2007, 81, 293–307. [Google Scholar] [CrossRef]
- Lenderink, G.; Buishand, A.; Van Deursen, W. Estimates of future discharges of the river Rhine using two scenario methodologies: Direct versus delta approach. Hydrol. Earth Syst. Sci. 2007, 11, 1145–1159. [Google Scholar] [CrossRef]
- Räty, O.; Räisänen, J.; Ylhäisi, J.S. Evaluation of delta change and bias correction methods for future daily precipitation: Intermodel cross-validation using ENSEMBLES simulations. Clim. Dyn. 2014, 42, 2287–2303. [Google Scholar] [CrossRef]
- Pastor, M. Riego deficitario del olival: Los programas de recorte de riego en olivar. Agric. Rev. Agropecuária Ganad. 1994, 746, 768–776. [Google Scholar]
- Sanz-Cortes, F.; Martinez-Calvo, J.; Badenes, M.L.; Bleiholder, H.; Hack, H.; Llacer, G.; Meier, U. Phenological growth stages of olive trees (Olea europaea). Ann. Appl. Biol. 2002, 140, 151–157. [Google Scholar] [CrossRef]
- Fernández, J.E.; Perez-Martin, A.; Torres-Ruiz, J.M.; Cuevas, M.V.; Rodriguez-Dominguez, C.M.; Elsayed-Farag, S.; Morales-Sillero, A.; García, J.M.; Hernandez-Santana, V.; Diaz-Espejo, A. A regulated deficit irrigation strategy for hedgerow olive orchards with high plant density. Plant Soil 2013, 372, 279–295. [Google Scholar] [CrossRef] [Green Version]
- Mcmaster, G.; Wilhelm, W.W. Growing degree-days: One equation, two interpretations. Agric. For. Meteorol. 1997, 87, 291–300. [Google Scholar] [CrossRef] [Green Version]
- Fernández, J.-E. Understanding olive adaptation to abiotic stresses as a tool to increase crop performance. Environ. Exp. Bot. 2014, 103, 158–179. [Google Scholar] [CrossRef] [Green Version]
- Kokkotos, E.; Zotos, A.; Patakas, A. Evaluation of Water Stress Coefficient Ks in Different Olive Orchards. Agronomy 2020, 10, 1594. [Google Scholar] [CrossRef]
- Ferreyra, R.; Sellés Van, G.; Sellés, I. Riego Deficitario Controlado en Olivos, 1st ed.; Instituto de Investigaciones Agropecuarias: Santiago, Chile, 2001. [Google Scholar]
- Galán, C.; García-Mozo, H.; Vázquez, L.; Ruiz, L.; De La Guardia, C.D.; Trigo, M.M. Heat requirement for the onset of the Olea europaea L. pollen season in several sites in Andalusia and the effect of the expected future climate change. Int. J. Biometeorol. 2004, 49, 184–188. [Google Scholar] [CrossRef]
- Pérez-López, D.; Ribas, F.; Moriana, A.; Rapoport, H.F.; De Juan, A. Influence of temperature on the growth and development of olive ( Olea europaea L.) trees. J. Hortic. Sci. Biotechnol. 2008, 83, 171–176. [Google Scholar] [CrossRef]
- Avolio, E.; Orlandi, F.; Bellecci, C.; Fornaciari, M.; Federico, S. Assessment of the impact of climate change on the olive flowering in Calabria (southern Italy). Theor. Appl. Clim. 2011, 107, 531–540. [Google Scholar] [CrossRef]
- Garcia-Mozo, H.; Oteros, J.; Galán, C. Phenological changes in olive (Ola europaea L.) reproductive cycle in southern Spain due to climate change. Ann. Agric. Environ. Med. 2015, 22, 421–428. [Google Scholar] [CrossRef] [PubMed] [Green Version]
- Fraga, H.; Pinto, J.G.; Santos, J.A. Climate change projections for chilling and heat forcing conditions in European vineyards and olive orchards: A multi-model assessment. Clim. Chang. 2018, 152, 179–193. [Google Scholar] [CrossRef]
- Pastor, M.; Vega, V.; Hidalgo, J.C. Ensayos en plantaciones de olivar superintensivas e intensivas. Vida Rural 2005, 218, 30–40. [Google Scholar]
- Rosecrance, R.C.; Krueger, W.H.; Milliron, L.; Bloese, J.; Garcia, C.; Mori, B. Moderate regulated deficit irrigation can increase olive oil yields and decrease tree growth in super high density ‘Arbequina’ olive orchards. Sci. Hortic. 2015, 190, 75–82. [Google Scholar] [CrossRef]
- Marra, F.P.; Marino, G.; Marchese, A.; Caruso, T. Effects of different irrigation regimes on a super-high-density olive grove cv. “Arbequina”: Vegetative growth, productivity and polyphenol content of the oil. Irrig. Sci. 2016, 34, 313–325. [Google Scholar] [CrossRef]
- Ahumada-Orellana, L.E.; Ortega-Farías, S.; Searles, P.S. Olive oil quality response to irrigation cut-off strategies in a super-high density orchard. Agric. Water Manag. 2018, 202, 81–88. [Google Scholar] [CrossRef]
- Capra, A.; Scicolone, B. Irrigation Scheduling Optimisation in Olive Groves. J. Exp. Agric. Int. 2018, 28, 1–19. [Google Scholar] [CrossRef]
Figure 1.
Location of the study area in the Beja municipality in the south of Portugal.

Figure 2.
Climate normals relative to the 1971–2000 period at the Beja weather station for precipitation and maximum, average, and minimum air temperatures.
Figure 2.
Climate normals relative to the 1971–2000 period at the Beja weather station for precipitation and maximum, average, and minimum air temperatures.

Figure 3.
Average monthly anomalies of (a) precipitation and (b) reference evapotranspiration (ETo), for the Beja weather station for the climate change scenarios RCP4.5 and RCP8.5 (2011–2040; 2041–2070; 2071–2100).
Figure 3.
Average monthly anomalies of (a) precipitation and (b) reference evapotranspiration (ETo), for the Beja weather station for the climate change scenarios RCP4.5 and RCP8.5 (2011–2040; 2041–2070; 2071–2100).

Figure 4.
Soil water content (expressed in volumetric fraction) simulated by the ISAREG model (blue line) vs. soil water content data observed by the capacitive probe (red dots) for the 2018 irrigation season (FC—field capacity, WP—permanent wilting point, RAWThreshold—threshold for the readily available water).

Figure 5.
Box plots of crop irrigation requirements (mm) for the climate scenarios assuming current irrigation management (CIM). a–d letters indicate significant statistical differences at p = 0.05.
Figure 5.
Box plots of crop irrigation requirements (mm) for the climate scenarios assuming current irrigation management (CIM). a–d letters indicate significant statistical differences at p = 0.05.

Figure 6.
Box plots of crop irrigation requirements (mm), for the climate scenarios under deficit irrigation management (DIM). a–d letters indicate significant statistical differences at p = 0.05.
Figure 6.
Box plots of crop irrigation requirements (mm), for the climate scenarios under deficit irrigation management (DIM). a–d letters indicate significant statistical differences at p = 0.05.


Table 1.
Main characteristics of Luvisols [35].
Table 1.
Main characteristics of Luvisols [35].
| Layer | Layer Depth (m) | θFC (cm3 cm−3) | θWP (cm3 cm−3) |
|---|---|---|---|
| Ap | 0.25 | 20.9 | 6.84 |
| B1 | 0.47 | 23.2 | 7.62 |
| B2 | 0.8 | 30.7 | 13.2 |
| C | 1.15 | 26.7 | 11.05 |
θFC—soil water content at field capacity; θWP—soil water content at permanent wilting point.
Table 2.
Crop coefficients for an olive orchard with 60% of ground cover [47].
Table 2.
Crop coefficients for an olive orchard with 60% of ground cover [47].
| Month | January | February | March | April | May | June | July | August | September | October | November | December |
|---|---|---|---|---|---|---|---|---|---|---|---|---|
| Kc | 0.50 | 0.50 | 0.65 | 0.60 | 0.55 | 0.50 | 0.45 | 0.45 | 0.55 | 0.60 | 0.65 | 0.50 |
Table 3.
Percentage of irrigation requirements adopted in the deficit irrigation management (DIM).
| Crop Periods | A–B | B–C | C–D | D–E | E–F | F–G | G–H | H–I |
|---|---|---|---|---|---|---|---|---|
| Irrigation requirements (%) | 100% | 40% | 80% | 40% | 100% | 100% | 40% | |
The crop periods correspond to the time interval between the occurrence of the following crop growth stages: A—the beginning of the cycle, B—the last phase of blossom, C—full flowering, D—the first phase of the fruit development, E—fruit set, F—the peak of oil accumulation, G—the end of the peak of oil accumulation, H—the end of pit hardening, and I—fruit ripening/harvest.
Table 4.
Annual average anomalies of air temperature (T), precipitation (P), and reference evapotranspiration (ETo) for the climate change scenarios compared to the reference period (1971–2000).
Table 4.
Annual average anomalies of air temperature (T), precipitation (P), and reference evapotranspiration (ETo) for the climate change scenarios compared to the reference period (1971–2000).
| Climate Anomalies | |||||
|---|---|---|---|---|---|
| RCP4.5 | RCP8.5 | ||||
| 2011–2040 | 2041–2070 | 2071–2100 | 2011–2040 | 2041–2070 | 2071–2100 |
| T (°C) | |||||
| +0.8 | +1.5 | +1.9 | +1.0 | +2.2 | +3.8 |
| P (mm) | |||||
| −25.4 | −45.1 | −47.2 | −48.7 | −90.7 | −128.3 |
| −4.5% | −7.9% | −8.3% | −8.5% | −15.9% | −22.4% |
| ETo (mm) | |||||
| +36.1 | +71.7 | +83.4 | +47.2 | +98.2 | +171.9 |
| +2.8% | +5.6% | +6.6% | +3.7% | +7.7% | +13.5% |
Table 5.
Full flowering dates observed in 2018 and 2019 and estimated for the climate scenarios.
| Climate Scenarios | Full Flowering |
|---|---|
| Observed in the field (2018) | 28 May |
| Observed in the field (2019) | 10 May |
| Reference scenario (1971–2000) | 23 May |
| RCP4.5 (2011–2040) | 15 May |
| RCP4.5 (2041–2070) | 12 May |
| RCP4.5 (2071–2100) | 7 May |
| RCP8.5 (2011–2040) | 15 May |
| RCP8.5 (2041–2070) | 5 May |
| RCP8.5 (2071–2100) | 24 April |
Table 6.
Adjusted Kc values, for the different crop growth periods as a function of imposed water stress in the deficit irrigation management (DIM).
Table 6.
Adjusted Kc values, for the different crop growth periods as a function of imposed water stress in the deficit irrigation management (DIM).
| Climate Scenarios | Kc adjusted | |||||||
|---|---|---|---|---|---|---|---|---|
| Crop Periods | ||||||||
| A–B | B–C | C–D | D–E | E–F | F–G | G–H | H–I | |
| Ref. (1971–2000) | 0.60 | 0.50 | 0.45 | 0.38 | 0.35 | 0.50 | 0.48 | 0.30 |
| RCP4.5 (2011–2040) | 0.60 | 0.50 | 0.43 | 0.43 | 0.25 | 0.45 | 0.58 | 0.40 |
| RCP4.5 (2041–2070) | 0.60 | 0.55 | 0.45 | 0.35 | 0.23 | 0.43 | 0.53 | 0.35 |
| RCP4.5 (2071–2100) | 0.60 | 0.55 | 0.50 | 0.48 | 0.25 | 0.45 | 0.43 | 0.25 |
| RCP8.5 (2011–2040) | 0.60 | 0.55 | 0.48 | 0.40 | 0.25 | 0.40 | 0.55 | 0.38 |
| RCP8.5 (2041–2070) | 0.60 | 0.55 | 0.48 | 0.45 | 0.28 | 0.48 | 0.50 | 0.33 |
| RCP8.5 (2071–2100) | 0.60 | 0.55 | 0.48 | 0.40 | 0.33 | 0.48 | 0.55 | 0.38 |
Crop growth stages: A—the beginning of the cycle, B—the last phase of blossom, C—full flowering, D—the first phase of the fruit development, E—fruit set, F—the peak of oil accumulation, G—the end of the peak of oil accumulation, H—the end of pit hardening and I—fruit ripening/harvest.
Table 7.
Average seasonal crop irrigation requirements and respective variations, relative to the reference period considering the current irrigation strategy, for each CC scenario and adaptation measure.
Table 7.
Average seasonal crop irrigation requirements and respective variations, relative to the reference period considering the current irrigation strategy, for each CC scenario and adaptation measure.
| Climate Scenarios | |||||||
|---|---|---|---|---|---|---|---|
| Reference | RCP4.5 | RCP8.5 | |||||
| 1971–2000 | 2011–2040 | 2041–2070 | 2071–2100 | 2011–2040 | 2041–2070 | 2071–2100 | |
| Adaptation Measure—CIM | |||||||
| CIR (mm) | 199.9 | 219.2 | 235.4 | 232.1 | 225.4 | 244.2 | 262.7 |
| ΔCIR (%) | -- | 9.6% | 17.7% | 16.1% | 12.8% | 22.1% | 31.4% |
| Adaptation Measure—DIM | |||||||
| CIR (mm) | 154.9 | 156.8 | 163.6 | 178.9 | 174.1 | 190.9 | 193.2 |
| ΔCIR (%) | −23% | −22% | −18% | −11% | −13% | −5% | −3% |
Publisher’s Note: MDPI stays neutral with regard to jurisdictional claims in published maps and institutional affiliations. |
© 2021 by the authors. Licensee MDPI, Basel, Switzerland. This article is an open access article distributed under the terms and conditions of the Creative Commons Attribution (CC BY) license (https://creativecommons.org/licenses/by/4.0/).
Share and Cite
MDPI and ACS Style
Branquinho, S.; Rolim, J.; Teixeira, J.L. Climate Change Adaptation Measures in the Irrigation of a Super-Intensive Olive Orchard in the South of Portugal. Agronomy 2021, 11, 1658. https://0-doi-org.brum.beds.ac.uk/10.3390/agronomy11081658
AMA Style
Branquinho S, Rolim J, Teixeira JL. Climate Change Adaptation Measures in the Irrigation of a Super-Intensive Olive Orchard in the South of Portugal. Agronomy. 2021; 11(8):1658. https://0-doi-org.brum.beds.ac.uk/10.3390/agronomy11081658
Chicago/Turabian StyleBranquinho, Sofia, João Rolim, and José Luís Teixeira. 2021. "Climate Change Adaptation Measures in the Irrigation of a Super-Intensive Olive Orchard in the South of Portugal" Agronomy 11, no. 8: 1658. https://0-doi-org.brum.beds.ac.uk/10.3390/agronomy11081658
Note that from the first issue of 2016, this journal uses article numbers instead of page numbers. See further details here.