Article

Assessing Suitability of Sentinel-2 Bands for Monitoring of Nutrient Concentration of Pastures with a Range of Species Compositions

by
Suvarna M. Punalekar
1,2,
Anna Thomson
3,4,
Anne Verhoef
1,*,
David J. Humphries
3 and
Christopher K. Reynolds
3
1
Department of Geography and Environmental Science, The University of Reading, Whiteknights, P.O. Box 227, Reading RG6 6AB, UK
2
Department of Geography and Earth Sciences, Aberystwyth University, Aberystwyth, Ceredigion SY23 3DB, Wales, UK
3
Centre for Dairy Research, School of Agriculture, Policy and Development, The University of Reading, Reading RG6 6AR, UK
4
Agriculture Victoria Research, Ellinbank Dairy Research Centre, 1301 Hazeldean Road, Ellinbank, VIC 3821, Australia
*
Author to whom correspondence should be addressed.
Submission received: 29 June 2021 / Revised: 1 August 2021 / Accepted: 18 August 2021 / Published: 20 August 2021
(This article belongs to the Section Grassland and Pasture Science)

Abstract

:
The accurate and timely assessment of pasture quantity and quality (i.e., nutritive characteristics) is vital for effective pasture management. Remotely sensed data can be used to predict pasture quantity and quality. This study investigated the ability of Sentinel-2 multispectral bands, convolved from proximal hyperspectral data, in predicting various pasture quality and quantity parameters. Field data (quantitative and spectral) were gathered for experimental plots representing four pasture types—perennial ryegrass monoculture and three mixtures of swards representing increasing species diversity. Spectral reflectance data at the canopy level were used to generate Sentinel-2 bands and calculate normalised difference indices with each possible band pair. The suitability of these indices for prediction of pasture parameters was assessed. Pasture quantity parameters (biomass and Leaf Area Index) had a stronger influence on overall reflectance than the quality parameters. Indices involving the 1610 nm band were optimal for acid detergent fibre, crude protein, organic matter and water-soluble carbohydrate concentration, while being less affected by biomass or LAI. The study emphasises the importance of accounting for the quantity parameters in the spectral data-based models for pasture quality predictions. These explorative findings inform the development of future pasture quantity and quality models, particularly focusing on diverse swards.

1. Introduction

Pastures are one of the most important terrestrial ecosystems on earth with currently 26% of the world’s land area and 70% of the world’s agricultural area covered by grasslands (http://www.fao.org; accessed on 19 August 2020). Pastures are not only a major and relatively inexpensive livestock feed source, but also support ecosystem services, such as biodiversity conservation and soil carbon sequestration [1]. In 2018, permanent grassland (i.e., land used as grassland for five years or more) constituted nearly 57% of the total agricultural area in the UK [2].
Efficient pasture management is one of the key factors governing economic viability of the dairy and ruminant meat industry by ensuring accurate and well-planned pasture allocation for optimal grazing and conservation [3,4,5]. More than ever before, there is a need for an accurate near real-time methods for estimating and predicting pasture quantity and quality, especially in the context of grass-based dairy production systems such as the UK, one of the largest milk producers in Europe [6].
Current methods that farmers use for pasture monitoring include visual observations through field walking, rising plate meters (RPMs) for pasture biomass [7,8] and handheld Near-InfraRed Spectroscopy (NIRS) device surveys and/or laboratory chemical or NIRS analysis for pasture chemical composition that determines its nutritive value and digestibility [9,10,11]. While informative on a local scale, these methods are time, labour and cost intensive [7,11,12].
Pasture management using information from remote sensing (RS) offers advantages over traditional methods, such as provision of near real-time information, coverage of large areas, frequent repeated measurements and a choice of different spectral bands, i.e., visible, near infrared (NIR) and short wave infrared (SWIR) to monitor different pasture parameters [13]. The application of pasture monitoring using remote sensing data has already been demonstrated in various studies [13,14,15,16]. In spite of these advantages, wide implementation of these methods to operationally monitor pastures still remains limited due to factors such as unsuitability of spatial and temporal resolutions of the datasets (for example, MODerate resolution Imaging Spectroradiometer [MODIS] data have a minimum resolution of 250 m, and LANDSAT data are only available every 16 days). Most importantly, high resolution RS datasets (such as Satellite Pour l’Observation de la Terre (SPOT), WorldView and Indian Remote Sensing (IRS) data) are generally not freely available. Frequent cloud cover, especially in temperate climate regions such as the UK, also reduces the temporal frequency of usable images.
The release of the pair of Sentinel-2 multispectral imager satellites has potentially eliminated some of these limitations [17,18]. Specifications of Sentinel-2 include 13 multispectral bands including three novel red-edge bands for vegetation monitoring, high spatial resolution (10, 20 and 60 m), short revisit time (~5 days using two satellites), large swath width, higher signal to noise ratio, as well as the data being freely available. Sentinel-2 data have already been assessed for irrigation performance for dairy pastures [19], shown promise in quantifying biomass response to different fertilizer treatments [17] and have been found effective for retrieval of pasture structural parameters such as Leaf Area Index (LAI), which provides information about pasture canopy growth and density [18]. On the other hand, the potential of Sentinel-2 bands for monitoring pasture quality parameters relating to nutritional content has not been tested widely.
The potential of Sentinel-2 bands in retrieving vegetation nitrogen concentration using field spectroscopy data has been discussed by [20]. Sentinel-2 images have also been used to map plant chlorophyll content [21]. Recently, Lugassi et al. [22] also explored the potential of Sentinel-2 images for mapping crude protein and fibre content. Further research is needed to explore the usability of Sentinel-2 data for a wide range of pasture composition predictions that relate to nutritive quality parameters.
Pasture quality parameters such as contents of fibre (cellulose, hemicellulose and other structural carbohydrates), crude protein (typically estimated from nitrogen concentration) and water soluble carbohydrates (sugars) have very subtle spectral characteristics and generally are studied using hyperspectral data [11,23,24,25]. However, hyperspectral data are generally gathered on the smaller scale (i.e., field to multi-field using drones or portable instruments). There are no operational satellites providing these datasets at high spatial resolution and regional coverage. However, field hyperspectral data provide a very good opportunity to simulate broader multispectral bands with the same spectral characteristics as those of operational satellites, and hence can be utilised to understand the potential of those broad bands in studying biophysical characteristics such as pasture nutritive characteristics and species composition. The proximity of the field hyperspectral sensor to the target canopy also eliminates various factors such as atmospheric interference and view geometry that can affect relationships between dependent variables (pasture quality) and independent variables (spectral reflectance). Thus, in order to establish actual Sentinel-2 based models for pasture quality, it is important to understand in the first instance whether the reflectance in wavebands chosen for the Sentinel-2 satellites are in principle sensitive to the quality parameters of interest.
Therefore, the main aim of this paper is to test whether Sentinel-2 multispectral bands can be used to determine pasture quality parameters with suitable accuracy. We also include pasture quantity (biomass, LAI) parameters in our analysis to understand the influence of these parameters on pasture quality estimation.

2. Materials and Methods

2.1. Study Area

Data collected from experimental pasture plots established at a temperate research farm in southern England (UK) were used in this study. Sonning farm (51.4729° N, 0.9037° W), the site of the University of Reading’s Crops Research Unit, is located in the River Thames catchment, 5.5 km northeast of Reading. The farm’s soil mainly comprises free-draining alluvial material, with a sandy loam texture. At this site, during the 2017 growing season, four different pasture types were grown (Perennial Ryegrass only (PRG; 5 varieties), a 6 species mixture (Mix−6), a 12 species mixture (Mix−12); and a 17 species mixture (Mix−17)) in 4 m × 5 m plots with four replicates of each pasture type, i.e., a total of 16 plots. All mixtures contained a proportion of PRG combined with increasing numbers of other grasses, legumes and herbs (Table 1). The plots were configured in a 4 × 4 Latin square layout where no treatment was repeated in any row or column of the plot design. Establishment took place in Autumn 2016 on land that was under permanent pasture prior to the experiment. Soil surveys were conducted at the time of sowing to ensure soil mineral indices were at appropriate levels to support plant growth. In 2017, the PRG plots received inorganic Nitrogen (N) fertilizer at a rate of 250 kg N ha−1 yr−1 (ammonium nitrate) over five separate applications (each 50 kg N ha−1), two occurring prior to the first harvest and then one after each of the first three harvests. Plots containing plant mixtures were not fertilised to promote N fixation by legumes in the mixtures.

2.2. Data Collection

All four pasture types were harvested multiple times during the 2017 growing season. The date of harvest was chosen when biomass estimates by RPM reached a minimum target quantity of 2500 kg DM ha−1. Harvest occurred as soon as possible after this target was reached, as weather and labour availability would allow. Such constraints caused variation in actual harvest biomass, particularly where the growth rate in particular plots was high. As different pasture types grew at different rates through the season, the harvest timings of each pasture type were allowed to vary so as not to disadvantage any of the pastures through wrongly timed harvesting. In total, the PRG plots were cut five times in the 2017 season, and the three different mixed plot types were cut four times each as their total biomass yield was lower.
Two types of data were collected: those based on destructive sampling (physical removal of biomass) and those based on non-destructive sampling (just before each harvest). Destructive pasture data collection comprised sampling for, and determination of, biophysical variables (biomass) and biochemical variables (crude protein (CP), acid detergent fibre (ADF), neutral detergent fibre (NDF), water soluble carbohydrate (WSC) and organic matter (OM)); see Section 2.2.1 and Section 2.2.2. Non-destructive pasture data collection included measurements of Leaf Area Index (LAI; Section 2.2.3) and of spectral reflectance data (Section 2.2.4). Destructive sampling occurred at every harvest for use in a concurrent study; however, due to weather conditions, non-destructive sampling for the present study only occurred on a subset of four harvest dates (Table 1) which limited the number of samples that could be used in the present work. On the first of these four harvest dates, the sampling of PRG plots took place, while during the three subsequent harvest dates, all three of the mixed pasture types were harvested. This resulted in a greater number of mixed pasture samples than PRG samples represented in the resulting sample set.

2.2.1. Sampling and Preparation for Biomass and Pasture Quality Analysis

Three 50 × 50 cm quadrats were cut for each plot from randomly chosen locations on each of the sampling dates (Table 1). The cut sample contained the vegetative material growing above 7 cm, as measured from the soil surface, to replicate the available biomass eaten by livestock using conventional grazing pressure (i.e., stocking to achieve a 7 cm residual for optimal regrowth), and to prevent damage to forage species that grow from a raised crown. Available biomass from the three quadrats was bulked together, then stored in a cool box and subsequently a refrigerator until ready for weighing and drying. Samples were dried in a forced air oven set at 60 °C for 72 h so that a constant weight was achieved, then reweighed to determine dry matter percentage and saved for subsequent chemical composition analyses. Drying at 60 °C for an extended period is recommended practice for samples that are intended for chemical analysis so that the nutritive content of the sample is preserved [26]. In total, forty bulked samples were analysed for the purpose of this study (one cut × four replicates for PRG; three cuts × four replicates for each of the three mixed pasture types; Table 1). However, one sample from Mix-17 spoiled, leaving a total of 39 samples used for analysis.

2.2.2. Pasture Quality Analysis

Laboratory pasture composition analysis of the dried pasture samples was performed for CP, NDF (an estimate of total hemicellulose, cellulose and lignin), ADF (an estimate of total cellulose and lignin), WSC and OM using standard laboratory analysis methods as follows: nitrogen concentration was measured using the macro-Kjeldahl method and multiplied by 6.25 to give CP (AOAC method 954.01) [27]; ADF and NDF were assayed using a filter bag technique with heat-stable amylase and inclusive of residual ash according to the ANKOM methods 12 and 13, respectively [28]; ash content was measured by combustion of a subsample at 500 °C for 16 h; OM was calculated by deducting ash content from the dry matter content (AOAC method 942.05) [27]; and WSC was obtained using procedures described by Fuller et al. [29].

2.2.3. LAI Measurement

LAI was measured using a ceptometer (AccuPAR LP−80, Decagon Devices, Pullman, WA, USA). For each plot, ten measurements were taken facing the sun, first above canopy level and subsequently below the canopy (i.e., just above the soil) to calculate the difference in photosynthetically active radiation (PAR). LAI was then derived from the measured PAR according to classic light extinction theory and retrieved from the instrument’s built-in datalogger. All measurements were taken under stable cloud conditions. The leaf inclination factor of the ceptometer was set to 1, assuming a spherical leaf angle distribution.

2.2.4. Canopy Spectral Reflectance Data

Canopy hyperspectral reflectance data were collected using two SVC HR−1024i spectroradiometers (Spectra Vista Corporation, Poughkeepsie, NY, USA) in dual field of view mode. The instrument measures reflectance between 350 and 2500 nm. The standard set-up, as described by MacLellan and Gray [30], was followed for both the dual field of view and post-processing protocol (http://fsf.nerc.ac.uk/; accessed on 1 August 2018). The dual field of view set-up involves two spectroradiometers (one looking at the canopy and another at the standard spectralon reflectance panel). This approach ensures minimisation of the effect of variable incoming radiation on the measurements, and hence this method yields reliable and comparable measurements of reflectance. Spectral reflectance was measured using a 25 angle field-of-view fibre optics cable connected to the SVC at 1 m above the ground in nadir with an integration time of 3 s for each measurement. Twelve measurements were taken uniformly over each plot, and the average spectrum was used for subsequent analyses.

2.3. Post-Processing of Reflectance Data and Construction of Spectral Index-Based Models

2.3.1. Conversion of Hyperspectral Bands to Sentinel-2 Broadbands

The hyperspectral bands collected using the SVC HR−1024i field spectroradiometer were converted (convolved) into 12 multispectral Sentinel-2 (S2) broadbands using the spectral response function for the S2A sensor. There are thirteen Sentinel-2 bands, but the tenth (1375 nm) band was removed from the analyses due to the occurrence of noisy data. Moreover, this band is deemed to be of less relevance for vegetation remote sensing from satellites, due to its high sensitivity to atmospheric aerosols and water vapour.

2.3.2. Band-Pair Analysis Using the Normalised Difference Index (NDI)

Band analysis was performed on the reflectance data to assess the best combination of S2 band-pairs for predicting the different pasture quality and quantity (PQQ) parameters. The reflectance values from pairs of each of the different band combinations (bands x and y) were substituted into the generic Normalised Difference Index (NDI) equation (Equation (1)), where R is the reflectance in the corresponding bands (x and y).
NDIx,y = (Rx − Ry)/(Rx + Ry)
These index values were then compared with the PQQ results obtained from destructive sampling and subsequent laboratory analyses (Section 2.2.1 and Section 2.2.2) and from non-destructive sampling for LAI (Section 2.2.3). This analysis was repeated for each PQQ parameter for best-fit first, second and third orders of polynomial equations fitted through the PQQ versus NDI data. Our methodological approach to test the potential of S2 bands for the estimation of pasture parameters is based on regression analysis and comparable to other studies which have undertaken similar statistical analyses in the context of different vegetation types and properties [15,17,31].

2.3.3. Leave One Out Cross-Validation (LOOCV)

The analysis for determining the best S2 band combinations (Section 2.3.2) and literature-based vegetation indices (Section 2.3.4) for estimating each of the PQQ parameters was performed using a total of 39 spectral and pasture biophysical and biochemical observations of the four different pasture types (see Section 2.2.1 and Table 1). A Leave One Out Cross-Validation (LOOCV) method was employed for model cross-validation as the sample size was limited. The cross-validation approach allows rigorous testing of statistical relationships by avoiding over- and under-fitting. The average Mean Square Error (MSE) over each of the 39 runs along with the regression r2, slope and intersect between modelled and measured values for the left-out samples were calculated. Furthermore, the average Concordance Correlation Coefficient (Conr), which was considered to be a robust metric for absolute comparison of model performance with reference to measured values, was also calculated [32].

2.3.4. Vegetation Indices (VIs) Analysis

A few selected vegetation indices (VIs) that have already been used for determination of vegetation quantity or quality parameters, and that can be calculated using pairs of S2 bands (Table 2), were tested for statistical relationships with each PQQ parameter using the same cross-validation method as described in Section 2.3.3.

3. Results

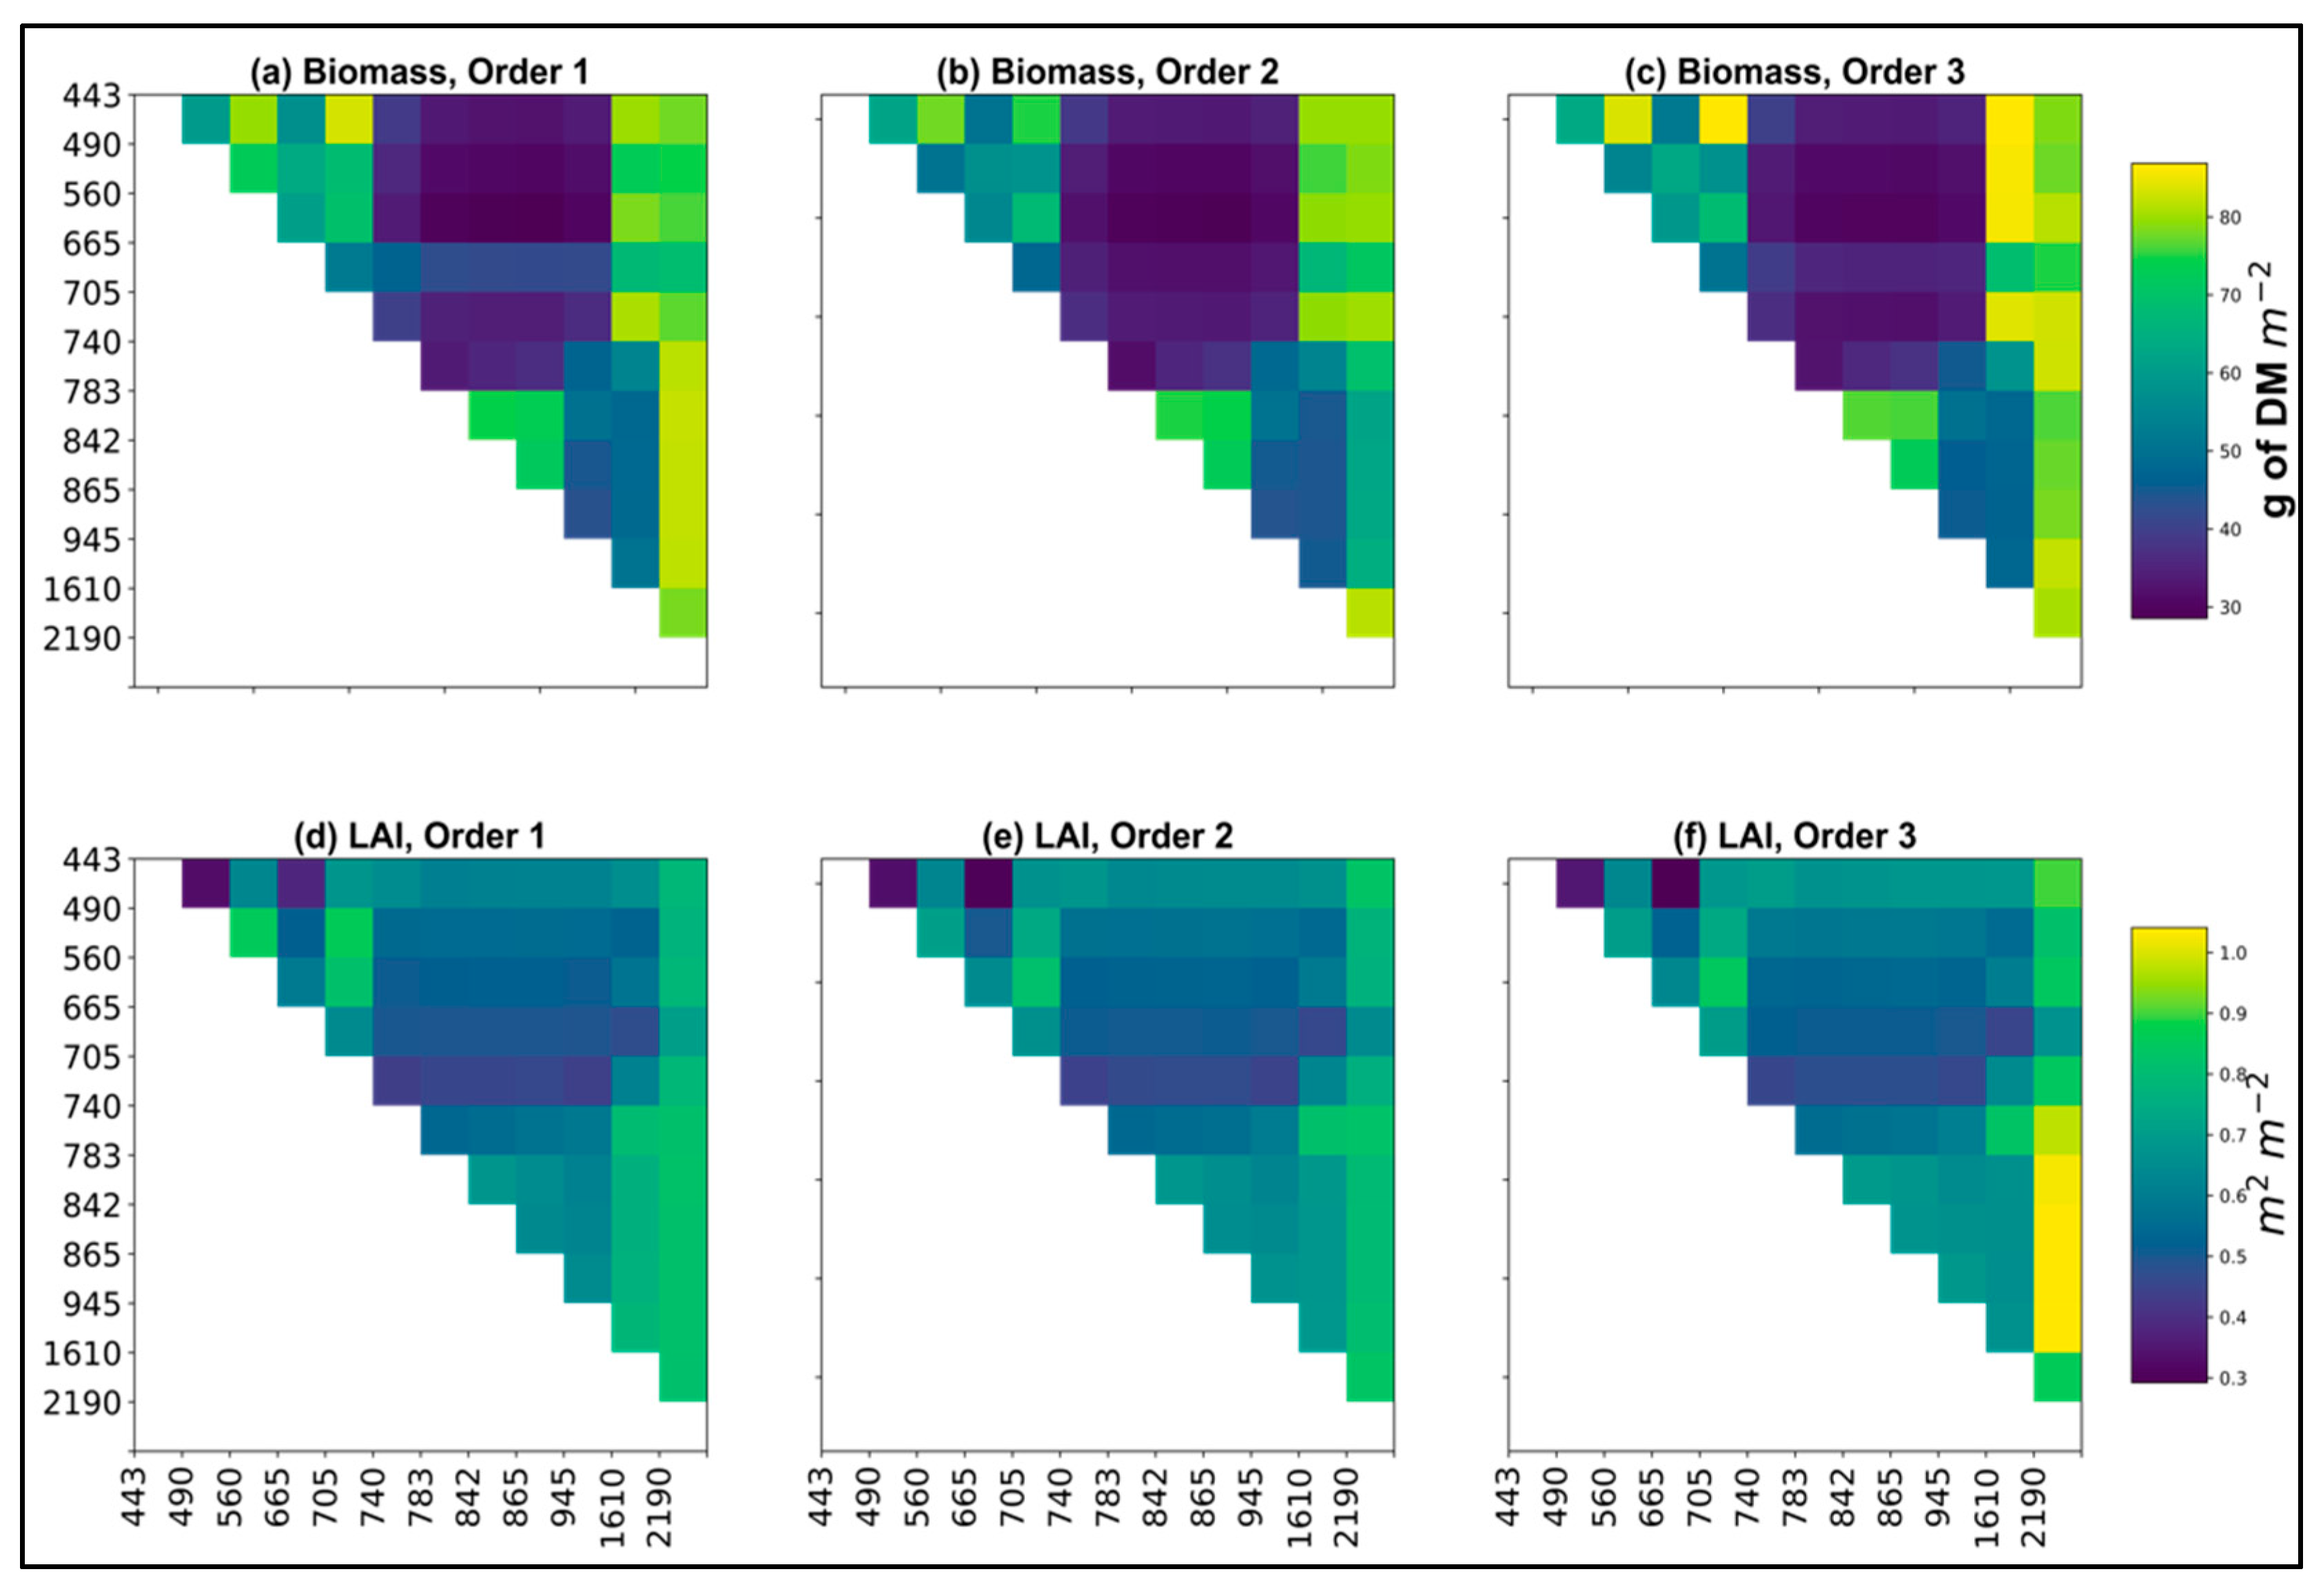
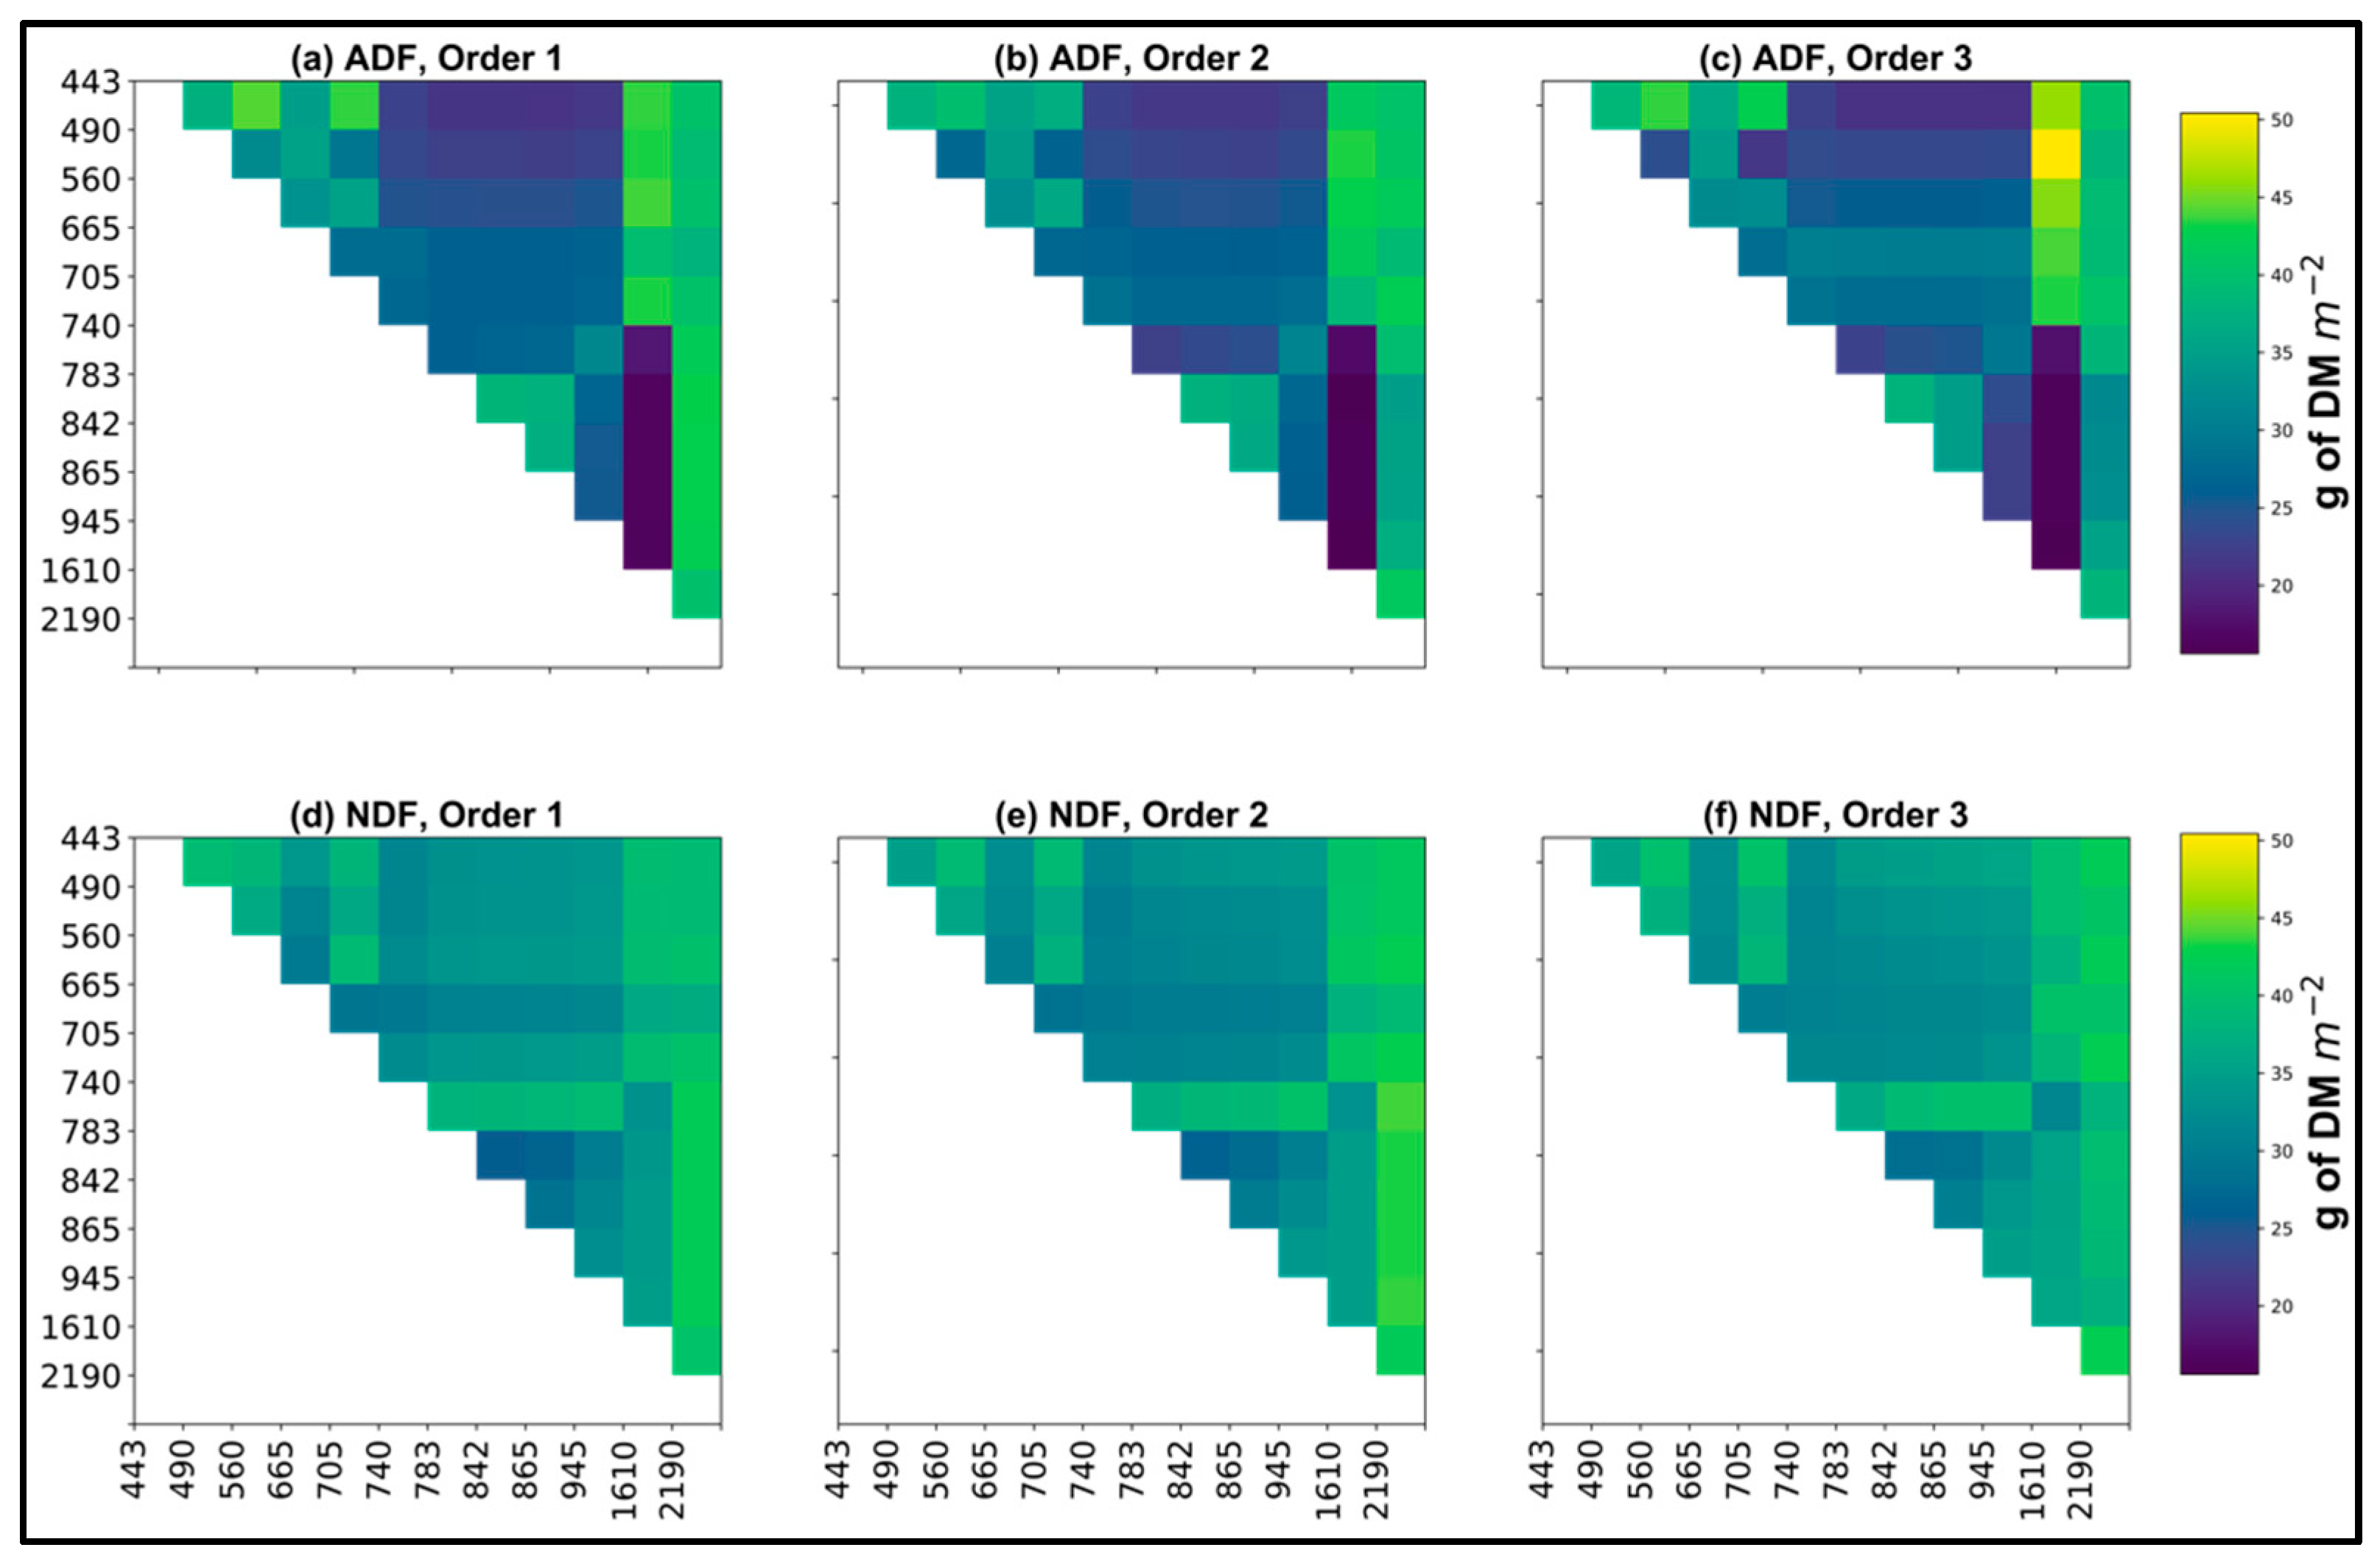
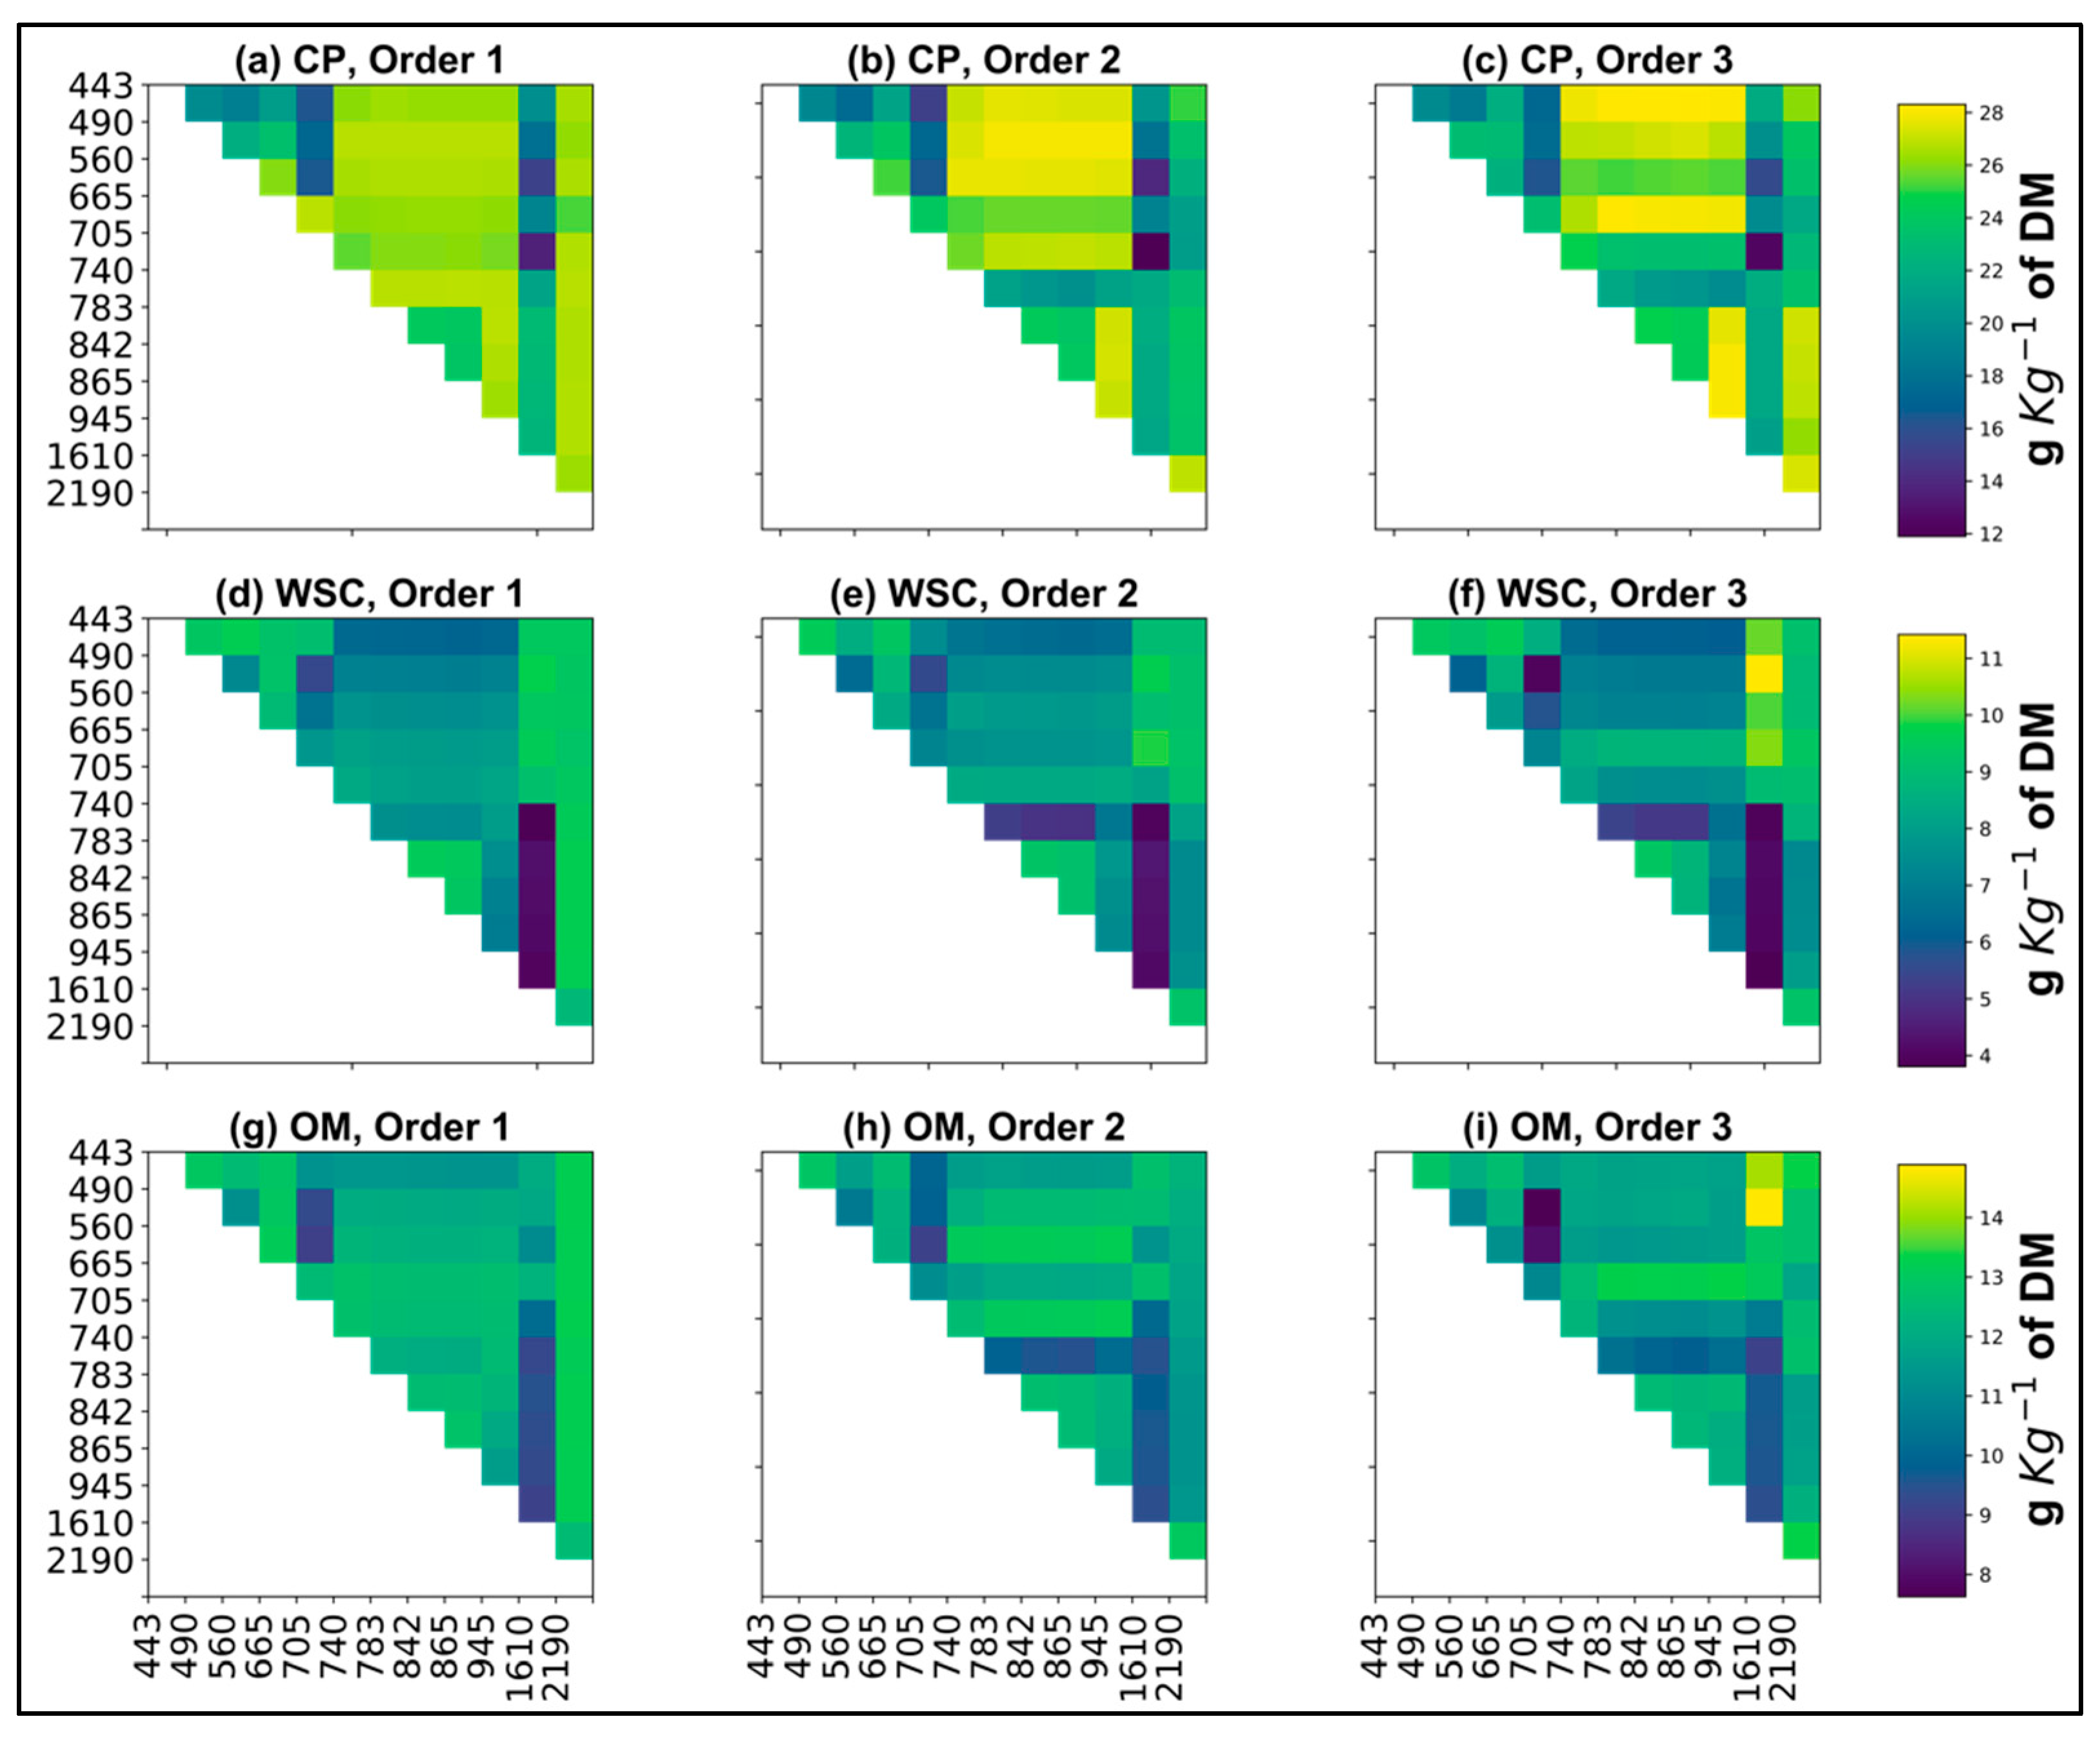
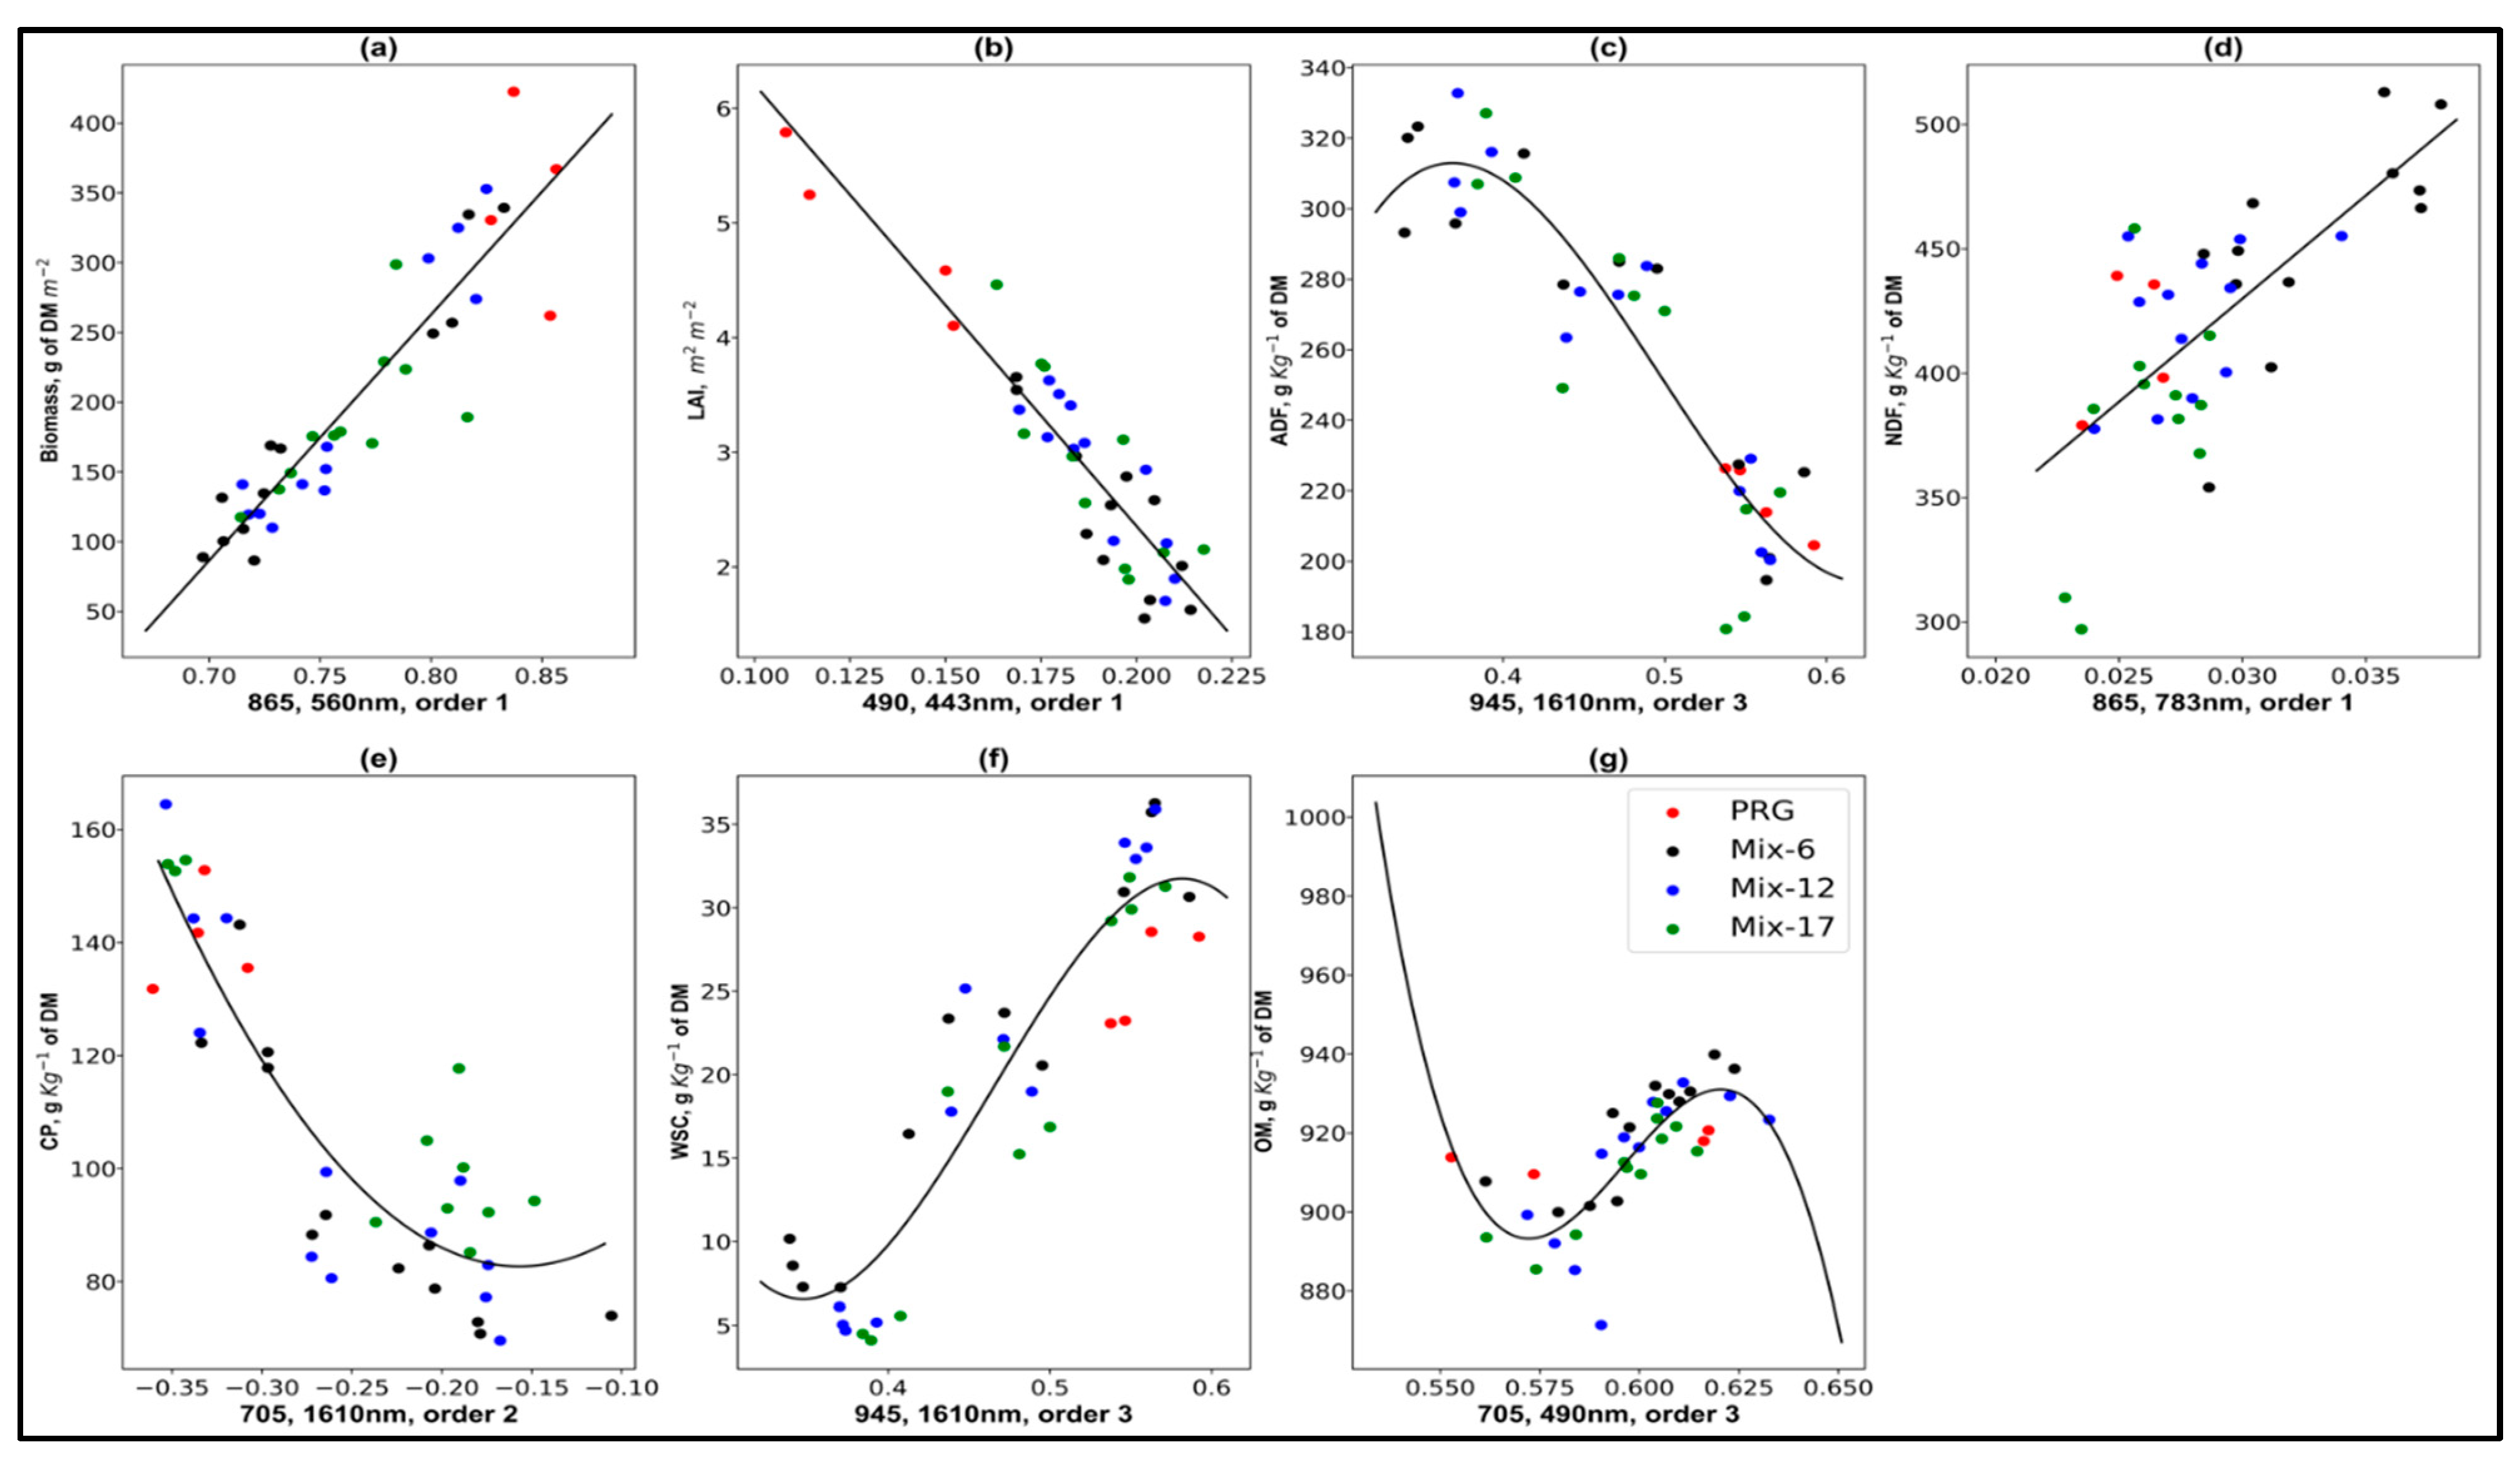
3.1. Relationships between Two-Band NDIs and Measured PQQ Parameters

Firstly, in order to assess the interdependencies between the determined PQQ parameters, Table 3 shows Pearson correlation coefficients (r) between pairs of laboratory-derived values for pasture quantity and quality parameters. Biomass had a strong correlation with LAI (positive correlation) as well as with quality parameters ADF (negative) and WSC (positive). LAI had a relatively poor correlation with pasture quality parameters, apart from with CP (0.58). A large negative correlation was observed between ADF and WSC (−0.90) as well as between OM and CP (−0.81) and between WSC and CP (−0.61). NDF did not show a good correlation with any of the parameters, apart from with ADF (r = 0.65). A large positive correlation was found between OM and WSC (0.87).
Figure 1 shows a 2-D matrix plot that summarises the strength of the relationship between NDIs and pasture quantity parameters (biomass and LAI), using MSE. Table 4 provides results for those combinations of wavelengths for which the MSE values were lower than the fifth percentile of all MSEs, thus depicting their comparatively high potential in capturing variations in the respective parameter.
Variation in biomass was captured by those two-band NDIs that had wavelength combinations (see Equation (1)) in the visible, red-edge and NIR bands (Figure 1a–c). An increase in the polynomial order of the equation did not lead to any notable decrease in MSE. Relationships developed using the SWIR bands (1610 and 2190 nm) were weaker (i.e., higher MSE values) compared to the VNIR bands. LAI showed strong relationships with a rather limited number of two-band indices compared to the biomass (Figure 1d–f). None of the band combinations involving the SWIR band showed a consistently strong relationship with LAI. The wavelengths 560 nm and 443 nm in combination with others in the visible, NIR or red-edge region produced the best results for biomass and LAI, respectively (Table 4). However, the accuracies were comparable across this entire spectrum (VIS to NIR).
Figure 2 shows the MSE matrix plot for ADF and NDF. In the case of ADF (Figure 2a–c), strong relationships were obtained for NDIs involving the 1610 nm band. This finding is consistent over all three orders used for the relationships. In the case of NDF, MSEs were higher compared to those for ADF (Figure 2d–f). None of the band combinations led to MSE values less than 20 g kg−1 of DM. The poor relationships for NDF were also evident from low Conr values (Table 4).
Similar to ADF, both CP and WSC were predicted well by NDIs involving the 1610 nm band (Figure 3). In the case of CP, the best combination was that of 1610 nm with 705 nm and with the second order of relationship (Conr = 0.83, Table 4; Figure 3a–c). For WSC, all the NDIs resulting in MSE values less than the fifth percentile of all MSEs involved the 1610 nm band, with the highest Conr for the combination of 1610 and 945 nm (Table 4, Figure 3d–f). Similarly, NDIs involving 1610 nm produced the best relationships for the OM (Table 4, Figure 3g–i). However, the overall fit of the relationships was comparatively poorer as is evident from the lower Conr values. The best relationship, i.e., the highest Conr and lowest MSE, was obtained with the blue (490 nm) and red-edge band (705 nm), for the third order fit (Table 4).
Figure 4 graphically represents the model fits between the PQQ parameters and their ‘best-fit’ NDIs. However, it should be noted that based on Table 4, other NDIs with similar Conr and MSE values will result in similar model fits, for the respective order of relationship. Both biomass and LAI were well predicted by linear models with the relationships fitting well across all treatments, even at high vegetation densities. Similarly, for other parameters, the ‘best’ model generally captured variations in all the treatments, avoiding any consistent over- or under-fitting for any specific treatments, except WSC for PRG. However, the limited number of PRG data points offered reduced scope for further investigation.

3.2. Relationships between VIs and PQQ Parameters

For biomass, most of the indices except PSRI and NDMI led to relationships with MSEs and Conr comparable to those of the best NDIs (Table 4 and Table 5, Figure 1a–c). For LAI, only CLre and REPO led to relationships with Conr values higher than 0.70. For the quality parameters, the VI models were noticeably less accurate than those obtained with the band-pair NDIs.
For both ADF and WSC, NDMI produced a closely fitting model with low MSE and Conr > 0.85. However, it is important to note that NDMI involves bands 865 and 1610 nm (Table 2); we had already identified the 1610 nm band, when used in combination with other bands in NDIs, as a band that yields good fits for certain quality parameters (including ADF and WSC; see Section 3.1 and Figure 3). None of the VIs chosen resulted in a good relationship for CP, NDF and OM.

4. Discussion

Spectral data-based monitoring of pasture quality has mainly been conducted using hyperspectral data [23,25,40,41], whereas limited research has been done to investigate the application of satellite multispectral sensors for pasture quality monitoring. The availability of Sentinel-2 images offers great potential for regular monitoring of pasture quantity [18] as well as quality [22]. The analysis presented in the present study, with a large number of two-band indices, showed good sensitivity in a moderate number of Sentinel-2 band combinations to variations in ADF and WSC, but reduced sensitivity of Sentinel-2 bands for the prediction of CP, NDF and OM. These results are different from those presented by Lugassi et al. [22], wherein the authors demonstrated a reasonable capability of information retrieved from Sentinel-2 images for CP and NDF estimation. However, different authors have reported variable performance of spectral data in estimating a range of pasture quality parameters [11,25,42,43], which suggests that the relationships between the spectral bands or regions studied and pasture quality parameters are not as strong as for other biochemicals, for example, leaf chlorophyll content [44]. Another interpretation of the variable performance in different studies could be that relationships between spectral reflectance and pasture quality are less stable than for other biochemicals—e.g., correlated bands may differ depending on forage species, weed proportion, structure of the canopy, etc., which would all change between studies. Vegetation nitrogen content (which is related to CP) in particular does not have any specific spectral response because it appears in many different chemical forms within the plant [45] and in different plant organs. Moreover, CP represents a broad range of proteins which collectively did not appear to have strong spectral features when considering reflectance at the canopy level, at least not diagnosed by the majority of band combinations tested in this study.
A strong influence of pasture quantity parameters, biomass followed by LAI, on the spectral reflectance was observed in our study. The correlations among and between pasture quantity (especially biomass) and quality (ADF, WSC) parameters also play a role (see Table 3); they are influenced by pasture composition, weather and soil conditions and management as well as pasture phenological stages [22,46]. The increase in biomass as the canopy grows is strongly related to increased proportions of ADF and a drop in CP because of the increased lignification of the plant stem and the reduction in leaf:stem ratio [47]. The reduced sensitivity of reflectance to CP and NDF may also be linked to their reduced content in the pastures towards the fully-grown vegetative stage of the plant.
The correlations between quality and quantity parameters make it difficult to model the spectral response to changes in a single parameter independently [25,45]. Some of these complexities can be reduced by selectively choosing bands showing increased sensitivity to a particular parameter. This kind of approach to band selection has been found to improve predictability of multispectral remote sensing-based models for pasture parameters [11,41,48]. Our findings show that while most of the pasture quality parameters influenced reflectance in the 1610 nm band (Figure 2 and Figure 3), this band is not particularly sensitive to changes in biomass and LAI (Figure 1). Thus, the detection of pasture quality indices can ideally focus on this band.
The pasture quantity parameters dominate the spectral reflectance at the canopy level more than the leaf level quality parameters, as evident from the strong statistical relationships between biomass and LAI with NDIs compared to those with the pasture quality parameters that were measured at the leaf level. Hence, their role cannot be neglected while designing remote sensing-based pasture quality monitoring and mapping methods. Our results highlight the possibilities of developing pasture quality prediction models based on correlations with NDIs. Therefore, while developing a multivariate model for pasture quality parameters based on remote sensing data, it may be advantageous to integrate remotely-sensed biomass estimates (and hence implicit information on plant structure and growth stage) directly as prior information. Such integration of prior information has been found to be useful for retrieval of vegetation parameters such as leaf chlorophyll [49,50]. Further insight into this complex issue of dominance of certain parameters in the overall reflectance can potentially be achieved using physically-based radiative transfer models [51]. However, it will require development of conversion equations to relate the pasture quality parameters with those required for the radiative transfer model simulations.
The best-fit relationship plots presented in Figure 4 between NDIs and biomass, LAI, ADF and WSC, respectively, seem to fit well across the four treatments. This shows that the chosen band combinations have good predictability for these quality parameters, irrespective of pasture type. However, it is also important to note that the increase in the polynomial orders generally led to marginal improvements only in the statistical indicators (Table 4). Most relationships between pasture parameters and respective normalised difference indices (apart from the one shown in Figure 4g) display a trend that appears linear on inspection. Hence, when developing models for predictions, the use of complex polynomial models may result in undesirable overfit issues with little improvement in the model variance.
The SWIR band of 1610 nm, in combination with red-edge and NIR bands, were sensitive to ADF, CP, WSC and OM. This wavelength region has been found to be important in pasture quality estimates [25,40,41]. However, none of the band combinations that included SWIR band 2190 were found to have a good or moderate relationship with the pasture quality parameters. In contrast, this waveband has been found to be quite sensitive by other researchers [11,25,41], especially with reference to fibre content, due to absorption features in cellulose molecules. In the present study, some highly diverse mixtures of pastures (including different grasses, herbs and legumes) were studied, with considerable variability in structure and vegetation moisture content, which can possibly explain the poor correlation with these bands. Moreover, at peak growth stage of pasture canopies, there is an increased fraction of non-photosynthetic vegetation components, which can possibly dampen the spectral features in this region [23]; in the present study, pasture cuts were always taken around the time of peak growth stage.
The relatively poor performance in general of the literature-based spectral indices (Table 2 and Table 5) suggests that for the development of reliable remote sensing-based predictive models of pasture quality parameters, the testing of all possible band combinations is important, in particular when the pasture canopy is composed of a diverse mixture of grasses, legumes and forbs. With the relatively limited set of data in terms of numbers as well as growth stages used in this study, it is not possible to test a multivariate approach using a variety of bands and spectral indices together through more robust statistical modelling methods such as PLSR or machine learning. However, the present paper assesses the sensitivity of Sentinel-2 spectral bands to pasture quantity and quality parameters in its most straightforward form, while ensuring statistical robustness through the LOOCV approach. The good correlation found between the various bespoke multispectral two-band indices, and to a lesser extent the literature-based indices, as well as the various pasture quality and quantity parameters is encouraging. However, our findings are based on proximal optical remote sensing data. Hence, further research is needed to build prediction models using the actual Sentinel-2 images in combination with large field datasets ranging across a variety of pasture types at different growth stages. Moreover, our plots were cut by hand and not grazed nor trampled by livestock. This will also affect the shape of the relationships between the spectral indices and pasture parameters by causing more variability in terms of vegetation structure.

5. Conclusions

The study presented results for the assessment of Sentinel-2 bands, simulated from field hyperspectral data, in capturing pasture quality parameters for mixed-species pastures at a stage of growth appropriate for rotational grazing. The results suggest that the role of pasture quantity parameters, such as biomass and LAI, has to be taken into account while developing remote sensing-based pasture quality prediction models, firstly due to the higher sensitivity of reflectance to quantity parameters, and secondly, due to non-specific and weaker relationships between most of the quality parameters and the spectral data. However, some strong relationships were found between certain quality parameters (ADF, CP and WSC) and bespoke vegetation indices, especially for normalised vegetation indices using the 1610 nm band, thus highlighting its importance in remote sensing-based pasture quality monitoring. The scope of the present study has some limitations, for example in relation to its sample size and range of pasture growth stages. However, it does provide important insights into the complexities that have to be taken into account while designing remote sensing-based pasture monitoring projects, in particular for multi-species swards.

Author Contributions

Conceptualisation, S.M.P., A.V., A.T.; methodology, S.M.P., A.V.; experimental field plots set-up, D.J.H., A.T., C.K.R.; field data collection, S.M.P., A.T., A.V., D.J.H.; data analysis and interpretation, S.M.P., A.T., A.V., C.K.R.; manuscript development, S.M.P., A.V., A.T., C.K.R. All authors have read and agreed to the published version of the manuscript.

Funding

This work was supported by Innovate UK (PASQUAL project: Monitoring and prediction of pasture quality and productivity from satellites; Project No. 102681). The Sonning farm mixed-species pasture plots were established and maintained as part of the BBSRC SARIC biodiverse forages project (Project BB/N004353/1). These sponsors had no involvement in the study design; collection, analysis and interpretation of data; in the writing of the paper; and in the decision to submit the article for publication.

Institutional Review Board Statement

Not applicable.

Informed Consent Statement

Not applicable.

Data Availability Statement

The data presented in this study are available on request from the corresponding author. The data are not yet publicly available because the project BB/N004353/1 is still ongoing.

Acknowledgments

We thank Tristan Quaife for a number of useful discussions on the remote sensing analyses procedures. We are grateful to the Natural Environment Research Council (NERC) Field Spectroscopy Facility, based at Edinburgh University, for providing us with the second SVC field hyperspectral instrument (loan reference 752.1116) and in particular to Chris MacLellan for his guidance on how to configure and use the dual-instrument set-up. In addition, we acknowledge the contributions of Caroline Hadley, Richard Casebow, Colin Green, Paul Kirton and Chris Fawdry in establishing, maintaining and sampling the pasture plots. Finally, we thank Pierre-Antoine Ariotti who helped with field data collection.

Conflicts of Interest

The authors declare no conflict of interests with respect to this study.

References

  1. Bengtsson, J.; Bullock, J.M.; Egoh, B.; Everson, C.; Everson, T.; O’Connor, T.; O’Farrell, P.J.; Smith, H.G.; Lindborg, R. Grasslands—More Important for Ecosystem Services than You Might Think. Ecosphere 2019, 10, e02582. [Google Scholar] [CrossRef]
  2. DEFRA. Farming Statistics Provisional Crop. Areas, Yields and Livestock Populations At June 2018—United Kingdom; DEFRA, 2018; pp. 1–23. Available online: https://assets.publishing.service.gov.uk/government/uploads/system/uploads/attachment_data/file/747210/structure-jun2018prov-UK-11oct18.pdf (accessed on 1 May 2021).
  3. Thornton, P.K. Livestock Production: Recent Trends, Future Prospects. Philos. Trans. R. Soc. B: Biol. Sci. 2010, 365, 2853–2867. [Google Scholar] [CrossRef] [Green Version]
  4. Edirisinghe, A.; Clark, D.; Waugh, D. Spatio-Temporal Modelling of Biomass of Intensively Grazed Perennial Dairy Pastures Using Multispectral Remote Sensing. Int. J. Appl. Earth Obs. Geoinf. 2012, 16, 5–16. [Google Scholar] [CrossRef]
  5. Wilkinson, J.M.; Lee, M.R.F.; Rivero, M.J.; Chamberlain, A.T. Some Challenges and Opportunities for Grazing Dairy Cows on Temperate Pastures. Grass Forage Sci. 2020, 75, 1–17. [Google Scholar] [CrossRef] [PubMed]
  6. Uberoi, E. UK Dairy Industry Statistics; House of Commons Library: London, UK, 2020; pp. 1–11. [Google Scholar]
  7. Thomson, N.A.; Mccallum, D.A.; Howse, S.; Holmes, C.W.; Matthews, P.N.P.; Matthew, C. Estimation of Dairy Pastures—The Need for Standardisation. In Proceedings of the New Zealand Grassland Association; 1997; Volume 59, pp. 221–225. Available online: https://www.nzgajournal.org.nz/index.php/ProNZGA/article/view/2245 (accessed on 19 August 2020).
  8. Somasiri, S.C.; Kenyon, P.R.; Morel, P.C.H.; Kemp, P.D.; Morris, S.T. Alternative Method to Measure Herbage Dry Matter Mass in Plantain and Chicory Mixed Swards Grazed by Lambs. Proc. N. Z. Soc. Anim. Prod. 2014, 74, 115–123. [Google Scholar]
  9. Norris, K.H.; Barnes, R.F.; Moore, J.E.; Shenk, J.S. Predicting Forage Quality by Infrared Replectance Spectroscopy. J. Anim. Sci. 1976, 43, 889–897. [Google Scholar] [CrossRef]
  10. Petisco, C.; García-Criado, B.; García-Criado, L.; Vázquez-de-Aldana, B.R.; García-Ciudad, A. Quantitative Analysis of Chlorophyll and Protein in Alfalfa Leaves Using Fiber-Optic Near-Infrared Spectroscopy. Commun. Soil Sci. Plant. Anal. 2009, 40, 2474–2484. [Google Scholar] [CrossRef]
  11. Lugassi, R.; Chudnovsky, A.; Zaady, E.; Dvash, L.; Goldshleger, N. Estimating Pasture Quality of Fresh Vegetation Based on Spectral Slope of Mixed Data of Dry and Fresh Vegetation—Method Development. Remote Sens. 2015, 7, 8045–8066. [Google Scholar] [CrossRef] [Green Version]
  12. Nakagami, K.; Itano, S. Improving Pooled Calibration of a Rising-Plate Meter for Estimating Herbage Mass over a Season in Cool-Season Grass Pasture. Grass Forage Sci. 2014, 69, 717–723. [Google Scholar] [CrossRef]
  13. Ali, I.; Cawkwell, F.; Dwyer, E.; Barrett, B.; Green, S. Satellite Remote Sensing of Grasslands: From Observation to Management. J. Plant. Ecol. 2016, 9, 649–671. [Google Scholar] [CrossRef] [Green Version]
  14. Numata, I.; Roberts, D.A.; Chadwick, O.A.; Schimel, J.P.; Galvão, L.S.; Soares, J.V. Evaluation of Hyperspectral Data for Pasture Estimate in the Brazilian Amazon Using Field and Imaging Spectrometers. Remote Sens. Environ. 2008, 112, 1569–1583. [Google Scholar] [CrossRef]
  15. Jin, Y.; Yang, X.; Qiu, J.; Li, J.; Gao, T.; Wu, Q.; Zhao, F.; Ma, H.; Yu, H.; Xu, B. Remote Sensing-Based Biomass Estimation and Its Spatio-Temporal Variations in Temperate Grassland, Northern China. Remote Sens. 2014, 6, 1496–1513. [Google Scholar] [CrossRef] [Green Version]
  16. Atzberger, C.; Darvishzadeh, R.; Immitzer, M.; Schlerf, M.; Skidmore, A.; le Maire, G. Comparative Analysis of Different Retrieval Methods for Mapping Grassland Leaf Area Index Using Airborne Imaging Spectroscopy. Int. J. Appl. Earth Obs. Geoinf. 2015, 43, 19–31. [Google Scholar] [CrossRef] [Green Version]
  17. Sibanda, M.; Mutanga, O.; Rouget, M. Examining the Potential of Sentinel-2 MSI Spectral Resolution in Quantifying above Ground Biomass across Different Fertilizer Treatments. ISPRS J. Photogramm. Remote Sens. 2015, 110, 55–65. [Google Scholar] [CrossRef]
  18. Punalekar, S.M.; Verhoef, A.; Quaife, T.L.; Humphries, D.; Bermingham, L.; Reynolds, C.K. Application of Sentinel-2A Data for Pasture Biomass Monitoring Using a Physically Based Radiative Transfer Model. Remote Sens. Environ. 2018, 218, 207–220. [Google Scholar] [CrossRef]
  19. Abuzar, M.; Whitfield, D.; McAllister, A. Farm Level Assessment of Irrigation Performance for Dairy Pastures in the Goulburn-Murray District of Australia by Combining Satellite-Based Measures with Weather and Water Delivery Information. ISPRS Int. J. Geo-Inf. 2017, 6, 239. [Google Scholar] [CrossRef] [Green Version]
  20. Clevers, J.G.P.W.; Gitelson, A.A. Remote Estimation of Crop and Grass Chlorophyll and Nitrogen Content Using Red-Edge Bands on Sentinel-2 and -3. Int. J. Appl. Earth Obs. Geoinf. 2013, 23, 344–351. [Google Scholar] [CrossRef]
  21. Delloye, C.; Weiss, M.; Defourny, P. Retrieval of the Canopy Chlorophyll Content from Sentinel-2 Spectral Bands to Estimate Nitrogen Uptake in Intensive Winter Wheat Cropping Systems. Remote Sens. Environ. 2018, 216, 245–261. [Google Scholar] [CrossRef]
  22. Lugassi, R.; Zaady, E.; Goldshleger, N.; Shoshany, M.; Chudnovsky, A. Spatial and Temporal Monitoring of Pasture Ecological Quality: Sentinel-2-Based Estimation of Crude Protein and Neutral Detergent Fiber Contents. Remote Sens. 2019, 11, 799. [Google Scholar] [CrossRef] [Green Version]
  23. Beeri, O.; Phillips, R.; Hendrickson, J.; Frank, A.B.; Kronberg, S. Estimating Forage Quantity and Quality Using Aerial Hyperspectral Imagery for Northern Mixed-Grass Prairie. Remote Sens. Environ. 2007, 110, 216–225. [Google Scholar] [CrossRef]
  24. Pullanagari, R.R.; Kereszturi, G.; Yule, I.J. Mapping of Macro and Micro Nutrients of Mixed Pastures Using Airborne AisaFENIX Hyperspectral Imagery. ISPRS J. Photogramm. Remote Sens. 2016, 117, 1–10. [Google Scholar] [CrossRef]
  25. Castro, P.A.; Garbulsky, M.F. Spectral Normalized Indices Related with Forage Quality in Temperate Grasses: Scaling up from Leaves to Canopies. Int. J. Remote Sens. 2018, 39, 3138–3163. [Google Scholar] [CrossRef]
  26. Cherney, D.J.R. Characterization of forages by chemical analysis. In Forage Evaluation in Ruminant Nutrition; Givens, D.I., Owen, E., Axford, R.F.E., Omed, H.M., Eds.; CABI Publishing: Wallingford, UK, 2000; pp. 281–300. [Google Scholar]
  27. AOAC. Official Methods of Analysis, 17th ed.; Association of Official Analytical Chemists: Washington, DC, USA, 2000. [Google Scholar]
  28. Kitcherside, M.A.; Glen, E.F.; Webster, A.J.F. FibreCap: An Improved Method for the Rapid Analysis of Fibre in Feeding Stuffs. Anim. Feed Sci. Technol. 2000, 86, 125–132. [Google Scholar] [CrossRef]
  29. Fuller, K.W. Automated Determination of Sugars. In Proceedings of the Automation in Analytical Chemistry, European Technicon Symposia, Paris, France, 2–4 November 1966; pp. 57–61. [Google Scholar]
  30. MacLellan, C.; Gray, A. Dual FOV Measurements with SVC HR-1024i Field Spectroradiometers—Bi-Conical Relative Reflectance Method; Edinburgh, UK, 2017; pp. 1–6. Available online: https://fsf.nerc.ac.uk/resources/guides/pdf_guides/DFOV_SVC_1024i.pdf (accessed on 19 August 2020).
  31. Meyer, L.H.; Heurich, M.; Beudert, B.; Premier, J.; Pflugmacher, D. Comparison of Landsat-8 and Sentinel-2 Data for Estimation of Leaf Area Index in Temperate Forests. Remote Sens. 2019, 11, 1160. [Google Scholar] [CrossRef] [Green Version]
  32. Lin, L.I.-K. A Concordance Correlation Coefficient to Evaluate Reproducibility. Biometrics 1989, 45, 255–268. [Google Scholar] [CrossRef] [PubMed]
  33. Gargiulo, J.; Clark, C.; Lyons, N.; de Veyrac, G.; Beale, P.; Garcia, S. Spatial and Temporal Pasture Biomass Estimation Integrating Electronic Plate Meter, Planet CubeSats and Sentinel-2 Satellite Data. Remote Sens. 2020, 12, 3222. [Google Scholar] [CrossRef]
  34. Manning, J.; Cronin, G.; González, L.; Hall, E.; Merchant, A.; Ingram, L. The Behavioural Responses of Beef Cattle (Bos Taurus) to Declining Pasture Availability and the Use of GNSS Technology to Determine Grazing Preference. Agriculture 2017, 7, 45. [Google Scholar] [CrossRef] [Green Version]
  35. Loris, V.; Damiano, G. Mapping the Green Herbage Ratio of Grasslands Using Both Aerial and Satellite-Derived Spectral Reflectance. Agric. Ecosyst. Environ. 2006, 115, 141–149. [Google Scholar] [CrossRef]
  36. Moges, S.M.; Raun, W.R.; Mullen, R.W.; Freeman, K.W.; Johnson, G.V.; Solie, J.B. Evaluation of Green, Red, and Near Infrared Bands for Predicting Winter Wheat Biomass, Nitrogen Uptake, and Final Grain Yield. J. Plant Nutr. 2005, 27, 1431–1441. [Google Scholar] [CrossRef]
  37. Munyati, C.; Balzter, H.; Economon, E. Correlating Sentinel-2 MSI-Derived Vegetation Indices with in-Situ Reflectance and Tissue Macronutrients in Savannah Grass. Int. J. Remote Sens. 2020, 41, 3820–3844. [Google Scholar] [CrossRef]
  38. Serrano, J.; Shahidian, S.; Marques da Silva, J. Evaluation of Normalized Difference Water Index as a Tool for Monitoring Pasture Seasonal and Inter-Annual Variability in a Mediterranean Agro-Silvo-Pastoral System. Water 2019, 11, 62. [Google Scholar] [CrossRef] [Green Version]
  39. Ren, S.; Chen, X.; An, S. Assessing Plant Senescence Reflectance Index-Retrieved Vegetation Phenology and Its Spatiotemporal Response to Climate Change in the Inner Mongolian Grassland. Int. J. Biometeorol. 2017, 61, 601–612. [Google Scholar] [CrossRef]
  40. Starks, P.J.; Zhao, D.; Brown, M.A. Estimation of Nitrogen Concentration and in Vitro Dry Matter Digestibility of Herbage of Warm-Season Grass Pastures from Canopy Hyperspectral Reflectance Measurements. Grass Forage Sci. 2008, 63, 168–178. [Google Scholar] [CrossRef]
  41. Thulin, S.; Hill, M.; Held, A.; Jones, S.; Woodgate, P. Predicting Levels of Crude Protein, Digestibility, Lignin and Cellulose in Temperate Pastures Using Hyperspectral Image Data. Am. J. Plant Sci. 2014, 5, 997–1019. [Google Scholar] [CrossRef] [Green Version]
  42. Ausseil, A.-G.; Dymond, J.R.; Dynes, R.; Shepherd, J.D.; DeVantier, B.; Sutherland, A. Estimating Pasture Quality Using Landsat ETM+: Application for the Greenhouse Gas Inventory of New Zealand. In Proceedings of the 34th International Symposium on Remote Sensing of Environment—The GEOSS Era: Towards Operational Environmental Monitoring, Sydney, Australia, 10–15 April 2011; pp. 1–4. [Google Scholar]
  43. Pellissier, P.A.; Ollinger, S.V.; Lepine, L.C.; Palace, M.W.; McDowell, W.H. Remote Sensing of Foliar Nitrogen in Cultivated Grasslands of Human Dominated Landscapes. Remote Sens. Environ. 2015, 167, 88–97. [Google Scholar] [CrossRef] [Green Version]
  44. Asner, G.P. Biophysical and Biochemical Sources of Variability in Canopy Reflectance. Remote Sens. Environ. 1998, 64, 234–253. [Google Scholar] [CrossRef]
  45. Ollinger, S.V. Sources of Variability in Canopy Reflectance and the Convergent Properties of Plants. New Phytol. 2011, 189, 375–394. [Google Scholar] [CrossRef]
  46. Buxton, D.R. Quality-Related Characteristics of Forages as Influenced by Plant Environment and Agronomic Factors. Anim. Feed Sci. Technol. 1996, 59, 37–49. [Google Scholar] [CrossRef]
  47. Čop, J.; Lavrenčič, A.; Košmelj, K. Morphological Development and Nutritive Value of Herbage in Five Temperate Grass Species during Primary Growth: Analysis of Time Dynamics. Grass Forage Sci. 2009, 64, 122–131. [Google Scholar] [CrossRef]
  48. Durante, M.; Oesterheld, M.; Piñeiro, G.; Vassallo, M.M. Estimating Forage Quantity and Quality under Different Stress and Senescent Biomass Conditions via Spectral Reflectance. Int. J. Remote Sens. 2014, 35, 2963–2981. [Google Scholar] [CrossRef]
  49. Combal, B.; Baret, F.; Weiss, M.; Trubuil, A.; Macé, D.; Pragnère, A.; Myneni, R.; Knyazikhin, Y.; Wang, L. Retrieval of Canopy Biophysical Variables from Bidirectional Reflectance: Using Prior Information to Solve the Ill-Posed Inverse Problem. Remote Sens. Environ. 2003, 84, 1–15. [Google Scholar] [CrossRef]
  50. Darvishzadeh, R.; Skidmore, A.; Atzberger, C.; van Wieren, S. Estimation of Vegetation LAI from Hyperspectral Reflectance Data: Effects of Soil Type and Plant Architecture. Int. J. Appl. Earth Obs. Geoinf. 2008, 10, 358–373. [Google Scholar] [CrossRef]
  51. Punalekar, S.; Verhoef, A.; Tatarenko, V.I.; Van der Tol, C.; Macdonald, M.J.D.; Marchant, B.; Gerard, F.; White, K.; Gowing, D. Characterization of a Highly Biodiverse Floodplain Meadow Using Hyperspectral Remote Sensing within a Plant Functional Trait Framework. Remote Sens. 2016, 8, 112. [Google Scholar] [CrossRef] [Green Version]
Figure 1. Two-dimensional matrix plot showing mean square errors (MSEs) obtained for models built using all possible Sentinel-2-based two-band normalised difference indices (NDIs) for (ac) biomass (39 samples) and (df) leaf area index (LAI, 39 samples).
Agronomy 11 01661 g001
Figure 2. Two-dimensional matrix plot showing mean square errors (MSEs) obtained for models built using all possible Sentinel-2-based two-band normalised difference indices (NDIs) for (ac) acid detergent fibre (ADF, 39 samples) and (df) neutral detergent fibre (NDF, 39 samples).
Agronomy 11 01661 g002
Figure 3. Two-dimensional matrix plot showing mean square errors (MSEs) obtained for models built using all possible Sentinel-2-based two-band normalised difference indices (NDIs) for (ac) crude protein (CP, 39 samples), (df) water soluble carbohydrate (WSC, 39 samples) and (gi) organic matter (OM, 39 samples).
Agronomy 11 01661 g003
Figure 4. Best modelled relationships between pasture parameters and respective normalised difference indices (NDIs): (a) biomass, (b) leaf area index (LAI), (c) acid detergent fibre (ADF), (d) neutral detergent fibre (NDF), (e) crude protein (CP), (f) water soluble carbohydrate (WSC), (g) organic matter (OM). For each of the parameters, 39 samples were used to fit the relationships.
Agronomy 11 01661 g004
Table 1. A summary of the four pasture types (mixtures of perennial ryegrass, grasses, legumes and forbs), including species type and sampling dates in 2017. Each pasture species mix contains at least one variety of perennial ryegrass and then up to 16 other species, with the grasses, legumes and forbs in each mix listed in column 2. Grasses have been separated from legumes and forbs by semi-colon. Non-destructive sampling included measurements of Leaf Area Index (LAI) and spectral measurements.
Pasture TypeSpeciesDates of Simultaneous Non-Destructive and Destructive Pasture Sampling
Perennial Ryegrass (PRG, 4 samples)Perennial Ryegrass
(5 varieties)
24 April
Mix-6 (12 samples)Perennial Ryegrass
(3 varieties); timothy, red clover, white clover
(2 varieties), chicory, ribgrass
2 May14 June25 August
Mix-12 (12 samples)Perennial Ryegrass, Festulolium, timothy, cocksfoot, meadow fescue; red clover, alsike clover, white clover, Lucerne, yellow trefoil, chicory, ribgrass
Mix-17 (11 samples)Perennial Ryegrass, Festulolium, timothy, cocksfoot, meadow fescue, tall fescue; red clover, white clover
(2 varieties), alsike clover, sweet clover, birdsfoot trefoil, sainfoin, chicory, ribgrass, burnet, yarrow, sheep’s parsley
Table 2. Vegetation indices suggested in the literature for vegetation quantity or quality that can be calculated using pairs of Sentinel-2 bands. Ri refers to the reflectance factor at wavelength i nm.
IndexFormulaSelective References
NDVI (Normalised Difference Vegetation Index) R 842 R 665 R 842 + R 665 [33,34]
GNDVI (Green Normalised Difference Vegetation Index) R 842 R 560 R 842 + R 560 [35,36]
CLre (ChLorophyll red edge) ( R 783 R 705 ) 1 [20,37]
REPO (Red Edge POsition) 700 + 40 ( R 665 + R 783 ) 2 R 705 R 740 R 705 [20,37]
NDMI (Normalised Difference Moisture Index) R 865 R 1610 R 865 + R 1610 [38]
PSRI (Pigment Senescence Reflectance Index) R 665 R 490 R 740 [39]
WDRVI (Wide Dynamic Range Vegetation Index) ( 0.1 R 783 R 665 ) ( 0.1 R 783 + R 665 ) [22]
SAVI (Soil-Adjusted Vegetation Index) ( R 842 R 665 ) ( 1 + 0.428 ) R 842 + R 665 + 0.428 [22]
The indices were chosen such that different bands ranging from VIS to SWIR were utilised. These indices have been reported to be sensitive to different structural and biochemical constituents in a variety of vegetation types previously.
Table 3. Pearson correlation coefficient (r) among all pairs of laboratory-derived pasture quantity and quality parameters (39 samples for each parameter). The largest correlations (r > ±0.6) have been highlighted in bold.
Correlation
Coefficient
BiomassLAIADFNDFCPWSCOM
Biomass 1.0
LAI0.701.0
ADF−0.72−0.351.0
NDF−0.32−0.270.651.0
CP−0.010.580.27−0.171.0
WSC0.650.13−0.90−0.36−0.611.0
OM0.37−0.14−0.66−0.05−0.810.871.0
LAI—leaf area index, ADF—acid detergent fibre, NDF—neutral detergent fibre, CP—crude protein, WSC—water soluble carbohydrate, OM—organic matter.
Table 4. Statistical indicators for the developed ‘best’ models for pasture quantity and quality parameters (39 samples for each parameter) using ‘leave one out’ cross validation. Only normalised models yielding mean square errors (MSEs) in the lowest 5th percentile (considering all possible models) are listed. The results in bold highlight models yielding highest Conr.
ParameterOrderWave.
(1)
Wave.
(2)
MSEr2SlopeinterceptConr
LAI14434900.330.840.860.420.91
14436650.390.730.750.730.83
17057400.430.660.670.960.76
17059450.440.670.690.920.77
24434900.340.840.860.420.91
24436650.300.810.810.550.88
27057400.440.650.670.960.76
27059450.450.650.680.930.76
34434900.350.830.840.470.90
34436650.290.810.810.560.88
366516100.450.540.561.300.64
37057400.450.630.680.960.76
Biomass156078329.500.800.8138.240.88
156084228.990.800.8237.340.88
156086528.560.800.8236.800.88
156094530.340.800.8138.360.88
249086530.400.760.8039.910.86
256078329.460.780.8138.220.87
256084229.060.780.8237.440.87
256086528.810.780.8236.970.88
349086531.200.770.8040.560.86
356078330.300.770.8238.090.87
356084230.140.780.8237.790.87
356086529.960.780.8237.640.87
ADF1783161016.510.810.8247.300.88
1842161016.490.800.8248.090.88
1865161016.480.800.8148.750.88
1945161016.370.800.8148.710.88
2783161015.870.810.8342.990.89
2842161015.920.810.8343.820.89
2865161015.960.810.8344.420.89
2945161015.610.810.8442.250.89
3783161016.160.820.8342.660.89
3842161016.190.810.8343.370.89
3865161016.180.810.8343.800.89
3945161015.810.820.8440.760.90
NDF166570528.960.380.41248.160.45
178384225.930.430.46225.700.52
178386526.850.450.47221.740.53
184286528.650.410.44234.820.49
266570528.740.370.41245.640.46
266574029.530.350.39254.300.44
278384226.570.390.44236.040.49
278386527.880.410.45232.710.50
366570530.240.330.37263.000.41
378384228.170.360.43240.250.49
378386528.560.430.47222.360.53
384286530.530.380.44233.650.50
CP144370516.310.510.5944.770.67
156070516.490.490.5251.720.59
1560161015.270.610.6339.710.71
1705161013.640.690.7131.360.79
244370515.070.610.6537.090.73
256070516.510.470.5251.580.60
2560161014.010.630.6834.560.76
2705161011.900.740.7626.310.83
344370517.380.340.5447.010.58
356070516.270.470.5251.730.60
3560161015.670.500.6737.030.70
3705161012.400.700.7428.570.81
WSC174016103.860.810.823.770.88
184216104.200.800.813.950.88
186516104.160.800.813.850.88
194516104.000.820.833.510.89
274016103.970.800.823.640.88
284216104.330.790.813.850.87
286516104.280.790.823.750.88
294516104.130.810.833.390.89
34907053.970.760.784.450.85
374016103.900.800.823.700.88
386516104.040.800.833.620.88
394516103.810.820.853.180.90
OM15607059.030.480.51445.260.58
174016109.230.470.50461.210.56
186516109.300.450.47482.930.53
194516109.130.470.49462.850.56
25607059.110.460.54424.480.61
27408659.450.380.41538.390.46
274016109.490.450.50458.620.57
294516109.400.450.50453.260.57
34907057.630.590.62347.790.70
35607058.030.560.61359.880.69
374016109.130.470.52440.340.59
394516109.390.460.52441.910.59
Table 5. Mean square error (MSE) and concordance correlation coefficients (Conr) for predicting pasture quantity and quality parameters (39 samples for each parameter) using literature-based indices (Table 2). The results in bold highlight models yielding highest Conr.
BiomassLAICPADFNDFWSCOM
IndexOrderMSEConrMSEConrMSEConrMSEConrMSEConrMSEConrMSEConr
NDVI141.990.770.500.6426.280.0026.310.5831.100.327.950.2712.630.00
NDVI232.130.840.510.6425.620.0926.230.6330.140.437.690.4811.940.30
NDVI335.290.820.510.6328.040.1830.110.5131.560.348.740.4113.290.33
GNDVI128.990.880.520.6826.68−0.0124.300.6333.870.177.530.4012.220.04
GNDVI229.060.870.530.6727.65−0.0224.770.6231.560.407.870.4013.110.08
GNDVI330.140.870.540.6825.380.0425.900.6432.400.407.110.4911.510.22
SAVI142.210.770.500.6426.210.0026.730.5631.060.328.010.2612.68−0.01
SAVI230.910.860.510.6425.410.1226.400.6230.160.437.640.4911.770.32
SAVI333.230.840.500.6427.530.1930.460.5032.000.338.650.4212.970.35
CLre133.860.830.470.7525.960.0027.590.5335.780.108.230.2912.650.02
CLre234.810.840.470.7526.75−0.0126.400.5533.320.328.230.3013.390.02
CLre333.370.840.480.7523.150.2327.930.5628.970.487.700.4311.490.32
REPO131.440.860.490.7326.51−0.0126.680.5637.060.057.910.3712.430.06
REPO231.660.870.500.7225.100.0024.070.6333.830.276.890.4512.110.06
REPO331.990.860.500.7622.320.2425.600.6332.540.357.060.5511.560.31
WDRVI138.920.800.500.6426.41−0.0125.570.6131.910.297.810.3212.480.00
WDRVI234.030.830.510.6325.570.0626.170.6329.770.437.640.4711.870.27
WDRVI334.720.830.520.6327.010.1827.610.5930.680.408.120.4812.740.35
NDMI148.720.680.770.0922.720.0916.480.8834.390.174.160.889.300.53
NDMI244.300.730.680.2521.650.2415.960.8935.130.154.280.889.600.55
NDMI347.180.720.660.2721.550.2516.180.8935.620.144.040.889.600.56
PSRI170.880.180.580.4622.400.2438.410.0631.560.319.48−0.0112.580.03
PSRI268.720.210.540.4922.160.2339.490.0432.650.279.73−0.0112.800.02
PSRI381.200.150.600.4123.960.3144.14−0.0532.890.2510.90−0.1214.970.08
Publisher’s Note: MDPI stays neutral with regard to jurisdictional claims in published maps and institutional affiliations.

