Article

Potential of the Biomass of Plants Grown in Trace Element-Contaminated Soils under Mediterranean Climatic Conditions for Bioenergy Production

Centro de Edafología y Biología Aplicada del Segura, CSIC, Campus Universitario de Espinardo, 30100 Murcia, Spain
*
Author to whom correspondence should be addressed.
Submission received: 30 July 2021 / Revised: 24 August 2021 / Accepted: 25 August 2021 / Published: 31 August 2021
(This article belongs to the Special Issue New Phytoremediation in Trace Elements Contaminated Soils)

Abstract

:
Phytomanagement of trace element-contaminated soils combines sustainable soil remediation with the use of plant biomass for different applications. Consequently, phytostabilization using plant species useful for bioenergy production has recently received increasing attention. However, the water requirement of most of these species is a limitation for their use under Mediterranean climatic conditions. In this work, eight plant species growing naturally in mine soils contaminated by trace elements were evaluated for their use as bioenergy crops using thermochemical (combustion) and biochemical (anaerobic digestion) methods. The higher heating values of the biomass of the plants studied were all within a narrow range (16.03–18.75 MJ kg−1), while their biochemical methane potentials ranged from 86.0 to 227.4 mL CH4 (g VS)−1. The anaerobic degradation was not influenced by the presence of trace elements in the plants, but the mineral content (mainly Na) negatively affected the potential thermal energy released by combustion (HHV). The highest annual energy yields from biogas or combustion could be obtained by the cultivation of Phragmites australis and Arundo donax, followed by Piptatherum miliaceum. Both options can be considered to be suitable final destinations for the biomass obtained in the phytostabilization of trace element-contaminated soils and may contribute to the implementation of these remediation techniques in Mediterranean areas.

1. Introduction

Mining is one of the industrial activities with the greatest environmental impact [1]. The mining district of Cartagena-La Unión (Murcia, southern Spain) was exploited intensely for ores containing silver, lead, zinc and other metallic minerals from ancient times until the definitive cessation of mining activities in 1990. As a consequence, the landscape with an area of about 50 km2 was transformed and the old vegetation cover disappeared, along with habitat and numerous species [2]. The dispersion of mining waste into the surrounding environment has led to colonization by spontaneous plant species that show adaptation to soil metal contamination [3]. Recently, containment and remediation measures have been proposed for mine-affected areas [4]. Non-invasive remediation technologies, such as phytostabilization, can be effective for the in situ stabilization of metals in the contaminated sites of the Cartagena-La Unión mining district [5,6]. Through phytostabilization, the establishment of a self-sufficient vegetative cover reduces the risk of an uncontrolled transfer of pollutants into the surrounding environment. However, the use of the plant biomass resulting from remediation is still a challenge for the implementation of phytoremediation strategies [7].
The use of contaminated land for the production of valuable biomass (such as the production of timber, bioenergy crops, biofortified products, ecomaterials, etc.) is considered essential for the commercial success of the phytotechnologies and falls within the concept of phytomanagement [8,9]. Therefore, in phytomanagement, the remediation strategies are combined with sustainable site management options, which results in a net gain (or at least no gross reduction) in soil function and ecosystem services, as well as effective risk management [10]. Thus, the use of potential energy crops in the phytoremediation of soils contaminated by trace elements (TEs) has a double objective: the natural remediation of the site and the production of renewable energy [9]. Up to now, energy crops have mainly comprised species with a high biomass per unit area when grown in good agricultural soils, but now special attention is being paid to species capable of producing reasonable yields when grown on marginal land [11], which may help to avoid competition for resources with food production [12].
The lignocellulosic biomass from woody crops and grasses can be a source of renewable energy through thermochemical and biochemical conversion methods [13]. The physical and chemical characteristics of different plant species in relation to their use as biomass crops for bioenergy production, the so-called second-generation biofuels, have previously been reviewed [14]. The richness in certain organic components of the plants, especially cellulose, hemicellulose and lignin, defines their usefulness for the production of different biofuels, such as bioethanol, biogas, biomethane, biohydrogen, syngas or bio-oil, and for combustion to obtain renewable energy [11,15,16]. For dry biomass conversion processes such as combustion, pyrolysis or gasification, the main properties to be considered are the moisture content, calorific value, ash content, alkali and metal content and cellulose/lignin ratio, while for wet biomass conversion (such as anaerobic digestion or alcoholic fermentation), the most relevant parameters are the moisture content and the cellulose/lignin ratio [11].
Perennial energy crops (Miscanthus spp., Ricinus communis, Jatropha curcas, Populus spp., Salix spp.) in short-rotation coppices and certain high-biomass annual crops have been evaluated for bioenergy production in sustainable phytoremediation [9,17]. However, the high water requirements of such energy crops limit their cultivation in Mediterranean regions with water scarcity. In this sense, the use of native species from marginal or contaminated land, adapted to the climatic conditions of the area to be remediated, as bioenergy crops can comply with several objectives, such as: limiting the introduction of non-native species into the local soil ecosystem, promoting soil biological activity in such degraded soils, avoiding competition for agricultural soil with food crops and improving the CO2 balance. Nevertheless, research is needed to evaluate the potential of native species from arid or semiarid areas for bioenergy production. According to Grippi et al. [14], plant species belonging to the families Poaceae, Asteraceae and Brassicaceae have characteristics suitable for their use as biofuels. Previous studies have evaluated the potential for bioenergy production of several wild species used for the remediation of TEs-contaminated soils under Mediterranean conditions, such as milk thistle (Silybum marianum), Dittrichia viscosa, Piptatherum miliaceum and Nicotiana glauca [18,19,20,21]. Thus, the plants growing spontaneously in contaminated soils can be considered the best candidates for phytoremediation, and at the same time can be a source of biomass for bioenergy production, to develop phytomanagement strategies.
However, there is little information on the energetic potential of these species and how their composition, influenced by the soil pollution, will positively or negatively affect their use for the production of bioenergy. The plant species used in phytostabilization, in addition to their adaptation to the soil and climatic conditions of the area, must have low TEs concentrations in their aerial (harvestable) parts, with restricted root-to-shoot transport. We hypothesized that the low TEs accumulation in the aerial parts of the plants makes their biomass adequate for bioenergy production, as low concentrations of potentially toxic elements will not negatively affect the thermochemical and biological processes involved in the production of thermal energy, through combustion, and biogas, by means of anaerobic digestion.
Therefore, the objective of this study was to identify and characterize plant species that grow naturally in the Cartagena-La Unión mining district, regarding their potential for bioenergy production and the phytomanagement of TE-contaminated soils. For this, the potential for thermal energy and biogas production were studied under laboratory conditions, and the results were related to plant composition to define phytomanagement strategies based on bioenergy production.

2. Materials and Methods

2.1. Plant Sampling and Chemical Analyses

Eight different plant species growing spontaneously in the areas of El Gorguel and El Llano del Beal, within the Sierra Minera of La Unión-Cartagena, were sampled by cutting the aerial part (shoots) of several individual fully developed plants. The area of study is characterized by an average annual temperature of 17.7 °C with an annual precipitation of <300 mm, with occasional torrential rainfall during late summer or autumn. The average concentrations of the main TEs of the soils for El Gorguel and El Llano del Beal, respectively (mg kg−1), are: As 408-664, Cd 35-19, Cu 116-193, Pb 6360-10188, and Zn 12048-9686 [6,22].
The species sampled were, in El Gorguel: Arundo donax L. (Poaceae), Phragmites australis (Cav.) Trin. ex Steud. (Poaceae), Piptatherum miliaceum (L.) Coss. (Poaceae) and Foeniculum vulgare Mill. (Apiaceae); and in El Llano del Beal: Dittrichia viscosa (L.) Greuter (Asteraceae), Zygophyllum fabago L. (Zygophyllaceae), Bituminaria bituminosa L. Stirton (Fabaceae) and Atriplex halimus L. (Amaranthaceae). The fresh samples were washed with deionised water, dried at 60 °C for 48 h and ground to <0.5 mm in a stainless-steel laboratory mill (Cyckone Mill-Twister, Retsch, Haan, Germany) prior to experiments and analysis.
The elemental composition of the plant samples (P, K, micronutrient and TEs concentrations) was determined by inductively coupled plasma optical emission spectroscopy (ICP-OES; THERMO ICAP 6500 DUO instrument, Thermo Scientific), after microwave-assisted digestion (ETHOS1, Milestone) with H2O2 and HNO3 (1:4 v/v). The analytical accuracy was verified with a certified reference material (NCS DC 73349). Total solids (TS) were determined by drying at 105 °C and volatile solids (VS) were determined by ashing at 550 °C in a muffle furnace (Carbolite AAF 11/3, Hope Valley, UK) according to EPA method 1684 [23]. The concentrations of lignin and holocellulose were determined according to the American National Standard method [24,25]. The elemental (ultimate) analysis of C, N, S and H was carried out using a LECO CHNS-932 analyzer. The concentration of soluble carbohydrates was determined with the anthrone method [26]. All the analyses were performed at least in duplicate.
The higher heating value (HHV; MJ kg−1) of the plant biomass was calculated from the elemental analysis, using the method of Sheng and Azevedo [27], according to the following equation:
HHV (MJ kg−1) = −1.3675 + 0.3137 × C% + 0.7009 × H% + 0.0318 × O%

2.2. Anaerobic Degradation

The potential for biogas production of the plants was determined through anaerobic digestion, using the ANKOM Gas Production System with 310 mL-capacity bottles (ANKOMRF, ANKOM Technology, Macedon, NY, USA). With this system, the increase in pressure caused by the generation of biogas in the absence of oxygen is automatically recorded. The anaerobic inoculum used was collected from an urban wastewater treatment plant under mesophilic conditions (reactor capacity 7612 m3; hydraulic retention time 29.7 days) and incubated at 37 °C for 24 h. The composition of the inoculum was: pH 7.37 ± 0.03, electrical conductivity 14.78 ± 3.58 dS m−1, TS 21.67 ± 4.13 g L−1 and VS 14.02 ± 2.12 g L−1.
Aliquots (0.5 g) of each plant species were mixed with 100 mL of pre-incubated inoculum in individual bottles (VS ratio 1:3, substrate:inoculum) and the corresponding mixtures were then incubated in the absence of oxygen at a temperature of 37 °C under continuous stirring [20]. The anaerobic conditions were obtained by flushing the headspace of each bottle with an N2/CO2 mixture (80:20, v:v). A control sample without plant material and a positive control containing 0.5 g of cellulose were also tested. The samples were run in duplicate. The pressure generated inside the containers was recorded at 15 min intervals throughout the experiment. The biogas produced was expressed as the volume (mL) of biogas per unit (g) of VS of the plant. The volume of biogas produced was calculated using Avogadro’s ideal gas law, as shown below:
Biogas (mL g−1) = [VH × (Ps−Pi) × R × T × 22.414 × 1000]/m
where VH is the volume of the headspace (L); Ps is the pressure in kPa of the sample; Pi is the pressure in kPa of the inoculum; R is the gas constant (8.314463 L Pa K−1 mol−1); T is the temperature in kelvin (K); and m is the weight of the sample (g of VS).
The experiment finished when the biogas production was almost stable, without any further increase (14–16 days). Then, biogas aliquots (in duplicate) from each bottle were taken through the septum port using a 10 mL glass syringe, and samples were kept in vacuum containers prior to analysis [28]. These gas samples were considered representative of the biogas composition of the gases that were generated and that accumulated in the bottles throughout the incubation period. The percentage of methane (CH4) in the biogas samples was analyzed using a gas chromatography system (Agilent 490 Micro GC, Santa Clara, CA, USA).
The experimental results of the biogas production were described by a first-order kinetic model:
Bm = B0 × (1 − eK × t)
where Bm is the biogas in mL (g VS)−1 produced at time t; B0 indicates the maximum biogas production potential in mL (g VS)−1; and K is the anaerobic degradation rate constant. The experimental results were fitted to a non-linear least square model (Marquardt–Levenberg algorithm) using the software Sigma Plot v. 14.0 (Systat Software Inc., San Jose, CA, USA).
The biochemical methane potential (BMP) of each plant material was calculated from the biogas production potential (B0) and the percentage of CH4. The theoretical BMP (TBMP) was calculated from the plant characteristics using a stoichiometric equation based on the concentrations of lignin, holocellulose, soluble carbohydrates, proteins (calculated by multiplying the N concentration by 6.25) and fats [29]:
TBMP = (1014 × [lipid] + 496 × [protein] + 415 × [carbohydrate] + 727 × [lignin]) × 0.001
The lipid concentration was estimated as 3.09 g kg−1 dry matter [21,29] for the TBMP calculation (Equation (4)). The BMP/TBMP ratio indicates the anaerobic biodegradability.

2.3. Statistical Analysis

The effect of the plant species on the plant composition, HHV and biogas production was determined by a one-way ANOVA. Differences between means were determined using Tukey’s test at p < 0.05. Before the statistical analysis, the data were tested for normality using the Kolmogorov–Smirnov test. Pearson’s coefficients for the correlations between the degradation parameters and the TE concentrations in the plants were also determined (IBM SPSS Statistics 25 software).

3. Results and Discussion

3.1. Plant Composition and Calorific Value

The composition of the plants in terms of the main nutrients (N, P, K, Ca, Mg, Fe, Cu, Mn and Zn) depended on the plant species (Table S1). In fact, the greatest N concentration occurred in Z. fabago and the leguminous species B. bituminosa, while the highest K concentration occurred in the halophyte A. halimus, in line with Walker et al. [30].
The concentrations of TEs (As, Cd, Pb and Zn) were above the range considered as normal [31] in most of the plant species analyzed (Table 1). However, the plants collected did not show any evident toxicity symptoms and were all growing spontaneously in areas heavily affected by mining activity. In fact, most of the values did not reach the toxic limits for plants (As 5-20, Cd 5-30, Cu 20-100, Mn 400-1000, Pb 30-300, Zn 100-400; all in mg kg−1) [31], with the exception of Zn in most samples (in particular D. viscosa, A. donax and P. australis; Table 1) and As, Cd and Pb in D. viscosa, P. australis and P. miliaceum. However, such values are frequent in plants able to grow in mine soils [32]. The highest TE concentrations occurred for Al, As, Cd and Pb in D. viscosa, Cu, Mn and Zn in P. australis and Al in P. miliaceum (Table 1). Similar values for D. viscosa were found by Barbafieri et al. [33] and by Martínez-Fernández et al. [32]. However, Marchiol et al. [34] reported concentrations of Cd, Cu, Pb and Zn in D. viscosa (122, 55.9, 173 and 1172 mg kg−1, respectively) higher than in the present experiment, and also Melendo et al. [35] found concentrations of Pb (307–2084 mg kg−1) in plants of this species higher than in the present experiment. The concentration of As in P. australis was within the range of values found by Baroni et al. [36] and Álvarez-Robles et al. [22] for plants growing in mine soils. Likewise, the TEs concentrations in P. miliaceum plants were very similar to those found by Párraga-Aguado et al. [37], Arco-Lázaro et al. [38] and Clemente et al. [39] in soils from the same mining area. However, the concentrations of As and Pb in this species were lower than those previously reported [36,40], while the results for Cd and Cu were similar to those found in the aerial parts of this species by Kabas et al. [40] and Marchiol et al. [34]. The concentrations of TEs in B. bituminosa were within the range previously reported in soils from this mining area [38]. Contrastingly, the TEs concentrations in A. halimus and Z. fabago were much lower than those reported for plants grown in mine tailings with extremely high TE concentrations [41]. The plants of F. vulgare showed low TEs concentrations overall, while A. donax had quite high Zn concentrations (similar to those in D. viscosa), in agreement with the results of Barbafieri et al. [33]. It is interesting to note the high Na concentrations in Z. fabago and A. halimus (18.1 and 10.3 g kg−1; Table S1, Supporting Information), due to their halophytic character and Na+ accumulation capacity [30,42]. Significant positive correlations were found between the concentrations of the different TEs in the plants (Table S2), which is a common feature of plants growing in metalliferous and TE-contaminated soils [39,41,43].
The content of VS in the biomass is a parameter of great relevance regarding the possible use of the different species for bioenergy production. It indicates the organic matter of the biomass that can be combusted or potentially biodegraded to produce biogas. The VS concentrations were high for all species (80.6–93.7%; Table 2), close to the values found for other plant species such as P. miliaceum, S. marianum, Helianthus annuus L. and N. glauca (77.7–87.2%) [20]. The ash content is also a relevant factor for the production of energy from biomass, as it quantifies the mineral components. The results obtained were similar to those observed for typical biomass materials, such as Miscanthus, wheat or barley straw (2.8–6%) [11]. High ash content can lower the available energy released in a thermochemical process, and is especially relevant for combustion [11].
Lignin is one of the main constituents of plants, and usually represents 15–35% of plant biomass, depending on the species. In the present experiment, the highest lignin concentrations were found in D. viscosa, while the other species did not show significant differences among them (Table 2). In general, the values obtained were higher than those of plant species used for bioenergy production, such as Sorghum vulgare (stalk) 18.69%, Arundo donax (stems) 16.8%, Miscanthus sinensis var. Giganteus (stems) 12.8%, Panicum virgatum (whole plant) 17.6%, wheat straw 15–20%, or switchgrass 5–20% [11,44,45,46]. The values for A. donax were within the range (19.2–24.3%) reported by Corno et al. [47]. The lignin content of each species is of great relevance for the use of plant biomass for energy purposes: high values can imply suitability for combustion, but may indicate low degradability for biogas production [14].
The concentration of soluble carbohydrates was highest in A. donax and F. vulgare (Table 2), which indicates the feasibility of their use for anaerobic digestion for biogas production or for alcoholic fermentation. However, the concentration of holocellulose (the sum of cellulose and hemicellulose) in all samples was within a narrow range, being slightly higher for P. miliaceum and P. australis. The holocellulose values found for A. donax were towards the upper limit of the range reported by Corno et al. [47], but similar to those found by Cencič et al. [48] for this species. The values for the rest of the species were generally higher (except for D. viscosa and Z. fabago) than those found in other lignocellulosic species (53–65%) [14].
The elemental (C, N, S, H and O) composition of the plants (Table 3) was used to determine their HHV and lower heating value (LHV). The HHV represents the maximum amount of energy potentially recoverable from a biomass, which includes the latent heat of water vapor, while LHV takes into account that the latent heat contained in the water vapor is not always recoverable. The values of HHV were found to be within a rather narrow range (15.66–18.75 MJ kg−1), the lowest values being found for Z. fabago and the highest for A. donax (Table 3). These values were close to the upper limit of the range found by Bernal et al. [20] for P. miliaceum, S. marianum, H. annuus and N. glauca (14.76–17.45 MJ kg−1), and slightly higher than those determined for S. marianum and H. annuus plants using a bomb calorimeter (12.5–17.5 MJ kg−1) [21]. The values reported by McKendry [11]—for different types of plants (fir 21 MJ kg−1, Danish pine 21.2 MJ kg−1, willow 20 MJ kg−1, poplar 18.5 MJ kg−1, cereal straw 17.3 MJ kg−1, Switchgrass 17.4 MJ kg−1, Miscanthus 18.5 MJ kg−1)—and those of Boundy et al. [49], for herbaceous species (17.2 MJ kg−1), are close to most of the values found here. The HHVs found were lower than that of coal (22.7 MJ kg−1), but close to the values of forest residues and farmed trees (15.4 and 19.5 MJ kg−1, respectively) [49].
Even though the lignin content of lignocellulosic biomass has been generally related to the heating value [50], no significant correlation was found between the lignin concentration and HHV in the present samples. However, the contents of VS and carbohydrates showed significant positive correlations with HHVs in the plants studied (r = 0.946 and 0.731, p < 0.001 and 0.05, respectively). The calorific value was not influenced by the presence of TEs in the plant biomass, as there were no significant correlations between the As, Cd, Cu, Pb or Zn concentration and HHV for the samples (data not shown). In fact, the Mg and Na concentrations in the plants correlated negatively with HHV (r = −0.765 and −0.914, p < 0.05 and 0.01, respectively), indicating that the salt accumulation in the plants can affect their calorific potential and therefore their use for combustion [11]. High alkali metal contents (Na, K, Mg and Ca) are important for any thermochemical conversion process [11], and in the present work, the lowest HHV values, in A. halimus and Z. fabago, coincided with the greatest total concentrations of those alkaline metals (sum of Na, K, Mg and Ca; Table S1). In fact, Walker et al. [30] evaluated the use of A. halimus plants for combustion and obtained 17.2 and 12.8 MJ kg−1 for stems and leaves, respectively, in agreement with the results found here, but they considered that its energetic use should be limited to plants from non-saline soils. High ash contents may also lead to the problem of fouling and slagging in combustion equipment [20]. This is particularly relevant when the silica content of the biomass is high and, especially, when soil particles remain on the plant material after harvesting [11].

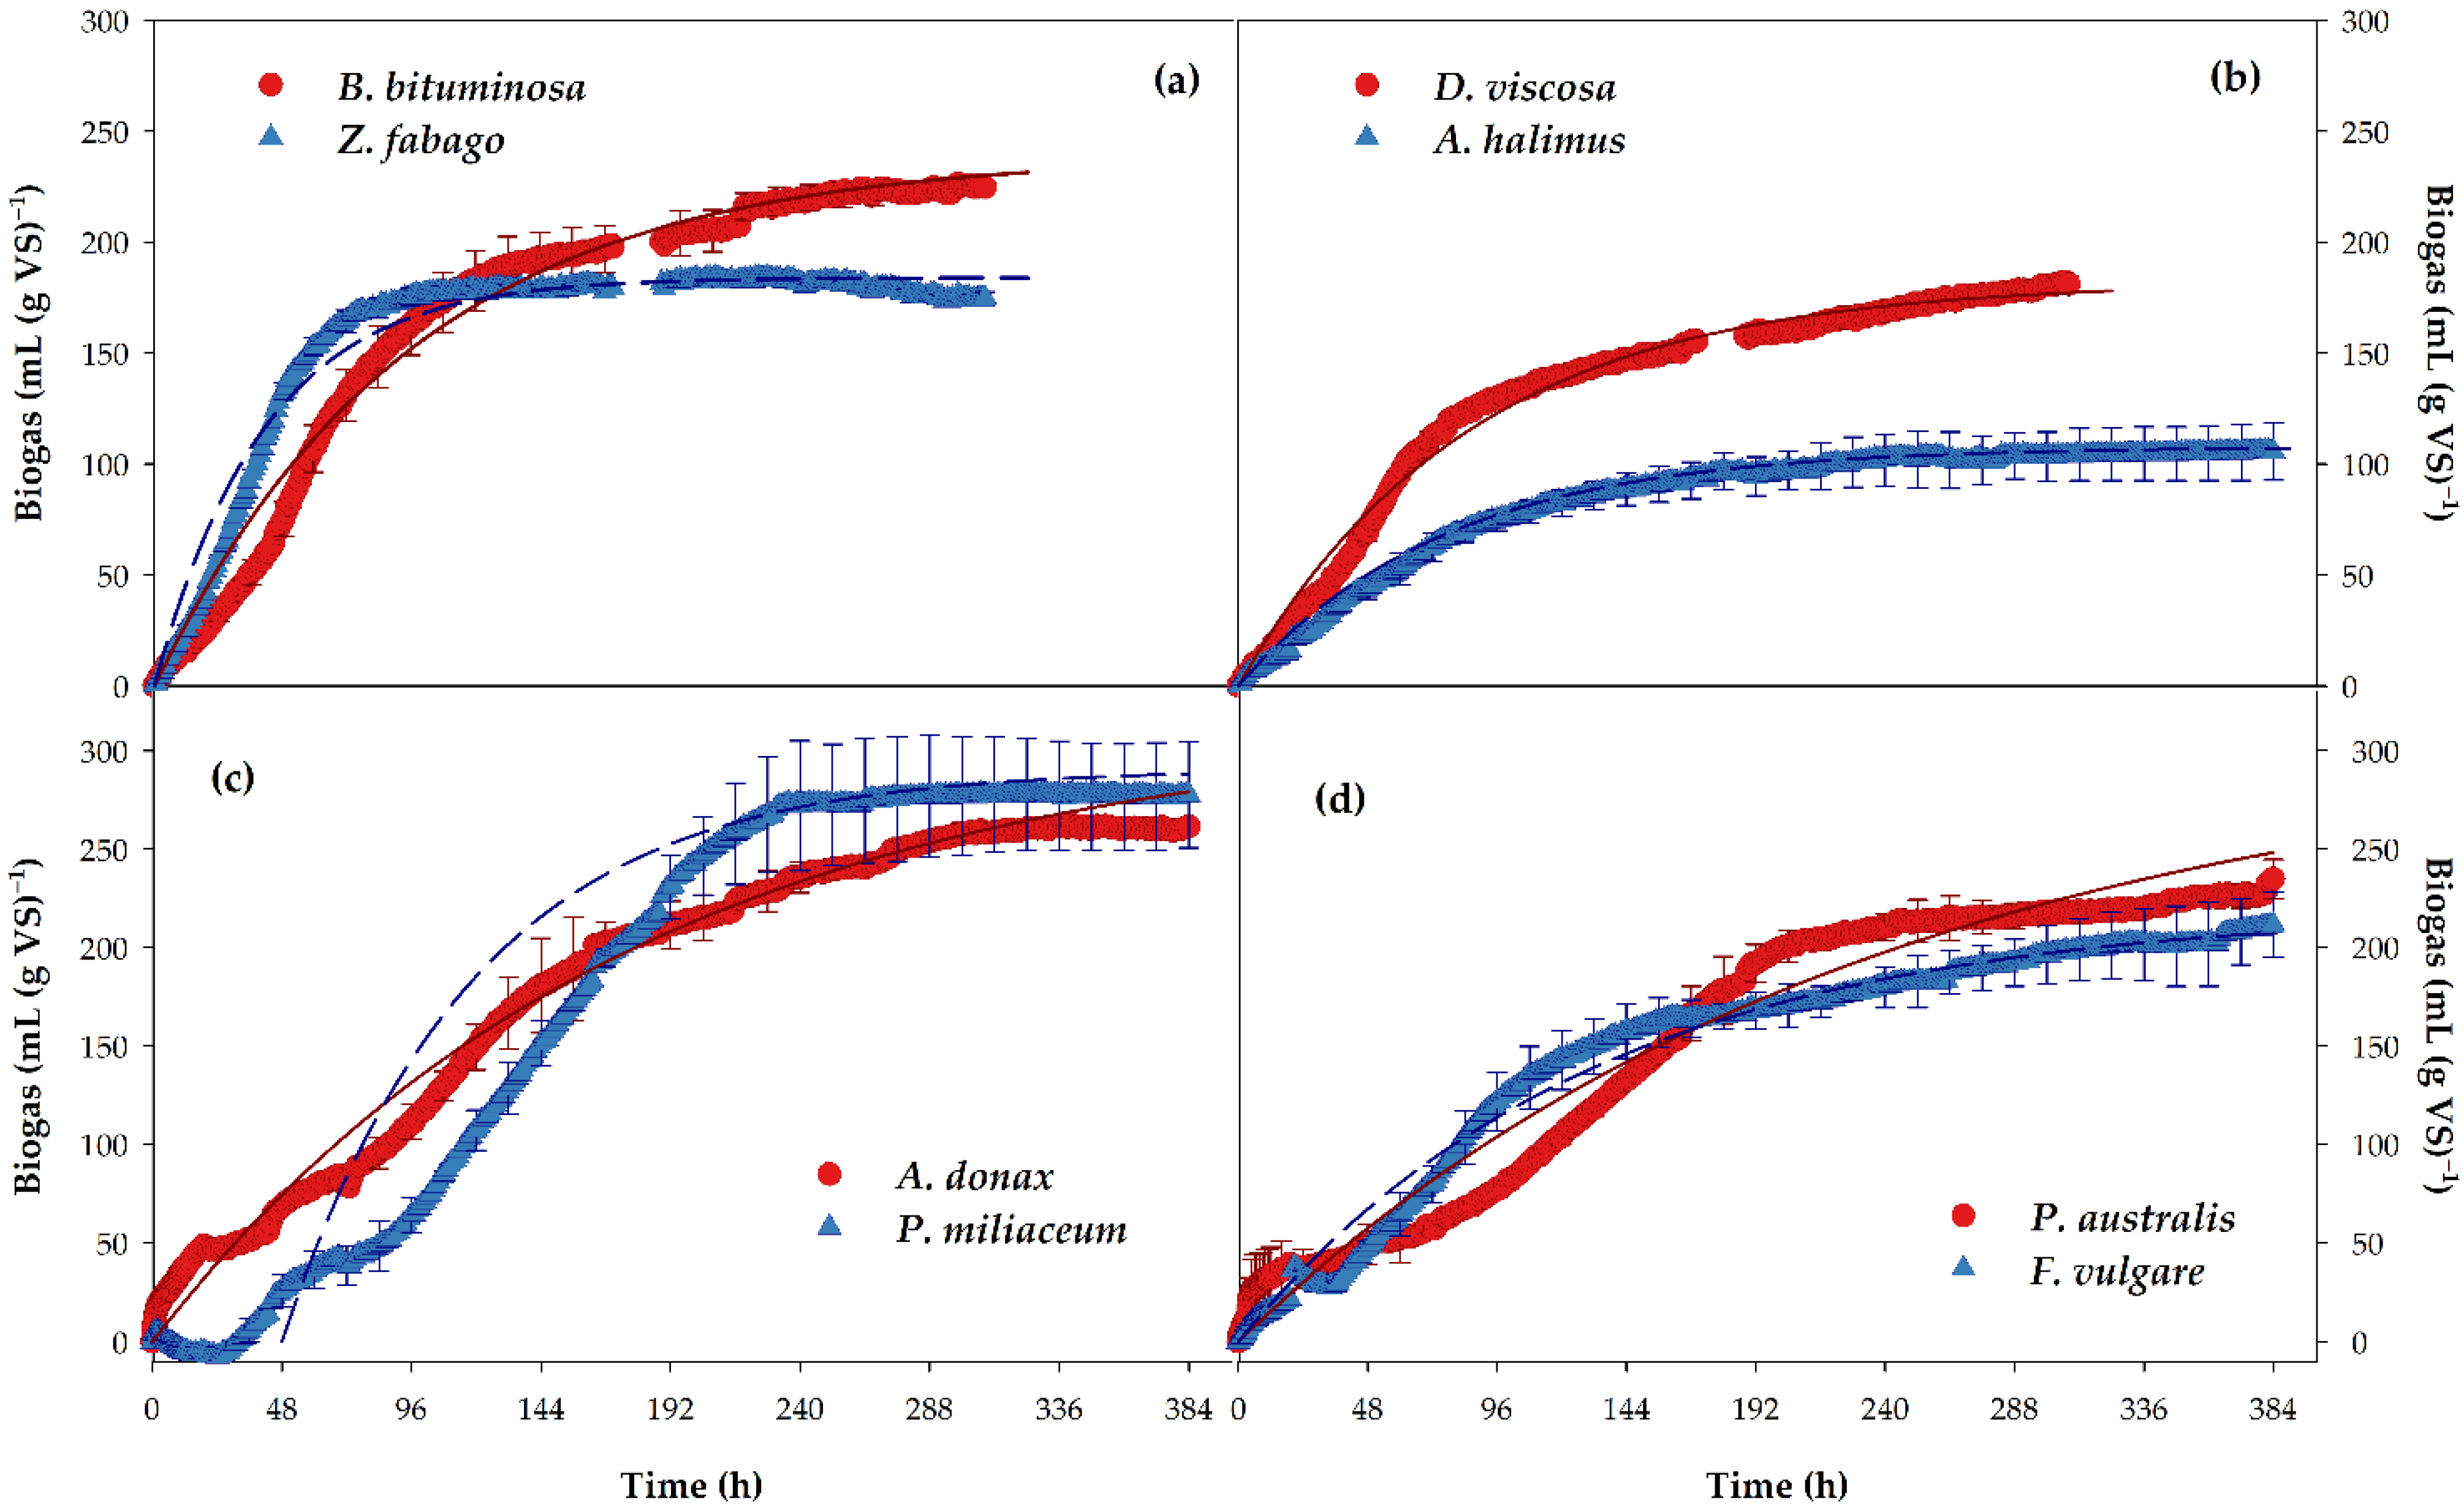
3.2. Anaerobic Digestion

The volume of biogas produced after 16 days of anaerobic digestion (Bm) was lowest for A. halimus, followed by Z. fabago and D. viscosa, without significant differences among the rest of the species (P. miliaceum, A. donax, P. australis, B. bituminosa and F. vulgare; Table 4). In general, the values found were lower than those reported for other energy crops such as sunflower (up to 454 mL g−1 VS) [51]. In addition, a lag-phase was found for P. miliaceum at the beginning of the experiment (Figure 1), indicating an initial difficulty for the microbial degradation. The composition of the plants cannot explain this behavior and, in fact, the Bm value was highest for this species, while similar results (Bm 235–270 mL (g VS)−1) were found by Bernal et al. [20]. So, the initial lag-phase of microbial degradation did not limit the anaerobic process of biogas production.
The results fitted a first-order kinetic model at a high significance level (at p < 0.001 for all samples; data not shown). The values of B0 mirrored those of Bm and followed a very similar order for the different species studied: they were highest for A. donax and P. australis, without significant differences from the values for B. bituminosa, P. miliaceum and F. vulgare, and were lowest for A. halimus (Table 4). Therefore, the anaerobic degradation of the plant biomass was almost complete at the end of the experimental time. The highest value of the rate constant (K) was found for Z. fabago (Table 4), which indicates that the maximum production of biogas was reached earlier for this biomass than for the other plant species, regardless of the total amount of biogas produced. This can be attributed to the lower lignin concentration and C/N ratio of Z. fabago compared to the other species (Table 3 and Table 4), as it has been previously shown that difficulty in the degradation of highly lignocellulosic materials leads to limitations during the hydrolysis phase [20,21]. The values of both Bm and B0 in the studied species were generally lower than those reported for energy crops (per g VS) such as maize (345 mL g−1, whole plant), and also for other herbaceous species, such as nettle (210–420 mL g−1), ryegrass (360 mL g−1) and sunflower (454 mL g−1, whole plant) [51,52,53]. Indeed, only the values of B0 for P. miliaceum and A. donax were close to those found by Bernal et al. [20] for different species from phytoremediation experiments.
The variability in the B0 and BMP values of crops may be due to differences in the lignin content [54,55] and to the physiological state of the plants at the time of the harvest. The biogas yield (and BMP) is decreased in late harvests [52]. Additionally, B0 depends on the contents of total soluble carbohydrates, N and ash and on the ratio of lignin to ADF (acid detergent fiber) [54]. In fact, the high value of B0 in P. miliaceum may be linked to its low lignin concentration and high holocellulose to lignin ratio. The BMP values were high for A. donax, P. australis and P. miliaceum (Table 4), with values close to those found for solid wastes derived from H. annuus oil extraction (between 107 and 227 mL g−1) [56] and for maize, thistle and sorghum silage (267, 308, and 241 mL g−1, respectively) [57], all expressed per g VS. However, the values obtained for the aerial vegetative parts of S. marianum (174 mL g−1) and H. annuus (119 mL g−1) by Hunce et al. [21] are close to the lowest values obtained in this study. Only the BMP values for A. donax, P. australis and P. miliaceum were in the range found by Gunaseelan [58] for Morus indica leaves, fruits and roots (332–461 mL g−1). The values for B. bituminosa, Z. fabago and D. viscosa were close to those of Jatropha curcus leaves (an average of 230 mL g−1), while lower values were obtained for A. halimus biomass. The values for A. donax were higher than those obtained for the same species in a laboratory reactor (130–150 mL g−1) after 50 days at different inoculum ratios [59]. With the exception of A. halimus, the results are comparable to those from well-known energy crops such as Miscanthus and switchgrass (152–212 mL g−1) [59].
The TBMP had values between 497.9 (D. viscosa) and 576.5 mL g−1 (A. halimus), without significant differences among the plant species. These values result in average anaerobic biodegradabilities between 15.1 (A. halimus) and 43.9% (A. donax). Only the values obtained for A. halimus, Z. fabago, D. viscosa and F. vulgare (Table 4) were lower than those found for wood, hedge and wild plants (32.7–44.9%) and for crops [29]. The low degradability found for A. halimus and D. viscosa may be associated with their higher lignin content compared to the other species (22.4 and 27.0%, respectively). It is known that lignin influences the production of biogas in the anaerobic digestion of lignocellulosic substrates such as agricultural crops, due to its low biodegradability associated with its complex structure [60]. Other factors, such as the salt content, may have reduced their anaerobic degradability, especially in A. halimus plants, which had a high Na concentration in their biomass. As with other halophytes, A. halimus accumulates Na+ ions in its tissues for osmotic adjustment, as a tolerance mechanism in response to soil salinity [61]. In our experiment, negative correlations were found between the concentrations of Mg and Na and the BMP and anaerobic biodegradability (for Mg: r = −0.926 and −0.878, both at p < 0.01, respectively; for Na: r = −0.715 and −0.707, at p < 0.05, respectively). Contrastingly, K correlated positively with the P, Ca and Na concentrations in the plants (r = 0.832, 0.809 and 0.800, respectively, all p < 0.05), indicating a faster degradation of the plants with the highest concentrations of these elements.
The concentrations of VS, H and HHV correlated positively with the Bm, B0 and BMP values in the plants (Table 5). However, no significant correlations were found between the anaerobic digestion parameters and the holocellulose, lignin or carbohydrates concentrations in the plants, which indicates that other factors influenced the anaerobic degradation, such as the mineral content (Mg and Na) previously discussed, which also affected the thermal energy released by combustion (HHV).
Although a high lignin concentration in the plants may be indicative of low biodegradability [20,55], the species studied in the present experiment had lignin concentrations within a rather narrow range (17–27%), meaning that this parameter was not significantly related to any of the calorific or biogas parameters determined. Other parameters—such as the VS, Mg and Na concentrations in the plants and the carbohydrates content (for HHV)—seemed to be of greater relevance regarding the potential energetic transformation of the biomass of the different plant species studied.
The results obtained from the correlation tests show that the anaerobic degradation was not influenced by the presence of TEs in the plants (there were no significant correlations between the anaerobic digestion parameters and the TE concentrations in the plants; data not shown). Although Pb accumulation negatively affected the anaerobic degradation of N. glauca biomass (225–231 mg Pb kg−1 dw), and therefore the biogas production [20], the concentration of Pb in the studied plants did not reach levels sufficient to negatively affect the anaerobic degradation of the plant biomass. All microbial processes require nutrients and certain TEs for their development. Some are essential macro- and micronutrients (N, P, S, K, Mg, Na, Ca, Fe, Cr, Co, Cu, Mn, Mo, Ni, Se, V and Zn), which are needed for enzymatic activities and other physiological plant processes [62]. Some TEs have shown positive effects on anaerobic digestion [63]; however, above certain concentrations, they become inhibitory or toxic [64]. Bozym et al. [65] reported the TE concentrations in plants that can be considered toxic for anaerobic digestion: Cd 180, Cu 40, Zn 100 and Pb 30 mg kg−1. The concentrations of TEs determined in the plants were all lower than those values, except for Zn (Table 1). The contribution of certain micronutrients, such as Fe and Mn, could have had positive effects on the growth of almost all types of microorganism in the anaerobic digesters [66].

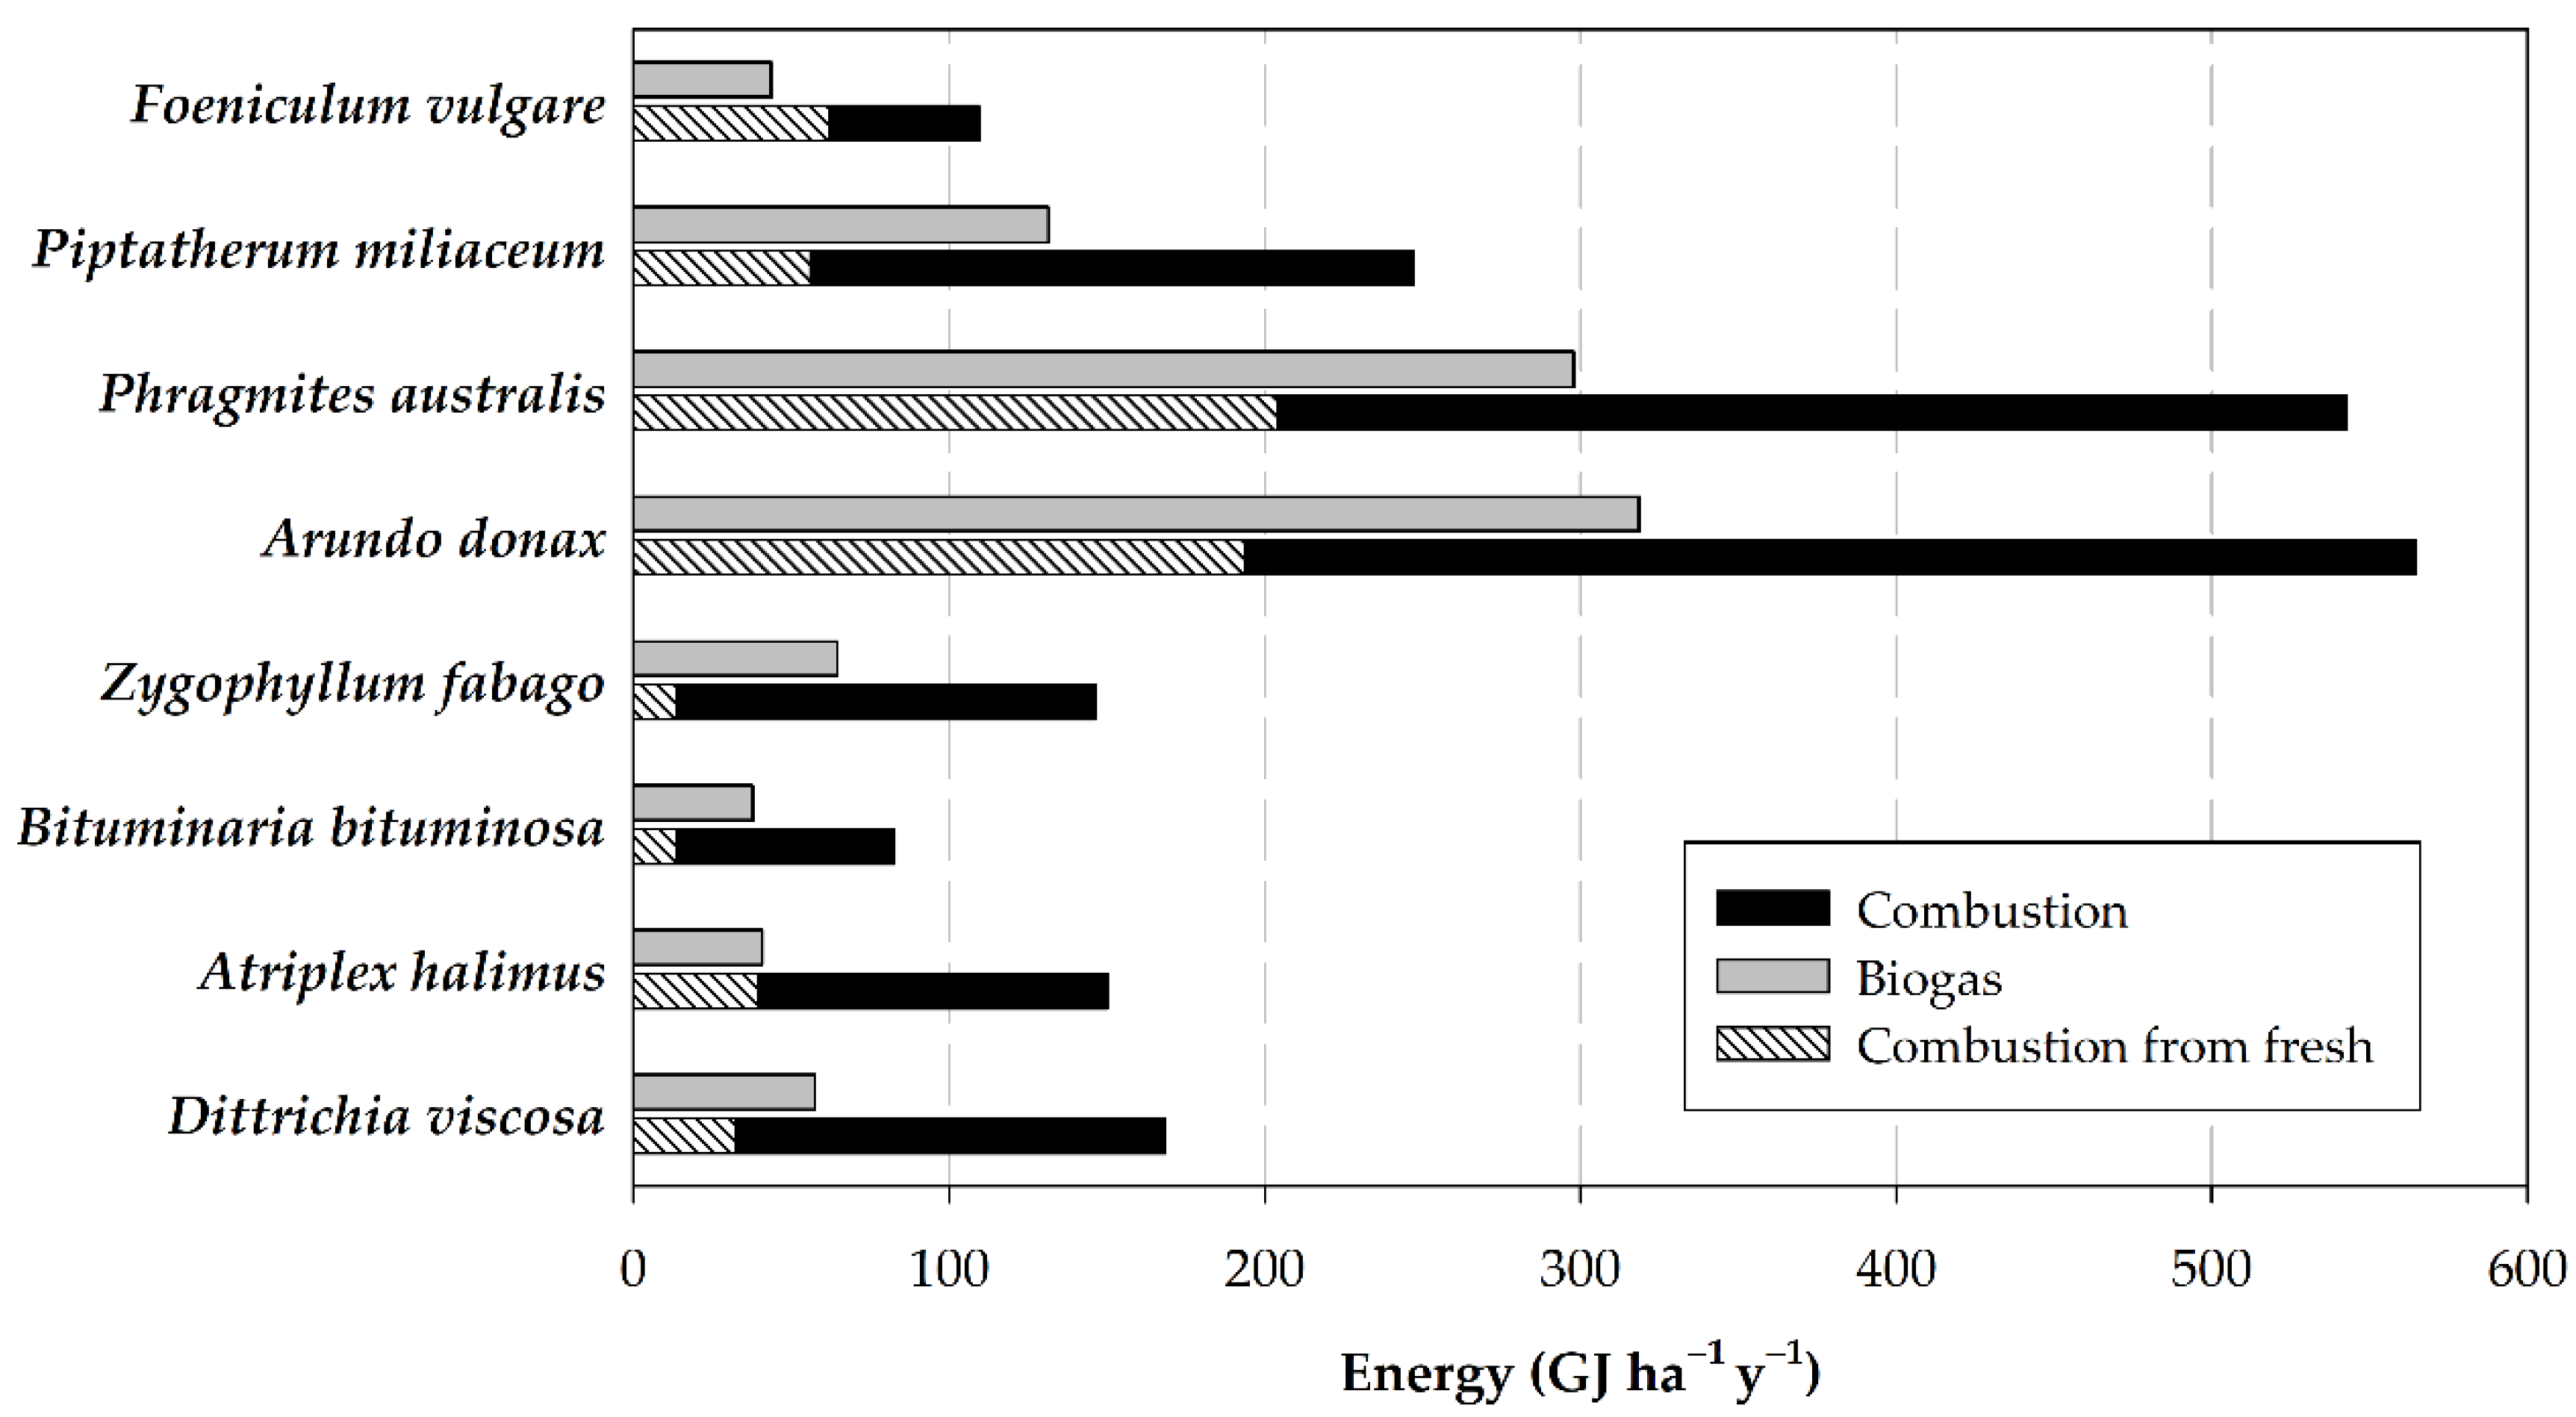
3.3. Potential Energy Yield

The potential for energy production (thermal and biogas) from the biomass of the different plant species collected at the contaminated site was evaluated using the HHV and BMP results (Table 3 and Table 4). The potential thermal energy was calculated from the LHV, which considers the heat of condensation of the water vapor formed (calculated based on the H concentration) in the ultimate analysis (Table 3). The potential energy from anaerobic digestion was calculated from the BMP values and considering an HHV of 39.8 MJ m−3 for pure CH4. The annual yield of the plants depends on the cultivation conditions, but for each plant species under field conditions, the yield data considered were (Mg ha−1 of dry matter): A. halimus 10; B. bituminosa 5; A. donax 33; P. australis 32; P. miliaceum 15 and F. vulgare 6.6 [30,47,67,68,69,70]. Information on the annual yields of D. viscosa and Z. fabago is not available, so an annual biomass production of 10 Mg ha−1 of dry matter, as for A. halimus, was estimated.
In all cases, the potential energy from the combustion of the dry biomass was greater than that from its anaerobic digestion for biogas production (Figure 2). The highest values of the potential energy from biogas could be obtained by the cultivation of the highly productive species P. australis and A. donax, with 298 and 319 GJ ha−1 y−1, respectively, followed by P. miliaceum with less than half that value (131 GJ ha−1 y−1). The rest of the species had much lower values, within a narrow range. The annual biomethane yields of A. donax and P. australis (8005 and 7486 m3 ha−1 y−1, respectively) are similar to the lowest value of 9580 m3 ha−1 y−1 reported by Corno et al. [47], although the values can vary significantly according to the environmental and agronomic conditions [47]. Lower potential energy values for A. donax (113–130 GJ ha−1 y−1) were reported by Yang and Li [59], due to a lower annual yield of the crop and partial degradation of the main components (cellulose, hemicellulose and proteins) during the study.
The potential annual thermal energy yield (combustion) could reach 542 and 564 GJ per hectare with P. australis and A. donax, respectively, due to their high annual biomass yield (Figure 2). The species least suitable for combustion would be B. bituminosa, followed by F. vulgare, while P. miliaceum could have good efficiency for thermal energy production (247 GJ ha−1 y−1). McKendry [11] reviewed the energy yields for certain biomasses, which showed the following order (GJ ha−1): wheat straw 123, switchgrass 139, poplar 173–259, short-rotation coppice willow 187–280 and Miscanthus 222–555 (depending on the annual crop yield). According to these values, P. australis and A. donax could be considered comparable with the well-known high-biomass energy crop Miscanthus. However, D. viscosa, A. halimus and Z. fabago could be compared only with wheat straw and switchgrass, and P. miliaceum with poplar or willow. This is particularly relevant for arid or semiarid areas where the cultivation of poplar and willow, or even Miscanthus, is restricted due to their high water requirement. The low values of B. bituminosa and F. vulgare make them inadequate for energy production by combustion.
However, the energy recovered from combustion depends on the moisture content of the biomass. Here, the maximum energy from combustion was calculated from the lower heating value. However, the plant biomass at harvest in the field needs to be dry for efficient combustion. The moisture content of the biomass at harvest ranged from 38 to 77% in F. vulgare and Z. fabago, respectively. Therefore, if the moisture content of the plant biomass is considered for the calculation of the potential energy (taking into account the heat of condensation of water; dashed bars in Figure 2), then the potential energy recoverable from combustion decreases for all biomasses. In this case, the cultivation of P. australis and A. donax for biogas production would be more energetically efficient than for combustion, and species such as Z. fabago and B. bituminosa could not be considered adequate for combustion. Therefore, the moisture content of the plant biomass at harvest is very relevant for energetic and economic balances [11].
The drying of the biomass before combustion may imply an excessive cost that may make the process economically unviable. Therefore, special attention should be paid to the time of harvest; preferably, it should be at plant senescence, when the tissues are drying out, for biomass combustion, but fresh biomass can be used for biogas production through anaerobic digestion.

4. Conclusions

The concentrations of TEs in the plants from former mining sites did not affect biogas production, or the production of thermal energy according to the higher heating values. In particular, the species P. miliaceum, P. australis and A. donax have the most potential for the production of biogas. Contrastingly, D. viscosa and A. halimus have characteristics more adequate for direct combustion, due to their low ash and higher lignin concentrations, than for anaerobic digestion. However, the presence of elevated alkaline metal concentrations in their biomass may limit the usefulness of A. halimus and Z. fabago for combustion, restricting their use as bioenergy crops to non-saline sites.
The BMP values indicate that these species could be used as energy crops in arid or semiarid areas with results comparable with those of well-known energy crops such as Miscanthus, switchgrass, maize, milk thistle and sorghum silage. The highly productive P. australis and A. donax, with about 300 GJ ha−1 y−1, were the species with the highest potential annual energy production from biogas, followed by P. miliaceum.
In terms of combustion, P. australis and A. donax were the most efficient regarding the annual energy yield, followed by P. miliaceum; B. bituminosa and F. vulgare were the species least suitable for combustion. However, the moisture content of the plant biomass at harvest was shown to be a key factor for an efficient energetic balance, and the time of harvest needs to be optimized in order to control the moisture status of the biomass.
Therefore, among the species tested, A. donax, P. australis and P. miliaceum can be considered those most suitable for use as energy crops in the phytomanagement of TE-contaminated soils under Mediterranean conditions. However, other factors—such as the invasive character of A. donax and P. australis—should be taken into account when designing the corresponding remediation program. Considering all these aspects, P. miliaceum can be proposed as the most promising plant species for bioenergy production in soil phytostabilization.

Supplementary Materials

The following are available online at https://0-www-mdpi-com.brum.beds.ac.uk/article/10.3390/agronomy11091750/s1, Table S1: Macronutrient and sodium concentrations in the plants used in the experiment, Table S2: Pearson’s coefficients for the correlations between the concentrations of the different TEs in the plants.

Author Contributions

Conceptualization, M.P.B. and R.C.; methodology, M.P.B. and R.C.; formal analysis, D.G., R.C. and M.P.B.; investigation, D.G., R.C. and M.P.B.; data curation, R.C. and M.P.B.; writing—original draft preparation, D.G., and M.P.B.; writing—review and editing, R.C. and M.P.B.; supervision, R.C. and M.P.B.; funding acquisition, R.C. and M.P.B. All authors have read and agreed to the published version of the manuscript.

Funding

This research was funded by the Spanish Ministerio de Ciencia e Innovación (MCI), the Spanish Agencia Estatal de Investigación (AEI) and the European Regional Development Fund (FEDER) through the project RTI2018-100819-BI00.

Institutional Review Board Statement

Not applicable.

Informed Consent Statement

Not applicable.

Data Availability Statement

The data presented in this study are available on request from the corresponding author.

Acknowledgments

The authors would like to thank David J. Walker for the English revision of the manuscript.

Conflicts of Interest

The authors declare no conflict of interest. The funders had no role in the design of the study; in the collection, analyses, or interpretation of data; in the writing of the manuscript, or in the decision to publish the results.

References

  1. Rodríguez-Eugenio, N.; McLaughlin, M.; Pennock, D. Soil Pollution: A Hidden Reality; FAO: Rome, Italy, 2018. [Google Scholar]
  2. Conesa, H.M.; Schulin, R. The Cartagena–La Unión mining district (SE spain): A review of environmental problems and emerging phytoremediation solutions after fifteen years research. J. Environ. Monit. 2010, 12, 1225–1233. [Google Scholar] [CrossRef]
  3. Conesa Alcaraz, H.M.; Faz Cano, A. Metal uptake by naturally occurring vegetation in a metal polluted salt marsh in southeast Spain. In Land Degradation and Rehabilitation; Faz-Cano, A., Mermut, A.R., Arocena, J.M., Ortiz, R., Eds.; Catena Verlag: Stuttgart, Germany, 2009; Volume 40, pp. 287–294. [Google Scholar]
  4. Mendez, M.O.; Maier, R.M. Phytostabilization of Mine Tailings in Arid and Semiarid Environments—An Emerging Remediation Technology. Environ. Health Perspect. 2008, 116, 278–283. [Google Scholar] [CrossRef] [Green Version]
  5. Conesa, H.M.; Schulin, R.; Nowack, B. Mining landscape: A cultural tourist opportunity or an environmental problem: The study case of the Cartagena–La Unión Mining District (SE Spain). Ecol. Econ. 2008, 64, 690–700. [Google Scholar] [CrossRef]
  6. Pardo, T.; Clemente, R.; Epelde, L.; Garbisu, C.; Bernal, M.P. Evaluation of the phytostabilisation efficiency in a trace elements contaminated soil using soil health indicators. J. Hazard. Mater. 2014, 268, 68–76. [Google Scholar] [CrossRef]
  7. Gomes, H.I. Phytoremediation for bioenergy: Challenges and opportunities. Environ. Technol. Rev. 2012, 1, 59–66. [Google Scholar] [CrossRef]
  8. Robinson, B.; Bañuelos, G.; Conesa, H.M.; Evangelou, M.W.H.; Schulin, R. The Phytomanagement of Trace Elements in Soil. Crit. Rev. Plant Sci. 2009, 28, 240–266. [Google Scholar] [CrossRef]
  9. Pandey, V.C.; Bajpai, O.; Singh, N. Energy crops in sustainable phytoremediation. Renew. Sustain. Energy Rev. 2016, 54, 58–73. [Google Scholar] [CrossRef]
  10. Cundy, A.; Bardos, R.; Puschenreiter, M.; Mench, M.; Bert, V.; Friesl-Hanl, W.; Müller, I.; Li, X.; Weyens, N.; Witters, N.; et al. Brownfields to green fields: Realising wider benefits from practical contaminant phytomanagement strategies. J. Environ. Manag. 2016, 184, 67–77. [Google Scholar] [CrossRef] [PubMed] [Green Version]
  11. McKendry, P. Energy production from biomass (part 1): Overview of biomass. Bioresour. Technol. 2002, 83, 37–46. [Google Scholar] [CrossRef]
  12. Rowe, R.; Street, N.; Taylor, G. Identifying potential environmental impacts of large-scale deployment of dedicated bioenergy crops in the UK. Renew. Sustain. Energy Rev. 2009, 13, 271–290. [Google Scholar] [CrossRef]
  13. Naik, S.; Goud, V.V.; Rout, P.K.; Dalai, A.K. Production of first and second generation biofuels: A comprehensive review. Renew. Sustain. Energy Rev. 2010, 14, 578–597. [Google Scholar] [CrossRef]
  14. Grippi, D.; Clemente, R.; Bernal, M.P. Chemical and Bioenergetic Characterization of Biofuels from Plant Biomass: Perspectives for Southern Europe. Appl. Sci. 2020, 10, 3571. [Google Scholar] [CrossRef]
  15. Saxena, R.; Adhikari, D.; Goyal, H. Biomass-based energy fuel through biochemical routes: A review. Renew. Sustain. Energy Rev. 2009, 13, 167–178. [Google Scholar] [CrossRef]
  16. Feliu Jofre, A.; Flotats Ripoll, X. Renewable Gases. An Emerging Energy Vector. Naturgy Foundation. 2020. Available online: http://www.fundacionnaturgy.org (accessed on 15 June 2021).
  17. Thijs, S.; Witters, N.; Janssen, J.; Ruttens, A.; Weyens, N.; Herzig, R.; Mench, M.; Van Slycken, S.; Meers, E.; Meiresonne, L.; et al. Tobacco, Sunflower and High Biomass SRC Clones Show Potential for Trace Metal Phytoextraction on a Moderately Contaminated Field Site in Belgium. Front. Plant Sci. 2018, 9, 1879. [Google Scholar] [CrossRef] [PubMed]
  18. Domínguez, M.T.; Madejón, P.; Madejón, E.; Diaz, M.J. Novel energy crops for Mediterranean contaminated lands: Valorization of Dittrichia viscosa and Silybum marianum biomass by pyrolysis. Chemosphere 2017, 186, 968–976. [Google Scholar] [CrossRef] [PubMed]
  19. Domínguez, M.T.; Montiel-Rozas, M.M.; Madejón, P.; Diaz, M.J.; Madejon, E. The potential of native species as bioenergy crops on trace-element contaminated Mediterranean lands. Sci. Total Environ. 2017, 590–591, 29–39. [Google Scholar] [CrossRef] [Green Version]
  20. Bernal, M.P.; Gómez, X.; Chang, R.; Arco-Lázaro, E.; Clemente, R. Strategies for the use of plant biomass obtained in the phytostabilisation of trace-element-contaminated soils. Biomass Bioenergy 2019, 126, 220–230. [Google Scholar] [CrossRef]
  21. Hunce, S.Y.; Clemente, R.; Bernal, M.P. Energy production potential of phytoremediation plant biomass: Helianthus annuus and Silybum marianum. Ind. Crop. Prod. 2019, 135, 206–216. [Google Scholar] [CrossRef]
  22. Álvarez-Robles, M.J.; Bernal, M.P.; Clemente, R. Differential response of Oryza sativa L. and Phragmites australis L. plants in trace elements contaminated soils under flooded and unflooded conditions. Environ. Geochem. Health 2021, 1–17. [Google Scholar] [CrossRef]
  23. EPA. Method 1684. Total, Fixed and Volatile Solids in Water, Solids, and Biosolids; US Environmental Protection Agency: Washington, DC, USA, 2001. Available online: https://nepis.epa.gov/Exe/ZyPDF.cgi/P1002CZ8.PDF?Dockey=P1002CZ8.PDF (accessed on 27 August 2021).
  24. ANSI and ASTM D 1106. Standard Test Method for Lignin Wood; American National Standard Institute: Washington, DC, USA, 1977.
  25. ANSI and ASTM D 1103-60. Standard Test Method for Alpha-Cellulose in Wood; American National Standard Institute: Washington DC, USA, 1977.
  26. Hedge, J.E.; Hofreiter, B.T. Estimation of carbohydrate. In Carbohydrate Chemistry; Whistler, R.L., BeMiller, J.N., Eds.; Academic Press: Cambridge, MA, USA, 1962; pp. 17–22. [Google Scholar]
  27. Sheng, C.; Azevedo, J. Estimating the higher heating value of biomass fuels from basic analysis data. Biomass Bioenergy 2005, 28, 499–507. [Google Scholar] [CrossRef]
  28. Hansen, T.L.; Schmidt, J.E.; Angelidaki, I.; Marca, E.; Jansen, J.L.C.; Mosbæk, H.; Christensen, T.H. Method for determination of methane potentials of solid organic waste. Waste Manag. 2004, 24, 393–400. [Google Scholar] [CrossRef]
  29. Triolo, J.M.; Pedersen, L.; Qu, H.; Sommer, S.G. Biochemical methane potential and anaerobic biodegradability of non-herbaceous and herbaceous phytomass in biogas production. Bioresour. Technol. 2012, 125, 226–232. [Google Scholar] [CrossRef] [PubMed]
  30. Walker, D.; Lutts, S.; Sanchez-Garcia, M.; Correal, E. Atriplex halimus L.: Its biology and uses. J. Arid Environ. 2014, 100–101, 111–121. [Google Scholar] [CrossRef]
  31. Kabata-Pendias, A. Trace Elements in Soils and Plants, 3th ed.; CRC Press: Boca Raton, FL, USA, 2011. [Google Scholar]
  32. Martínez-Fernández, D.; Arco-Lázaro, E.; Bernal, M.P.; Clemente, R. Comparison of compost and humic fertiliser effects on growth and trace elements accumulation of native plant species in a mine soil phytorestoration experiment. Ecol. Eng. 2014, 73, 588–597. [Google Scholar] [CrossRef]
  33. Barbafieri, M.; Dadea, C.; Tassi, E.; Bretzel, F.; Fanfani, L. Uptake of Heavy Metals by Native Species Growing in a Mining Area in Sardinia, Italy: Discovering Native Flora for Phytoremediation. Int. J. Phytoremediat. 2011, 13, 985–997. [Google Scholar] [CrossRef]
  34. Marchiol, L.; Fellet, G.; Boscutti, F.; Montella, C.; Mozzi, R.; Guarino, C. Gentle remediation at the former “Pertusola Sud” zinc smelter: Evaluation of native species for phytoremediation purposes. Ecol. Eng. 2013, 53, 343–353. [Google Scholar] [CrossRef]
  35. Melendo, M.; Benítez, E.; Nogales, R. Assessment of the feasibility of endogeneous Mediterranean species for phytoremedia-tion of Pb-contaminated areas. Fresenius Environ. Bull. 2002, 11, 1105–1109. [Google Scholar]
  36. Baroni, F.; Boscagli, A.; Di Lella, L.; Protano, G.; Riccobono, F. Arsenic in soil and vegetation of contaminated areas in southern Tuscany (Italy). J. Geochem. Explor. 2004, 81, 1–14. [Google Scholar] [CrossRef]
  37. Parraga-Aguado, I.; González-Alcaraz, M.N.; Schulin, R.; Conesa, H.M. The potential use of Piptatherum miliaceum for the phytomanagement of mine tailings in semiarid areas: Role of soil fertility and plant competition. J. Environ. Manag. 2015, 158, 74–84. [Google Scholar] [CrossRef]
  38. Arco-Lázaro, E.; Martínez-Fernández, D.; Bernal, M.P.; Clemente, R. Response of Piptatherum miliaceum to co-culture with a legume species for the phytostabilisation of trace elements contaminated soils. J. Soils Sediments 2015, 17, 1349–1357. [Google Scholar] [CrossRef]
  39. Clemente, R.; Arco-Lázaro, E.; Pardo, T.; Martín, I.; Sánchez-Guerrero, A.; Sevilla, F.; Bernal, M. Combination of soil organic and inorganic amendments helps plants overcome trace element induced oxidative stress and allows phytostabilisation. Chemosphere 2019, 223, 223–231. [Google Scholar] [CrossRef] [PubMed]
  40. Kabas, S.; Faz, A.; Acosta, J.; Zornoza, R.; Martínez-Martínez, S.; Carmona, D.; Bech, J. Effect of marble waste and pig slurry on the growth of native vegetation and heavy metal mobility in a mine tailing pond. J. Geochem. Explor. 2012, 123, 69–76. [Google Scholar] [CrossRef]
  41. Pardo, T.; Bernal, M.P.; Clemente, R. Phytostabilisation of severely contaminated mine tailings using halophytes and field addition of organic and inorganic amendments. Chemosphere 2017, 178, 556–564. [Google Scholar] [CrossRef]
  42. Párraga-Aguado, I.; González-Alcaraz, M.N.; López-Orenes, A.; Ferrer-Ayala, M.; Conesa, H. Evaluation of the environmental plasticity in the xerohalophyte Zygophyllum fabago L. for the phytomanagement of mine tailings in semiarid areas. Chemosphere 2016, 161, 259–265. [Google Scholar] [CrossRef]
  43. Pardo, T.; Bes, C.; Bernal, M.P.; Clemente, R.; Bernal, M.P. Alleviation of environmental risks associated with severely contaminated mine tailings using amendments: Modeling of trace element speciation, solubility, and plant accumulation. Environ. Toxicol. Chem. 2016, 35, 2874–2884. [Google Scholar] [CrossRef] [PubMed]
  44. Cosentino, S.L.; Sanzone, E.; Bellomia, L.; Sortino, O.; Belligno, A. Chemical composition and energetic value of perennial ligno-cellulosic species (Miscantus x Giganteus Greef and Deu. and Arundo donax L.) grown in Mediterranean region. In Proceedings of the 15th European Biomass Conference & Exhibition, Berlin, Germany, 7–11 May 2007; pp. 820–823. [Google Scholar]
  45. Palumbo, A.; Mastro, G. Produzione di “bioetanolo di seconda generazione” dal cardo (Cynara cardunculus L. var. altilis DC.). In Proceedings of the SIA—Società Italiana di Agronomia, XLIII Convegno Nazionale, Pisa, Italy, 17–19 September 2014. [Google Scholar]
  46. Pimentel, L.D.; Batista, V.A.P.; de Barros, A.F.; Teófilo, R.F.; dos Santos Dias, L.A. Caracterização química e bioenergética de grupos agronômicos de sorgo. Pesqui. Agropecuária Trop. 2017, 47, 424–431. [Google Scholar] [CrossRef]
  47. Corno, L.; Pilu, S.R.; Adani, F. Arundo donax L.: A non-food crop for bioenergy and bio-compound production. Biotechnol. Adv. 2014, 32, 1535–1549. [Google Scholar] [CrossRef]
  48. Cencič, V.; Jodice, R.; Migliardi, D.; Picco, D.; Pin, M.; Tomasinsig, E.; Zanotto, G.; Radu, R.; Taccani, R.; Chindaruska, S.; et al. I Biocarburanti. Le Filiere Produttive, le Tecnologie, i Vantaggi Ambientalie le Prospettive di Diffusione; Area Science Park: Padriciano, Italy, 2007; Volume 27, pp. 26–158. [Google Scholar]
  49. Boundy, B.; Diegel, S.W.; Wright, L.; Davis, S.C. Biomass Energy Data Book, 4th ed.; Oak Ridge National Laboratory: Oak Ridge, TN, USA, 2011; Available online: http://ledsgp.org/wp-content/uploads/2015/10/bio-mass-energy-data-book.pdf (accessed on 15 June 2021).
  50. Saidur, R.; Abdelaziz, E.; Demirbas, A.; Hossain, M.; Mekhilef, S. A review on biomass as a fuel for boilers. Renew. Sustain. Energy Rev. 2011, 15, 2262–2289. [Google Scholar] [CrossRef]
  51. Amon, T.; Amon, B.; Kryvoruchko, V.; Machmüller, A.; Hopfner-Sixt, K.; Bodiroza, V.; Hrbek, R.; Friedel, J.; Pötsch, E.; Wagentristl, H.; et al. Methane production through anaerobic digestion of various energy crops grown in sustainable crop rotations. Bioresour. Technol. 2007, 98, 3204–3212. [Google Scholar] [CrossRef] [PubMed]
  52. Braun, R. Anaerobic digestion: A multi-faceted process for energy, environmental management and rural development. In Improvement of Crop Plants for Industrial End Users; Ranalli, P., Ed.; Springer: Dordrecht, The Netherlands, 2007; pp. 335–416. [Google Scholar]
  53. Raposo, F.; DE LA Rubia, M.A.; Fernández-Cegrí, V.; Borja, R. Anaerobic digestion of solid organic substrates in batch mode: An overview relating to methane yields and experimental procedures. Renew. Sustain. Energy Rev. 2012, 16, 861–877. [Google Scholar] [CrossRef]
  54. Gunaseelan, V.N. Regression models of ultimate methane yields of fruits and vegetable solid wastes, sorghum and napiergrass on chemical composition. Bioresour. Technol. 2007, 98, 1270–1277. [Google Scholar] [CrossRef]
  55. Nizami, A.-S.; Korres, N.E.; Murphy, J.D. Review of the Integrated Process for the Production of Grass Biomethane. Environ. Sci. Technol. 2009, 43, 8496–8508. [Google Scholar] [CrossRef] [PubMed]
  56. Raposo, F.; Borja, R.; Rincon, B.; Jiménez-Rodríguez, A.-M. Assessment of process control parameters in the biochemical methane potential of sunflower oil cake. Biomass Bioenergy 2008, 32, 1235–1244. [Google Scholar] [CrossRef]
  57. Kalamaras, S.; Kotsopoulos, T. Anaerobic co-digestion of cattle manure and alternative crops for the substitution of maize in South Europe. Bioresour. Technol. 2014, 172, 68–75. [Google Scholar] [CrossRef]
  58. Gunaseelan, V.N. Predicting ultimate methane yields of Jatropha curcus and Morus indica from their chemical composition. Bioresour. Technol. 2009, 100, 3426–3429. [Google Scholar] [CrossRef]
  59. Yang, L.; Li, Y. Anaerobic digestion of giant reed for methane production. Bioresour. Technol. 2014, 171, 233–239. [Google Scholar] [CrossRef]
  60. Buffiere, P.; Loisel, D.; Bernet, N.; Delgenes, J.-P. Towards new indicators for the prediction of solid waste anaerobic digestion properties. Water Sci. Technol. 2006, 53, 233–241. [Google Scholar] [CrossRef] [Green Version]
  61. Walker, D.J.; Lutts, S. The tolerance of Atriplex halimus L. to environmental stresses. Emir. J. Food Agric. 2014, 26, 1081. [Google Scholar] [CrossRef] [Green Version]
  62. Kida, K.; Shigematsu, T.; Kijima, J.; Numaguchi, M.; Mochinaga, Y.; Abe, N.; Morimura, S. Influence of Ni2+ and Co2+ on Methanogenic Activity and the Amounts of Coenzymes Involved in Methanogenesis. J. Biosci. Bioeng. 2001, 91, 590–595. [Google Scholar] [CrossRef]
  63. Demirel, B.; Scherer, P. Trace element requirements of agricultural biogas digesters during biological conversion of renewable biomass to methane. Biomass Bioenergy 2011, 35, 992–998. [Google Scholar] [CrossRef]
  64. Zhang, Y.; Zhang, Z.; Suzuki, K.; Maekawa, T. Uptake and mass balance of trace metals for methane producing bacteria. Biomass Bioenergy 2003, 25, 427–433. [Google Scholar] [CrossRef]
  65. Bożym, M.; Florczak, I.; Zdanowska-Skowrońska, P.; Wojdalski, J.; Klimkiewicz, M. An analysis of metal concentrations in food wastes for biogas production. Renew. Energy 2015, 77, 467–472. [Google Scholar] [CrossRef]
  66. Mudhoo, A.; Kumar, S. Effects of heavy metals as stress factors on anaerobic digestion processes and biogas production from biomass. Int. J. Environ. Sci. Technol. 2013, 10, 1383–1398. [Google Scholar] [CrossRef] [Green Version]
  67. Zhao, Y.; Xia, X.; Yang, Z. Growth and nutrient accumulation of Phragmites australis in relation to water level variation and nutrient loadings in a shallow lake. J. Environ. Sci. 2013, 25, 16–25. [Google Scholar] [CrossRef]
  68. Suriyagoda, L.D.B.; Real, D.; Renton, M.; Lambers, H.; Ryan, M.H. Establishment, survival, and herbage production of novel, summer-active perennial pasture legumes in the low-rainfall cropping zone of Western Australia as affected by plant density and cutting frequency. Crop. Pasture Sci. 2013, 64, 71–85. [Google Scholar] [CrossRef]
  69. Cucci, G.; LaColla, G.; Boari, F.; Cantore, V. Yield response of fennel (Foeniculum vulgareMill.) to irrigation with saline water. Acta Agric. Scand. Sect. B Plant Soil Sci. 2014, 64, 129–134. [Google Scholar] [CrossRef]
  70. Serra Riera, J. Producció de Biomassa de Diferents Genotips de Gramínies Perennes Mediterrànies per a Producció de Biocom-Bustibles de Segona Generació, Honor Project; University of Balearic Islands: Palma, Spain, 2018; Available online: https://dspace.uib.es/xmlui/bitstream/handle/11201/151639/Memoria_EPSU1168.pdf?sequence=1 (accessed on 16 June 2021).
Figure 1. Biogas production from the plants (Bituminaria bituminosa and Zygophyllum fabago (a), Dittrichia viscosa and Atriplex halimus (b), Arundo donax and Piptatherum miliaceum (c) and Phragmites australis and Foeniculum vulgare (d)) under anaerobic conditions. The symbols represent the experimental data and the lines signify the degradation predicted by a first-order kinetic model for each sample (n = 2).
Agronomy 11 01750 g001
Figure 2. Potential energy production per hectare of land of the different plant species, by combustion (according to LHV) and by biogas production through anaerobic digestion. Comparison of the energy generated by combustion from the dry biomass (solid) and from the fresh biomass (dashed).
Agronomy 11 01750 g002
Table 1. Trace element concentrations (mg kg−1) in the aerial part of the plants used in the experiment (average ± se; n = 2).
PlantsAlAsCdCuFeMnPbZn
D. viscosa563.4 ± 47.0 a5.6 ± 0.08 a8.0 ± 0.31 a13.70 ± 0.12 b1099.4 ± 29.3 a70.9 ± 0.2 c108.5 ± 3.4 a347.5 ± 2.9 b
A. halimus76.4 ± 4.7 d0.7 ± 0.15 c2.8 ± 0.03 d5.81 ± 0.17 e106.1 ± 6.1 fg73.5 ± 0.9 c11.1 ± 0.8 e254.9 ± 6.1 c
B. bituminosa200.0 ± 1.5 c1.4 ± 0.10 bc2.2 ± 0.07 d7.46 ± 0.05 d282.4 ± 4.1 d70.6 ± 2.0 c45.4 ± 1.7 c197.7 ± 3.1 d
Z. fabago88.6 ± 14.6 d1.9 ± 0.26 b0.5 ± 0.1 e8.00 ± 0.18 d101.6 ± 1.4 g52.5 ± 0.1 e5.1 ± 0.3 g158.2 ± 1.4 e
A. donax364.2 ± 6.9 b0.6 ± 0.12 c4.1 ± 0.06 c11.19 ± 0.21 c230.3 ± 4.0 e84.2 ± 1.4 b17.8 ± 0.7 d314.8 ± 3.8 b
P. australis336.9 ± 4.2 b3.0 ± 0.27 ab5.7 ± 0.16 b17.74 ± 0.24 a446.2 ± 9.9 c241.4 ± 0.4 a77.1 ± 3.4 b646.0 ± 19.3 a
P. miliaceum571.7 ± 22.5 a2.1 ± 0.74 b5.4 ± 0.05 b14.46 ± 0.27 b670.0 ± 8.2 b59.2 ± 0.5 d94.1 ± 1.9 ab276.8 ± 1.7 c
F. vulgare95.7 ± 3. 8 cd1.3 ± 0.03 bc0.56 ± 0.02 e5.56 ± 0.1 e121.2 ± 3.0 f34.4 ± 0.4 f8.3 ± 0.3 f76.3 ± 2.5 f
ANOVA************************
***: significant at p < 0.001. Values followed by the same letter in each column do not differ significantly according to Tukey’s test at p < 0.05.
Table 2. Chemical composition of the plants used in the experiments (average values ± se, n = 2).
PlantsAsh (%)VS (%)Lignin (%)Holocellulose (%)Soluble Carbohydrates (g kg−1 dw)
D. viscosa7.03 ± 0.02 c90.82 ± 0.16 b26.96 ± 0.72 a50.94 ± 7.21 bc54.85 ± 2.95 bc
A. halimus14.25 ± 0.14 b84.14 ± 0.05 c22.40 ± 0.23 b62.11 ± 5.73 abc12.40 ± 0.40 f
B. bituminosa5.31 ± 0.06 c93.19 ± 0.02 a20.09 ± 0.45 bc65.19 ± 0.57 abc26.5 ± 0.80 ef
Z. fabago16.28 ± 0.31 a80.57 ± 0.57 d17.08 ± 0.92 c48.58 ± 6.07 c35.15 ± 0.95 de
A. donax6.26 ± 0.19 c93.74 ± 0.19 a20.92 ± 1.67 bc68.23 ± 0.59 abc83.85 ± 3.15 a
P. australis6.81 ± 0.45 c93.19 ± 0.45 a20.87 ± 0.55 bc72.32 ± 056 a49.5 ± 0.01 cd
P. miliaceum7.09 ± 0.61 c92.92 ± 0.60 a18.42 ± 0.33 bc72.42 ± 0.65 a44.15 ± 3.05 cde
F. vulgare6.92 ± 0.33 c93.08 ± 0.33 a19.59 ± 0.33 bc70.98 ± 0.38 ab69.35 ± 7.35 ab
ANOVA*************
** and ***: significant at p < 0.01 and 0.001, respectively. Values followed by the same letter in each column do not differ significantly according to Tukey’s test at p < 0.05.
Table 3. Elemental analysis, higher heating value (HHV), lower heating value (LHV) and C/N ratio of the plants (average values ± se; n = 2).
PlantsC (%)N (%)S (%)H (%)O (%)HHV (MJ kg−1)LHV (MJ kg−1)C/N
D. viscosa46.24 ± 0.09 a0.57 ± 0.01 e0.10 ± 0.02 d5.12 ± 0.08 d38.78 ±0.03 c17.96 ± 0.03 c16.83 ± 0.01 b80.85 ± 1.44 a
A. halimus41.33 ± 0.01 e1.21 ± 0.00 b0.14 ± 0.02 cd4.66 ± 0.07 e36.81 ± 0.12 d16.03 ± 0.04 e15.01 ± 0.04 d34.27 ± 0.07 d
B. bituminosa45.01 ± 0.09 b1.48 ± 0.01 ab0.07 ± 0.01 d5.07 ± 0.02 d41.57 ± 0.14 b17.62 ± 0.04 d16.51 ± 0.05 c30.49 ± 0.26 d
Z. fabago40.33 ± 0.02 f1.99 ± 0.08 a0.52 ± 0.07 a4.75 ± 0.02 e32.99 ± 0.22 e15.66 ± 0.01 f14.62 ± 0.01 e20.35 ± 0.86 e
A. donax43.13 ± 0.02 c0.72 ± 0.02 cd0.32 ± 0.02 b7.50 ± 0.01 a42.07 ± 0.05 b18.75 ± 0.00 a17.11 ± 0.01 a59.93 ± 1.22 bc
P. australis43.38 ± 0.05 c0.59 ± 0.00 e0.29 ± 0.02 bc7.02 ± 0.01 b41.91 ± 0.09 b18.49 ± 0.01 b16.95 ± 0.01 ab73.84 ± 0.27 a
P. miliaceum42.70 ± 0.04 d0.66 ± 0.03 d0.19 ± 0.00 bcd6.38 ± 0.03 c42.98 ± 0.14 a17.87 ± 0.03 c16.46 ± 0.03 c64.43 ± 2.75 b
F. vulgare43.44 ± 0.11 c0.77 ± 0.02 c0.08 ± 0.02 d6.11 ± 0.07 c42.68 ± 0.25 a17.89 ± 0.08 c16.55 ± 0.09 c56.38 ± 1.39 c
ANOVA************************
***: significant at p < 0.001. Values followed by the same letter in each column do not differ significantly according to Tukey’s test at p < 0.05.
Table 4. Results of the anaerobic degradation of the plants: the parameters of the first-order kinetic model, biochemical methane potential (BMP), theoretical biochemical methane potential (TBMP) and anaerobic biodegradability (mean ± se; n = 2).
PlantsBm
(mL (g SV)−1)
B0
(mL (g SV)−1)
K
(h−1)
BMP
(mL CH4 (g VS)−1)
TBMP
(mL CH4 (g VS)−1)
Anaerobic
Biodegradability (%)
D. viscosa180.9 ± 3.6 bc182.2 ± 5.0 bc0.012 ± 0.001 bc131.2 ± 3.6 bc497.9 ± 26.626.4 ± 0.7 bcd
A. halimus116.6 ± 10.7 c119.9 ± 14.8 c0.012 ± 0.004 bc86.0 ± 10.4 c576.5 ± 30.615.1 ± 2.9 c
B. bituminosa224.4 ± 3.2 ab239.2 ± 0.6 ab0.011 ± 0.001 bc177.6 ± 1.1 ab525.3 ± 6.233.8 ± 0.2 abc
Z. fabago173.8 ± 2.5 bc184.0 ± 0.1 bc0.025 ± 0.001 a130.6 ± 0.04 bc514.7 ± 39.925.5 ± 2.0 cd
A. donax261.4 ± 1.5 a315.9 ± 25.5 a0.006 ± 0.001 bc227.4 ± 18.4 a517.1 ± 9.843.9 ± 2.7 a
P. australis234.5 ± 9.6 ab307.0 ± 23.6 a0.004 ± 0.001 c218.0 ± 16.8 a533.5 ± 9.340.8 ± 2.4 ab
P. miliaceum277.5 ± 26.9 a292.3 ± 38.8 ab0.015 ± 0.003 ab204.6 ± 27.2 ab518.9 ± 2.739.5 ± 5.5 abc
F. vulgare211.5 ± 16.1 ab219.4 ± 15.3 abc0.008 ± 0.0002 bc154.6 ± 108 abc524.3 ± 2.029.5 ± 2.2 abcd
ANOVA*********NS**
** and ***: significant at p < 0.01 and 0.001, respectively. NS = not significant. Values followed by the same letter in each column do not differ significantly according to Tukey’s test at p < 0.05.
Table 5. Pearson’s coefficients for the correlations between plant composition, HHV and parameters related to the anaerobic digestion (n = 8).
AshesVSNHHHVBmB0KBMP
Bm−0.721 *0.759 *−0.4480.789 *0.760 *
B0−0.6750.730 *−0.4710.896 **0.792 *0.947 ***
K0.721 *−0.777 *0.739 *−0.658−0.792 *−0.336−0.476
BMP−0.6930.740 *−0.4510.882 **0.798 *0.943 ***0.998 ***−0.488
Anaerobic biodegradability−0.7000.738 *−0.4510.869 **0.0160.955 ***0.994 ***−0.4510.996 ***
*, ** and ***: significant at p < 0.05, 0.01 and 0.001, respectively.
Publisher’s Note: MDPI stays neutral with regard to jurisdictional claims in published maps and institutional affiliations.

