
Orchard Level Assessment of Irrigation Performance and Water Productivity of an Irrigation Community in Eastern Spain

 , , , and
Abstract
:1. Introduction
2. Materials and Methods
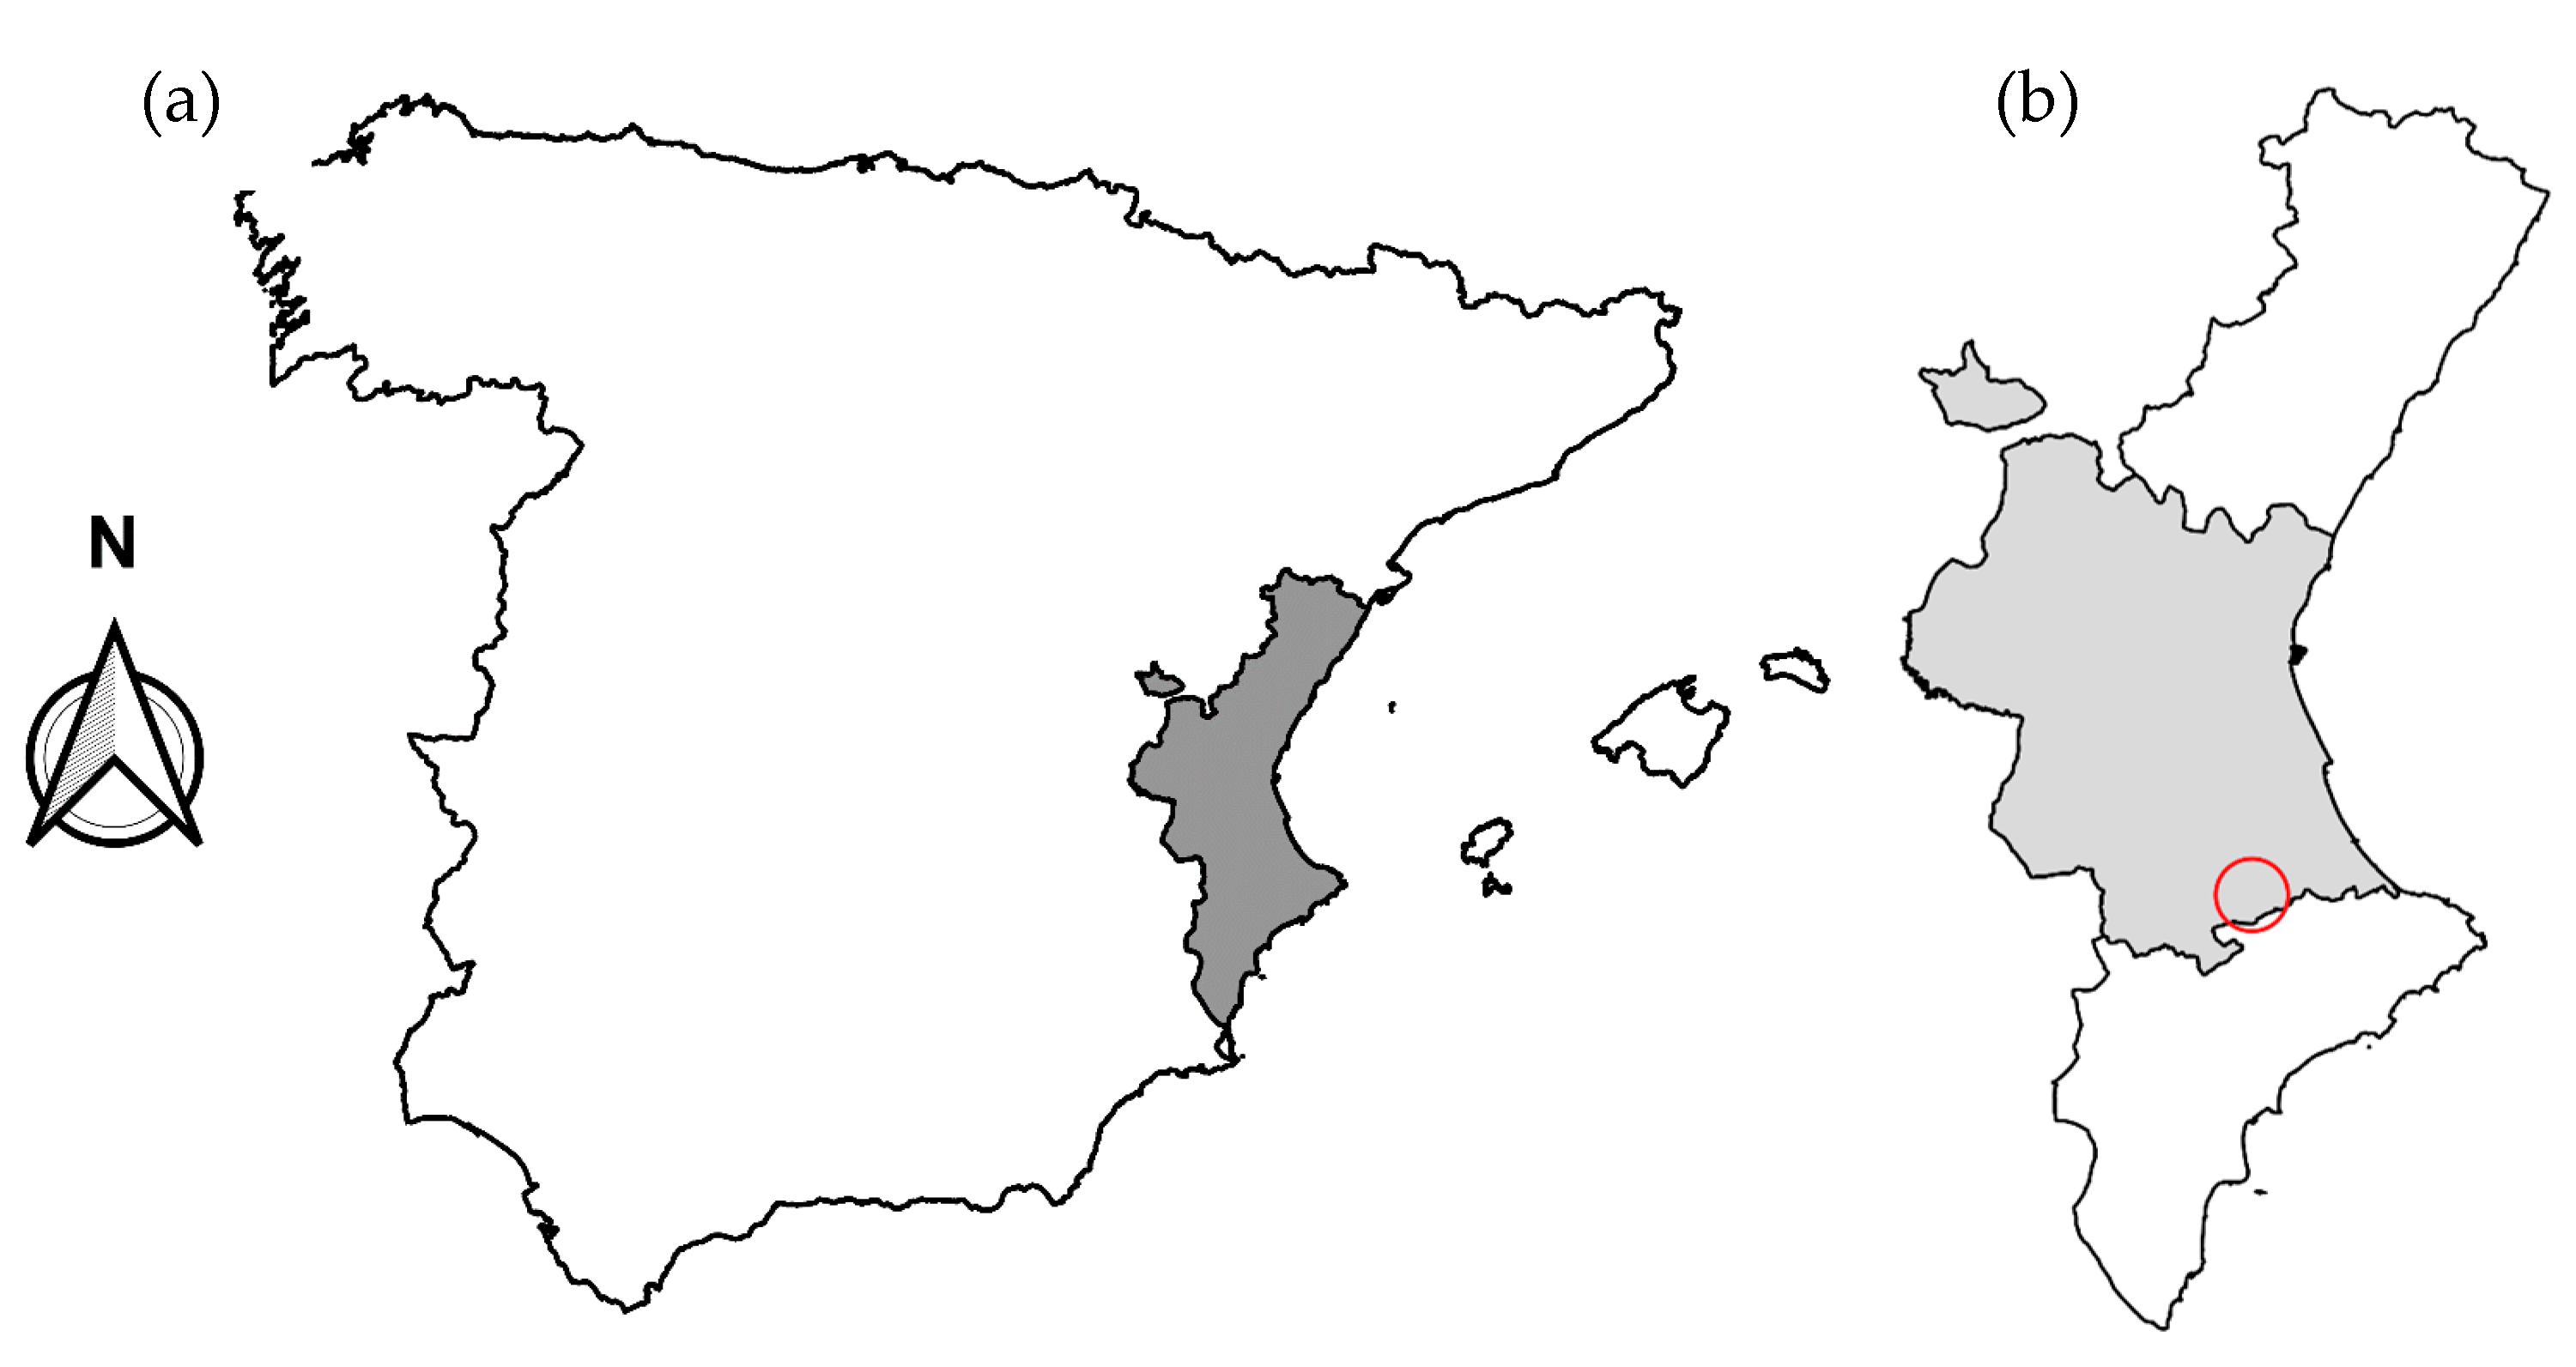
2.1. Irrigated Area Description
2.2. Definition of Performance Indicators
2.3. Measurements and Calculations
2.4. Statistical Analysis
3. Results
Measured and Calculated Values of Environmental Parameters
4. Discussion
5. Conclusions
Author Contributions
Funding
Data Availability Statement
Acknowledgments
Conflicts of Interest
References
- Ministerio de Agricultura Pesca y Alimentación. Gestión Sostenible de Regadíos. 2021. Available online: https://www.mapa.gob.es/es/desarrollo-rural/temas/gestion-sostenible-regadios/ (accessed on 27 August 2021).
- García-Mollá, M.; Sanchis-Ibor, C.; Avellà-Reus, L.; Albiac, J.; Isidoro, D.; Lecina, S. Irrigation in the Mediterranean. In Technologies, Institutions and Policies; Molle, F., Sanchis-Ibor, C., Avellà-Reus, L., Eds.; Springer: Cham, Switzerland, 2019; Volume 22, p. 320. [Google Scholar] [CrossRef]
- Sanchis-Ibor, C.; Ortega-Reig, M.; Guillem-García, A.; Carricondo, J.M.; Manzano-Juárez, J.; García-Mollá, M.; Royuela, Á. Irrigation post-modernization. Farmers envisioning irrigation policy in the region of valencia (Spain). Agriculture 2021, 11, 317. [Google Scholar] [CrossRef]
- García, I.F.; Díaz, J.A.R.; Poyato, E.C.; Montesinos, P.; Berbel, J. Effects of modernization and medium term perspectives on water and energy use in irrigation districts. Agric. Syst. 2014, 131, 56–63. [Google Scholar] [CrossRef]
- Berbel, J.; Expósito, A.; Gutiérrez-Martín, C.; Mateos, L. Effects of the Irrigation Modernization in Spain 2002–2015. Water Resour. Manag. 2019, 33, 1835–1849. [Google Scholar] [CrossRef]
- Ministerio de Agricultura Pesca y Alimentación. SIAR. Sistema de Información Agroclimática para el Regadío. Available online: https://eportal.mapa.gob.es/websiar/SeleccionParametrosMap.aspx?dst=1 (accessed on 9 June 2021).
- Instituto Valenciano de Investigaciones Agrarias. Riegos IVIA. 2011. Available online: http://riegos.ivia.es/ (accessed on 25 August 2021).
- Lankford, B.; Closas, A.; Dalton, J.; Gunn, E.L.; Hess, T.; Knox, J.W.; van der Kooij, S.; Lautze, J.; Molden, D.; Orr, S.; et al. A scale-based framework to understand the promises, pitfalls and paradoxes of irrigation efficiency to meet major water challenges. Glob. Environ. Chang. 2020, 65, 102182. [Google Scholar] [CrossRef]
- Benavides, J.; Hernández-Plaza, E.; Mateos, L.; Fereres, E. A global analysis of irrigation scheme water supplies in relation to requirements. Agric. Water Manag. 2021, 243, 106457. [Google Scholar] [CrossRef]
- Malano, H.; Burton, M. Guidelines for Benchmarking Performance in the Irrigation and Drainage Sector; IPTRID Secretariat Food and Agriculture Organization of the United Nations: Rome, Italy, 2001. [Google Scholar]
- Salgado, R.; Mateos, L. Evaluation of different methods of estimating ET for the performance assessment of irrigation schemes. Agric. Water Manag. 2021, 243, 106450. [Google Scholar] [CrossRef]
- Bos, M.G.; Burton, M.A.; Molden, D.J. Irrigation and Drainage Performance Assessment: Practical Guidelines; CABI Publishing: Oxford, UK, 2005. [Google Scholar] [CrossRef] [Green Version]
- Clemmens, A.J.; Molden, D.J. Water uses and productivity of irrigation systems. Irrig. Sci. 2007, 25, 247–261. [Google Scholar] [CrossRef]
- Clemmens, A.J.; Bos, M.G. Statistical methods for irrigation system water delivery performance evaluation. Irrig. Drain. Syst. 1990, 4, 345–365. [Google Scholar] [CrossRef]
- Small, L.E.; Svensen, M. A framework for assessing irrigation performance. Irrig. Drain. Syst. 1990, 4, 283–312. [Google Scholar] [CrossRef] [Green Version]
- Molden, D.J.; Gates, T.K. Performance Measures for Evaluation of Irrigation-Water-Delivery Systems. J. Irrig. Drain. Eng. 1990, 116, 804–823. [Google Scholar] [CrossRef]
- Bos, M.G. Performance indicators for irrigation and drainage. Irrig. Drain. Syst. 1997, 11, 119–137. [Google Scholar] [CrossRef]
- Burt, C.M.; Clemmens, A.J.; Strelkoff, T.S.; Solomon, K.H.; Bliesner, R.D.; Hardy, L.A.; Howell, T.A.; Eisenhauer, D.E. Irrigation Performance Measures: Efficiency and Uniformity. J. Irrig. Drain. Eng. 1997, 123, 423–442. [Google Scholar] [CrossRef] [Green Version]
- Murray-Rust, H.; Snellen, W.B. Irrigation System Performance Assessment and Diagnosi; International Irrigation Management Institute (IIMI): Colombo, Sri Lanka, 1993. [Google Scholar]
- Rath, A.; Swain, P.C. Evaluation of performance of irrigation canals using benchmarking techniques—A case study of Hirakud dam canal system, Odisha, India. ISH J. Hydraul. Eng. 2020, 26, 51–58. [Google Scholar] [CrossRef]
- Terefe, Y.; Singh, P. East-bank canal water delivery performance evaluation: Case study of Finchaa Sugar Estate, Ethiopia. ISH J. Hydraul. Eng. 2020, 1–9. [Google Scholar] [CrossRef]
- Kartal, S.; Değirmenci, H.; Arslan, F. Assessment of irrigation schemes with performance indicators in southeastern irrigation district of Turkey. J. Agric. Sci. 2020, 26, 138–146. [Google Scholar] [CrossRef]
- Nikam, B.R.; Garg, V.; Thakur, P.K.; Aggarwal, S.P. Application of Remote Sensing and GIS in Performance Evaluation of Irrigation Project at Disaggregated Level. J. Indian Soc. Remote Sens. 2020, 48, 979–997. [Google Scholar] [CrossRef]
- Shahrokhnia, M.A.; Olyan-Ghiasi, A. Determination of overall water delivery performance based on adequacy, efficiency, equity and dependability in the Doroodzan irrigation network. Irrig. Drain. 2019, 68, 637–645. [Google Scholar] [CrossRef]
- Jiménez-Bello, M.A.; Alzamora, F.M.; Carles, J.; Campos, A. Dynamic citrus orchards irrigation performance assessment by a surface energy balance method using Landsat imagery. In Proceedings of the EGU General Assembly Conference Abstracts, Vienna, Austria, 8–13 April 2018; Volume 20, p. 14557. [Google Scholar]
- Zema, D.A.; Nicotra, A.; Mateos, L.; Zimbone, S.M. Improvement of the irrigation performance in Water Users Associations integrating data envelopment analysis and multi-regression models. Agric. Water Manag. 2018, 205, 38–49. [Google Scholar] [CrossRef]
- Lamaddalena, N.; Fouial, A. Sensitivity Indicator for Pressurized Irrigation Distribution Systems. Water Resour. Manag. 2019, 33, 1985–1998. [Google Scholar] [CrossRef]
- Abera, A.; Verhoest, N.E.; Tilahun, S.A.; Alamirew, T.; Adgo, E.; Moges, M.M.; Nyssen, J. Performance of small-scale irrigation schemes in Lake Tana Basin of Ethiopia: Technical and socio-political attributes. Phys. Geogr. 2019, 40, 227–251. [Google Scholar] [CrossRef]
- Kassa, E.T.; Ayana, M. Hydraulic Performance Assessment of Mychew Small Scale Irrigation Scheme, North Ethiopia. Int. J. Environ. Clim. Chang. 2019, 9, 549–561. [Google Scholar] [CrossRef]
- Bettili, L.; Pek, E.; Salman, M. A decision support system for water resources management: The case study of Mubuku irrigation scheme, Uganda. Sustainability 2019, 11, 6260. [Google Scholar] [CrossRef] [Green Version]
- Zema, D.A.; Filianoti, P.; D’Agostino, D.; Labate, A.; Lucas-Borja, M.E.; Nicotra, A.; Zimbone, S.M. Analyzing the Performances of Water User Associations to Increase the Irrigation Sustainability: An Application of Multivariate Statistics to a Case Study in Italy. Sustainability 2020, 12, 6327. [Google Scholar] [CrossRef]
- Rocamora, C.; Vera, J.; Abadía, R. Strategy for Efficient Energy Management to solve energy problems in modernized irrigation: Analysis of the Spanish case. Irrig. Sci. 2013, 31, 1139–1158. [Google Scholar] [CrossRef]
- Abadia, R.; Rocamora, C.; Ruiz, A.; Puerto, H. Energy efficiency in irrigation distribution networks I: Theory. Biosyst. Eng. 2008, 101, 21–27. [Google Scholar] [CrossRef]
- Abadia, R.; Rocamora, M.C.; Corcoles, J.I.; Ruiz-Canales, A.; Martinez-Romero, A.; Moreno, M.A. Comparative analysis of energy efficiency in water users associations. Span. J. Agric. Res. 2010, 8, 134–142. [Google Scholar] [CrossRef] [Green Version]
- Abadía, R.; Vera, J.; Rocamora, C.; Puerto, H. Generalisation of supply energy efficiency in irrigation distribution networks. Biosyst. Eng. 2018, 175, 146–155. [Google Scholar] [CrossRef]
- Córcoles, J.I.; de Juan, J.A.; Ortega, J.F.; Tarjuelo, J.M.; Moreno, M.A. Management evaluation of Water Users Associations using benchmarking techniques. Agric. Water Manag. 2010, 98, 1–11. [Google Scholar] [CrossRef]
- Dechmi, F.; Playán, E.; Faci, J.M.; Tejero, M. Analysis of an irrigation district in northeastern Spain I. Characterisation and water use assessment. Agric. Water Manag. 2003, 61, 75–92. [Google Scholar] [CrossRef] [Green Version]
- Lorite, I.; Mateos, L.; Fereres, E. Evaluating irrigation performance in a Mediterranean environment: I. Model and general assessment of an irrigation scheme. Irrig. Sci. 2004, 23, 77–84. [Google Scholar] [CrossRef]
- Lorite, I.; Mateos, L.; Fereres, E. Evaluating irrigation performance in a Mediterranean environment: II. Variablility among crops and farmers. Irrig. Sci. 2004, 23, 85–92. [Google Scholar] [CrossRef]
- Sánchez, J.A.; Reca, J.; Martínez, J. Irrigation Water Management in a Mediterranean Greenhouse District: Irrigation Adequacy Assessment. Irrig. Drain. 2015, 64, 299–313. [Google Scholar] [CrossRef]
- Sánchez, J.A.; Reca, J.; Martínez, J. Water Productivity in a Mediterranean Semi-Arid Greenhouse District. Water Resour. Manag. 2015, 29, 5395–5411. [Google Scholar] [CrossRef] [Green Version]
- Díaz, J.A.R.; Poyato, E.C.; Luque, R.L. Applying benchmarking and data envelopment analysis (DEA) techniques to irrigation districts in Spain. Irrig. Drain. 2004, 53, 135–143. [Google Scholar] [CrossRef]
- Parra, L.; Botella-Campos, M.; Puerto, H.; Roig-Merino, B.; Lloret, J. Evaluating irrigation efficiency with performance indicators: A case study of citrus in the east of spain. Agronomy 2020, 10, 1359. [Google Scholar] [CrossRef]
- Poveda-Bautista, R.; Roig-Merino, B.; Puerto, H.; Buitrago-Vera, J. Assessment of Irrigation Water Use Efficiency in Citrus Orchards Using AHP. Int. J. Environ. Res. Public Health 2021, 18, 5667. [Google Scholar] [CrossRef]
- Atlas Climático. Available online: http://agroclimap.aemet.es/# (accessed on 7 June 2021).
- Ministerio de Agricultura Pesca y Alimentación. Subsecretaría de Agricultura Pesca y Alimentación. Encuesta sobre Superficies y Rendimientos Cultivos. Resultados Nacionales y Autonómicos. 2020. Available online: https://cpage.mpr.gob.es (accessed on 28 May 2021).
- Bos, M.G.; Murray-Rust, D.H.; Merrey, D.J.; Johnson, H.G.; Snellen, W.B. Methodologies for assessing performance of irrigation and drainage management. Irrig. Drain. Syst. 1994, 7, 231–261. [Google Scholar] [CrossRef]
- Pomares, F.; Gris, V. Fertlización en el Cultivo del Caqui: Necesidades Nutricionales; Agricola Vergel: Valencia, Spain, 2014; pp. 100–104. [Google Scholar]
- Intrigliolo, D.S.; de Paz, J.; Bonet, L.; Ballester, C. Cuantificación de la respuesta del caqui al riego y fertilización para el establecimiento de pautas de manejo eficientes y sostenibles. Phytoma España 2017, 286, 46–51. [Google Scholar]
- Allen, R.G.; Pruitt, W.O.; Raes, D.; Smith, M.; Pereira, L.S. Crop Evapotranspiration. Guidelines for Computing Crop Water Requirements; Irrigation and Drainage Paper No. 56; FAO: Rome, Italy, 1998. [Google Scholar]
- Smith, M.; Muñoz, G.; van Halsema, G.; Maraux, F.; Izzi, G.; Wahaj, R. CropWat 8.0. Cropwat 8.0. Land & Water|Food and Agriculture Organization of the United Nations; Food and Agriculture Organization of the United Nations: Rome, Italy, 2019. [Google Scholar]
- Intrigliolo, D.S.; Visconti, F.; Bonet, L.; Parra, M.; Besada, C.; Abrisqueta, I.; Rubio, J.S.; de Paz, J.M. Persimmon (Diospyros kaki) trees responses to restrictions in water amount and quality. In Water Scarcity and Sustainable Agriculture in Semiarid Environment; Academic Press: Cambridge, MA, USA, 2018; pp. 149–177. [Google Scholar]
- Fereres, E.; Goldhammer, D.A. Deciduous fruit and nut trees. In Irrigation of Agricultural Crops Monograph 30; Stewart, B.A., Nielsen, D.R., Eds.; ASA: Madison, WI, USA, 1990; pp. 987–1017. [Google Scholar]
- Andreu, L.; Hopmans, J.W.; Schwankl, L.J. Spatial and temporal distribution of soil water balance for a drip-irrigated almond tree. Agric. Water Manag. 1997, 35, 123–146. [Google Scholar] [CrossRef]
- Abrisqueta, J.M.; Mounzer, O.; Álvarez, S.; Conejero, W.; García-Orellana, Y.; Tapia, L.M.; Vera, J.; Abrisqueta, I.; Ruiz-Sánchez, M.C. Root dynamics of peach trees submitted to partial rootzone drying and continuous deficit irrigation. Agric. Water Manag. 2008, 95, 959–967. [Google Scholar] [CrossRef]
- Rincón, L. La práctica de la fertirrigación en el cultivo del melocotonero. In Vida Rural; EUMEDIA, S.A.: Madrid, Spain, 2010; pp. 68–72. [Google Scholar]
- R Core Team. R: A Language and Environment for Statistical Computing. R Foundation for Statistical Computing. Vienna, Austria. 2020. Available online: https://www.R-project.org/ (accessed on 15 July 2021).
- Rs. Team. RStudio: Integrated Development for R; RStudio, Inc.: Boston, MA, USA, 2019; Available online: https://www.rstudio.com/ (accessed on 15 July 2021).
- Paço, T.A.; Ferreira, M.I.; Conceiçã, N. Peach orchard evapotranspiration in a sandy soil: Comparison between eddy covariance measurements and estimates by the FAO 56 approach. Agric. Water Manag. 2006, 85, 305–3013. [Google Scholar] [CrossRef] [Green Version]
- Mateos, L.; González-Dugo, M.P.; Testi, L.; Villalobos, J.F. Monitoring evapotranspiration of irrigated crops using crop coefficients derived from time series of satellite images. I. Method validation. Agric. Water Manag. 2013, 125, 81–91. [Google Scholar] [CrossRef]
- Badal, E.; El-Mageed, T.A.A.; Buesa, I.; Guerra, D.; Bonet, L.; Intrigliolo, D.S. Moderate plant water stress reduces fruit drop of ‘Rojo Brillante’ persimmon (Diospyros kaki) in a Mediterranean climate. Agric. Water Manag. 2013, 119, 154–160. [Google Scholar] [CrossRef]


| Year | ||||
|---|---|---|---|---|
| 2017 | 2018 | 2019 | 2020 | |
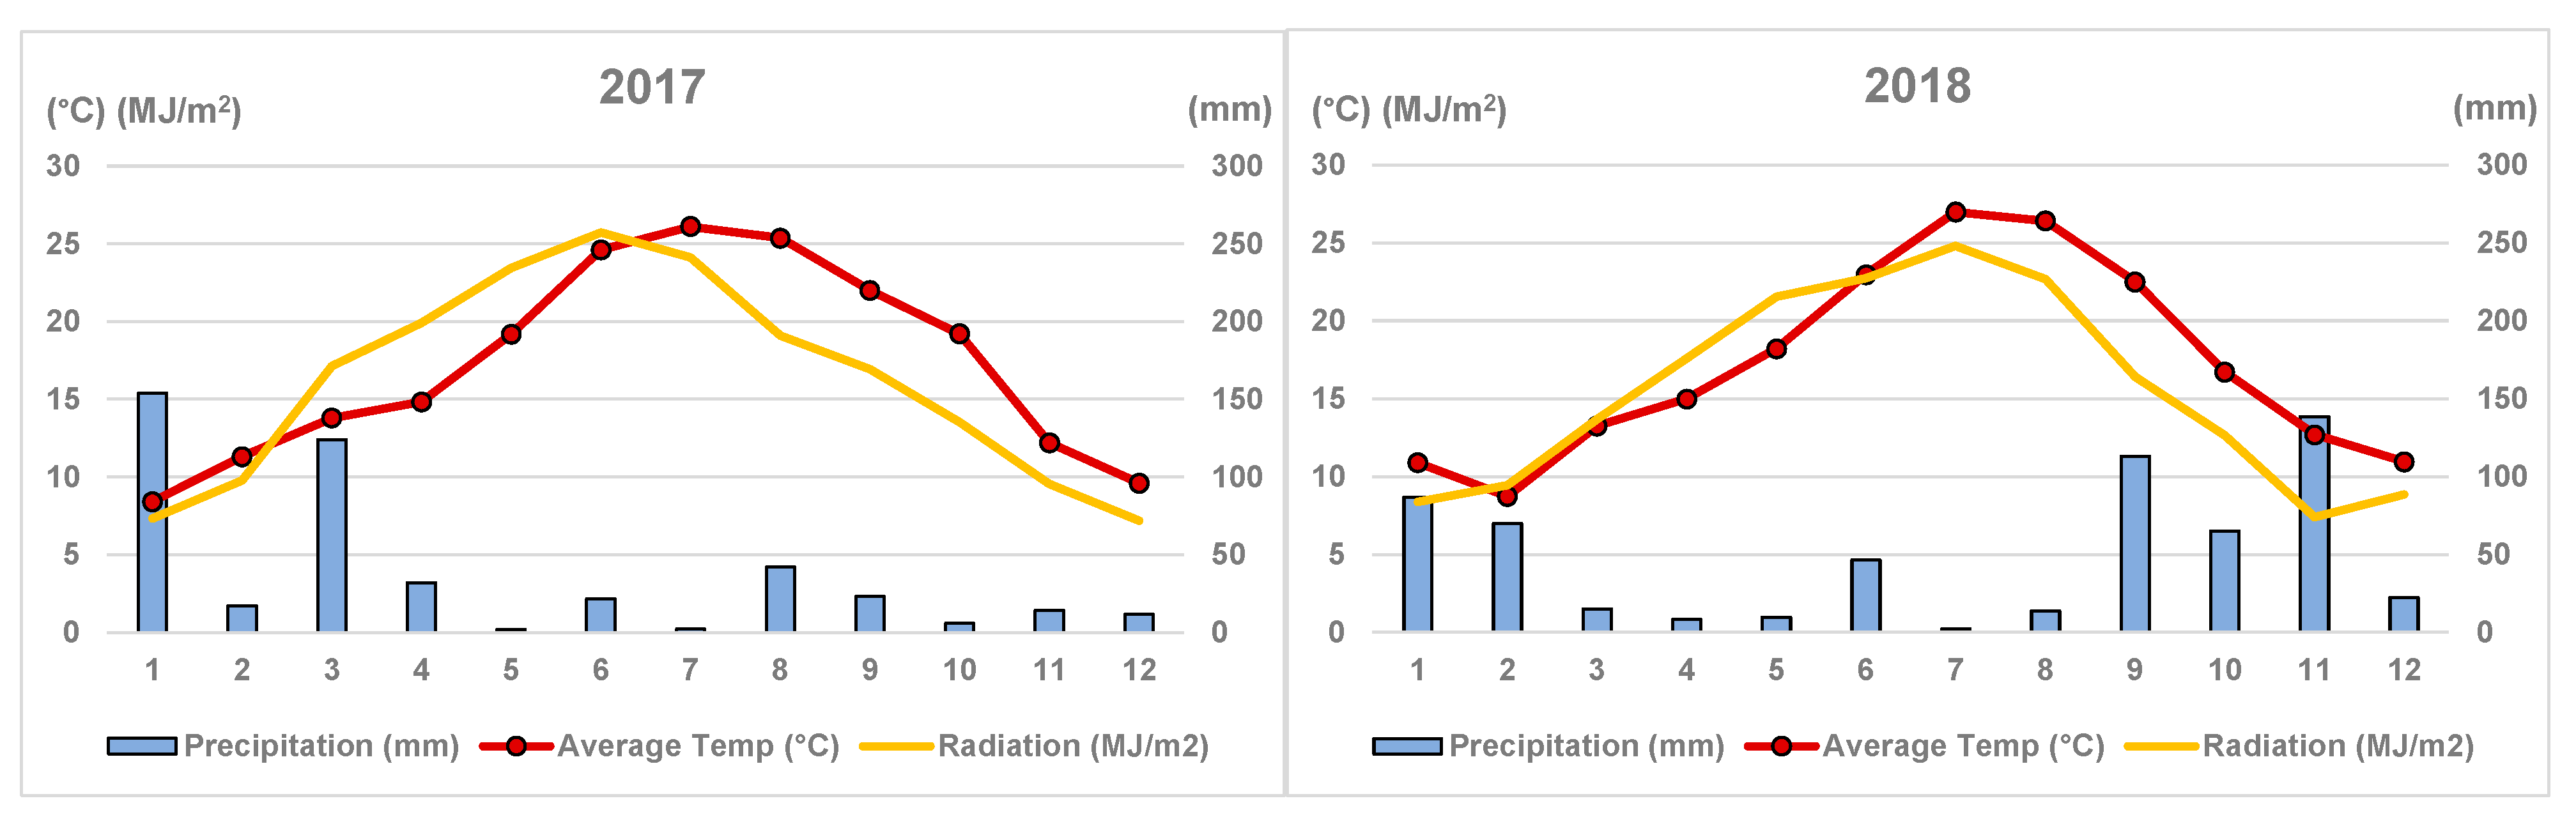
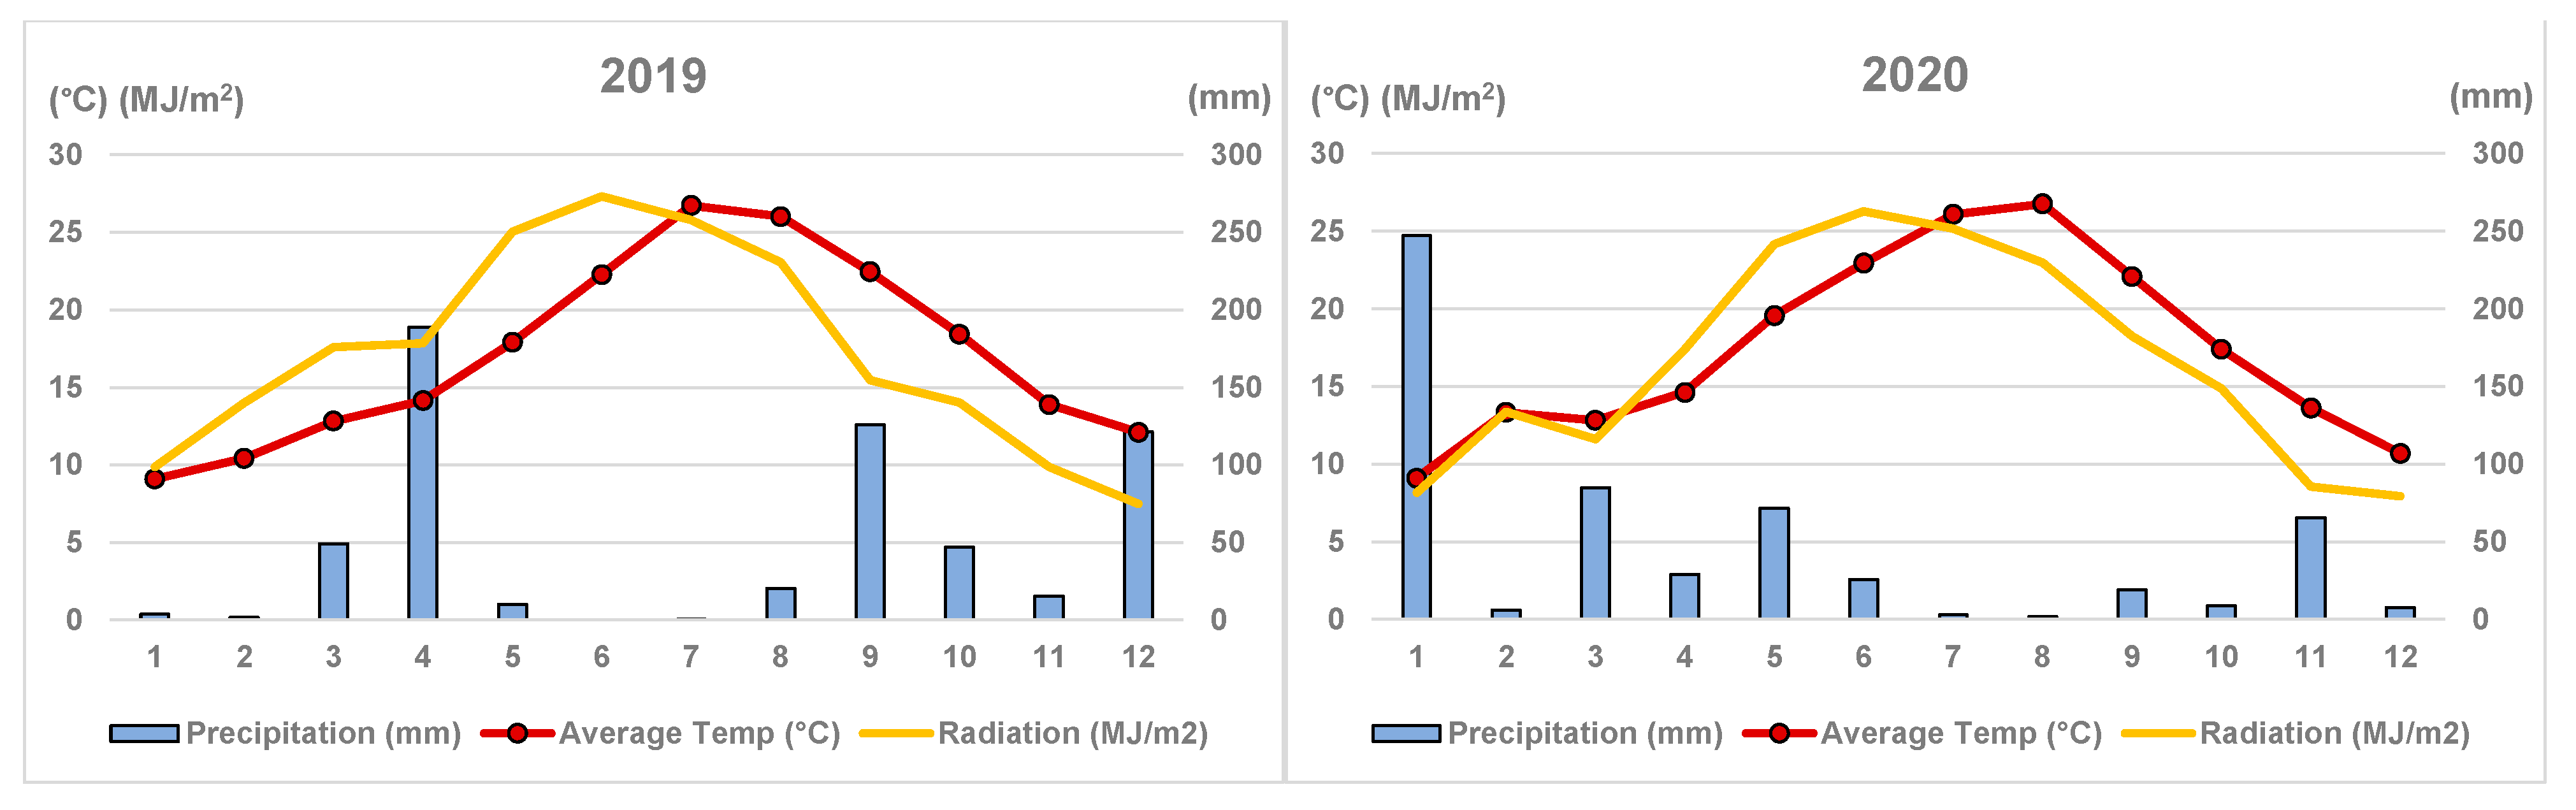
| ETo (mm) | 1173.2 | 1179.2 | 1211.2 | 1166.4 |
| P (mm) | 449.2 | 590.0 | 583.4 | 570.2 |
| P March–October (mm) | 252.3 | 273.1 | 441.3 | 243.7 |
| Peach | Persimmon | |
|---|---|---|
| Varieties | King Zest, Samantha (flat), Nazario, Carmina 28 (nectarine), Alejandro Dumas, Romea, Leo (flat) | Rojo brillante |
| Number of plots * | Extra- early: 9 Early: 22 Mid-season: 13 Other **: 5 | 55 |
| Average size (Max-min) (ha) | 0.48 (1.85–0.05) | 0.70 (4.03–0.09) |
| Tree spacing | 5 m × 4 m | 5 m × 3 m |
| Peach | Persimmon | |||||||
|---|---|---|---|---|---|---|---|---|
| 2017 | 2018 | 2019 | 2020 | 2017 | 2018 | 2019 | 2020 | |
| Number of plots under irrigation | ||||||||
| Adult | 16 | 16 | 20 | 30 | 4 | 4 | 10 | 11 |
| Young | 10 | 12 | 15 | 6 | 11 | 17 | 33 | 39 |
| Sapling | 7 | 14 | 11 | 10 | 19 | 13 | 8 | 3 |
| Total | 33 | 42 | 46 | 46 | 34 | 34 | 51 | 53 |
| Number of plots with Yield data | ||||||||
| Adult | 13 | 9 | 10 | 20 | 3 | 4 | 8 | 10 |
| Young | 9 | 9 | 13 | 6 | 9 | 16 | 26 | 39 |
| Sapling | 5 | 4 | 11 | 9 | 8 | 7 | 2 | 3 |
| Total | 27 | 22 | 34 | 35 | 20 | 27 | 36 | 52 |
| Planting density (trees/ha) | ||||||||
| Adult | 415 | 415 | 415 | 450 | 465 | 465 | 465 | 459 |
| Young | 515 | 493 | 515 | 463 | 571 | 565 | 565 | 578 |
| Sapling | 617 | 680 | 704 | 775 | 602 | 621 | 699 | 877 |
| Peach | Persimmon | |
|---|---|---|
| Growing season period | 1 March–31 October | 1 March–30 November |
| Kc ini/Kc mid/Kc end | 0.42/0.57/0.57 | 0.32/1.08/0.59 |
| Kd | ||
| Adult | 0.82 | 1.0 |
| Young | 0.37 | 0.45 |
| Sapling | 0.15 | 0.19 |
| Length of initial/development/midseason/late season periods (d) | 1/90/122/30 | 31/121/92/30 |
| Rooting depth (m) | ||
| Adult | 0.60 | 0.60 |
| Young | 0.40 | 0.40 |
| Sapling | 0.30 | 0.30 |
| Depletion fraction | 0.50 | 0.50 |
| Bud burst date | 1 March | 1 March |
| Peach | Persimmon | |||||||
|---|---|---|---|---|---|---|---|---|
| 2017 | 2018 | 2019 | 2020 | 2017 | 2018 | 2019 | 2020 | |
| Raw Irrigation Requirement (mm) | ||||||||
| Adult | 481.2 | 442.1 | 503.6 | 379.3 | 863.7 | 823.5 | 914.1 | 847.7 |
| Young | 239.7 | 200.1 | 228.7 | 181.4 | 414.5 | 340.8 | 419.8 | 349.7 |
| Sapling | 129.6 | 104.8 | 123.7 | 89.5 | 203.1 | 166.4 | 198.5 | 130.2 |
| Total | ||||||||
| Annual Irrigation Applied (mm) | ||||||||
| Adult | 141.8 | 251.4 | 237.6 | 159.7 | 285.6 | 419.6 | 162.0 | 223.2 |
| Young | 208.4 | 124.2 | 145.3 | 139.2 | 151.3 | 218.8 | 149.4 | 170.3 |
| Sapling | 98.6 | 72.2 | 110.1 | 87.6 | 129.7 | 65.8 | 143.0 | 110.8 |
| Performance Indicators | ||||||
|---|---|---|---|---|---|---|
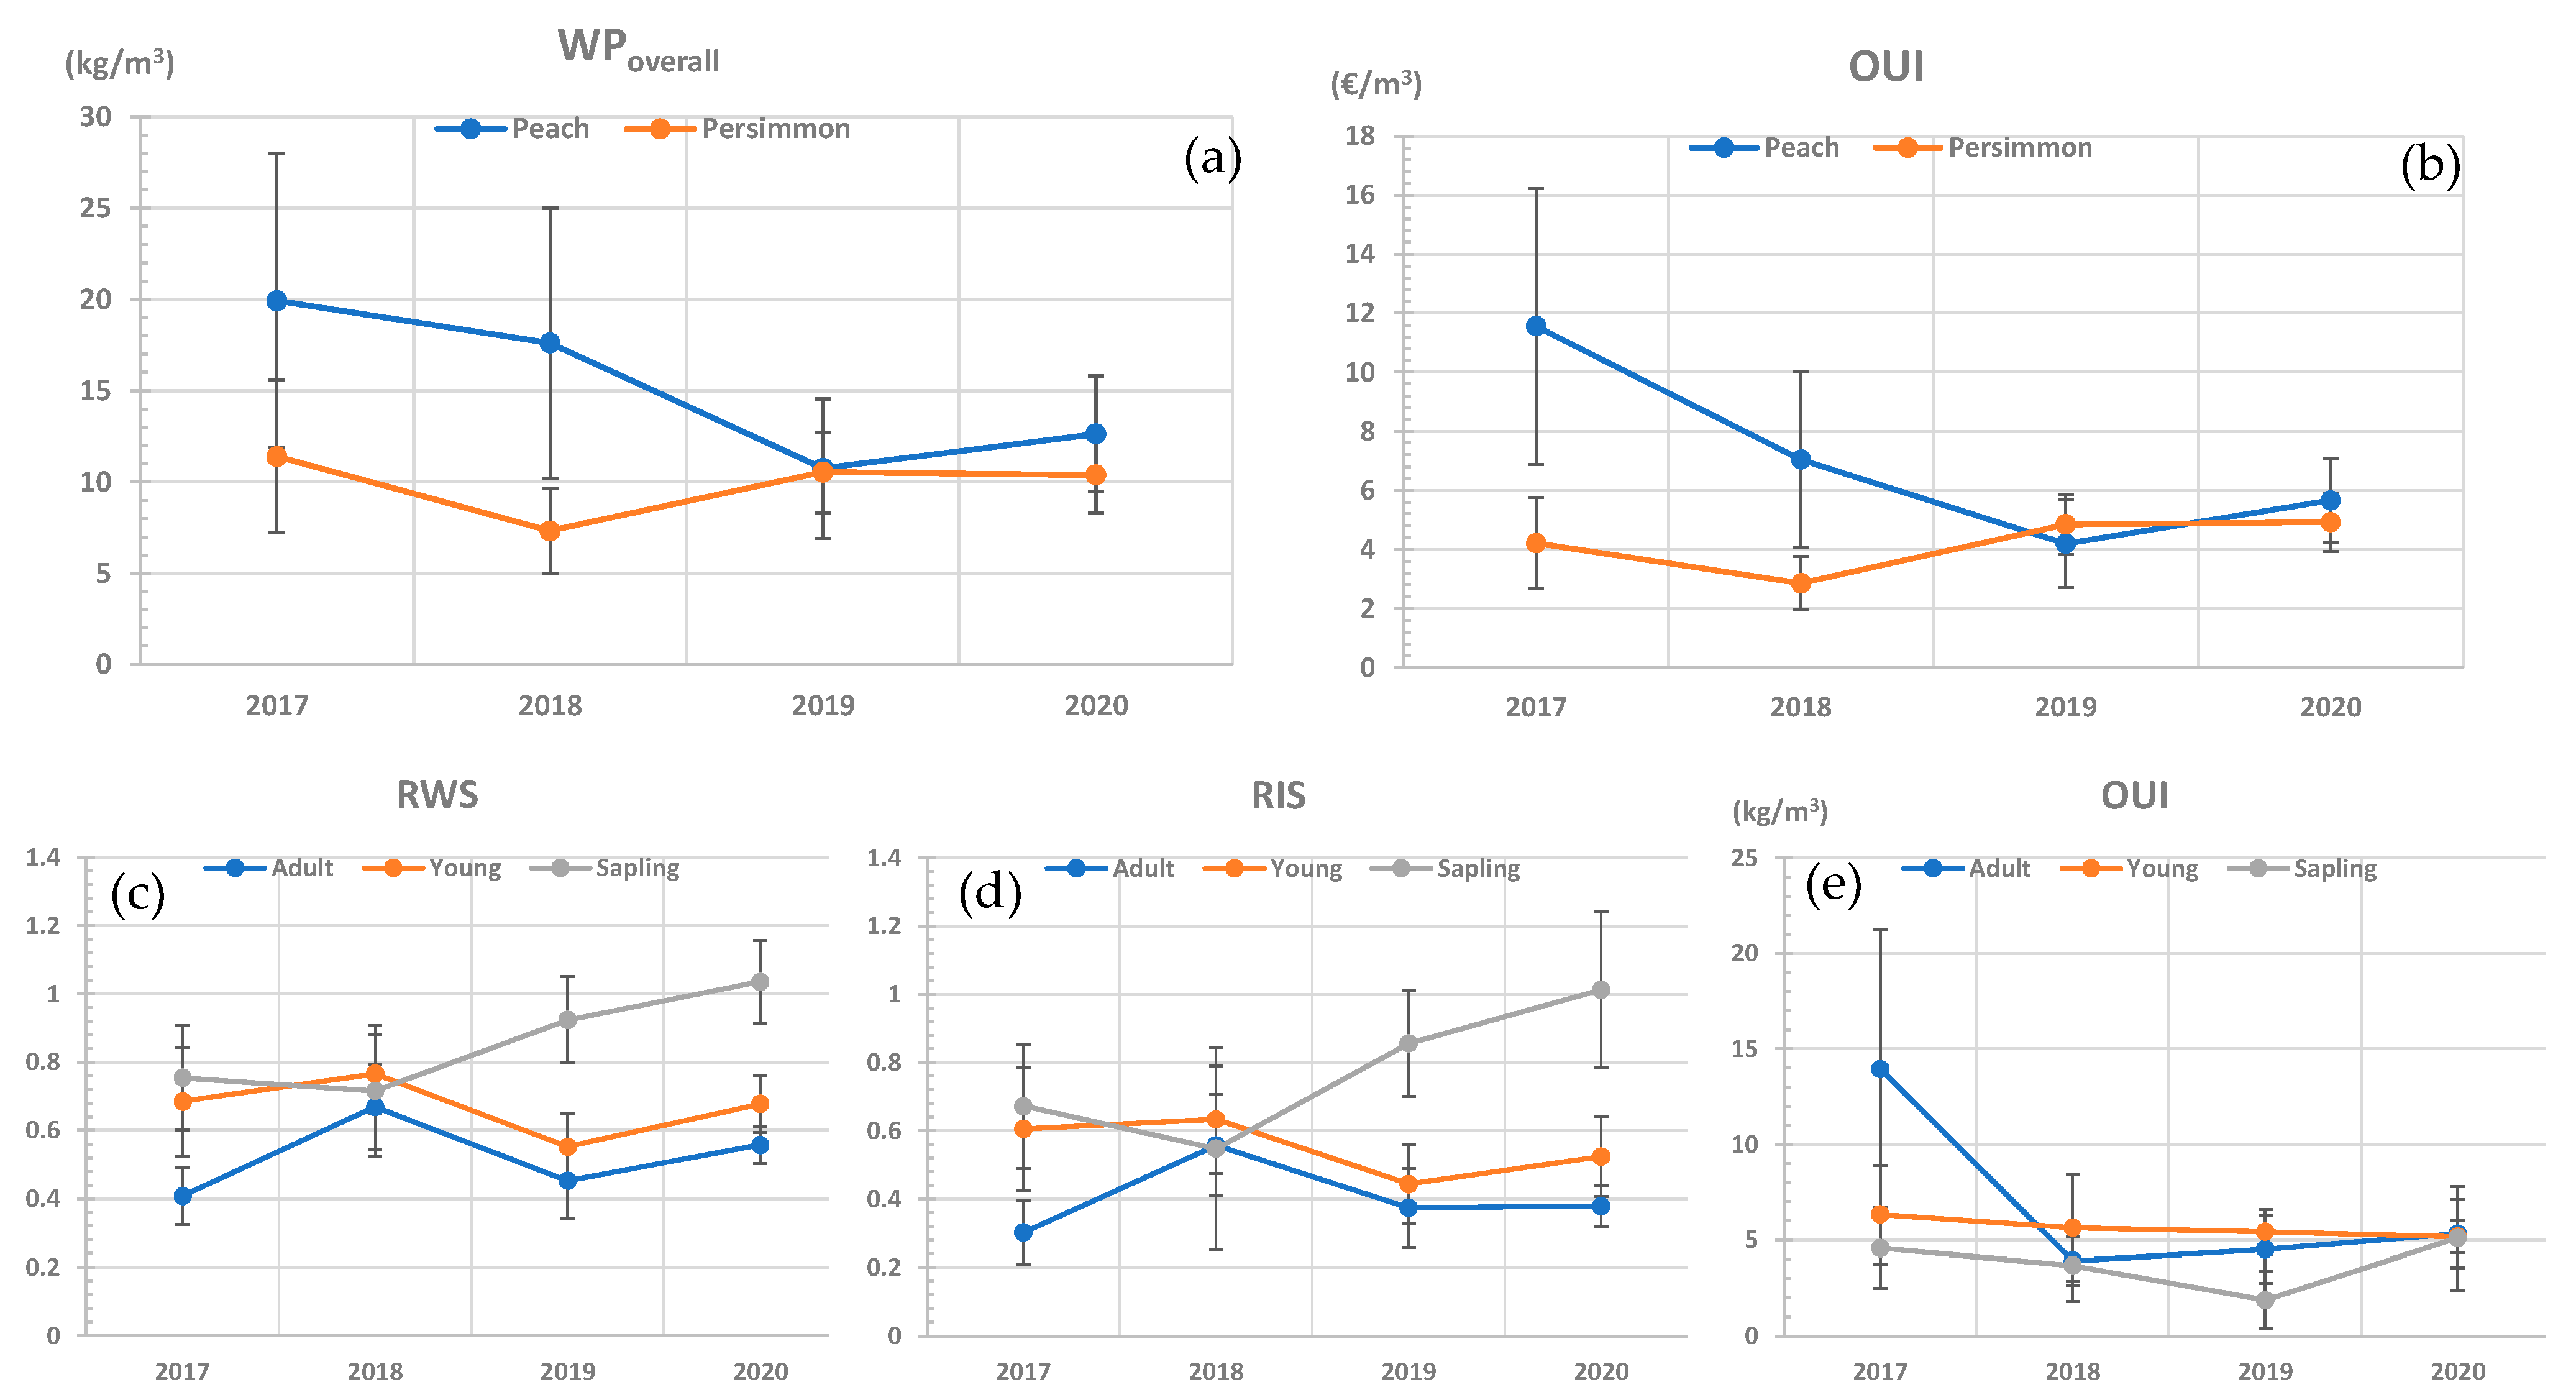
| RWS | RIS | Yp | WPoverall | OUI | N | |
| Factor: Year | ||||||
| 2017 | 0.629 ± 0.04 | 0.541 ± 0.05 | 127.06 ± 0.18 | 16.29 ± 2.58 | 8.43 ± 1.50 | 28.00 ± 0.02 |
| 2018 | 0.723 ± 0.04 | 0.583 ± 0.06 | 91.85 ± 0.08 | 11.94 ± 1.94 | 4.73 ± 0.78 | 26.77 ± 0.03 |
| 2019 | 0.594 ± 0.04 | 0.503 ± 0.04 | 81.47 ± 0.09 | 10.63 ± 1.10 | 4.53 ± 0.45 | 9.80 ± 0.01 |
| 2020 | 0.675 ± 0.03 | 0.528 ± 0.04 | 113.16 ± 0.15 | 11.29 ± 0.91 | 5.21 ± 0.42 | 18.71 ± 0.01 |
| Factor: Crop | ||||||
| Peach | 0.722 ± 0.03 | 0.603 ± 0.04 | 125.44 ± 0.10 | 14.68±1.41 | 6.84 ± 0.72 | 20.56 ± 0.02 |
| Persimmon | 0.587 ± 0.02 | 0.470 ± 0.02 | 67.39 ± 0.08 | 9.96 ± 0.65 | 4.38 ± 0.29 | 18.52 ± 0.01 |
| Factor: Size | ||||||
| Adult | 0.522 ± 0.02 | 0.396 ± 0.03 | 105.13 ± 0.08 | 13.74 ± 1.72 | 6.69 ± 0.97 | 17.40 ± 0.01 |
| Young | 0.655 ± 0.03 | 0.531 ± 0.03 | - | 12.46 ± 0.94 | 5.50 ± 0.41 | 17.82 ± 0.01 |
| Sapling | 0.823 ± 0.04 | 0.726 ± 0.06 | - | 8.91 ± 1.33 | 3.78 ± 0.55 | 25.33 ± 0.03 |
| Year | * | ns | ns | ns | ** | ** |
| Crop | ** | ** | ** | * | ** | ns |
| Size | ** | ** | - | ** | ** | * |
| Year × Crop | ns | ns | - | ** | ** | ns |
| Year × Size | ** | ** | - | ns | * | ** |
| Crop × Size | ns | ns | - | * | . | ns |
Publisher’s Note: MDPI stays neutral with regard to jurisdictional claims in published maps and institutional affiliations. |
© 2021 by the authors. Licensee MDPI, Basel, Switzerland. This article is an open access article distributed under the terms and conditions of the Creative Commons Attribution (CC BY) license (https://creativecommons.org/licenses/by/4.0/).
Share and Cite
Puerto, H.; Mora, M.; Roig-Merino, B.; Abadía-Sánchez, R.; Cámara-Zapata, J.M.; Suay, R.; Rocamora, C. Orchard Level Assessment of Irrigation Performance and Water Productivity of an Irrigation Community in Eastern Spain. Agronomy 2021, 11, 1829. https://0-doi-org.brum.beds.ac.uk/10.3390/agronomy11091829
Puerto H, Mora M, Roig-Merino B, Abadía-Sánchez R, Cámara-Zapata JM, Suay R, Rocamora C. Orchard Level Assessment of Irrigation Performance and Water Productivity of an Irrigation Community in Eastern Spain. Agronomy. 2021; 11(9):1829. https://0-doi-org.brum.beds.ac.uk/10.3390/agronomy11091829
Chicago/Turabian StylePuerto, Herminia, Miguel Mora, Bernat Roig-Merino, Ricardo Abadía-Sánchez, José María Cámara-Zapata, Ricardo Suay, and Carmen Rocamora. 2021. "Orchard Level Assessment of Irrigation Performance and Water Productivity of an Irrigation Community in Eastern Spain" Agronomy 11, no. 9: 1829. https://0-doi-org.brum.beds.ac.uk/10.3390/agronomy11091829