Article

Crop Establishment Methods and Integrated Nutrient Management Improve: Part II. Nutrient Uptake and Use Efficiency and Soil Health in Rice (Oryza sativa L.) Field in the Lower Indo-Gangetic Plain, India

1
Department of Agriculture, Government of West Bengal, Kolkata 700 001, India
2
Department of Agronomy, Institute of Agriculture, Visva-Bharati University, Sriniketan 731 236, India
3
Department of Agronomy and Agroforestry, Centurion University of Technology and Management, Odisha 761211, India
4
Department of Biochemistry and Plant Physiology, Centurion University of Technology and Management, Odisha 761211, India
5
Department of Biology, College of Science, Taif University, P.O. Box 11099, Taif 21944, Saudi Arabia
6
Department of Clinical Laboratories Sciences, The Faculty of Applied Medical Sciences, Taif University, P.O. Box 11099, Taif 21944, Saudi Arabia
7
Department of Agronomy, Bangladesh Wheat and Maize Research Institute, Dinajpur 5200, Bangladesh
*
Authors to whom correspondence should be addressed.
Submission received: 30 August 2021 / Revised: 17 September 2021 / Accepted: 18 September 2021 / Published: 21 September 2021
(This article belongs to the Special Issue Sustainable Tillage and Sowing Technologies)

Abstract

:
Rice, the predominant food crop in India, is being grown traditionally with improper plant nutrient management mostly under the flooded situation. Recent advancement in research on crop science focuses on water-saving rice technologies for maximization in crop and water productivity under the backdrop of a shrinking water resource base for ensuring environmental and agricultural sustainability. Under this situation, an experiment was conducted in two consecutive years in a split-plot design keeping rice cultivation methodologies, viz., aerobic culture, System of Rice Intensification (SRI), and conventional flooded culture in main plots and integrated plant nutrient management (INM) treatments in sub-plots. The experiment was aimed at understanding the effects of different rice production systems and INM on nutrient content, uptake, and use efficiency. The change in soil quality parameters was also studied to understand the impact of crop establishment methods (CEM) and INM options. Significant reduction (p ≤ 0.05) in nutrient uptake and use efficiency was observed under aerobic culture compared to SRI and flooded method, although aerobic culture showed the highest physiological nitrogen use efficiency. Post-harvest available Fe status was significantly lower in aerobic rice (mean 10.39 ppm) compared to other crop establishment technologies; however, Zn status was higher in aerobic rice over the flooded situation. Although available potassium was not affected due to rice cultivation methods, available nitrogen and phosphorus status were influenced remarkably. Soil microbial quality was improved in aerobic rice in comparison to flooded rice. SRI proved to be the most efficient rice establishment method for enhancement in nutrient uptake, use efficiency, and enrichment of soil chemical and microbiological quality. Irrespective of crop culture, integrated plant nutrition in rice improved the nutrient uptake, use efficiency, and soil quality parameters. The study revealed that, under the alluvial soils of the Indo-Gangetic Plains of Eastern India, SRI can be considered as a water-saving rice production method. The method can also improve nutrient uptake, efficiency, and soil quality parameters if proper INM is adopted.

1. Introduction

The demand for rice, the most important staple food crop of the world, is expected to be 800 million tons by the end of 2025 [1,2]. To feed more than 9 billion people by 2050 will require a doubling of production on a sustainable basis. Interestingly, more than 75% of rice production comes from 79 million ha of irrigated lowland and it is predicted that 17 out of 75 million hectares of Asia’s flood irrigated rice crop will experience physical water scarcity and 22-million-hectare areas may experience economic water scarcity [3,4], questioning the rice production sustainability in traditional wetland ecosystem under flooded condition. Apart from the arsenic, toxicity, and nitrate contamination, methane emission in traditional rice culture threatens the issues pertaining to rice yield sustainability and profitability under the backdrop of a shrinking water resource base [4,5]. So, production practices for rice cultivation are shifting from traditional rice to aerobic rice and other alternative waterwise crop establishment methods (CEM), such as System of Rice Intensification (SRI), System of Assured Rice Production (SARP), etc. [4,6], to make use of water more efficient. Under flooded rice culture, more than 50% of the applied nitrogen dissipates into the environment by volatilization, leaching, surface runoff, and denitrification, leading to pollution of fresh water and marine ecosystems. On the contrary, due to puddling and submergence, changes in soil physical, chemical, and biological properties have some favorable effects on soil quality, which in turn affects the availability of some macro- and micronutrients, nutrient content, and uptake pattern of the crop. Again, the shift from traditional rice culture to aerobic rice has brought about an increase in micronutrient deficiency, especially Fe, which is a new challenge depressing iron availability. Lack of sufficient micronutrients, such as Fe and Zn, represents a major threat to the health of the world population. Fe deficiency is one of the most prevalent micronutrient deficiencies in humans, causing 0.8 million deaths annually and affecting approximately two billion people. The SRI is an environmentally benign water-saving production technology which is gaining popularity and interest, as this method has the potential to improve the productivity of land, capital, water, and labor uses of rice with higher nutrient uptake of crop with enhanced partial factor productivity of nutrients and nutrient use efficiency [7,8]. Nutrient management options in water-saving crop production methodologies are of utmost importance as nutrient availability, mobility in soil, and dynamic uptake by plants is greatly affected due to change in soil redox potential. The impact of integrated use of organic matter, biofertilizer, and chemical fertilizer is well documented not only for yield enhancement, but also for improvement of soil quality. Apart from green manuring, compost, and biofertilizer in nutrient management options, recent advancement in research of brown manuring has assumed the utmost importance in water-saving rice production technologies and conservation agriculture under the Indo-Gangetic Plain of India [9,10,11,12]. The cultivation of rice, under flooded situation and alternate wetting and drying situation, gives rise to an anoxic environment when soil is flooded during most of the rice-growing season, and aerobic rice soil creates a differential soil environment which is totally dissimilar, compared to traditional flooded rice soil. Microbial community dynamics in rice soils play an important role in nutrient recycling, soil fertility, soil quality and rice productivity, and composition and structure of microorganism in rice soils are diverse and complicated as crop production methodologies changes. Shifts in structure and composition of the microbial community are strong indicators of soil biological activity, soil quality, and crop productivity of terrestrial agroecosystems [13,14].
The Indo-Gangetic Plain zone (IGP) of the eastern part of India comprises alluvial soil and rice-based cropping systems under traditional flooded culture and is predominantly prevailing years after years with locally available high-yielding cultivars along with improper plant nutrition leading to lower crop productivity and poor soil fertility and quality. Although the comparative analysis on the research achievements on nutrient content, uptake, use efficiency, soil quality, and fertility status after harvest of rice under flooded ecosystem vis-a-vis water-saving rice culture may have been available from literature, information pertaining to these parameters are scant under the backdrop of alluvial soils of Indo-Gangetic Plains in the eastern part of India [15].
Under this experiment, an attempt was made to study the effect of integrated plant nutrition in rice under different crop production technologies such as aerobic culture, SRI, and traditional flooded culture. In this part, the effect of treatments on nutrient content and uptake by the crop, nutrient use efficiency under different crop cultures, and soil fertility and soil quality was discussed.

2. Materials and Methods

2.1. Experimental Site

An experiment was conducted at Adaptive Research Farm, Polba, Agriculture Department, West Bengal, India in the wet seasons (June to November) of 2014 and 2015 on a sandy loam soil (75% sand, 8% clay). The experimental site was situated at 22.92 degrees north latitude, 88.30 degrees east longitude and at 58.57 m altitude from mean sea level. The total rainfall received during the experimental years was 771.8 mm and 1090.6 in 2014 and 2015, respectively. For details of the meteorological condition, refer to the recently published first part of this article [15].

2.2. Experimental Layout

The experiment was laid out in a split-plot design with CEM in main plots and nutrient management treatments as a sub-factor, with three replicates, and individual split-plot sizes were 12 m2. The main plots treatments comprised C1: aerobic culture, C2: the system of rice intensification, C3: conventional flooded rice and sub-plot treatments consisting of absolute control (F1) and the rest were F2: 100% recommended dose of fertilizers (RDF) through chemical fertilizers (N:P2O5:K2O (80:40:40)), F3: 75% recommended dose of nitrogen (RDN) through chemical fertilizer + 25% RDN through farm yard manure (FYM), F4: 75% RDN through chemical fertilizer + 25% RDN through vermicompost F5: 50% RDN through chemical fertilizer + 25% RDN through FYM + brown manuring (coculture of Sesbania aculeata at 30 kg/ha and knocking down with the application of 2–4 D ethyl ester at 0.75 kg a.i./ha), F6: 50% RDN through chemical fertilizer + 25% RDN through vermicompost + brown manuring, F7: F5 + soil application of biofertilizer Azospirillium brassilense at 2 kg/ha, F8: F6 + soil application of biofertilizer Azospirillium brassilense at 2 kg/ha. Details of the treatments are available in the recently published first part of this article [15].

2.3. Crop Management

Pregerminated seeds of rice were directly sown at a row spacing of 20 cm × 15 cm in case of aerobic culture, whereas 12 day-aged seedlings raised from the garden-like nursery were transplanted singly at a row spacing of 25 cm × 25 cm in case of SRI and 24 day-aged seedlings were transplanted with three seedlings per hill at a spacing of 20 cm × 15 cm in case of conventional flooded culture. The entire dose of phosphorus (40 kg/ha P2O5 as single super phosphate) and potassium (40 kg/ha K2O as muriate of potash) were applied as basal and incorporated into soil uniformly in all the treatments at the time of final land preparation.
Fertilizer nitrogen at 80 kg ha−1 in the form of urea was applied in three splits, ¼ as basal, ½ at maximum tillering stage, and the remaining ¼ at panicle initiation stage in case of the treatment where plant nutrition was supplied solely from chemical fertilizer. Under INM treatments, a proportionate amount of nitrogenous fertilizer was applied, and substituted quantity of organic sources of nutrients applied 20 days before application of chemical fertilizer. The specific strain of biofertilizer was applied along with organic sources of nutrients as per treatments. Brown manuring was practiced as per standard procedure, as detailed earlier.
Two hand weedings were performed at 25 and 40 days after transplanting. All other recommended package of practices for integrated crop management for achieving maximum productivity of the crop was followed. Ten amounts of measured quantities of irrigation water at 5 cm each were applied through a water meter in case of flooded culture, whereas eight amounts of irrigation water at 2.5 cm each were applied for SRI and only four amounts of irrigation water at 2.0 cm depth were applied for aerobic culture during both the years of the experiment. Sufficient drainage channels were created in aerobic plots to minimize the influence of rainfall along with suitable buffer drainage channels to be utilized to prevent seepage of water from the flooded plots to aerobic plots, and all the main plots were bounded properly to avoid movement of water and fertilizer. Details of the experimental procedures are available in the recently published first part of this article [15].

2.4. Data and their Collection Procedures

Measurements on growth and physiological attributes and yield parameters were taken as per standard procedures. The soil and plant samples after harvest of rice under different crop cultures were analyzed chemically as per the standard procedure for estimation of nutrient content, available soil nutrient status, and microbial quality, as detailed below.
Details of initial soil fertility status were mentioned in the first part of this paper. Microbial quality of soil was measured through the activity of respiratory chain enzymes soil dehydrogenase using the Triphenylformazan method as advocated by [16]. Plant analysis for nutrient content in the crops as affected by different crop culture and integrated plant nutrition was done by digestion with conc. H2SO4 and distillation for total nitrogen, and for total P and K, Tri-acid digestion method was followed as described by [17].
Nutrient use efficiency was calculated for fertilizer use efficiency, i.e., agronomic efficiency and physiological nitrogen use efficiency and apparent nitrogen recovery (ANR).
Agronomic efficiency = (grain yield in the treated plot − grain yield in control plot)/amount of N fertilizer applied.
Physiological nitrogen use efficiency = grain yield/total nitrogen uptake.
Apparent N recovery (ANR) = ((N uptake in N treated plot) − (N uptake in control plot)/N fertilizer applied).

2.5. Statistical Analysis

Data were analyzed for the analysis of variance (ANOVA) for split-plot design replicated experiments. The treatment effects on different parameters were tested by two-way analysis of variance. The least significant difference (LSD) test, with the level of significance set at 5%, was used to test for significant differences among treatment means [18]. Statistical procedures were carried out with the software program Statistix (Statistix Inc., Tallahassee, FL, USA) [19].

3. Results

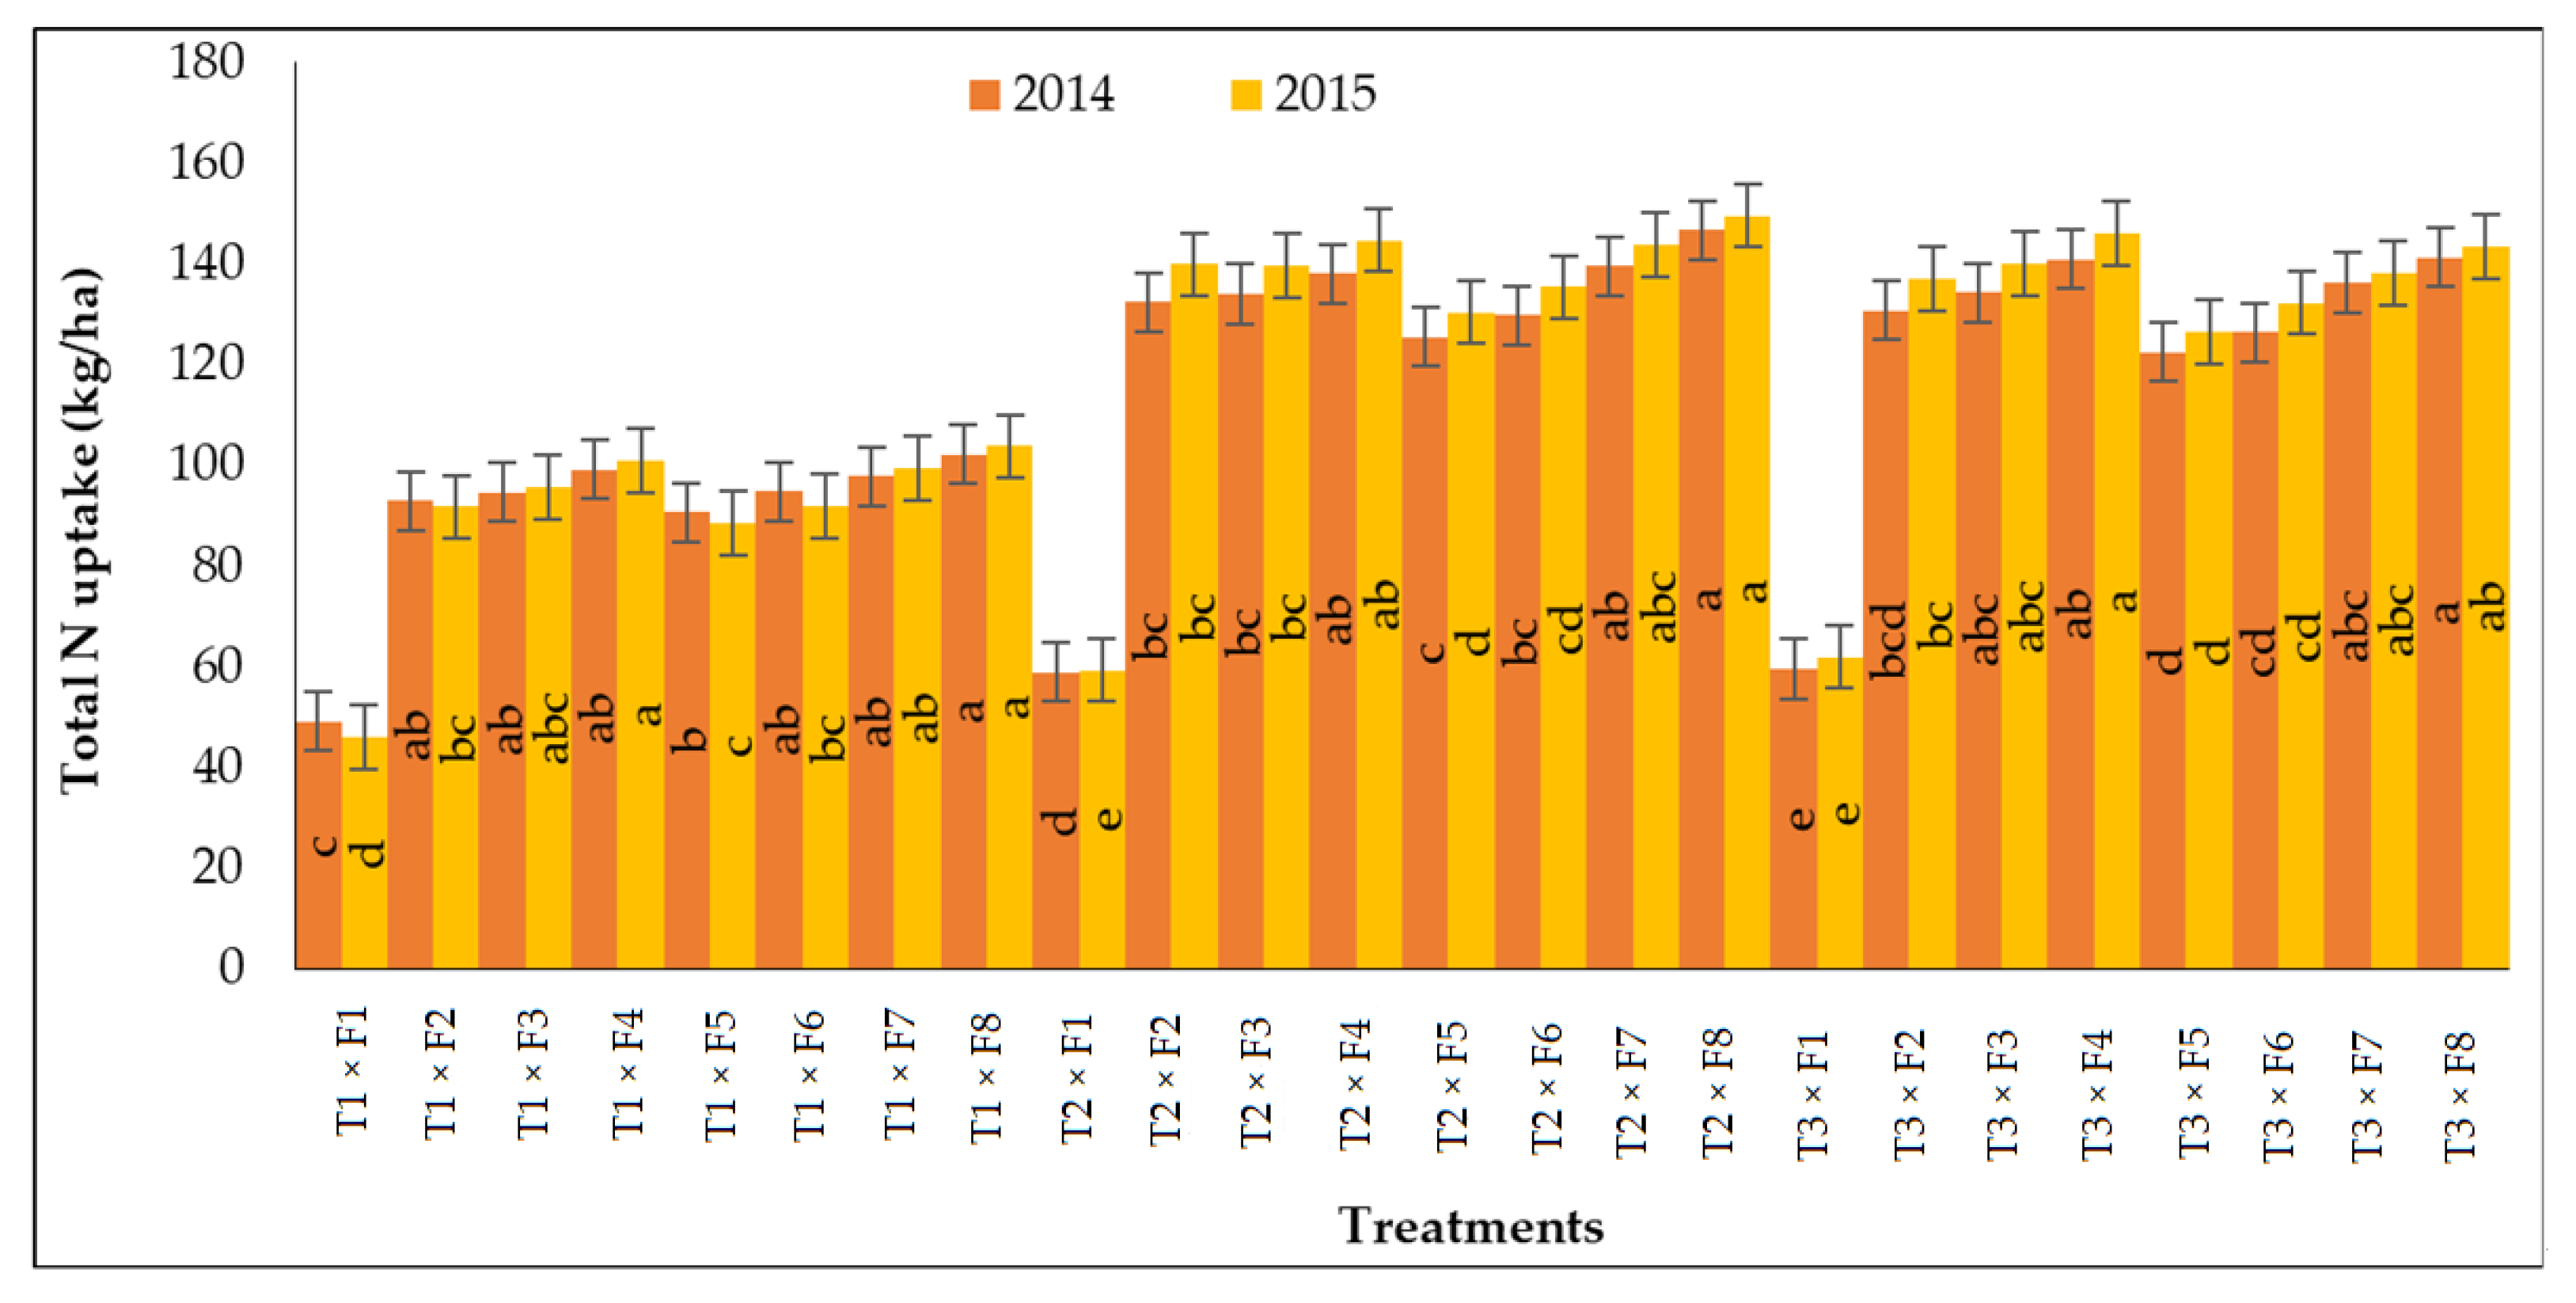
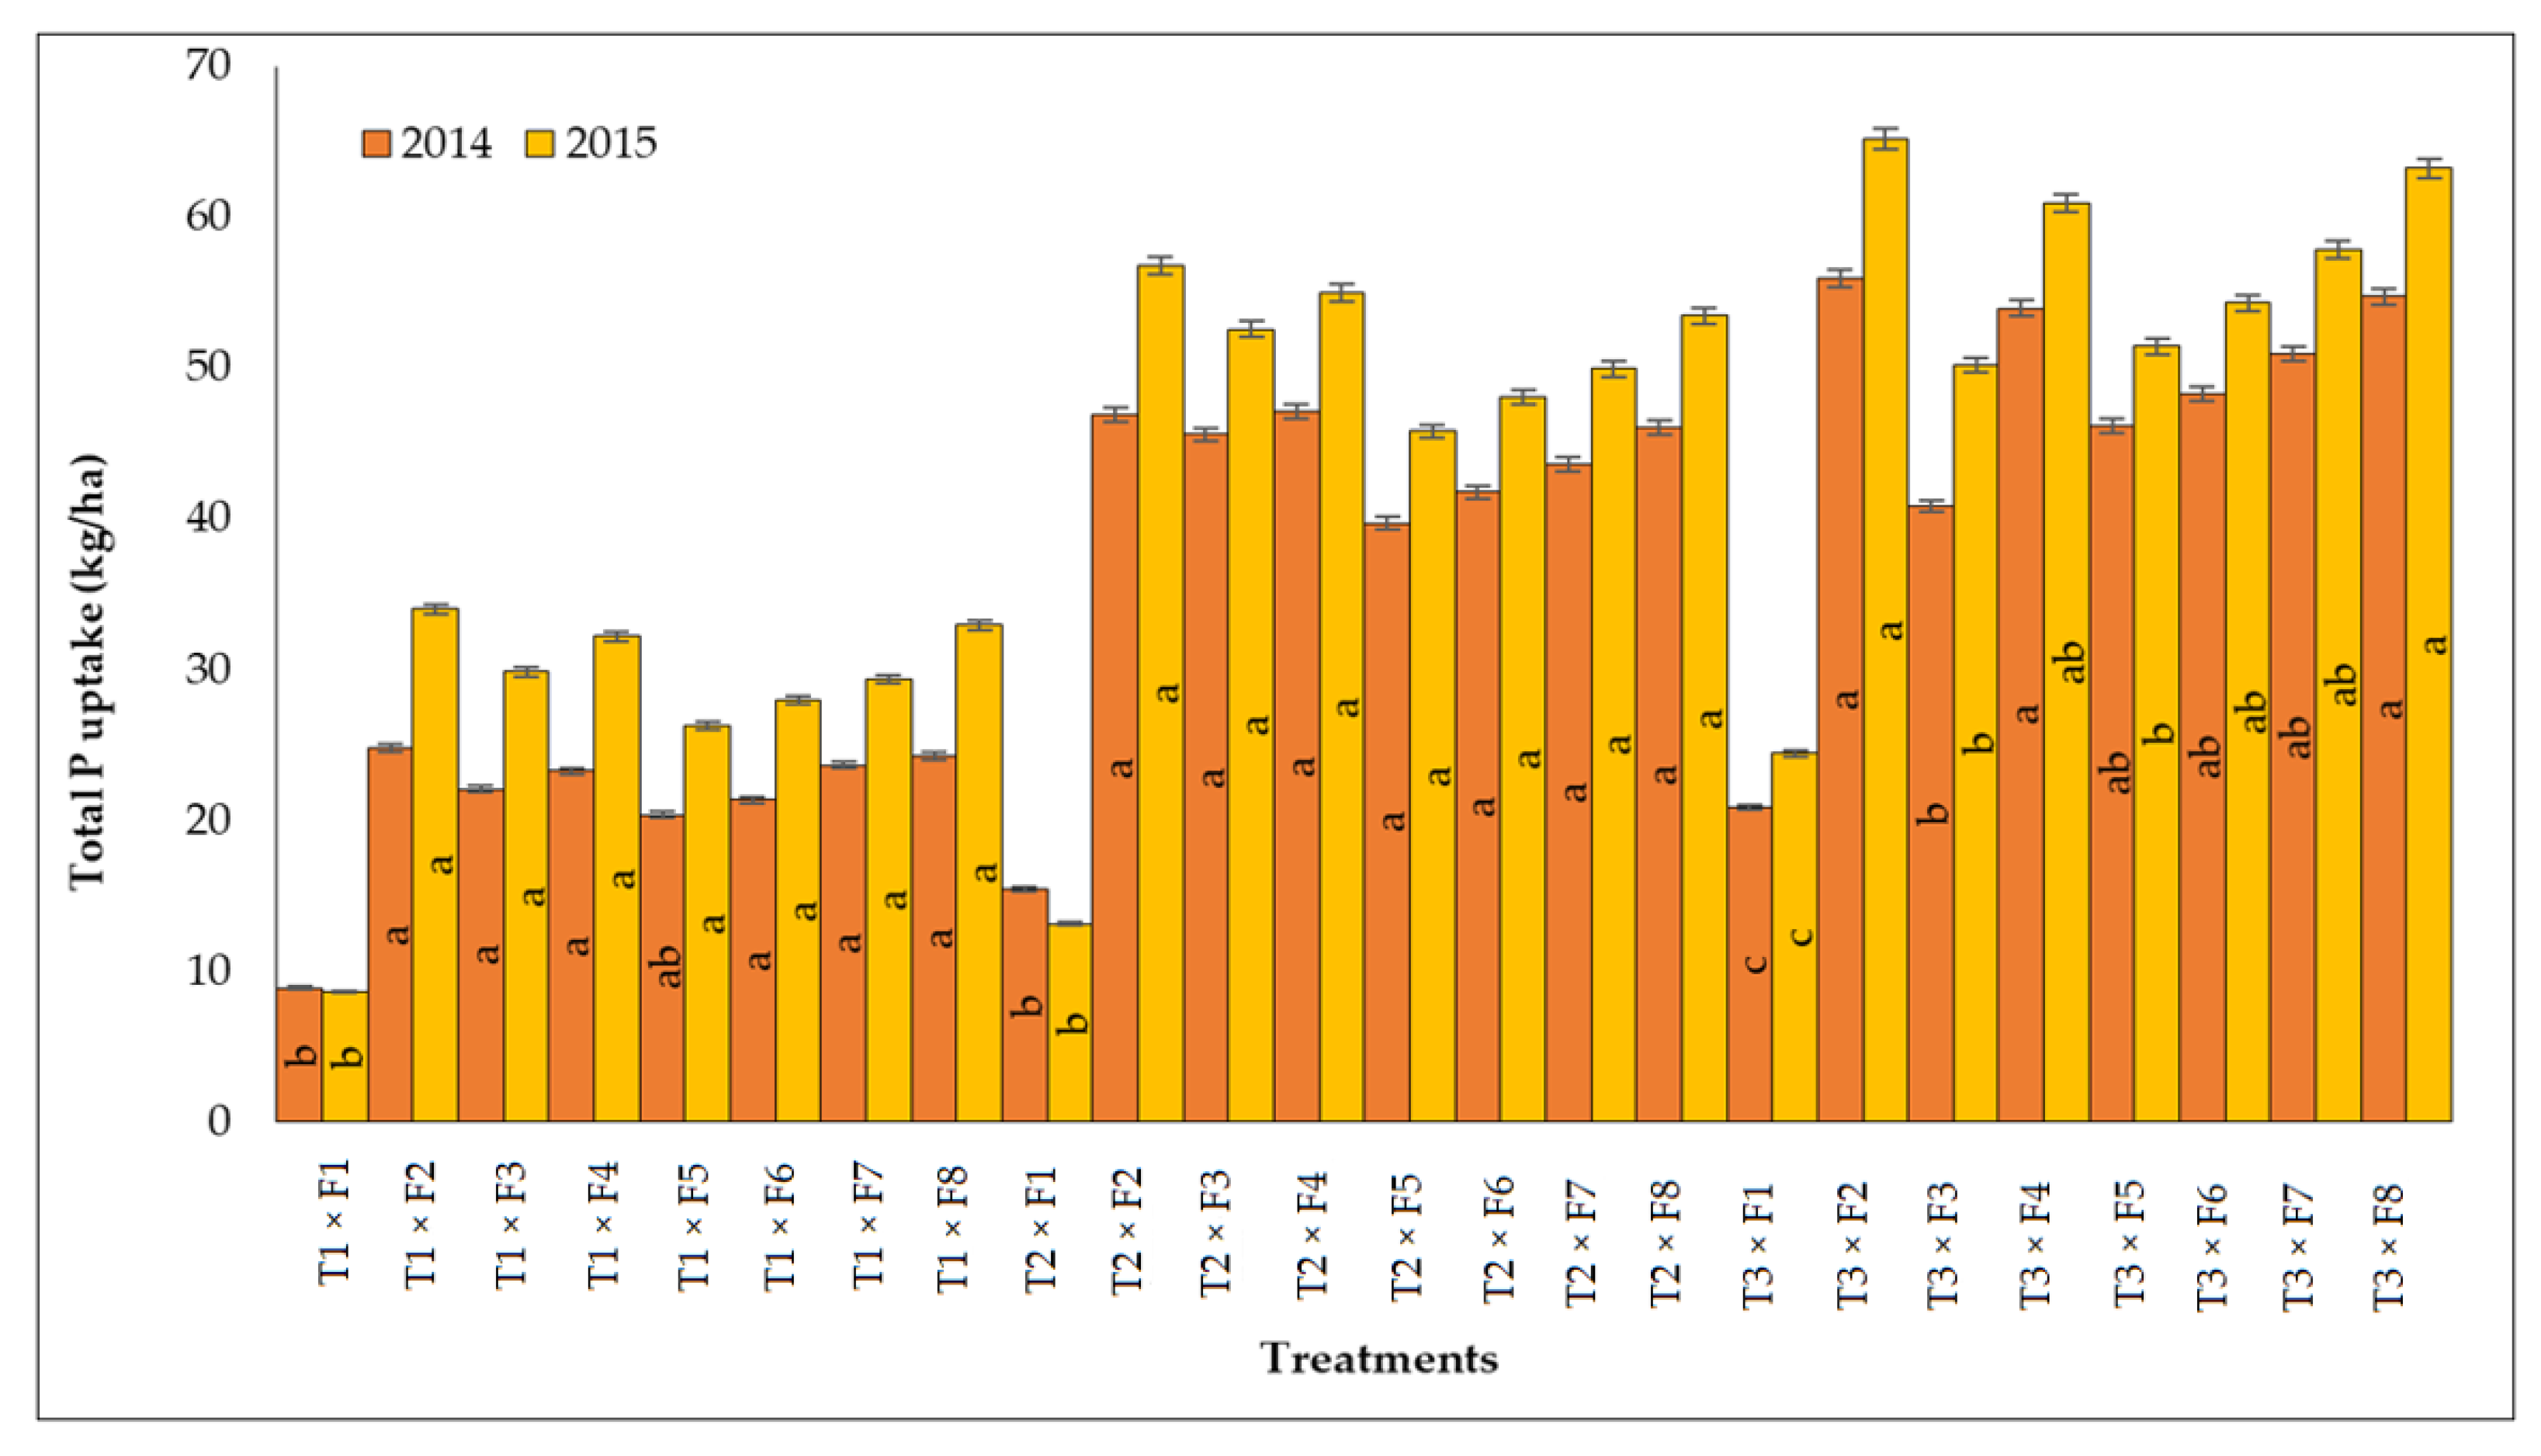
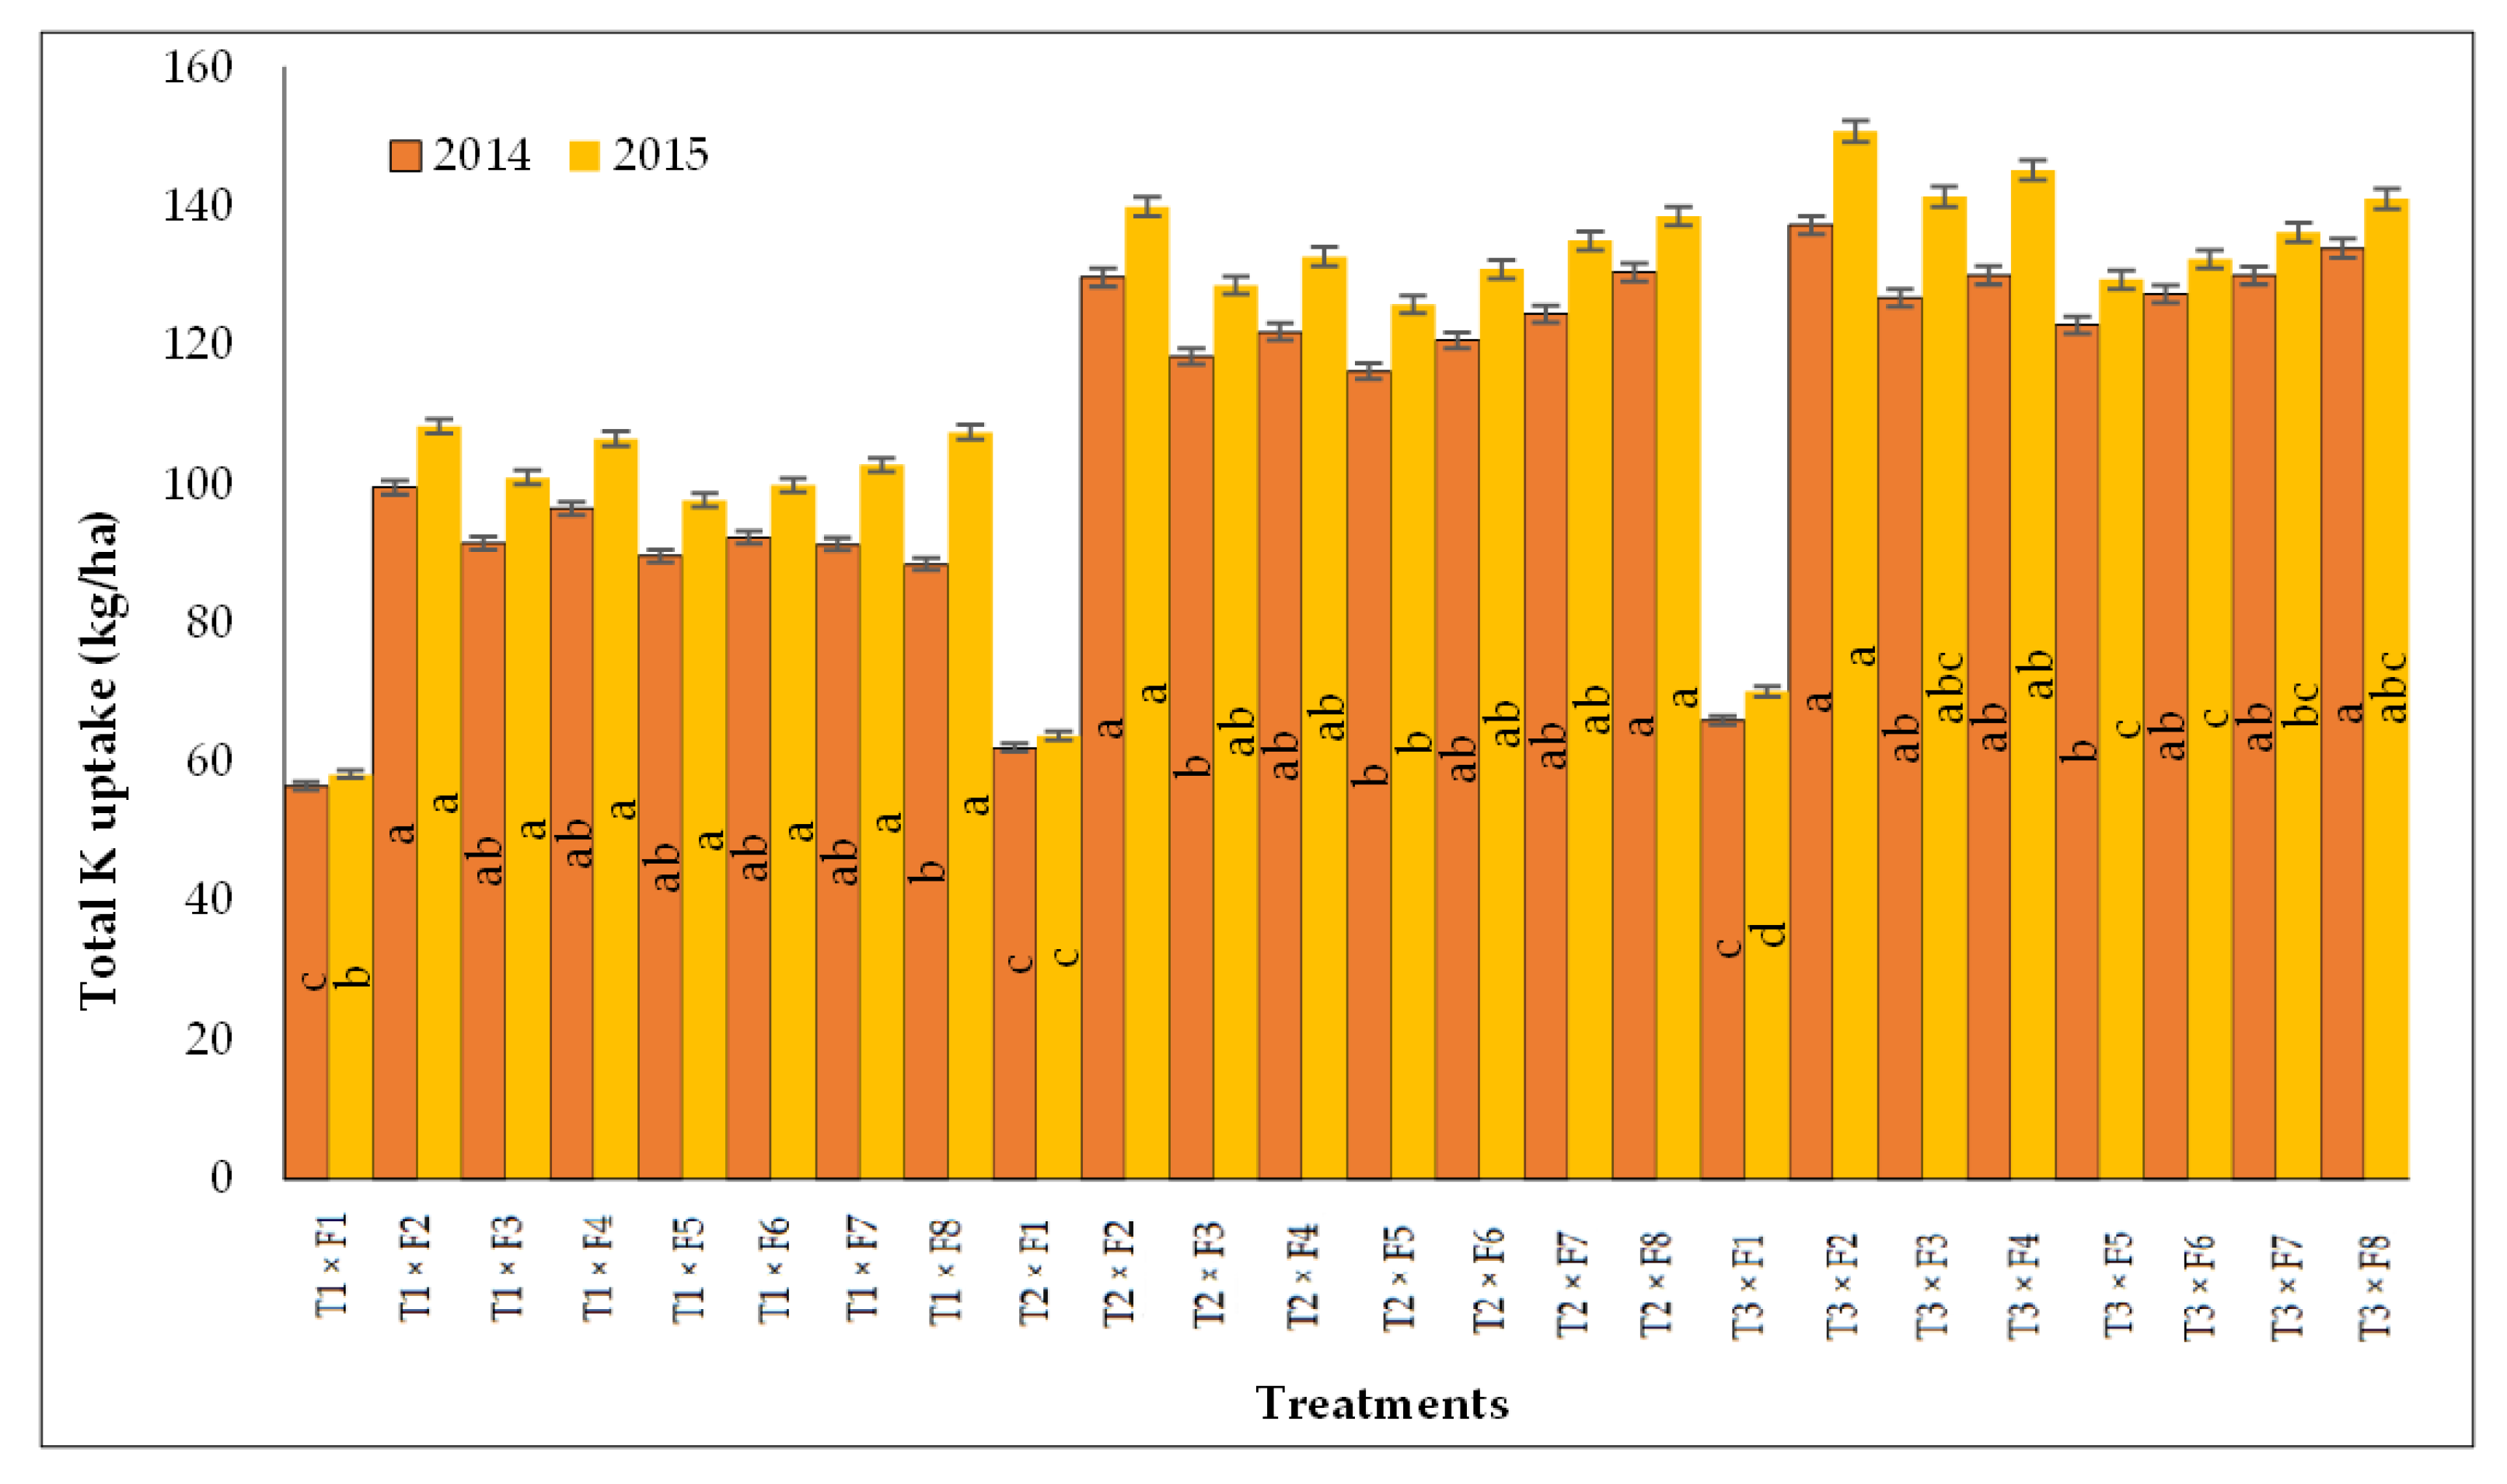
3.1. Nutrient Content and Uptake

There were no significant interactions between CEM and nutrient management treatments for nitrogen, phosphorus, and potassium content in the crops, but significant interaction effects were observed in the case of nutrient uptake by the crops. There were significant effects of crop culture and INM on total nitrogen content and uptake by the crops during both the years of the experiment (Table 1). Total nitrogen content and uptake under aerobic culture was significantly lower as compared to conventional flooded culture and System of Rice Intensification. Differences between total nitrogen content under CTR and SRI were relatively small and seldom significant; however, nitrogen uptake by the crop under SRI (131.4 kg/ha) was significantly higher over conventional culture (122.7 kg/ha). Nutrient management treatments generally caused significantly higher nitrogen content and uptake over absolute control. Total nitrogen content was higher in integrated plant nutrition compared to sole application of chemical fertilizer, although the differences were only significant under F7 and F8 only, where the highest values were 1.97 and 1.98, respectively. Averaged overcrop establishment methodologies and differences in nitrogen uptake among nutrient management treatments were statistically significant, though nitrogen uptake under the treatment where 100% RDF was applied through chemicals was significantly lower (119.7 kg/ha) than integrated plant nutrition treatments F4 (128.4 kg/ha), F7 (125.1 kg/ha), and F8 (130.1 kg/ha) only. The differences in uptake under the rest of the INM treatments were relatively small and statistically nonsignificant.
The total N uptake by rice was significantly influenced by the combined effect of CEM and INM. However, the maximum N uptake was recorded in the system of rice intensification system for all nutrient management systems, followed by the conventional flooded transplanted rice system in both seasons. The lowest uptake was recorded in the aerobic culture system (Figure 1).
Phosphorus content in grains, straw, and total phosphorus content, as well as phosphorus uptake, was significantly higher under conventional flooded culture, compared to aerobic culture and SRI during both the years of the experiment (Table 2).
In both years, phosphorus content and uptake under aerobic culture was lowest among the crop production technologies and perhaps significantly differed when compared to other crop production techniques. Total phosphorus content, as averaged for two years, in the crop grown under traditional flooded conditions was approximately 47.1% higher compared to that raised under aerobic culture. Phosphorus uptake by the crop in SRI was about 37.88% higher than the uptake noted under aerobic culture, whereas the magnitude of increment in uptake under flooded rice was about 44.77%. Although total phosphorus content in grain was significantly higher under nutrient management treatments over absolute control, phosphorus content in straw under the INM treatment F5 did not differ significantly. Total phosphorus content (0.324) and uptake (47.5) under the treatment where 100% RDF was applied through chemical sources was highest, and significant differences were observed with the integrated plant nutrition treatments, viz., F1, F3, F5, F6 and F7. The differences in phosphorus uptake and content in the integrated use of chemical fertilizer, vermicompost, brown manuring and biofertilizer with that of sole application of chemical fertilizer were nonsignificant.
Similar to N, the total uptake of P by rice was also significantly influenced by the combined effect of CEM and INM. However, with little exception, significantly similar, and the maximum, P uptake was recorded in both conventional flooded transplanted rice system and SRI system for all nutrient management systems in both years. However, the lowest uptake was recorded in the aerobic culture system for all nutrient management treatments (Figure 2).
As far as potassium content and uptake is concerned, aerobic culture had significantly lower nutrient content and uptake, compared to two other crop production techniques (Table 3). Potassium content and uptake under the SRI and traditional flooded culture was nonsignificant and inconsistent. Potassium uptake under 100% RDF through chemical fertilizer and integrated plant nutrition package, as followed in F4 and F8, did not differ significantly, whereas other nutrient management treatments had a significant impact on potassium content and uptake. There were no statistical differences in potassium content and uptake among F3, F5, and F6.
Similar to N and P, the total uptake of P by rice was also significantly influenced by the combined effect of CEM and INM. Although nutrient management was varied in different CES systems, significantly similar, and the maximum, K uptake was recorded in SRI and conventional flooded transplanted rice systems in both years. Aerobic rice cultural system always showed the minimum uptake of K compared to the other two systems (Figure 3).

3.2. Nutrient Use Efficiency

Significant interaction effect between crop culture and INM was observed for fertilizer use efficiency during both the years of the experiment (Table 4). Fertilizer use efficiency or agronomic efficiency of rice recorded under this experiment was significantly higher in SRI (5.93) compared to aerobic culture (3.81) and conventional flooded culture (5.27). Fertilizer use efficiencies of the crop under all INM treatments were numerically higher, as compared to 100% RDF, and significant differences were noted for all integrated plant nutrition treatments except F5 and F6.
Physiological nitrogen use efficiency of rice ranged from 47.33 kg grain kg−1 of nitrogen uptake in the case of SRI to 54.26 kg grain kg−1 of nitrogen uptake in the case of aerobic rice. There was no significant interaction between crop establishment methodologies and INM for physiological nitrogen use efficiencies of the crop during 2014–2015 and 2015–2016. Physiological nitrogen use efficiency of rice was highest under 100% RDF and tended to decrease in the case of INM treatments, although the differences were marginal and not statistically significant, except the nutrient management treatment F8 where 50% RDN was substituted and vermicompost, brown manuring, and a specific strain of biofertilizer were applied. Significant interaction effects between crop culture and nutrient management treatments were observed in the case of apparent nitrogen recovery (ANR) values of the crop. Apparent nitrogen recovery of rice under aerobic rice culture was significantly lower (0.82) compared to flooded rice, and SRI registered the highest numerical apparent nitrogen recovery value (1.41), whereas the difference in ANR values between SRI and conventional flooded rice was marginally small and nonsignificant. Apparent nitrogen recovery values in rice under integrated plant nutrition, irrespective of crop culture, was significantly higher when compared to absolute control and 100% RDF. The highest ANR value (1.41: pooled for two years) was achieved under integrated use of chemical fertilizer, brown manuring vermicompost, and application of Azospirillium brassilense, i.e., F8, which also significantly differed from other integrated plant nutrition treatments. The ANR values ranged from 0.57, in the case of absolute control, to 1.41, in the case of INM treatment (F8).

3.3. Post-Harvest Soil Status Affecting Soil Quality

3.3.1. Effect on N, P, and K Status

The interaction effect between CEM and INM was found to be nonsignificant in relation to available N, P, and K status of soil after harvest of the crop (Table 5).
However, available nitrogen status of 326 kg/ha and 287 kg/ha, respectively, during the consecutive two years of the experiment was highest under SRI, which significantly differed from available nitrogen status recorded under aerobic culture and conventional transplanted rice. The lowest numerical values of available nitrogen status of 293.8 kg/ha 260.3 kg/ha, as registered under aerobic culture, were attributable to loss of higher magnitude of nitrogen due to more losses through the nitrification–denitrification process. All the nutrient management treatments significantly improved the available nitrogen status in soil over control, but the highest available nitrogen status was observed under INM treatment F7 with mean available nitrogen status of 297.7 kg/ha, which was significantly different from F1, F2, F3, F4, F5, and F6, but on par with F8.
Available phosphorus status in soil was significantly affected by CEM and INM. The highest available phosphorus statuses of 80.9 kg/ha and 67.7 kg/ha, respectively, were observed under conventional transplanted rice, which significantly differed from phosphorus status recorded under aerobic culture but were on par with the values registered under SRI. Naturally, the available phosphorus status in soil was significantly lower under control during both the years of the experiment when compared with the nutrient management practices. Although the highest available phosphorus status was noted under INM treatment F7, the treatment was on par with other nutrient management practices.
Similar to the phosphorus status of soil, the highest available potassium status was observed under conventional transplanted rice, which was significantly higher than the nutrient status as observed under aerobic culture and System of Rice Intensification. The highest available potassium status of 276.3 kg/ha and 267.6 kg/ha, respectively, were recorded under F2 treatment (100% RDF) during the consecutive two years of the experiment, which significantly differed from F1 (absolute control) only, while other INM treatments remained on par.

3.3.2. Effect on Soil pH, Organic Carbon, and Micronutrients

The pH values recorded under the experiment did not show any significant variation in CEM and INM during both the years of the experiment (Table 6). The lowest pH values of 6.81 and 6.90, respectively, under aerobic culture, and highest corresponding pH values of 7.07 and 7.19, respectively, during 2014–2015 and 2015–2016 were noticed under conventional transplanted rice as soil pH approached neutral equilibrium due to submergence, whereas soil pH under aerobic situation could not approach neutrality due to positive soil redox potential. Significant and considerable changes in pH also were not observed among the nutrient management treatment and absolute control. The organic carbon status of soil was significantly influenced both by CEM and INM. SRI exhibited significantly higher organic carbon status over aerobic culture, but organic carbon status recorded under conventional transplanted rice was on par with SRI. Significantly higher organic carbon status was registered in all nutrient management treatments over control. The highest organic carbon contents of 0.74% and 0.78%, respectively, during 2014–2015 and 2015–2016 were observed under INM treatment F8, differing significantly from F1, F2, F3, F4, F5, F6, and F7. Interestingly, the treatments that received 50% RDN through chemical fertilizer, 25% RDN through either FYM or vermicompost, brown manuring, and biofertilizer, i.e., F7 and F8, registered higher organic carbon status over the rest of the treatments owing to the synergistic effect of inorganic fertilizer, organic sources, and biofertilizer in a synchronized manner. A relatively lower magnitude of organic carbon was noticed under F2, where 100% RDN was applied through chemical fertilizer. The highest available iron status of 13.44 parts per million and 14.46 parts per million, respectively, was recorded in the soil after harvest of rice under the conventional transplanted condition that significantly differed from aerobic culture and system of rice intensification. Available iron status after harvest of rice under aerobic culture was only 10.70 parts per million and 10.09 parts per million, respectively, during 2014–2015 and 2015–2016. Among INM treatment, F6 registered the highest available iron status in soil, with the numerical mean value of 13.52 parts per million, which significantly differed from F1, F2, F3, and F4, but was on par with F5, F7, and F8. Astonishingly, higher available Fe status was observed in the INM treatments where brown manuring was practiced.
Available Zn status in soil was significantly higher under aerobic culture, where 1.46 parts per million and 1.49 parts per million (ppm) Zn was recorded during 2014–2015 and 2015–2016, respectively, which was significantly higher than available Zn status as recorded under SRI and conventional flooded rice. INM treatment F3 recorded the highest available Zn status of 1.39 ppm and 1.43 ppm, respectively, which significantly differed from F1 and F2; however, the rest of the treatments were on par. Higher available Zn status, as observed under treatments receiving integrated plant nutrition, may be due to the effect of organic matter on chelation. However, the interaction effect of CEM and INM was not significant in respect to pH, organic carbon, and available micronutrients (Fe and Zn) status of the soil.

3.3.3. Effect on Soil Dehydrogenase Activity

Soil dehydrogenases are respiratory chain enzymes generally present in every upper layer of soils, and activities of the enzymes are generally used as an indicator of the biological redox system as a measure of microbial activity in the soil, and thus are used to assess microbial soil quality. Although the interaction effect of CEM at different INM was found to be nonsignificant during both the years of the experiment, soil dehydrogenase activities at different growth stages of crop was significantly affected by CEM and INM (Table 7).
Significantly higher soil dehydrogenase activity was observed under SRI over other CEM at tillering stage. Conventional transplanted rice culture registered the lowest values of soil dehydrogenase activities among the CEM but was on par with aerobic culture. Significantly higher dehydrogenase activities were noticed under all nutrient management treatments, compared to absolute control where no nutrient was supplied to rice crop. The highest values of soil dehydrogenase activities of 179.0 and 173.2 microgram Triphernylformazan (TPF)/g soil/h during 2014–2015 and 2015–2016, respectively, were found in INM treatment F4, which significantly differed from F1, F2, F5, F6, F7, and F8 at this stage of the crop.
Irrespective of crop culture and INM practices, the soil dehydrogenase activities reached at its peak at the flowering stage. During the flowering stage of the crop, soil dehydrogenase activity, as observed under aerobic culture, was 194.8 and 186.2 microgram TPF/g soil/hour, respectively, in 2014–2015 and 2015–2016; in SRI, the corresponding values were 205.3 micrograms TPF/g soil/hour and 191.4 micrograms TPF/g soil/hour, respectively, whereas conventional transplanted rice recorded the lowest enzymatic activities of 187.3 micrograms TPF/g soil/hour and 179.3 micrograms TPF/g soil/hour, respectively. All INM treatments significantly enhanced soil dehydrogenase activities in soil, as compared to absolute control and application of 100% recommended dose of chemical fertilizer. F8 treatment, which received integrated use of chemical fertilizer, vermicompost, brown manuring, and biofertilizer, recorded the highest soil dehydrogenase activities of 217.4 micrograms TPF/g soil/hour and 209.3 micrograms TPF/g soil/hour during 2014–2015 and 2015–2016, respectively, and this treatment was immediately followed by F7. As the crop progressed to maturity and harvest, the soil dehydrogenase activities declined progressively under different CEM and INM. At harvest, the INM treatments also registered significantly higher soil dehydrogenase activities than absolute control and the treatment where 100% RDF was applied.

4. Discussion

Nutrient content, uptake, and use efficiency were lower [20] under aerobic culture compared to other crop establishment methodologies due to loss of nutrients within the agro–ecosystem and environment. SRI, having potential for better resource use, proved to be the most efficient waterwise rice production technology for better nutrient content, uptake, and use efficiency, and conventional flooded culture was intermediate between SRI and aerobic culture in terms of nutrient content, uptake, and use efficiency. The growth of aerobic rice and nitrogen uptake can be improved through soil acidification. There should be site-specific technology for aerobic culture regarding nutrient management for nutrient use efficiency and yield enhancement. When urea is applied at seeding, urea-induced ammonia toxicity causes poor growth of aerobic rice [21,22], and monocropped aerobic rice also experiences a poor growth pattern due to loss of ammonia after urea application in high pH conditions due to ammonia volatilization. Selection of the right nitrogen source, such as ammonium sulphate, where volatilization occurs at a less constant rate compared to urea, significantly increases growth parameters of aerobic rice [23], reduces soil pH up to 6.0, and increases plant micronutrient content (Fe, Mn, Zn) and plant growth. Application methodologies such as the deep placement of urea, at a depth of 5.0 cm in soil, significantly reduce nitrogen loss by ammonia volatilization and slow-releasing nitrogen. Reduced soil pH induced by the change in soil redox under aerobic situations was observed from the experiment. Reduction in soil pH under aerobic soil due to acidification is reported by Kreye et al. [24], and the situation is relevant in the context of continuous cropping obstacles of aerobic culture, also documented by different researchers. The lowest magnitude of organic carbon as observed under aerobic culture may be due to the loss of organic matter induced by rapid decomposition.
Nutrient content, uptake, and use efficiency under integrated plant nutrition, irrespective of crop culture, was higher compared to sole application of chemical fertilizer, owing to better availability of nitrogen due to application of organic sources and biofertilizer that ultimately triggered better nitrogen content both in grains and straw [25]; however, phosphorus content and uptake that was relatively lower under INM treatments, compared to sole application of chemical fertilizer, may be due to the reason that phosphorus is released slowly under organic sources of nutrients, and amount of nutrients contained in it may not be available during single crop season, and residual beneficial effect may be reflected in the cropping system.
Available nitrogen status was observed as higher under INM treatments F7 and F8 due to conjunctive use of chemical fertilizer, FYM/vermicompost, brown manuring, and biofertilizer, which maintained higher magnitude of available nitrogen status in soil even after crop uptake from soil. This combination of INM treatments perhaps ideally fitted for a better harvest of the crop and maintaining soil fertility, whereas the relatively lower magnitude of available nitrogen status was recorded under F2, i.e., treatment receiving sole application of chemical fertilizer owing to maximum removal by the crop within the current season without sufficient replenishment within the soil from other sources of nutrients or soil nutrient pool. Higher phosphorus status under flood-irrigated rice may be due to increased availability of Fe-phosphates and occluded phosphorus under submerged conditions, and as a consequence of flooding, reduction of Fe3+ and Mn4+ ions take place, their concentration in soil solution is increased, and these ions exchange with K on exchange complex of clay minerals leading to increased availability of native potassium. This explanation of the increased availability of K under flooded rice culture is also supported by Nad and Goswami [26]. Higher available K status recorded under F2 over INM treatments may be due to better availability and release of potassium under chemical fertilizer in current cropping season as release pattern of nutrients from organic sources are relatively slow, for which the impact may be realized on long-term perspective during succeeding cropping season.
Aerobic soil is diverse in nature. Soil pH under conventional puddle-transplanted rice approaches neutral equilibrium, which offers great opportunities for rice cultivation under varied agro–ecosystem. Moreover, conventional puddle-transplanted rice has a beneficial effect on soil chemical fertility, favoring better availability of nutrients, organic matter accumulation, and biological N fixation to supplement the crop’s additional N [27], but aerobic rice soil cannot approach neutrality for positive redox potential, deterring the availability of Fe and Mn. Rice plant in aerobic soil suffers from inadequacy in mineral nutrition as nutrient transport to soil via mass flow and diffusion slow down due to reduced soil moisture regime and higher heat capacity of soil moisture.
As envisaged from the experimental result, the shift in rice culture to the aerobic situation recorded the lowest available Fe status in soil. Lower availability of iron, and iron deficiency, as the common nutritional problem is also documented by Rong-li et al. [28], where it was established that amounts of phytosiderophores released from aerobic rice do not increase under Fe deficiency condition, and ferric ion reducing capacity does not increase. The experimental findings are very much relevant in the pretext of promoting water-saving aerobic rice technologies in rice-based triple cropping systems under the scenario of shrinking water resource base, where special attention of Fe nutrition in rice is to be assured to avoid Fe malnutrition in crop, as well as in the human food chain. Foliar application of Fe is one of the current crop management strategies in aerobic rice [29], besides soil application, cropping system, and appropriate breeding strategies for iron-enriched rice crops and varieties for improving nutritional qualities and biofortification for benefit of human civilization to alleviate human micronutrient malnutrition [30]. Integrated crop management strategies overcome the problem of Fe deficiency in rice. The integrated plant nutrition treatment where brown manuring was included as a component exhibited relatively higher available Fe status in soil. This finding has close proximity with that of Yadav et al. [6], where aerobic rice culture with Sesbania mulch and iron fertilization increased the production of aerobic rice with adequate iron nutrition and available Fe status. However, the role of Sesbania mulch in aerobic rice for enhancing yield or available Fe status in soil after harvest of crop needs to be studied for final confirmation of conclusion. With respect to available Zn status in soil, significantly higher available Zn status was recorded under aerobic culture over the other two CEM. The findings partly corroborate those of Saha et al. [31], where the significant change of micronutrient status was observed up to 90 DAS stage, but after harvest, although numerical values were higher, the difference was nonsignificant.
Soil dehydrogenase activity assesses microbial soil quality and depends on the intensity of biological conversion of organic compounds. Relatively fewer dehydrogenase activities, as recorded under conventional flooded rice during tillering and flowering stage over other CEM, may be due to slower enzymatic activities under anaerobic situation which prevailed under submergence. Higher dehydrogenase activities, as observed under INM treatment, were due to enhanced microbial activities due to brown manuring and application of organic matter [32] and biofertilizer, as activity of dehydrogenase depends on the metabolic activity of soil biota and significantly correlates with soil biomass carbon in organically amended soil [33].
There is no doubt that SRI is one of the best options in terms of soil health, nutrient efficiency, and nutrient uptake where a controlled irrigation facility is available, but under the submerged and partially flooded conditions of lower IGP, the conventional flooded method seems to be the most feasible method for farmers. However, for the limited and controlled water conditions, the aerobic method can be suitable if specially bred cultivars are adopted. The study clearly revealed that for sustainable rice cultivation under an intensive cropping system of the lower IGP, the practice of INM should be adopted, targeting soil quality and nutrient use efficiency. Furthermore, for INM, based on local availability, the sources of organic nutrients can be chosen preferably with biofertilizer.
The crop performance of rice under different establishment methods may vary with variety and micro-situation. Hence, there is enough scope for testing different varieties under specific situations considering the vastness of the lower IGP. The quality parameters of an organic source of nutrients and biofertilizer are not accurately maintained, which may bring inconsistency in results. Furthermore, different biofertilizer application methods (namely, seed inoculation, seedling dip, and soil application) can be studied to find the efficiency under different rice establishment methods. In this regard, other biofertilizers can also be tested alone or as consortia.

5. Conclusions

For optimization of crop and water productivity, water-saving rice technologies are becoming inevitable in the tropics as a paradigm shift under the backdrop of shrinking water and other resource bases. However, the shift in production technologies have some adverse impacts on nutrient uptake, use efficiency, crop quality, and some micronutrient deficiencies, especially Fe, under the aerobic situation that may pose a serious threat to Fe malnutrition in the cereal-based food chain if aerobic rice is continuously cropped in rice-based multiple cropping systems. However, under the alluvial soils of the Indo-Gangetic Plains of Eastern India, SRI is still proved to be an environmentally benign water-saving production method in terms of nutrient uptake and efficiency, as well as soil quality parameters, if proper INM is followed. Interestingly, brown manuring, biofertilizer, and other locally available bio-resources are gaining importance in plant nutrition under alternative rice production technologies. As a consequence of such a situation, suitable crop management strategies to be chalked out, encompassing crop improvement, nutrient biofortification, rational and integrated soil and nutrient management, and long-term cropping system management, which are going to be indispensable before promoting waterwise and water-saving rice production methodologies.

Author Contributions

Conceptualization, A.M., B.K.S., J.K.D., S.M., S.P. and D.J.G.; methodology, A.M., B.K.S. and J.K.D.; formal analysis, A.M., S.M. and A.H.; data curation, A.M., S.M. and A.H.; statistical expertise, A.M., S.M. and A.H.; writing—original draft preparation, A.M., B.K.S., J.K.D. and D.J.G.; writing—review and editing, S.M., A.G., M.A. and A.H.; visualization, A.M., B.K.S. and J.K.D.; supervision, B.K.S.; project administration, B.K.S., A.G., M.A. and A.H.; funding acquisition, B.K.S., A.G., M.A. and A.H. All authors have read and agreed to the published version of the manuscript.

Funding

This research was funded by the Taif University Researchers Supporting Project number (TURSP-2020/257), Taif University, Taif, Saudi Arabia for funding the research.

Data Availability Statement

The data that support the findings of this study are available from the corresponding authors upon reasonable request.

Acknowledgments

The authors also extend their appreciation to the Taif University Researchers Supporting Project number (TURSP-2020/257), Taif University, Taif, Saudi Arabia for funding the research.

Conflicts of Interest

The authors declare no conflict of interest.

References

  1. Kubo, M.; Purevdorj, M. The future of rice production and consumption. J. Food Distrib. Res. 2004, 35, 128–142. [Google Scholar]
  2. Rana, N.; Rahim, M.S.; Kaur, G.; Bansal, R.; Kumawat, S.; Roy, J.; Deshmukh, R.; Sonah, H.; Sharma, T.R. Applications and challenges for efficient exploration of omics interventions for the enhancement of nutritional quality in rice (Oryza sativa L.). Crit. Rev. Food Sci. Nutri. 2020, 60, 3304–3320. [Google Scholar] [CrossRef] [PubMed]
  3. Lal, B.; Gautam, P.; Joshi, E. Different rice establishment methods for producing more rice per drop of water: A review. Int. J. Res. Biosci. 2013, 2, 1–12. [Google Scholar]
  4. Midya, A.; Saren, B.K.; Pramanik, K. Aerobic rice culture, System of Rice Intensification (SRI) and System of Assured Rice Production (SARP): Emerging water savings production technologies for rice yield stability in tropics under shrinking water resource base. In Proceedings of the Souvenir paper of 1st International Conference on Bio-resource, Environment and Agricultural Sciences, Visva-Bharati, West Bengal, India, 4–6 February 2017; pp. 61–66. [Google Scholar]
  5. Man, Y.; Wang, B.; Wang, J.; Slaný, M.; Yan, H.; Li, P.; El-Naggar, A.; Shaheen, S.M.; Rinklebe, J.; Feng, X. Use of biochar to reduce mercury accumulation in Oryza sativa L: A trial for sustainable management of historically polluted farmlands. Environ. Int. 2021, 153, 106527. [Google Scholar] [CrossRef] [PubMed]
  6. Yadav, G.S.; Shivay, Y.S.; Kumar, D.; Babu, S. Enhancing iron density and uptake in grain and straw of aerobic rice through mulching and rhizo-foliar fertilization of iron. Afr. J. Agric. Res. 2013, 8, 5447–5454. [Google Scholar] [CrossRef]
  7. Kassam, A.; Stoop, W.; Uphoff, N. Review of SRI modifications in rice crop and water management and research issues for making further improvements in agricultural and water productivity. Rice Water Environ. 2011, 9, 163–180. [Google Scholar] [CrossRef]
  8. Shahane, A.A.; Shivay, Y.S.; Prasanna, R.; Kumar, D. Nutrient removal by rice–wheat cropping system as influenced by crop establishment techniques and fertilization options in conjunction with microbial inoculation. Sci. Rep. 2020, 10, 1–20. [Google Scholar] [CrossRef]
  9. Das, T.K.; Bhattacharyya, R.; Sharma, A.R.; Das, S.; Saad, A.A.; Pathak, H. Impacts of conservation agriculture on total soil organic carbon retention potential under an irrigated agro-ecosystem of the western Indo-Gangetic Plains. Eur. J. Agron. 2013, 51, 34–42. [Google Scholar] [CrossRef]
  10. Midya, A.; Saren, B.K. Effect of brown manuring in Integrated Crop Management (ICM) for sustainable rice production. In Proceedings of the National Symposium on Recent Trends in Agriculture and Allied Science for Better Tomorrow. (NSRTAS-2016), Visva-Bharati, West Bengal, India, 4 December 2016. [Google Scholar]
  11. Maitra, S.; Zaman, A. Brown manuring, an effective technique for yield sustainability and weed management of cereal crops: A review. Int. J. Biores. Sci. 2017, 4, 1–6. [Google Scholar] [CrossRef] [Green Version]
  12. Maitra, S.; Zaman, A.; Mandal, T.K.; Palai, J.B. Green manures in agriculture: A review. J. Pharm. Phytochem. 2018, 7, 1319–1327. [Google Scholar]
  13. Trivedi, P.; Delgado-Baquerizo, M.; Anderson, I.C.; Singh, B.K. Response of soil properties and microbial communities to agriculture: Implications for primary productivity and soil health indicators. Front. Plant. Sci. 2016, 7, 990. [Google Scholar] [CrossRef] [Green Version]
  14. Tahat, M.M.; Alananbeh, K.M.; Othman, Y.A.; Leskovar, D.I. Soil health and sustainable agriculture. Sustainability 2020, 12, 4859. [Google Scholar] [CrossRef]
  15. Midya, A.; Saren, B.K.; Dey, J.K.; Maitra, S.; Praharaj, S.; Gaikwad, D.J.; Gaber, A.; Alsanie, W.F.; Hossain, A. Crop Establishment Methods and Integrated nutrient management Improve: Part I. Crop Performance, Water Productivity and Profitability of Rice (Oryza Sativa L.) in the Lower Indo-Gangetic Plain, India. Agronomy 2021, 11, 1860. [Google Scholar] [CrossRef]
  16. Casida, L.E., Jr.; Klein, D.A.; Santoro, T. Soil Dehydrogenase activity. Soil Sci. 1964, 98, 371–376. [Google Scholar] [CrossRef]
  17. Jackson, M.L. Soil Chemical Analysis; Prentice Hall of India Pvt. Ltd.: New Delhi, India, 1973. [Google Scholar]
  18. Gomez, K.A.; Gomez, A.A. Statistical Procedure for Agricultural Research, 2nd ed.; Wiley: New York, NY, USA, 1984. [Google Scholar]
  19. Statistix 10 for Windows. Analytical Software. Tallahassee, FL, USA, 1998. Available online: https://www.statistix.com/freetrial/ (accessed on 1 July 2021).
  20. de Borja Reis, A.F.; Vasconcelos, A.L.S.; de Almeida, R.E.M.; Lago, B.C.; Dias, C.T.S.; Favarin, J.L. Relationship of nitrogen and crop performance in aerobic rice and continuous flooding irrigation in weathered tropical lowland. Eur. J. Agron. 2018, 95, 14–23. [Google Scholar] [CrossRef]
  21. Haden, V.R.; Xiang, J.; Peng, S.B.; Bouman, B.A.M.; Visperas, R.M.; Ketterings, Q.M.; Hobbs, P.; Duxbury, M.J. Relative effects of ammonia and nitrite on the germination and early growth of aerobic rice. J. Plant. Nutr. Soil Sci. 2011, 174, 292–300. [Google Scholar] [CrossRef]
  22. Qi, X.; Wu, W.; Peng, S.; Shah, F.; Huang, J.; Cui, K.; Liu, H.; Nie, L. Improvement in early seedling growth of dry direct seeded rice by urease inhibitor application. Aust. J. Crop. Sci. 2012, 6, 525–531. [Google Scholar]
  23. Xiang, J.; Haden, V.R.; Peng, S.; Bouman, B.A.M.; Huang, J.; Cui, K.; Visperas, R.M.; Zhu, D.; Zhang, Y.; Chen, H. Effect of deep placement of nitrogen fertilizer on growth, yield and nitrogen uptake of aerobic rice. Aust. J. Crop. Sci. 2013, 7, 870–877. [Google Scholar]
  24. Kreye, C.; Bouman, B.A.M.; Castañeda, A.R. Possible causes of yield failure in tropical aerobic rice. Field Crops Res. 2009, 111, 197–206. [Google Scholar] [CrossRef]
  25. Gautam, P.; Sharma, G.D.; Rana, R.; Lal, B. Effect of Integrated nutrient management and spacing on growth parameters, nutrient content and productivity of rice under system of rice intensification. Int. J. Res. Biosci. 2013, 2, 53–59. [Google Scholar]
  26. Nad, B.K.; Goswami, N.N. Potassium availability as affected its application to rice at two moisture regimes on laterite soils. J. Indian Soc. Soil Sci. 1981, 29, 481–485. [Google Scholar]
  27. Kirk, G.J.D. The Biogeochemistry of Submerged Soils; John Wiley and Sons: Chichester, UK, 2004; p. 291. [Google Scholar]
  28. Rong-li, S.; Hong-mei, H.; Xiao-yun, F.; Karim, R.M.; Fu-suo, Z.; Chun-qin, Z. Response of aerobic rice (Oryza sativa L.) to iron deficiency. J. Integr. Agric. 2004, 11, 938–945. [Google Scholar]
  29. Pal, S.; Datta, S.P.; Rattan, R.K.; Singh, A.K. Diagnosis and amelioration of iron deficiency under aerobic rice. J. Plant. Nutr. 2008, 31, 919–940. [Google Scholar] [CrossRef]
  30. Prasad, R.; Shivay, Y.S.; Kumar, D. Agronomic biofortification of cereal grains with iron and zinc. Adv. Agron. 2014, 125, 55–91. [Google Scholar]
  31. Saha, S.; Singh, Y.V.; Gaind, S.; Kumar, D. Effect of Nitrogen and production techniques of rice on soil quality and water productivity. In Proceedings of the National Seminar on Agriculture. and Bio-Security in Changing. Scenario, Visva-Bharati, Sriniketan, West Bengal, India, 1–3 February 2014. [Google Scholar]
  32. Dinesh, R.; Dubey, R.P.; Ganeshmurthy, A.N.; Shyamprasad, G. Organic manuring in rice based cropping system: Effect of soil microbial biomass and selected enzyme activities. Curr. Sci. 2000, 79, 1716–1720. [Google Scholar]
  33. Garcia-Gill, J.C.; Plaza, C.; Rovira, P.S.; Polo, A. Long term effect of municipal solid waste compost application on soil enzyme activities and microbial biomass. Soil Biol. Biochem. 2000, 24, 1081–1084. [Google Scholar] [CrossRef]
Figure 1. The combined effect of crop establishment methods and integrated nutrient management influence the total N uptake by rice in both years. Treatments details are in Table 1; Within each treatment combination, bars followed by the same lower-case letter(s) indicate significant differences at 5% level of probability. SE± in each treatment combination was calculated from three replications.
Agronomy 11 01894 g001
Figure 2. The combined effect of crop establishment methods and integrated nutrient management influence the total P uptake by rice in both years. Treatment details are in Table 1; Within each treatment combination, bars followed by the same lower-case letter(s) indicate significant differences at 5% level of probability. SE± in each treatment combination was calculated from three replications.
Agronomy 11 01894 g002
Figure 3. The combined effect of crop establishment methods and integrated nutrient management influence the total K uptake by rice in both years. Treatments details are in Table 1; Within each treatment combination, bars followed by the same lower-case letter(s) indicate significant differences at 5% level of probability. SE± in each treatment combination was calculated from three replications.
Agronomy 11 01894 g003
Table 1. Crop establishment methods and integrated nutrient management influence the nitrogen contents and nitrogen uptake by rice.
TreatmentsNitrogen Content (%)Total Nitrogen Uptake (kg/ha)
GrainStrawTotal
20142015Mean20142015Mean20142015Mean20142015Mean
Crop establishment methods
T11.01.031.010.640.590.611.641.621.6384.288.286.2
T21.181.231.200.730.750.741.911.981.94128.6134.2131.4
T31.161.221.190.700.720.711.861.941.90120.0125.4122.7
SE±0.0250.0230.0240.0160.0140.0150.0410.0370.0390.800.450.62
LSD (0.05)0.0970.0930.0950.060.040.050.1570.1340.1453.151.792.47
CV (%)10.810.010.411.111.711.414.312.113.213.511.912.7
Integrated nutrient management
F11.061.121.090.580.620.601.641.741.6971.375.973.6
F21.111.161.130.700.670.681.811.831.82117.8121.7119.7
F31.131.181.150.700.730.711.831.911.87117.6127.2122.4
F41.151.201.170.730.750.741.881.951.91126.8130.0128.4
F51.171.211.190.650.690.671.821.901.86109.9115.0112.4
F61.181.231.200.620.710.661.801.941.87111.6119.9115.7
F71.211.261.230.750.730.741.961.991.97124.0126.2125.1
F81.221.271.240.750.720.731.971.991.98120.3139.9130.1
SE±0.0110.0090.010.0080.0060.0070.030.0150.0461.311.091.2
LSD (0.05)0.0330.0300.0310.0320.0250.0280.0650.0550.1223.753.113.43
CV (%)5.35.05.15.97.56.77.09.18.012.411.812.1
T1: aerobic culture, T2: the system of rice intensification (SRI), T3: conventional flooded transplanted rice (CTR) culture were taken in main plots and eight nutrient management treatments, namely, F1: absolute control, F2: 100% recommended dose of fertilizers (RDF) through the chemical form (N:P2O5:K2O (80:40:40 kg ha−1)), F3: 75% recommended dose of nitrogen (RDN) through chemical fertilizer + 25% RDN through farmyard manure (FYM), F4: 75% RDN through chemical fertilizer + 25% RDN through vermicompost, F5: 50% RDN through chemical fertilizer + 25% RDN through FYM + brown manuring (coculture of Sesbania aculeata at 30 kg ha−1 and knocking down with the application of 2–4 D ethyl ester at 0.75 kg a.i. ha−1), F6: 50% RDN through chemical fertilizer + 25% RDN through vermicompost + brown manuring, F7: F5+ soil application of biofertilizer Azospirillium brassilense at 2 kg ha−1, F8: F6 + soil application of biofertilizer Azospirillium brassilense at 2 kg ha−1 were considered in sub-plots.
Table 2. Crop establishment methods and integrated nutrient management influence the phosphorus contents and phosphorus uptake by rice.
TreatmentsPhosphorus Content (%)Total Phosphorus Uptake (kg/ha)
GrainStrawTotal
20142015Mean20142015Mean20142015Mean20142015Mean
Crop establishment methods
T10.160.180.170.0520.0630.0570.2120.2430.22723.829.126.4
T20.190.230.210.0720.0750.0730.2620.3050.28339.645.542.5
T30.240.270.250.0780.0800.0790.3180.3500.33445.849.947.8
SE±0.0090.0070.0080.0020.0040.0030.0110.0130.0120.750.880.81
LSD (0.05)0.0370.0280.0320.0050.0060.0050.0420.0360.0392.953.463.20
CV (%)14.114.914.513.312.813.014.312.113.210.29.69.9
Integrated nutrient management
F10.170.200.180.0570.0600.0580.2270.2600.24321.326.724.0
F20.220.280.250.0700.0790.0740.2900.3590.32442.752.447.5
F30.200.250.220.0670.0700.0680.2670.3200.29338.246.542.3
F40.210.260.230.0680.0720.0700.2780.3320.30541.948.745.3
F50.190.240.210.0590.0680.0630.2490.3080.27833.440.937.1
F60.200.260.230.0620.0690.0650.2620.3290.29535.744.640.1
F70.230.250.240.0640.0670.0650.2940.3170.30541.244.342.7
F80.220.270.250.0660.0710.0680.2860.3410.31342.049.645.8
SE±0.0070.0050.0060.0010.0020.0020.0080.0100.0091.501.431.46
LSD (0.05)0.0200.0240.0220.0040.0060.0050.0250.030.0274.294.084.18
CV (%)11.010.410.76.57.57.08.69.18.812.510.011.2
Treatments details are in Table 1.
Table 3. Crop establishment methods and integrated nutrient management influence on potassium contents and potassium.
TreatmentsPotassium Content (%)Total Potassium Uptake (kg/ha)
GrainStrawTotal
20142015Mean20142015Mean20142015Mean20142015Mean
Crop establishment methods
T10.240.280.261.021.061.041.261.341.3087.099.693.3
T20.260.320.291.071.121.101.331.441.38115.8128.2122.0
T30.310.360.331.101.181.141.411.541.47118.3130.9124.6
SE±0.0100.0140.0120.0120.0230.0170.0220.0380.031.632.642.13
LSD (0.05)0.0400.0460.0430.0420.090.0660.0830.1380.116.4110.48.40
CV (%)19.218.018.68.210.29.217.514.315.97.411.09.2
Integrated nutrient management
F10.220.250.230.941.000.971.161.251.2073.481.277.3
F20.260.340.301.161.241.201.421.581.50122.3137.0129.6
F30.270.290.281.061.121.091.331.411.37110.5120.9115.7
F40.280.320.301.081.141.111.361.461.41123.1127.1125.1
F50.270.310.291.101.161.131.371.471.42111.2118.7114.9
F60.240.280.261.121.181.151.361.461.41109.7120.9115.3
F70.290.330.311.141.221.181.431.551.49116.6129.4123.0
F80.300.350.321.151.171.161.501.521.51122.0130.2126.1
SE±0.0090.0120.0100.0010.0140.0070.0110.0260.0181.351.581.46
LSD (0.05)0.0280.0320.030.0290.0370.0330.0580.0690.0633.854.073.96
CV (%)11.310.610.95.86.56.112.310.611.49.710.910.3
Treatments details are in Table 1.
Table 4. Crop establishment methods and integrated nutrient management influence the nutrient use efficiency, partial factor productivity of nutrients, value cost ratio, and apparent nitrogen recovery in rice.
TreatmentsFertilizer Use Efficiency
(kg Grain/kg N Applied)
Physiological Nitrogen Use Efficiency
(kg Grain/kg N Uptake)
Apparent Nitrogen Recovery
20142015Mean20142015Mean20142015Mean
Crop establishment methods
T13.484.143.8154.1054.4254.260.760.880.82
T25.885.995.9348.6845.9847.331.351.471.41
T35.205.345.2749.6746.8948.281.301.361.33
SE±0.160.130.140.270.290.280.0310.0520.041
LSD (0.05)0.660.500.581.081.121.100.1240.2050.164
CV (%)18.212.915.59.67.88.716.412.814.6
Integrated nutrient management
F1 47.5045.9546.72
F24.655.144.8950.1749.3849.770.580.560.57
F35.215.725.4650.6847.5649.120.770.850.81
F45.975.845.9049.6846.9248.300.920.900.91
F54.815.004.9050.4847.5048.990.960.980.97
F65.005.185.0950.6246.5448.581.011.101.05
F75.595.725.6550.9145.9848.441.321.261.29
F86.246.446.3451.1143.5347.321.221.601.41
SE±0.170.070.120.580.530.550.0220.0260.024
LSD (0.05)0.680.200.441.671.501.580.0650.0700.067
CV (%)7.44.45.97.45.26.37.96.77.3
Interaction
Crop establishment methods × Integrated nutrient management
SE±0.120.070.060.200.180.190.030.050.02
LSD (0.05)0.350.220.20NSNSNS0.080.130.07
Integrated nutrient management × Crop establishment methods
SE±0.190.120.151.010.910.960.0470.0420.039
LSD (0.05)0.550.340.42NSNSNS0.140.120.10
Treatments details are in Table 1.
Table 5. Crop establishment methods and integrated nutrient management influence on available nitrogen, phosphorus, and potassium status of soil after harvest of rice.
TreatmentsAvailable Nitrogen (kg/ha)Available Phosphorus (kg/ha)Available Potassium (kg/ha)
20142015Mean20142015Mean20142015Mean
Crop establishment methods
T1293.8260.3277.050.761.556.1256.8245.6251.2
T2326.4287.9307.174.863.569.1265.6255.9260.7
T3310.5275.7293.180.967.774.3267.7275.0271.3
SE±3.602.973.282.182.052.115.873.324.59
LSD (0.05)14.0411.5812.818.558.058.3NSNSNS
CV (%)5.96.86.315.815.315.510.96.48.6
Integrated nutrient management
F1229.7165.9197.838.751.445.0211.6193.4202.5
F2282.4210.5246.459.972.866.3276.3267.6271.9
F3303.9236.7270.362.870.566.6270.5250.7260.6
F4293.8229.9261.862.072.967.4260.2265.8263.0
F5297.7245.8271.769.163.366.2263.9252.5258.2
F6294.4240.5267.466.467.867.1269.4261.2265.3
F7316.5278.9297.768.174.671.3268.4266.3267.3
F8322.9270.6296.775.460.668.1261.8258.2260.0
SE±5.304.224.763.062.552.806.184.155.16
LSD (0.05)15.212.0313.618.737.278.017.611.814.7
CV (%)9.08.38.613.611.512.57.04.55.7
Interaction
Crop establishment methods × Integrated nutrient management
SE±3.373.193.281.100.941.022.371.531.95
LSD (0.05)NSNSNSNSNSNSNSNSNS
Integrated nutrient management × Crop establishment methods
SE±17.115.916.55.294.414.8510.717.198.95
LSD (0.05)NSNSNSNSNSNSNSNSNS
Treatments details in Table 1.
Table 6. Crop establishment methods and integrated nutrient management influence the soil pH, organic carbon, available iron, and available Zn after harvest of rice.
TreatmentspHOrganic Carbon (%)Available Iron (ppm)Available Zinc (ppm)
20142015Mean20142015Mean20142015Mean20142015Mean
Crop establishment methods
T16.816.906.850.570.530.5510.7010.0910.391.461.491.47
T26.957.087.010.620.650.6312.8913.5013.191.231.281.25
T37.077.197.130.590.640.6113.4414.4613.951.081.141.11
SE±0.050.070.060.0090.0110.010.090.030.060.0250.0190.022
LSD (0.05)NSNSNS0.0400.0420.0410.370.130.250.0990.0730.086
CV (%)9.37.98.69.210.29.76.77.26.99.97.18.5
Integrated nutrient management
F17.097.147.110.380.330.3512.1311.9612.040.890.920.90
F26.827.166.990.530.490.5112.6812.8212.251.071.121.09
F36.967.067.010.620.680.6512.2212.9812.601.391.431.41
F46.957.227.080.690.710.7012.3312.7812.551.371.391.38
F57.106.907.000.620.670.6413.6913.0613.371.331.361.34
F66.937.157.040.670.730.7013.8313.2113.521.351.371.36
F77.046.866.950.710.750.7313.0113.3213.161.361.441.40
F87.027.117.060.740.780.7612.8913.4913.191.311.401.35
SE±0.090.110.100.0070.0090.0080.150.120.130.0510.0450.048
LSD (0.05)NSNSNS0.0200.0260.0230.420.350.380.1470.1290.138
CV (%)5.64.95.27.06.66.85.66.96.212.310.611.4
Interaction
Crop establishment methods × Integrated nutrient management
SE±0.020.040.030.0020.0040.0030.050.410.230.0180.0150.016
LSD (0.05)NSNSNSNSNSNSNSNSNSNSNSNS
Integrated nutrient management × Crop establishment methods
SE±0.180.160.170.0120.0160.0140.280.220.250.0890.0780.083
LSD (0.05)NSNSNSNSNSNSNSNSNSNSNSNS
Treatments details in Table 1.
Table 7. Crop establishment methods and integrated nutrient management influence the soil dehydrogenase activities at different growth stages of rice.
TreatmentsSoil Dehydrogenase Activities (Microgram Tri Phenyl Formazan/g Soil/hour)
At Tillering StageAt Flowering StageAt Harvest
20142015Mean20142015Mean20142015Mean
Crop establishment methods
T1157.8150.6154.2194.8186.2190.5139.7135.6137.6
T2163.7156.9160.3205.3191.4198.3152.4148.1150.2
T3152.7147.0149.8187.3179.3183.3142.2137.9140.0
SE±1.251.131.190.470.570.520.940.620.78
LSD (0.05)4.844.424.631.832.232.033.692.443.06
CV (%)9.810.710.28.89.49.110.57.99.2
Integrated nutrient management
F194.988.591.7121.3113.1117.275.264.069.6
F2167.5162.0164.7179.4185.9182.6128.7123.1125.9
F3175.6169.5172.5201.9193.7197.8139.5136.0137.7
F4179.0173.2176.1205.7197.9201.8139.3142.8141.0
F5164.2158.1161.1196.8201.1198.9141.5144.3142.9
F6166.6160.9163.7211.7202.7207.2149.9143.2146.5
F7168.1162.2165.1214.0206.0210.0147.2152.3149.7
F8170.4165.3167.8217.4209.3213.3151.1156.5153.8
SE±2.262.152.200.820.760.790.831.090.96
LSD (0.05)6.446.186.312.332.272.302.363.112.73
CV (%)6.37.26.77.97.07.49.26.88.0
Interaction
Crop establishment methods × Integrated nutrient management
SE±0.790.720.750.290.250.270.300.380.34
LSD (0.05)NSNSNSNSNSNSNSNSNS
Integrated nutrient management × Crop establishment methods
SE±3.913.743.821.421.381.401.481.891.68
LSD (0.05)NSNSNSNSNSNSNSNSNS
Treatments details in Table 1.
Publisher’s Note: MDPI stays neutral with regard to jurisdictional claims in published maps and institutional affiliations.

