
An Environmentally Friendly Soil Amendment for Enhancing Soil Water Availability in Drought-Prone Soils


1
College of Water Resources and Architectural Engineering, Northwest A&F University, Xianyang 712100, China
2
Key Laboratory for Agricultural Soil and Water Engineering in Arid Area of Ministry of Education, Northwest A&F University, Xianyang 712100, China
*
Author to whom correspondence should be addressed.
Agronomy 2022, 12(1), 133; https://0-doi-org.brum.beds.ac.uk/10.3390/agronomy12010133
Submission received: 17 November 2021
/
Revised: 26 December 2021
/
Accepted: 4 January 2022
/
Published: 6 January 2022
(This article belongs to the Special Issue Dryland Agriculture and Farming Techniques: From Soil to Plant Nutrient)
Abstract
:Applying soil amendments plays a critical role in relieving water stress in arid and semiarid areas. The natural clay mineral attapulgite (ATP) can be utilized to adjust the balance of water and soil environment. In this study, we investigated four different particle size distribution typical soils in the Loess Plateau: (1) lou soil (LS), (2) dark loessial soil (DS), (3) cultivated loess soil (CS), (4) sandy soil (SS). Five ATP application rates (0, 1%, 2%, 3%, and 4%) were selected to test the effect of ATP on the soil water retention curve, soil saturated hydraulic conductivity, and soil structure. The results showed that applied ATP significantly increased the soil clay content, and the relative change of SS with 3% ATP applied increased by 53.7%. The field water holding capacity of LS, DS, CS, and SS with 3% ATP applied increased by 8.9%, 9.6%, 18.2%, and 45.0%, respectively. Although applied ATP reduced the saturated hydraulic conductivity, the values of CS and SS were opposite when the amount of ATP applied was >3%. The relative change in the amount of 0.25–1 mm soil water-stable aggregates of SS was 155.9% when 3% ATP was applied. Applied ATP can enhance soil water retention and soil stability, which may improve limited water use efficiency and relieve soil desiccation in arid and semiarid areas or similar hydrogeological areas.
1. Introduction
Arid and semiarid areas occupy more than 40% of the terrestrial ecosystem, and support over 35% of the global population [1]. Water availability is considered the key limitation for biological productivity in dryland ecosystems [2]. The arid and semiarid areas of China, including the northeastern, northern, and northwestern regions, cover an area of over 1.6 million km2 [3]. Especially in the Loess Plateau (100°54′ E~114°33′ E and 33°43′ N~41°16′ N) in northern China, due to geological movement and the deposition of aeolian particulate, soil moisture is easily dissipated from the soil profile [4,5,6]. Drought and water stress have restricted agricultural development, and caused soil degradation [7,8]. Water-limited agricultural systems are not only vulnerable to reduced crop yields but also often characterized by poor water holding capacity and soil structure.
Soil texture is the fundamental property that controls the aggregation of particles, soil structure, and soil structure stability [9,10]. Moreover, soil texture is one of the most important physical parameters that affect soil aggregation, water transport, vegetation productivity, and ecological restoration [11,12]. Clay particles can act as nuclei capable of generating macroaggregates and microaggregates because of their large specific surface area and chemical association capacity, which allow a favorable soil structure to be achieved [10,13,14]. The soil textures in the north and south of the Loess Plateau are completely different and soil clay content exhibits a gradient decrease from south to north [10,12]. Since “Grain for Green” was implemented to restore the ecological environment of the Loess Plateau, excessive green vegetation has led to a sharp increase in water demand and a decline in soil water bearing capacity, which has resulted in soil desiccation [5,6,15,16,17,18,19]. Thus, in this study, we focus on transforming the coarse soil of the Loess Plateau into soil with greater clay content suitable for crop and plant growth, thereby contributing to the restoration of the ecological environment.
Currently, various types of soil additives are used in all aspects of soil management, such as inorganic additives, organic additives, synthetic soil additives, and biological additives [20,21,22,23]. However, most soil additives may pose serious health and environment risks in practice [24,25,26,27,28], and raise the cost of agriculture [29]. Therefore, new soil amendments need to be developed. The inorganic additive attapulgite (ATP) is widely used for soil improvement [30,31,32]. As a 2:1 type clay mineral, it has large specific surface area, rich pores, and strong polarity. Its special colloidal properties and crystal structures provide outstanding ion exchange performance and surface adsorption, which are crucial to the physical, chemical, and biological processes of soil [33,34]. The pores of ATP are honeycombed in cross sections, and produce a combination of numerous parallel tubular channels. The surface of ATP is unevenly covered with grooves, and its viscosity and plasticity are enhanced on encountering water, which results in a strong water absorption capacity [35,36]. The fibrous morphology and pore structure of ATP make it significant in improving soil strength and caking, and its large specific surface area and cation exchange capacity enable it to play a role in water retention and improving soil aeration [23,37,38]. Yang et al. [37] revealed that the application of ATP promoted the accumulation of dry matter mass of astragalus and could significantly improve the quality of astragalus. Guan et al. [39] conducted corn field trials with ATP instead of 20–30% chemical fertilizers and found that fertilizers coated with ATP effectively improved corn yield and nitrogen fertilizer utilization. In addition, a large number of studies have shown that ATP exhibits excellent heavy metal absorption properties in soil remediation, greatly reducing soil contamination [36,37,40]. The ATP is cheap, nontoxic, tasteless, and nonstimulating, and has the advantages of low cost and abundant resource in most continents of the world [37,38,39,40,41,42,43,44]. ATP possesses the necessary characteristics to improve soil structure and promote excellent soil fertility [45,46,47]. Moreover, the selective absorption of heavy metals by ATP can improve the soil environment [48,49]. Therefore, ATP has considerable potential for development and utilization in arid and semiarid agriculture.
The number and intensity of droughts around the world have increased dramatically, and droughts are forecast to increase in the future [50], forcing people to optimize water management. A case study of four typical zonal soils (lou soil (LS), dark loessial soil (DS), cultivated loess soil (CS), sandy soil (SS)) in the Loess Plateau is expected to increase soil clay content by adding clay mineral ATP, so as to change the hydraulic and physical properties of the soil. We anticipate solving the problem of poor water holding capacity of coarse-grained soil, improving the water resource utilization efficiency, and relieving the water pressure of agriculture in dryland. Thus, we propose the following hypotheses: (1) applied ATP improves the water holding capacity significantly, (2) the soil structure will be improved within a specific range of addition by adding ATP, and (3) ATP has a more beneficial effect on sandy soil than other soils.
2. Materials and Methods
2.1. Test Materials
2.1.1. Properties of ATP
The ATP used in this experiment was purchased from Henan Yixiang New Material Co., Ltd. (Xinxiang, China) without any treatment. Its basic physical properties and chemical composition were as follows: the clay content was 17.8%, the silt content was 32.2%, the sand content was 50.0%, and the pH value was 7.5.
2.1.2. Soil Samples
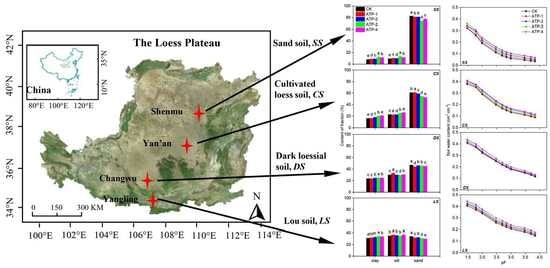
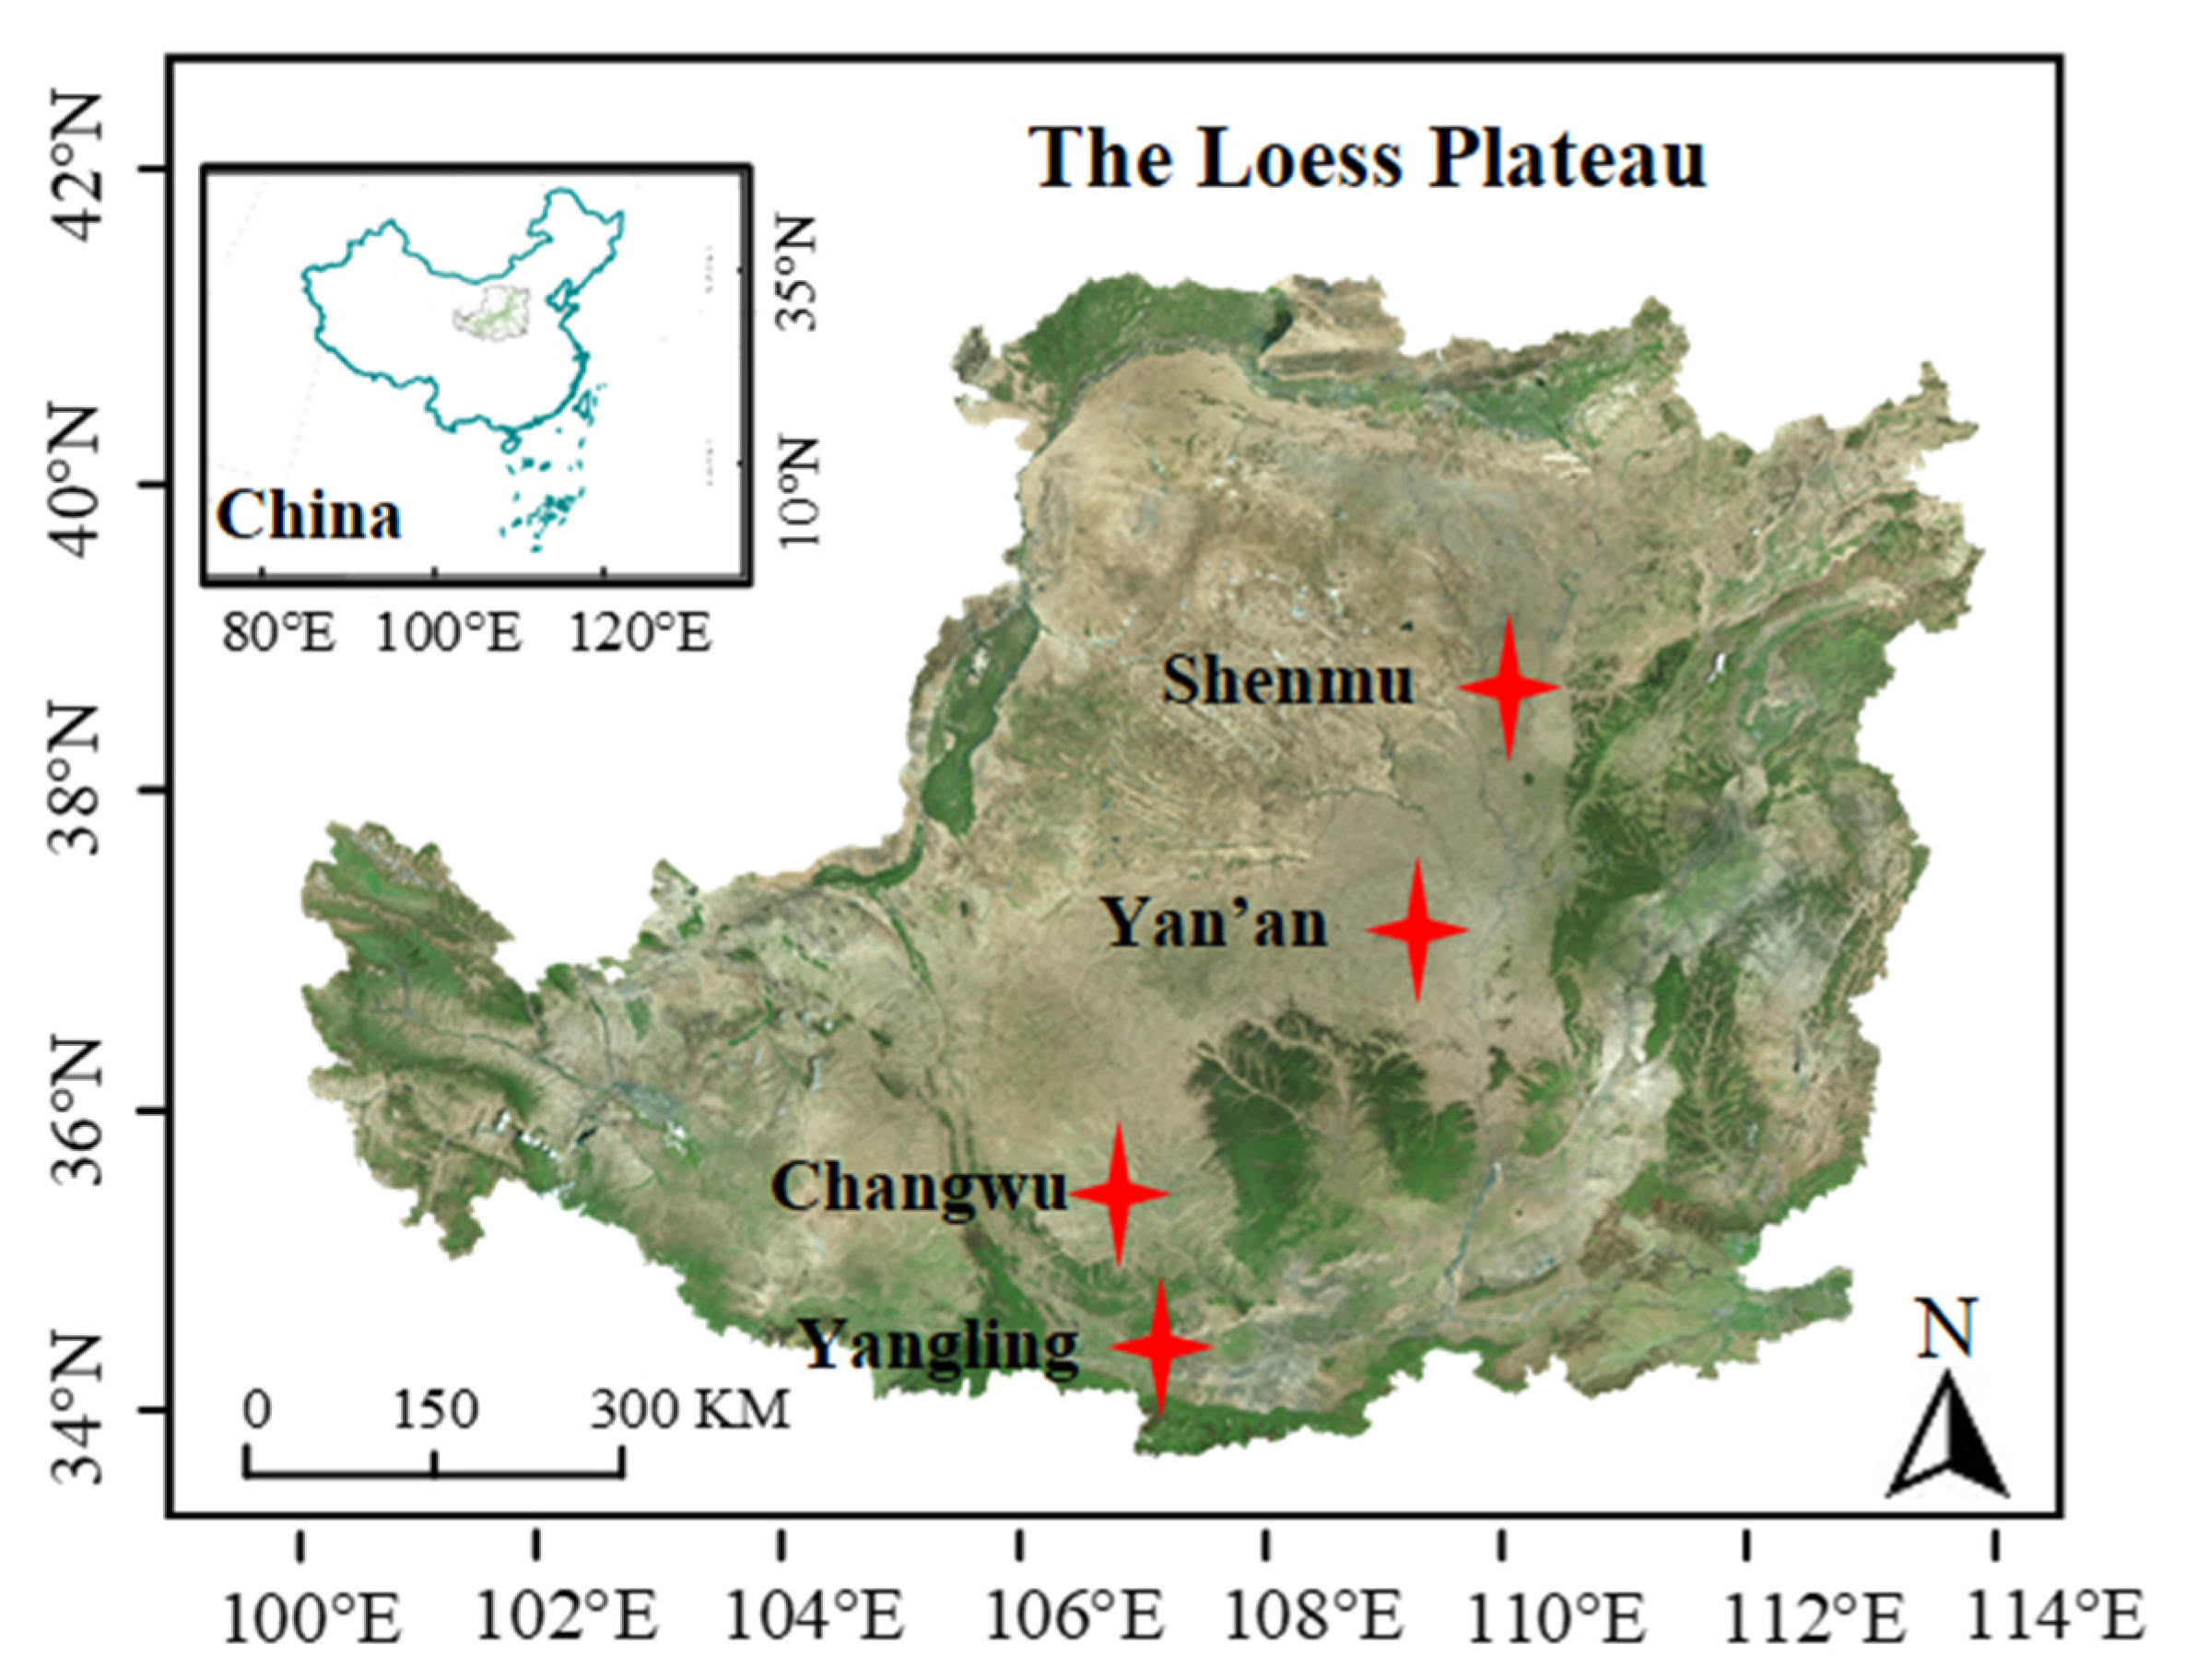
In March 2019, four common soils were selected to a depth of 30 cm from a cultivated field in the Yangling (LS, 34°16′ N, 108°40′ E), Changwu (DS, 35°14′ N, 107°40′ E), Yan’an (CS, 36°50′ N, 110°29′ E), and Shenmu (SS, 38°50′ N, 110°29′ E) regions of the Loess Plateau in order of decreasing clay content (Figure 1). The cutting ring with a volume of 100 cm3 was used to collect samples without disturbance, and the soil bulk density was determined by the drying method. The types and textures of the soils at each site are listed in Table 1. The soil samples were brought to the laboratory and air dried so that it could be sieved with a 4 mm sieve. Based on the customary use of attapulgite in soil remediation applications [32,51], ATP and four different soil samples were uniformly mixed with the mass ratios of 0, 1%, 2%, 3%, and 4% (these treatments were denoted CK, ATP-1, ATP-2, ATP-3, and ATP-4, respectively). In total, there were 20 treatments with three replicates for each treatment. A total of 60 repacked cores were prepared by cutting ring.
2.2. Laboratory Measurements
2.2.1. Soil Water Retention Curve
The soil water retention curve (SWRC) is commonly used to analyze the water holding capacity of soil. The soil samples were also subjected to soil water retention measurements taken using a pressure film meter and WP4 dew point water potential meter to determine their water content in correspondence with different matrix potentials. The van Genuchten (VG) model [52] can accurately reflect the relationship between matrix suction and volumetric water content and is the basis for further studies of soil hydraulic properties, which can be expressed as
where h is the soil negative pressure measured using H2O, cm; θ(h) is the soil volumetric water content under the corresponding suction (%); θr is the residual volumetric water content (cm3 cm−3); θs is the saturated volumetric water content (cm3 cm−3); α is the reciprocal of the intake value (cm−1); n and m are the parameters characterizing the shape of the curve (m = 1−1/n). According to the measured data, the aforementioned parameters were obtained using RETC software. Correlation coefficient (R2) and root mean square error (RMSE) were used to test the fit of the model:
where represents the observed data; is the estimated data obtained through the VG model; n is the number of samples.
2.2.2. Soil Physical Properties
The SWRC can be used to determine the soil water retention parameters, including the field water holding capacity (FC, matrix potential: −0.33 bar), permanent wilting point (PWP, matrix potential: −15 bar), and available water content (AWC, the difference between the FC and PWP) [53]. The total soil porosity (TP) and capillary porosity (CP) were selected to further assess the effect of ATP application on the soil physical properties:
2.2.3. Soil Pore Size Distribution
The method utilized to obtain the pore size distribution is based on the SWRC. The pore size distribution can be expressed as follows:
where d is the pore diameter, h is the pressure head (Pa), and σ is the water surface tension coefficient, which is generally 75 × 10−5 N·cm−1 at room temperature.
2.2.4. Soil Saturated Hydraulic Conductivity
Soil saturated hydraulic conductivity (Ks) was measured using the constant head method:
where Ks is the soil saturated hydraulic conductivity, cm·s−1; Q is the output water, cm3; is the water head difference, cm; L is the sample height, cm; A is the soil cross-sectional area, cm2; t is time.
2.2.5. Soil Aggregate Measurement
The stability of aggregates was determined through dry-sieve and wet-sieve methods. Before soil aggregate measurement, all soil samples were packed into plastic boxes (20 cm × 10 cm × 10 cm) filled with water until saturation and placed in an incubator at constant humidity (25 °C ± 1 °C, 50 ± 5% of relative humidity) for 50 days. Once the soil sample appeared to be stable, 500 g was taken to oscillate on the sieve (5, 2, 1, 0.5, 0.25, and 0.053 mm), and the aggregates of each particle size (5–2, 2–1, 1–0.5, 0.5–0.25, 0.25–0.053, and <0.053 mm) were weighed separately after shaking. Each fractional aggregate obtained through dry sieving was proportioned to 50 g for wet sieving. Sieve groups consisting of each particle size were placed in a wet sieve bucket, and distilled water was added to the upper edge of the sieve group. After wetting for 5 min at room temperature, the sample was subjected to vertical vibrations with an amplitude of 4 cm at 30 r·min−1 for 30 min. After sieving, the aggregates on the sieves of each level were rinsed into a 100 mL beaker of known quality. After 48 h of sedimentation, the supernatant was removed, placed in an oven, dried at 50 °C, and weighed.
Aggregate stability indices were denoted by soil aggregates (>0.25 mm), the mean weight diameter (MWD), the mean geometric diameter (GWD), and soil aggregate destruction (PAD0.25) [54]:
where DR0.25 and WR0.25 are the proportions of >0.25 mm mechanical stable and water-stable aggregates, respectively; D−MWD and W−MWD are the mean weight diameter of mechanical stable aggregates and water-stable aggregates (mm), respectively; D−GWD and W−GWD are the mean geometric diameter of mechanical stable aggregates and water-stable aggregates (mm), respectively; Wi > 0.25 is the mean diameter of >0.25 mm size fraction i; Xi is the mean diameter of size fraction i; and Wi is the proportion (%) of the total sample mass in size fraction i.
2.3. Statistical Analysis
SPSS 22 and Origin 2017 software programs were used for data processing, graphing, and tabulation. Duncan’s least significant difference test was used to identify significant differences in indicators related to hydraulic properties, pore size distribution, saturated hydraulic conductivity, and aggregate stability between means for different ATP treatments and different soil types in this paper (p < 0.05).
3. Results
3.1. Soil Physical Properties
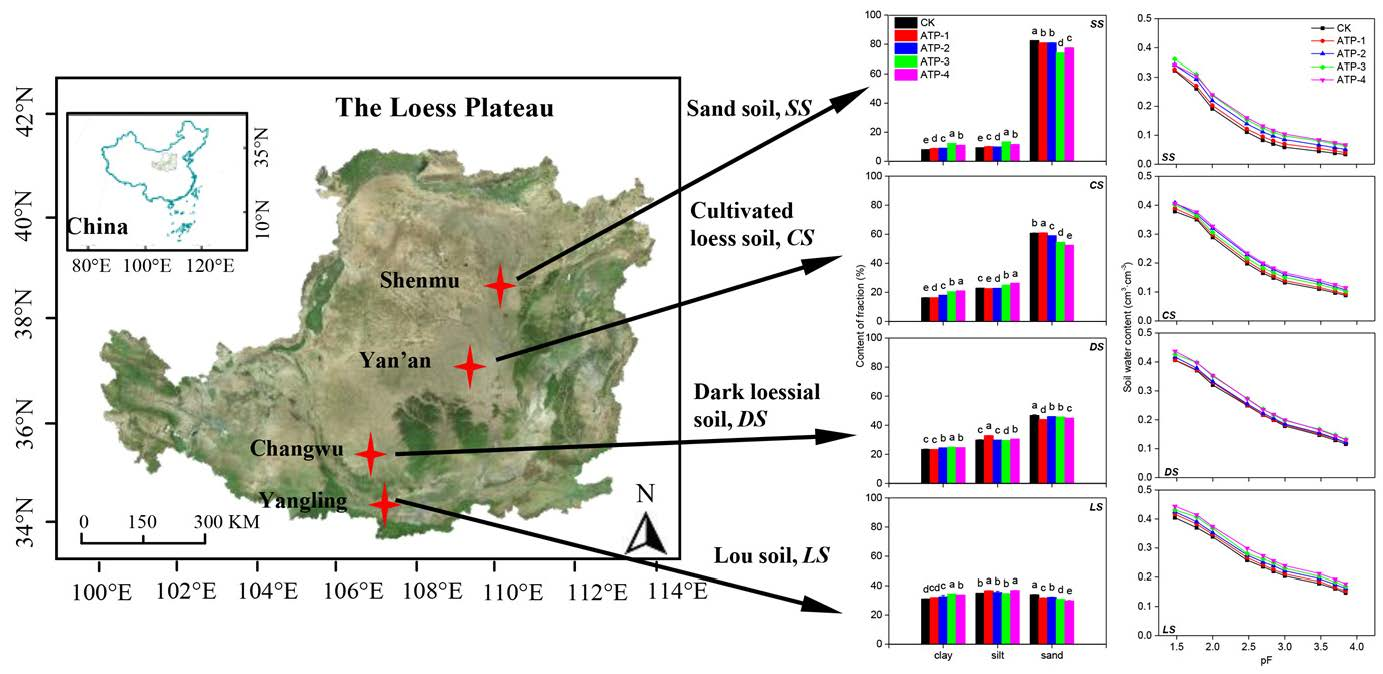
The physical properties of each treatment are presented in Table 2. Adding ATP enhanced the clay content compared with CK treatments. The clay content of LS, DS, CS, and SS with ATP-3 treatments were increased by 11.2%, 6.5%, 25.4%, and 53.7%, respectively. ATP significantly increased the clay content of CS and SS (p < 0.05). Statistical analysis revealed that ATP has no significant effect on the CP, but has significant effects on other physical parameters.
3.2. Soil Water Retention Curve and Water Characteristic Parameters
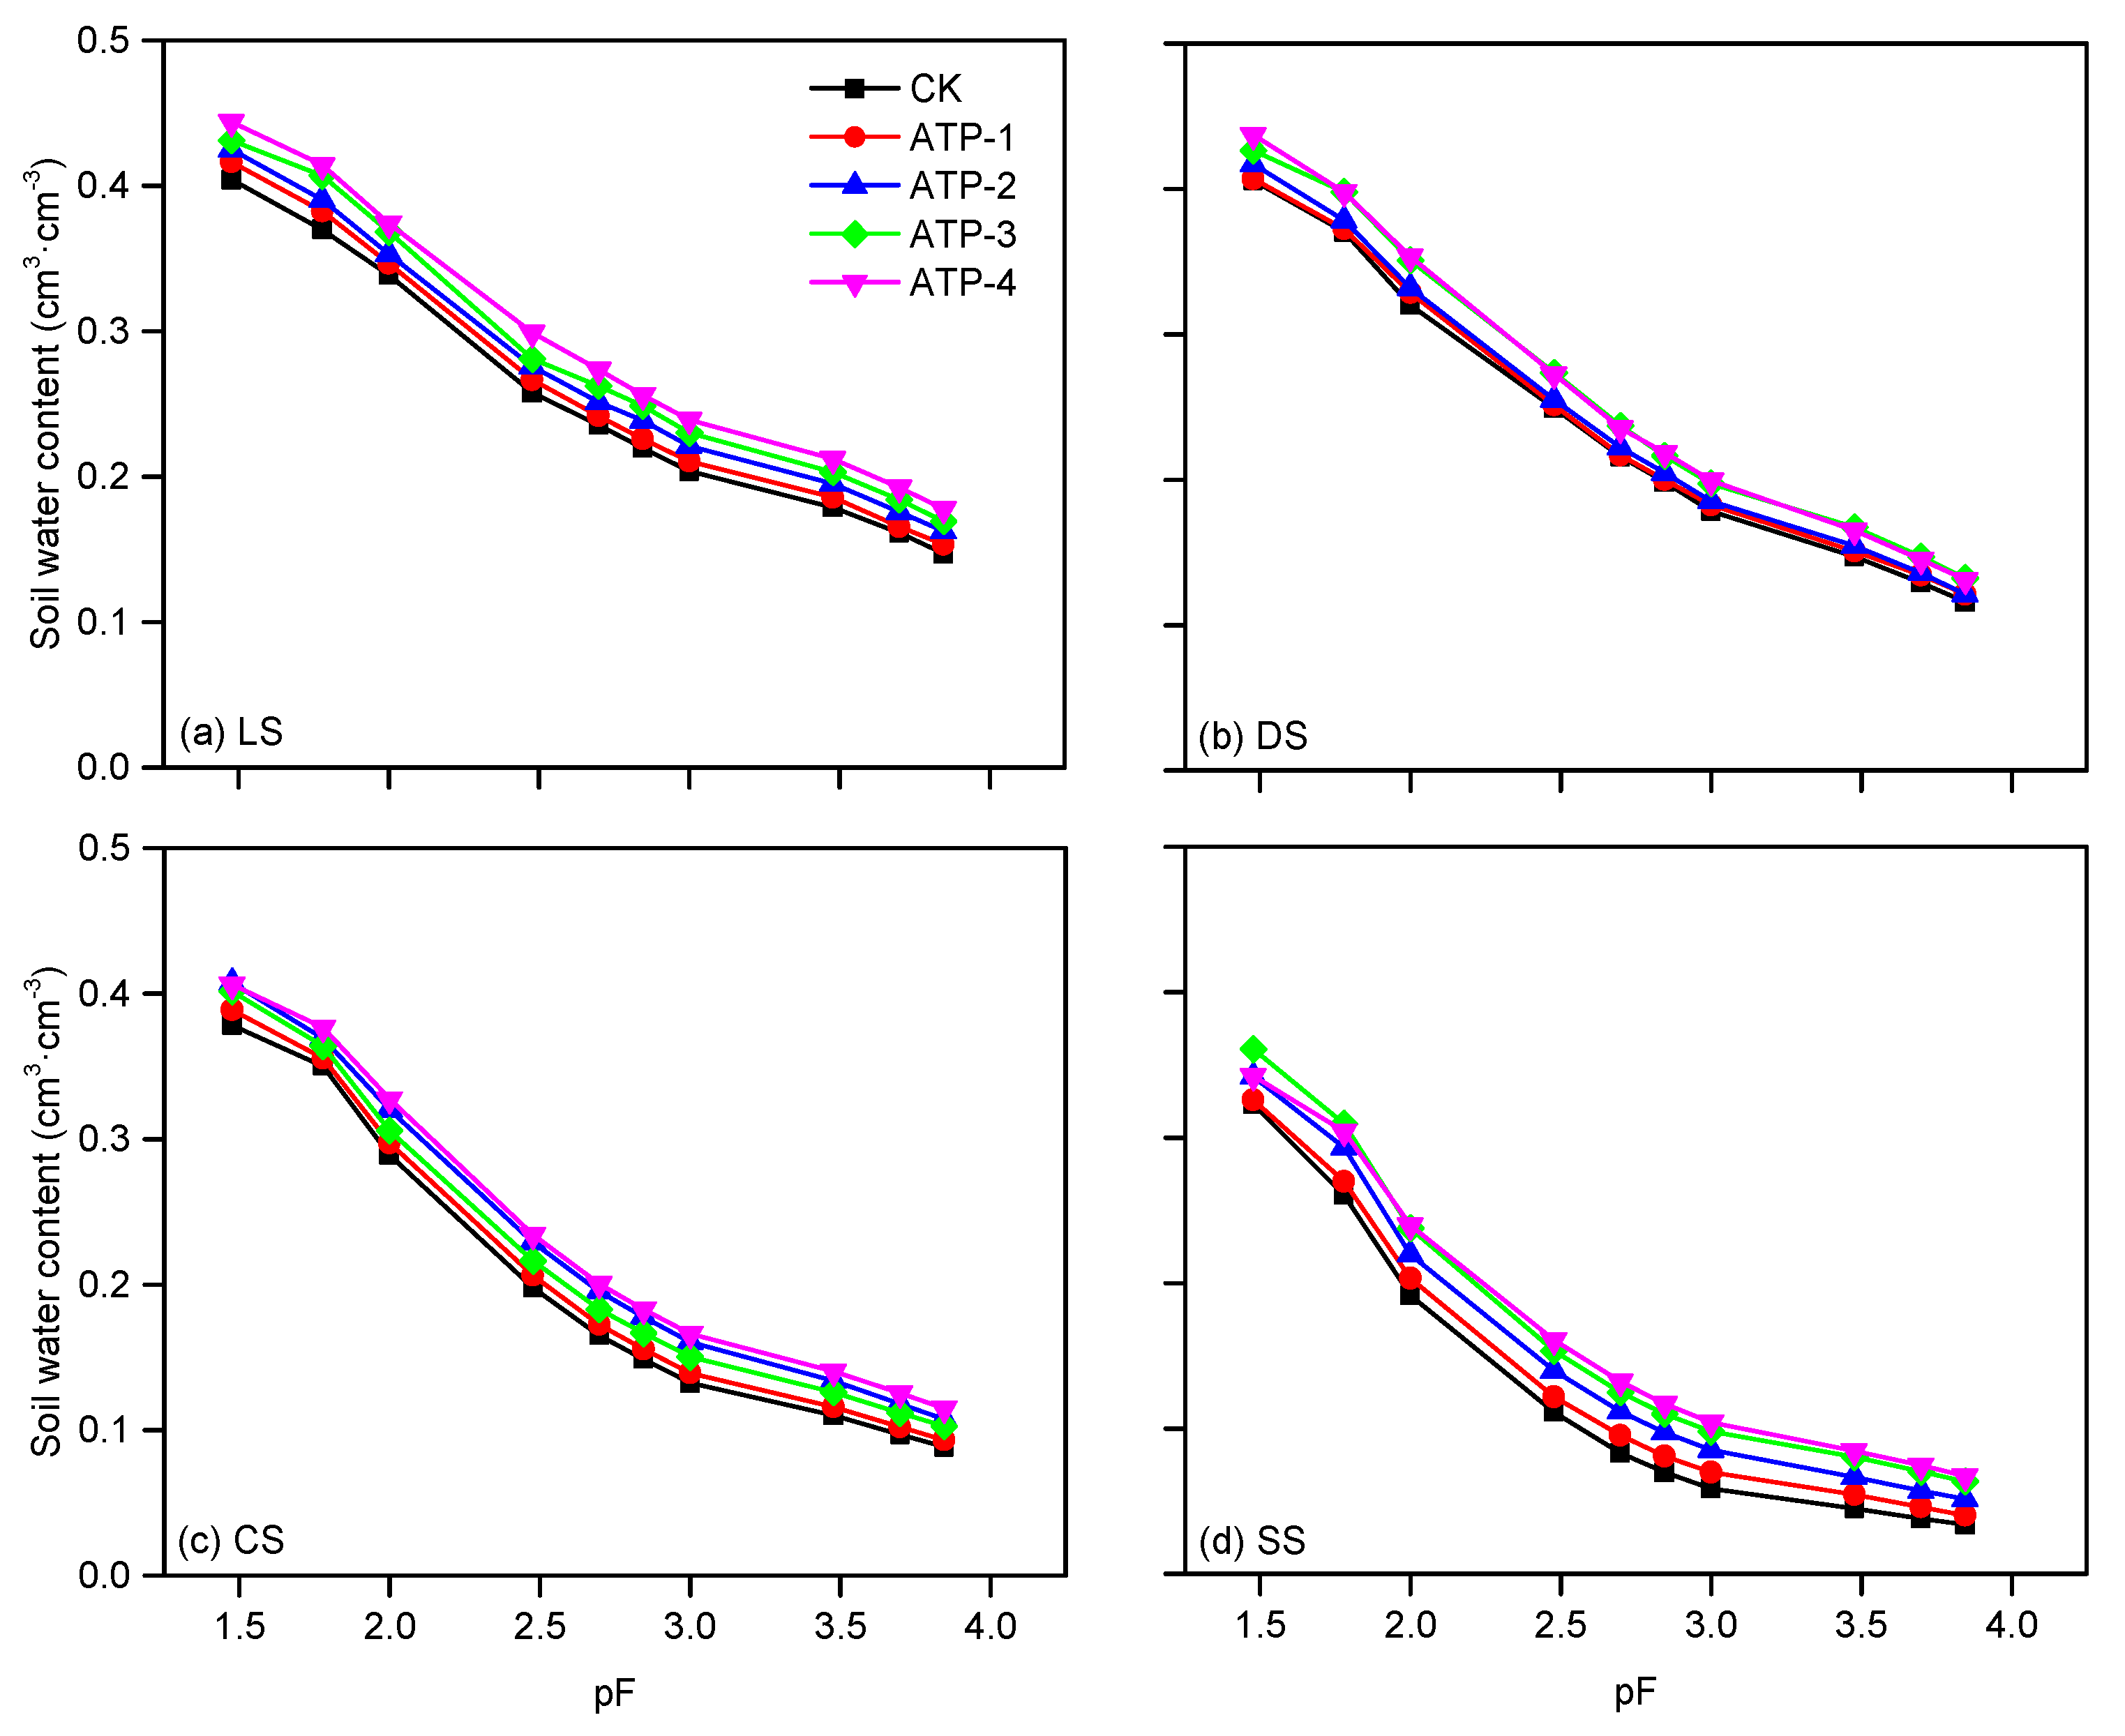
The soil water retention curves (SWRCs) for the four soils are illustrated in Figure 2. The water content of LS was higher than that of the other soil types, and the water content of SS was the lowest with the same pF value. When increasing the ATP application amount, the water content under the same suction increased. This change led to a corresponding change in the soil water holding capacity. To analyze in detail the effect of applying ATP to the soil water holding capacity under different suctions, the soil suction was divided into three parts: low-suction section (<0.1 bar), middle-suction section (0.1–3 bar), and high-suction section (>3 bar). The treatment of the low-suction section was severe, and the range of water content changes was relatively large. The change of water content in the middle-suction section was obvious and regular, and the moisture change caused by the ATP-4 treatments was significantly higher than that caused by CK treatments.
The fitting results of the VG model are presented in Table 3, and the fitting degree is acceptable (R2 > 0.99, RMSE < 0.01). The changes in θr, θs, and α were positively associated with the amount of ATP applied, whereas the changes were negatively associated with n. The θr of LS, DS, CS, and SS with the ATP-4 treatments were increased by 26.5%, 21.9%, 17.3%, and 109.2%, respectively.
The FC, PWP, and AWC for each soil type were larger after ATP treatments than CK treatments (Table 4). The results indicated that the application of ATP affected the soil water retention and water permeability. The FC of LS, DS, CS, and SS with ATP-3 treatments were increased by 8.9%, 9.6%, 18.2%, and 45.0%, respectively, and the corresponding PWP were increased by 15.0%, 14.7%, 15.2%, and 96.6%, respectively, while the corresponding AWC were increased by 2.4%, 6.1%, 20.2%, and 18.3%, respectively, which led to a great influence on PWP of SS. This finding suggests that the ATP-treated soil’s moisture increases significantly in the high-suction section.
3.3. Soil Pore Size Distribution
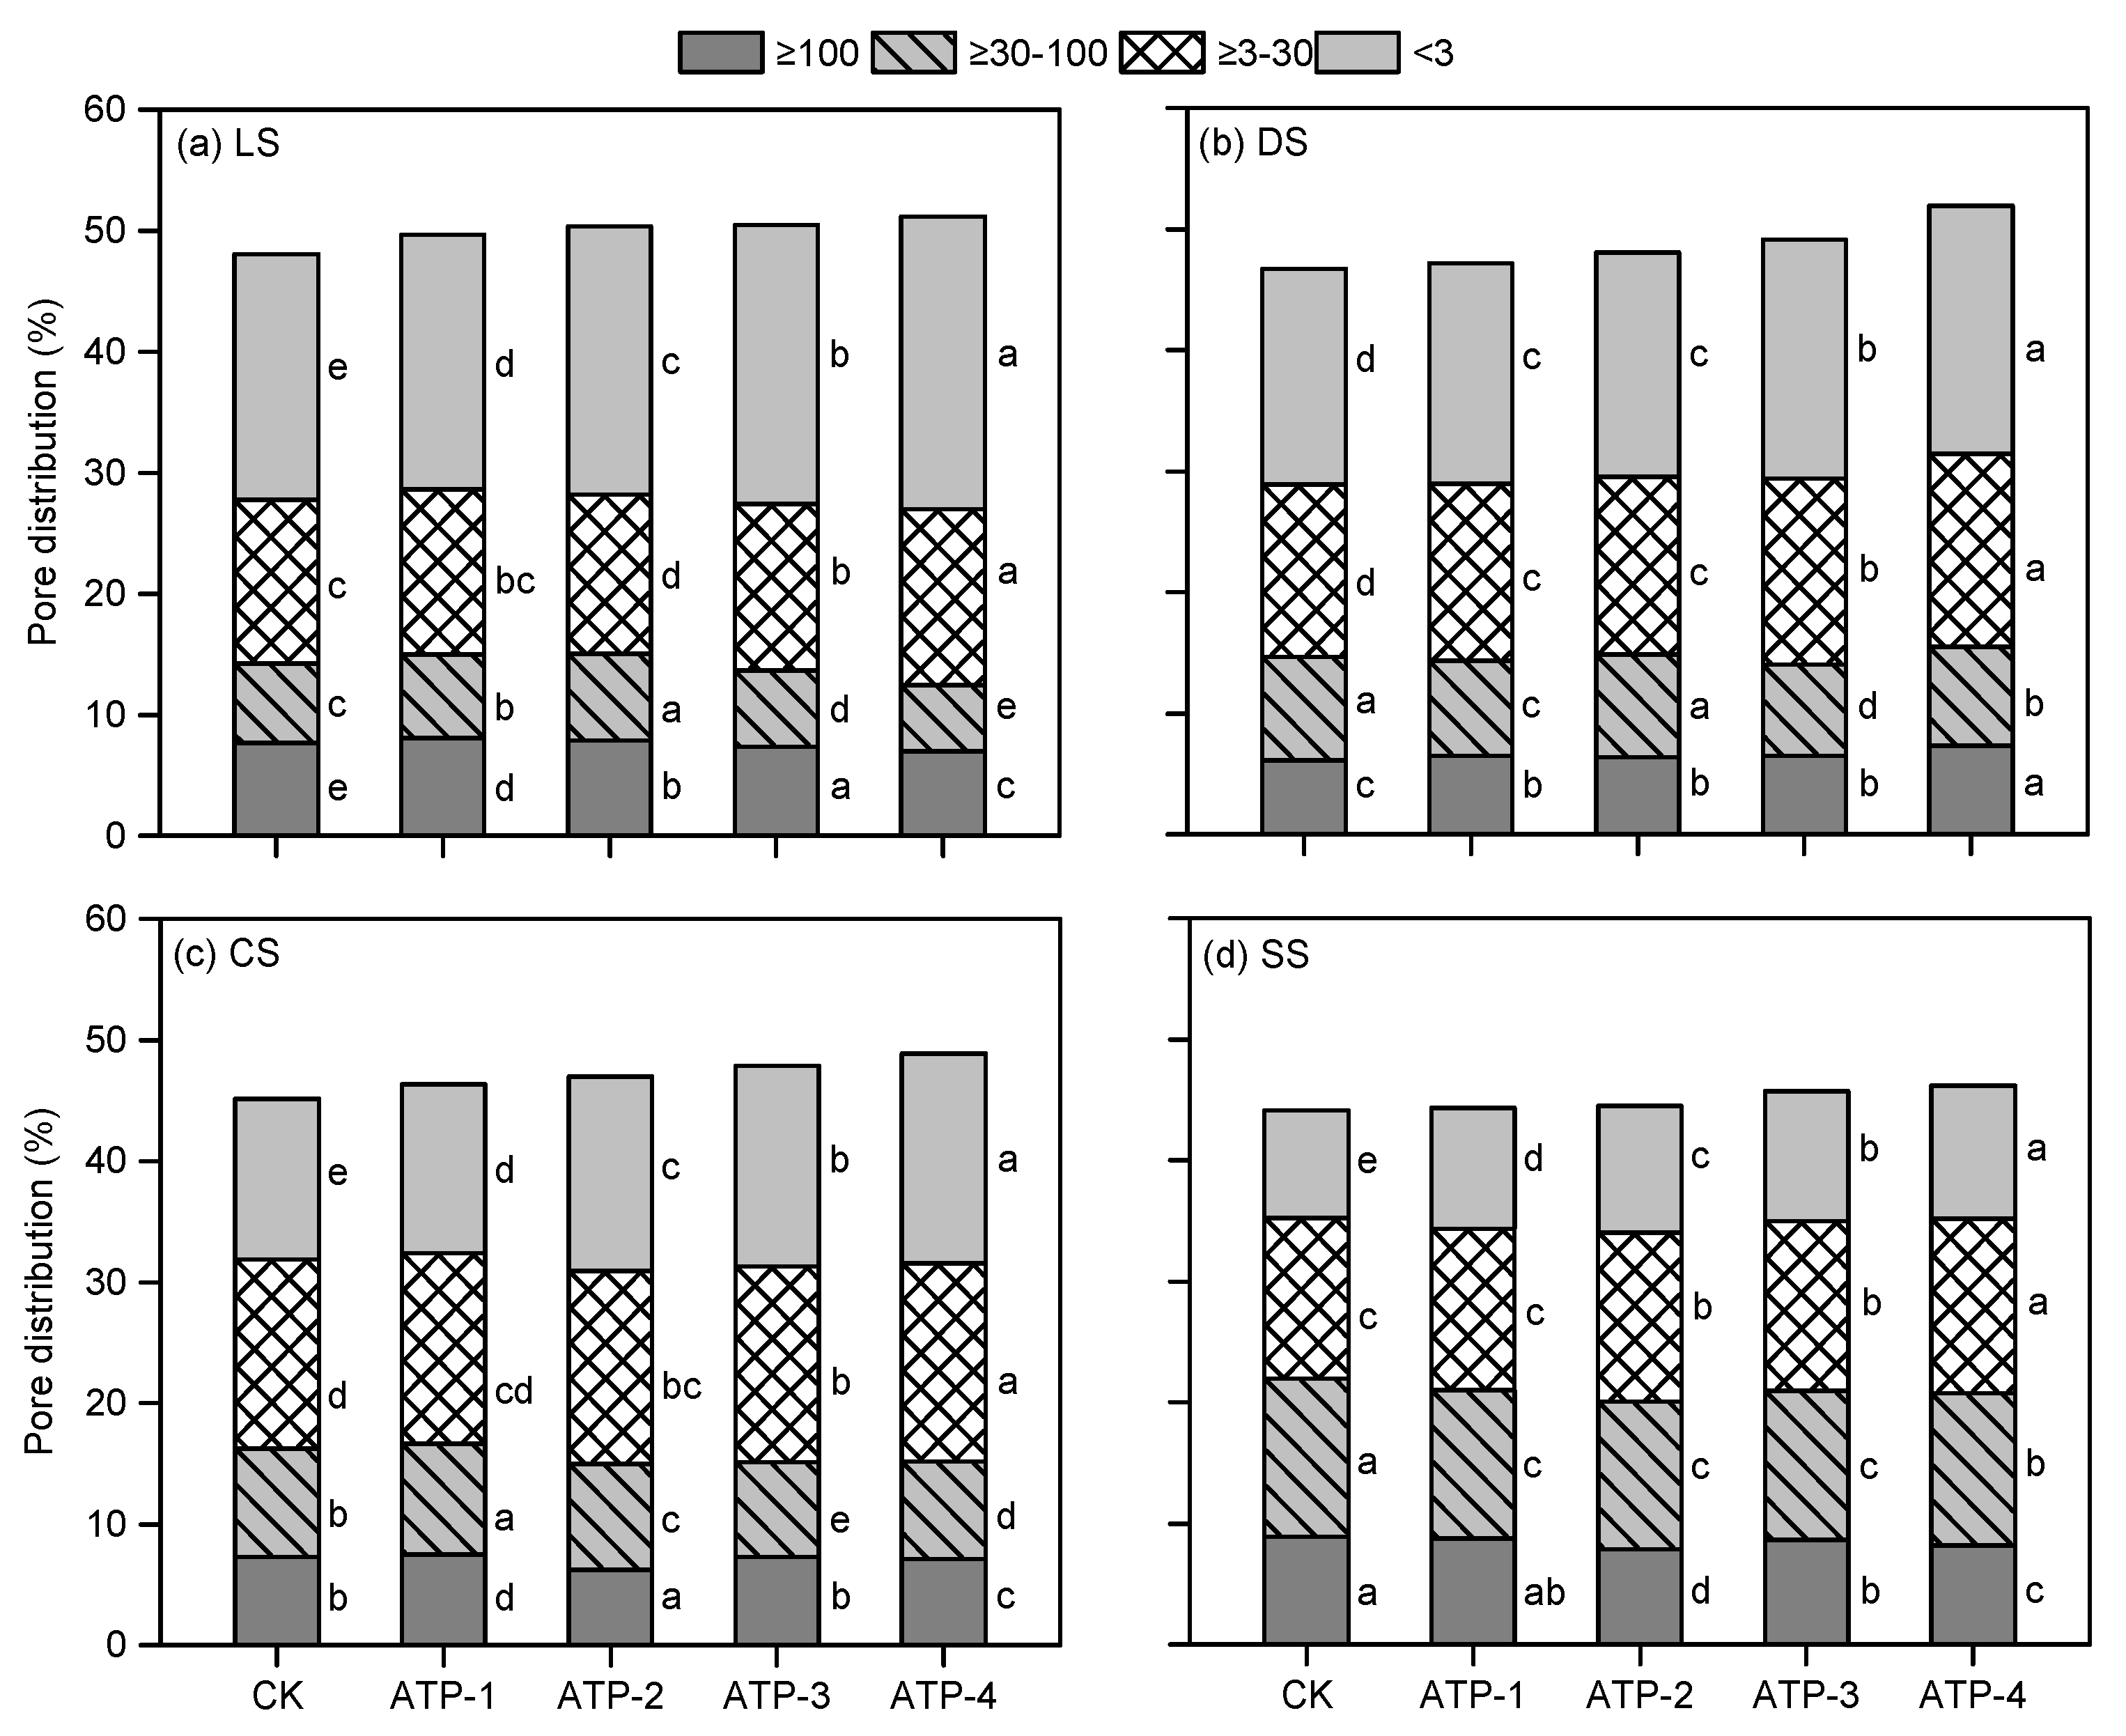
The pore size distribution of different treatments determined from the water retention curve is shown in Figure 3. Overall, it seems that the large pores (>30 μm) and small pores (<30 μm) differed greatly between treatments, whereas the number of small pores was obviously higher than large pores. The addition of ATP resulted in more micropores (<3 μm), and the higher the amount of ATP applied, the more significant the change. Moreover, it was found that LS had the largest overall increase in micropores by comparing the amount of change in macropores and micropores of the four soils, but the ATP-4 treatment of the CS had the largest increase in micropores (30.8%) compared to CK.
3.4. Soil Saturated Hydraulic Conductivity
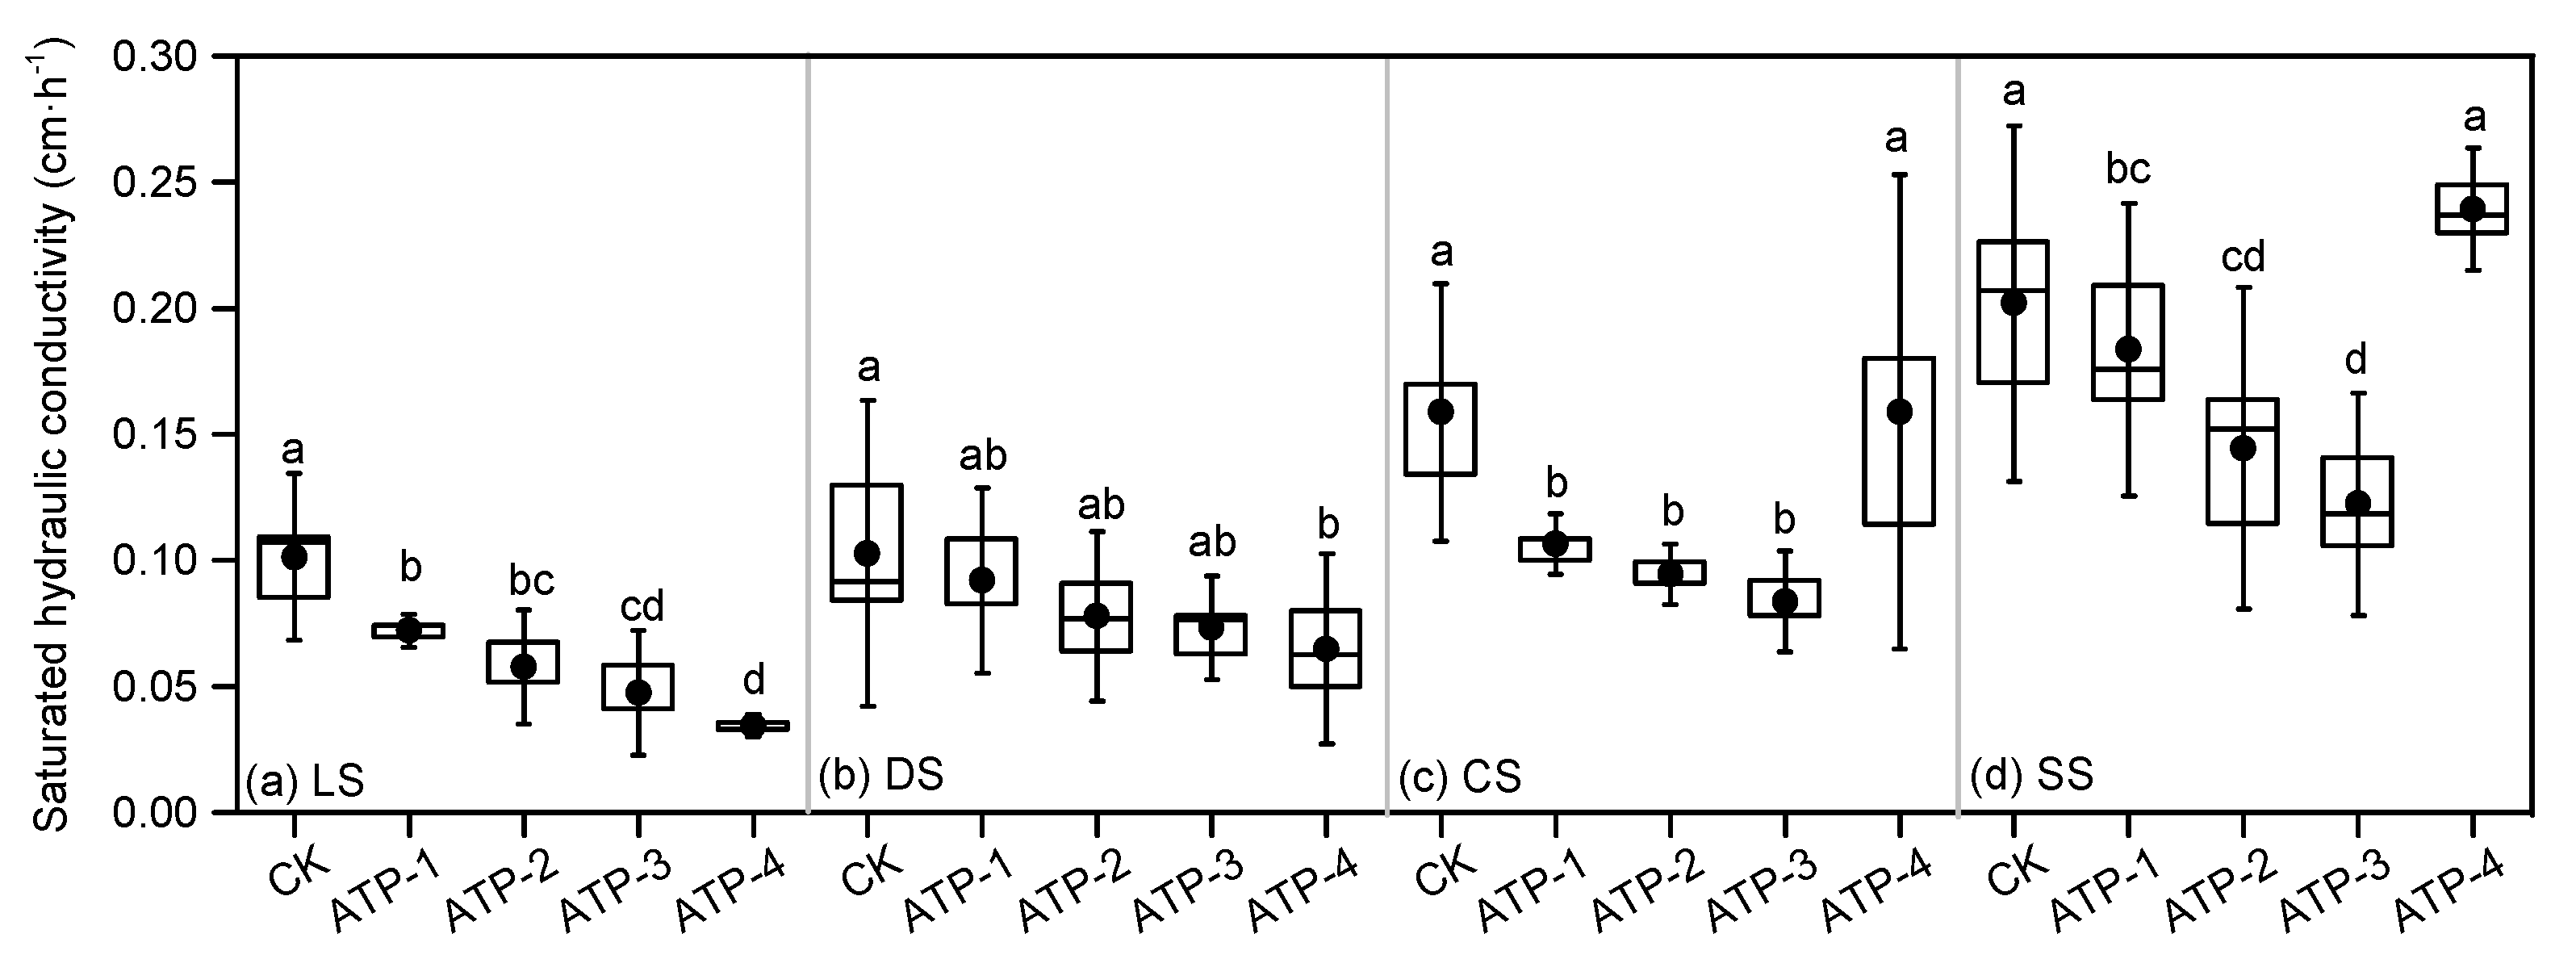
The difference between the saturated hydraulic conductivity (Ks) of the different soils was significant due their texture, and the addition of ATP accentuated these differences (Figure 4). The Ks of LS and DS reduced with an increase of the ATP application amount, whereas the opposite result was obtained when the application amount of ATP was >3% in CS and SS. Compared with the Ks values obtained with the CK treatments, the Ks values of LS, DS, CS, and SS changed by −53.1%, −23.7%, −43.8%, and −44.9%, respectively, when the ATP application amount was 3%.
3.5. Soil Aggregate Stability
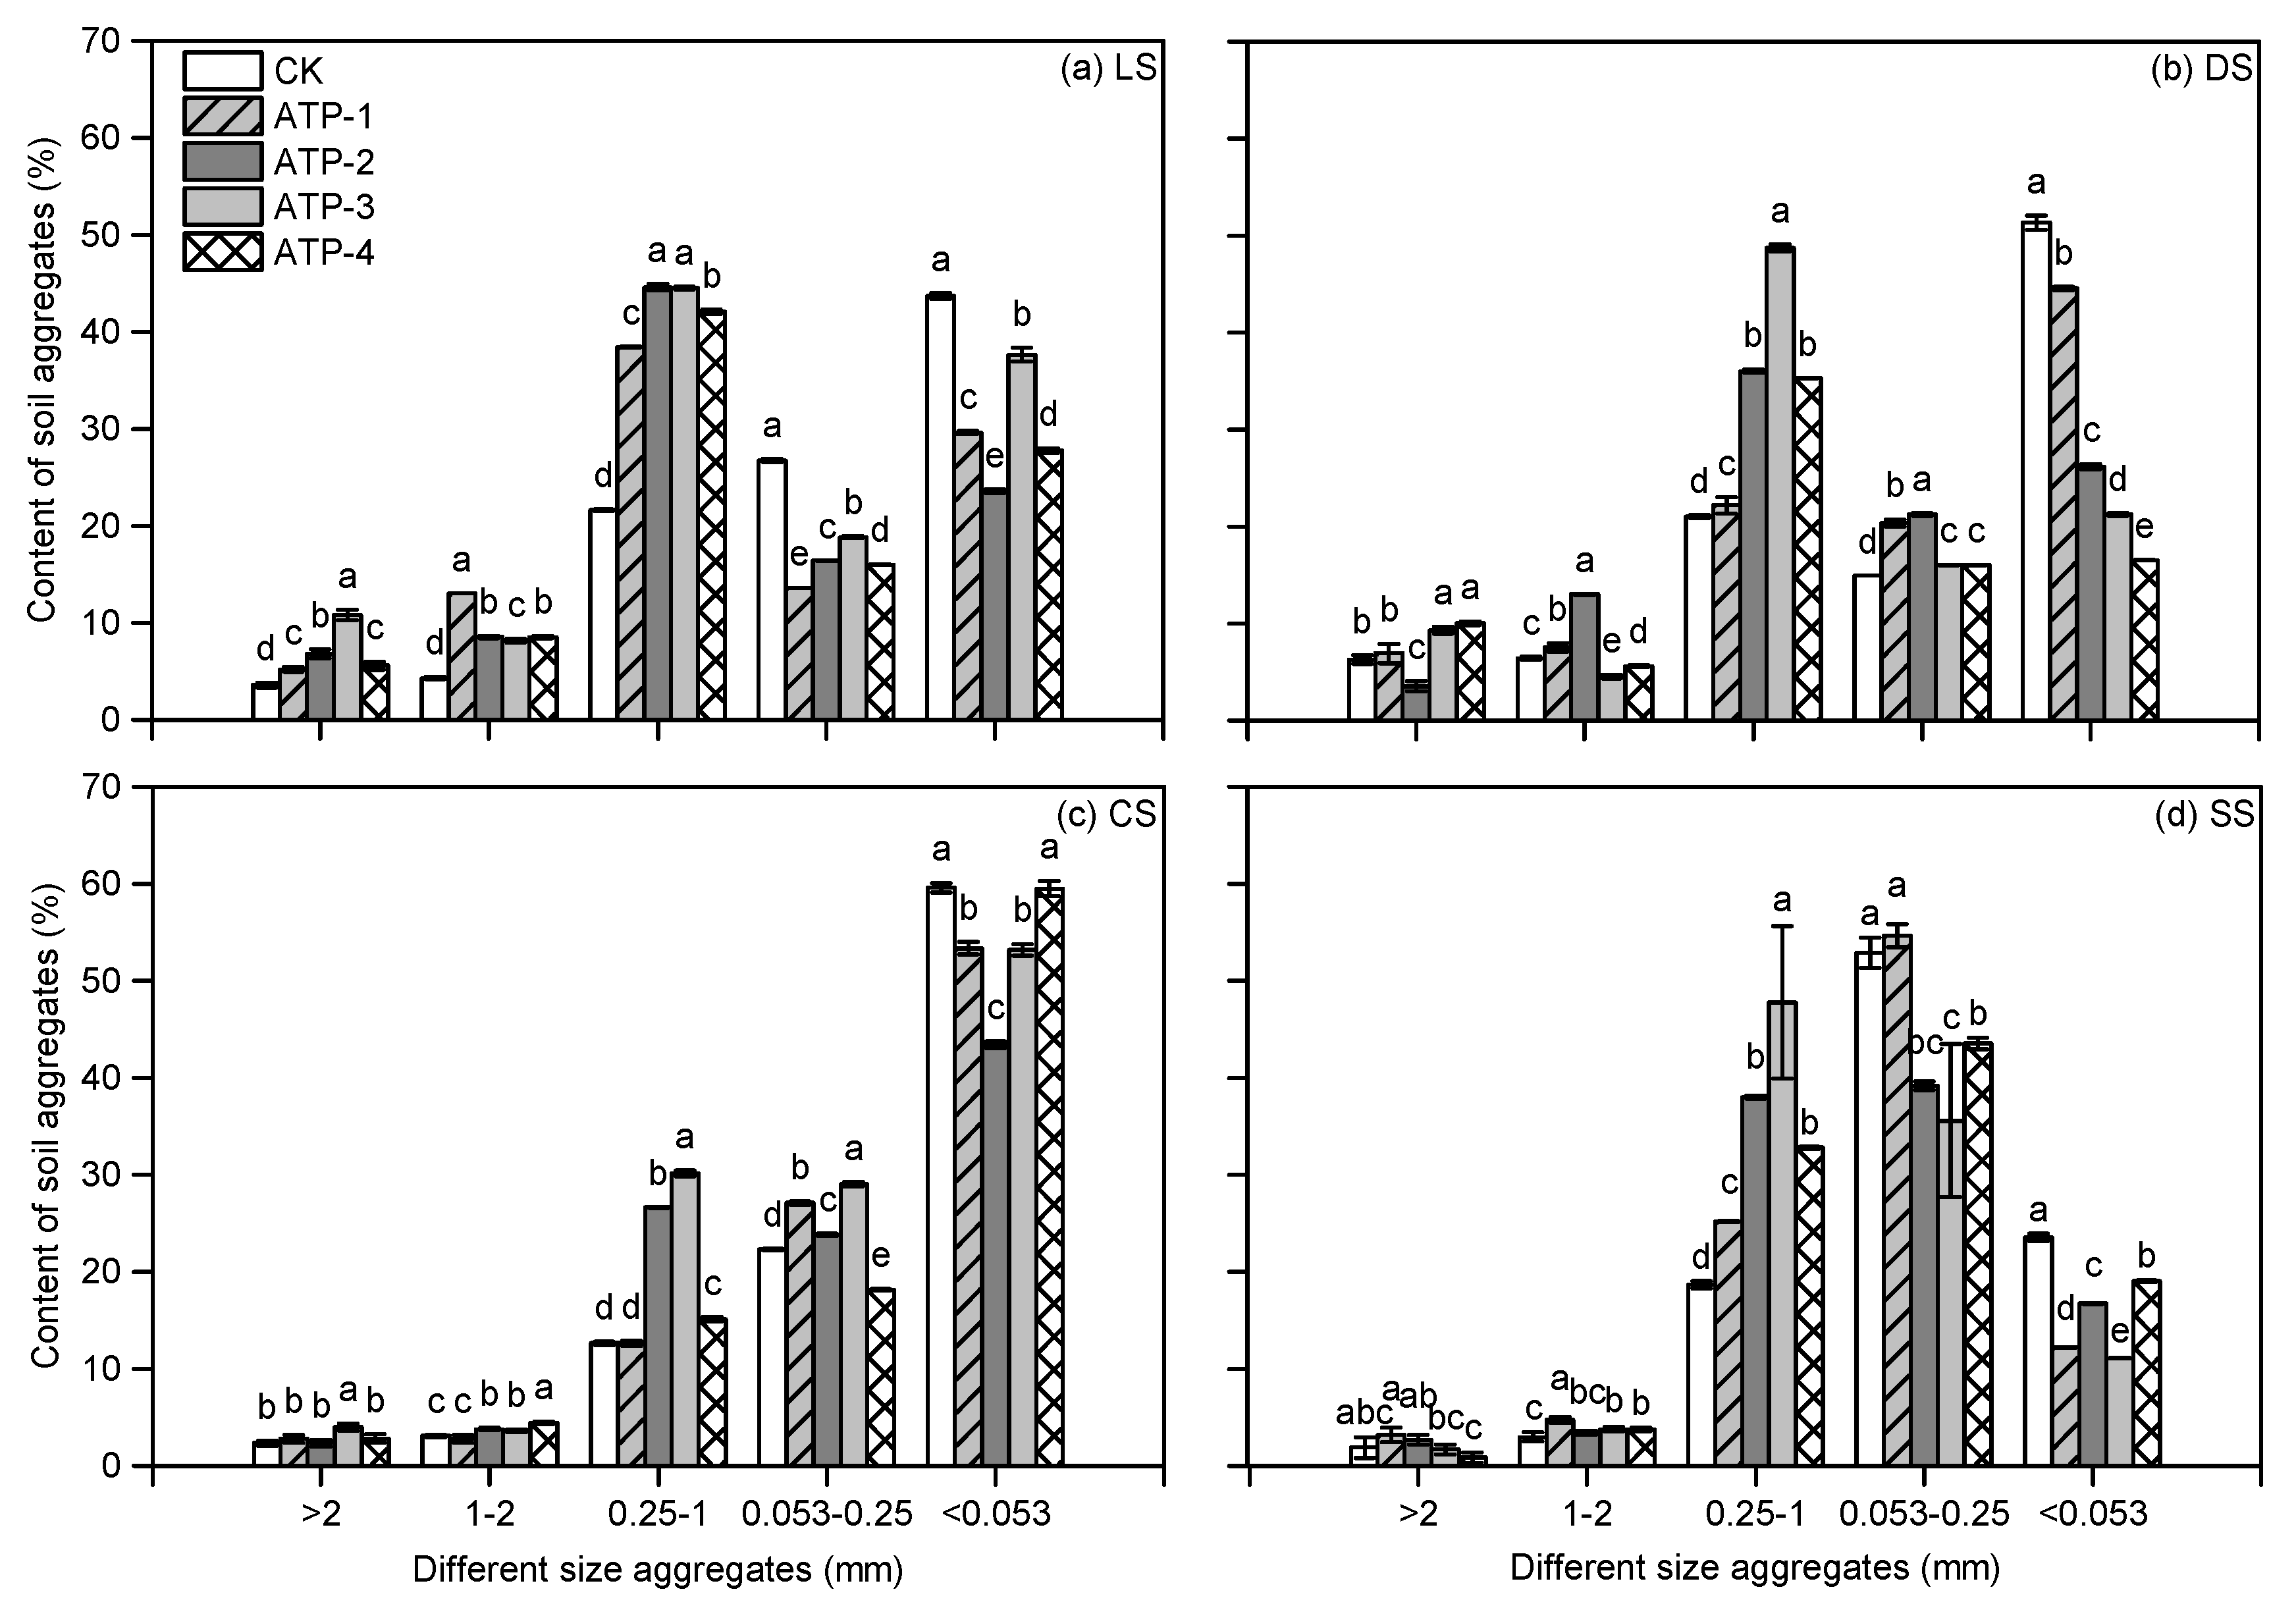
The variation of water-stable aggregates in each size range was different for each treatment (Figure 5). Soil aggregates were mainly concentrated in the size ranges of 0.25–1, 0.053–0.25, and <0.053 mm. Most of the 0.25–1 mm and <0.053 mm aggregates were found in LS and DS, which exhibited similar change trends to the aggregates with ATP treatments. The 0.25–1 mm aggregates in LS and DS with the ATP-3 treatments were increased by 105.8% and 131.8%, respectively. The aggregates of CS were concentrated within <0.053 mm, and the 0.25–1mm aggregates increased by ATP applied. The aggregates of SS were concentrated in the ranges of 0.25–1 mm and 0.053–0.25 mm, and the relative change in the amount of 0.25–1 mm aggregates in SS with the ATP-3 treatment was 155.9%. The application of ATP increased the concentration of the 0.25–1 mm aggregates in each soil type.
The WR0.25 and DR0.25 in each treatment were positively correlated with the amount of ATP applied (Table 5), but WR0.25 was much smaller than DR0.25, indicating that the aggregates of each soil type were primarily mechanically stable aggregates. The DR0.25 with ATP treatments were increased by 1.1%, 4.1%, 3.8%, and 5.2% in the LS, and 53.4%, 62.0%, 88.6%, and 120.5% in the SS, suggesting that ATP has the greatest influence on the mechanically stable aggregates of the SS. The D−MWD and D−GMD of each soil type were positively correlated with the amount of ATP, but the W−MWD and W−GMD decreased with an ATP application amount >3% for CS and SS. The larger the PAD0.25, the worse the stability of the aggregates [54]. The results in each soil type were negatively correlated with the amount of ATP, but the difference of PAD0.25 in CS was not significant. ATP enhanced the mechanical stability of various soil types and had the greatest effect on the water stability of SS.
4. Discussion
4.1. The Effect of ATP on Soil Hydraulic Properties
Understanding soil water holding capacity as well as the physical and chemical properties of soil is essential for enhancing agricultural production in arid and semiarid areas [55]. Soil water safety guarantees suitable crop growth and yield and enables the rational utilization of soil and water resources to ensure food security. Soil water holding characteristics are primarily affected by soil texture and soil structure [56]. ATP, as a clay mineral, directly increases the clay content of the soil, and its hydrophilicity enhances the soil water holding capacity. Our results indicated that ATP reduced the slope of the SWRC and increased the soil moisture content under the same suction, especially for SS, where the θr of the ATP-4 treatments was 109.2% higher than that for the CK treatments. FC and PWP are the indices used to measure the highest and lowest water content required by the crop in soil, and an increase in these two indicators suggests that ATP can contribute toward achieving a sustainable water supply for crops. The FC of LS, DS, CS, and SS with the addition of 4% ATP were increased by 15.9%, 9.3%, 15.7%, and 45.2%. Amoakwah et al. [57] believed that the increase in soil water holding capacity achieved by adding exogenous substances to the soil is due to the increase of small pores. By examining the relationship between soil moisture content and suction, the soil internal structural changes can be indirectly identified. According to Gardner et al. [58], the main factors affecting the SWRC are soil texture and soil structure. When suction reaches the air intake value, the water in the macropores is initially discharged from the soil, and then the water in the micropores is discharged gradually with an increase of suction. When the suction was <0.1 bar, no significant difference was observed in the SWRC of each treatment. Nonetheless, the drainage after ATP treatments was lower than that after CK treatments because residual and bonding pores started to work [57]. A similar observation was made by Aghaalikhani et al. [59]. The results concluded that the higher the amount of ATP applied (up to <4%), the higher the capacity of soil pore to store water. Compared with other soil types, SS exhibited the most drastic changes in soil water content in the low suction section, whereas LS demonstrated relatively small changes in the entire suction section. Therefore, the findings indicate that an increase in the clay content can improve the soil water holding capacity.
Soil water movement is mainly affected by water supply intensity and soil infiltration capacity. Water supply intensity is an external factor, whereas the soil physical properties, such as the initial water content, soil bulk density, and total porosity, are the main factors determining soil matrix infiltration [27,60,61]. As an exogenous substance, the application of ATP can affect the soil water movement characteristics by changing the soil pore structure and affecting the physical properties. ATP reduced the Ks of LS, DS, CS, and SS when the amount of ATP was <4%. In addition, ATP can fill the soil pores due to its small particle size, thus changing soil porosity and pore distribution characteristics, affecting soil texture and hindering water movement. Studies by Fu et al. [62] and Amoakwah et al. [57] have provided similar results. However, when the amount of ATP added was greater than 3%, the opposite results were observed in CS and SS. This difference was due to the expansion of an excessive amount of small particles in ATP, which led to dehydration. The parameter Ks reflects the saturated permeability of the soil, and changes in Ks are due to changes in the soil structure [63]. The clay content in SS, CS, DS, and LS increased with Ks for the same ATP application. Hillel et al. [64] and Xiao et al. [65] have suggested that high-content fine-grained soils (such as loess) have lower permeability than sandy soils. Appropriate amounts of ATP can effectively improve the water leakage caused by excessive water release from soils with a large amount of sand content.
4.2. The Effect of ATP on Soil Pore Characteristics and Aggregate Structure and Stability
Soil is composed of macroaggregates and microaggregates [66]. Several studies have reported that the shape and size of aggregates play a key role in pore size distributions [67]. Soil pore size distribution and total porosity play an important role in soil water solute transport, fertility, and crop root expansion [68]. Fu et al. [62] found that the ratio of the pore diameter (small pore size, medium pore diameter, and large pore diameter) decreased in the middle, and increased at both ends when adding the exogenous substance. Promoting balance between macropores and micropores can ameliorate the soil structure [67]. The application of ATP increased the amount of very fine pores (<3 μm), which helps enhance the soil water holding capacity. The volume of macropores for all layers and cropping systems was >0.10 m3 m−3, which is considered the critical value for crop growth [69]. In addition, the soil particles of SS are relatively dispersed, the adsorption of ATP facilitates cementation. Therefore, ATP had the most significant effect on the agglomerates and pore size distribution of SS.
Clay minerals affect aggregates by influencing the particle surface area, cation exchange capacity, charge density, dispersibility, and swelling [70,71,72,73]. Expansive clays such as 2:1 clay minerals often have higher cation exchange capacity and specific surface area and stronger agglomeration. The study suggested that the soil mechanical stability and water stability are improved by adding ATP, and the mechanical stability is more sensitive than the water stability to ATP application. The D−MWD and D−GWD increased significantly after each ATP treatment. However, the soil water stability decreased when the ATP addition amount was >3%. The reason for this phenomenon is that the hydration of expansive clay particles weakens the joint force between the soil particles during the wetting process due to excessive ATP [74]. The strong adsorption of ATP promotes bonding between individual soil particles, which promotes the formation of soil aggregates. These findings are consistent with the results of this study. Strong physical cohesion of exogenous substances alters the structure of soil aggregates and enhances soil stability [54,75,76].
5. Conclusions
Adding ATP increased the soil clay content significantly, and the increase in clay content of the sandy soil was 53.7% when the ATP application amount was 3%. It can cement soil particles, change the amount of aggregate, and affect the pore distribution. The high absorption of water molecules by ATP enhanced the water holding capacity and reduced the saturated hydraulic conductivity. However, the hydration effect of excessive ATP yielded opposite results when the amount of ATP was >3% for cultivated loess soil and sandy soil. Therefore, the results suggest that the appropriate application amount of ATP in agriculture for soil improvement is 3%.
The environmentally friendly soil amendment ATP, which derives from nature and returns to nature, can improve the soil structure, affect the soil hydraulic properties, and improve the soil water retention capacity. These changes are especially significant for coarse soil. Using ATP in specific ranges can enhance the stability of soil, reduce soil water loss, and improve soil water use efficiency. In addition, ATP can improve the soil and water resource environment of the Loess Plateau, and promote sustainable agricultural development and rational use of water resources in arid and semiarid regions.
Author Contributions
Conceptualization, T.Y. and X.M.; methodology, T.Y.; software, T.Y.; validation, T.Y., X.X. and X.M.; formal analysis, T.Y.; investigation, T.Y., X.X. and Y.G.; resources, T.Y. and X.M.; data curation, Y.G.; writing–original draft preparation, T.Y.; writing–review & editing, T.Y., X.X. and X.M.; visualization, T.Y.; supervision, X.M.; project administration, X.M.; funding acquisition, X.M. All authors have read and agreed to the published version of the manuscript.
Funding
This research was funded by the National Natural Science Foundation of China (grant No. 51279167 and No. 51809217).
Institutional Review Board Statement
Not applicable.
Informed Consent Statement
Not applicable.
Data Availability Statement
Our study did not report to any data.
Conflicts of Interest
The authors declare no conflict of interest.
References
- Hassan, R.; Scholes, R.; Ash, N. Ecosystems and Human Well-being: Current State and Trends: Findings of the Condition and Trends Working Group. In The Millennium Ecosystem Assessment Series; Island Press: Washington, DC, USA, 2005; p. 917. [Google Scholar]
- Minckley, T.A.; Turner, D.S.; Weinstein, S.R. The relevance of wetland conservation in arid regions: A re-examination of vanishing communities in the American Southwest. J. Arid. Environ. 2013, 88, 213–221. [Google Scholar] [CrossRef]
- Wang, X.M.; Zhang, C.X.; Hasi, E.; Dong, Z.B. Has the Three Norths Forest Shelterbelt Program solved the desertification and dust storm problems in arid and semiarid China? J. Arid. Environ. 2010, 74, 13–22. [Google Scholar] [CrossRef]
- Moska, P.; Jary, Z.; Adamiec, G.; Bluszcz, A. High resolution dating of loess profile from Strzyżów (Horodło Plateau-Ridge, Volhynia Upland). Quatern. Int. 2018, 502, 18–29. [Google Scholar] [CrossRef]
- Wang, Y.; Magliulo, V.; Yan, W.; Shangguan, Z. Assessing land surface drying and wetting trends with a normalized soil water index on the Loess Plateau in 2001–2016. Sci. Total Environ. 2019, 676, 120–130. [Google Scholar] [CrossRef] [PubMed]
- Huang, L.; Shao, M. Advances and perspectives on soil water research in China’s Loess Plateau. Earth-Sci. Rev. 2019, 199, 102962. [Google Scholar] [CrossRef]
- Cai, X.; McKinney, D.C.; Rosegrant, M.W. Sustainability analysis for irrigation water management in the Aral Sea region. Agric. Syst. 2003, 76, 1043–1066. [Google Scholar] [CrossRef] [Green Version]
- Hu, Z.; Yang, J.; Yan, L.; Shi, Y. Effects of super absorbent resin on soil characteristics in dry-land wheat. Adv. J. Food Sci. Technol. 2014, 6, 480–483. [Google Scholar] [CrossRef]
- Ding, D.; Zhao, Y.; Feng, H.; Peng, X.; Si, B. Using the double-exponential water retention equation to determine how soil pore-size distribution is linked to soil texture. Soil Tillage Res. 2016, 156, 119–130. [Google Scholar] [CrossRef]
- Ge, N.; Wei, X.; Wang, X.; Liu, X.; Shao, M.; Jia, X.; Zhang, Q. Soil texture determines the distribution of aggregate-associated carbon, nitrogen and phosphorous under two contrasting land use types in the Loess Plateau. Catena 2019, 172, 148–157. [Google Scholar] [CrossRef]
- Pan, F.F.; Peters-Lidard, C.D.; King, A.W. Inverse method for estimating the spatial variability of soil particle size distribution from observed soil moisture. J. Hydrol. Eng. 2010, 15, 931–938. [Google Scholar] [CrossRef]
- Zhao, C.; Shao, M.; Jia, X.; Zhang, C. Particle size distribution of soils (0–500cm) in the Loess Plateau, China. Geoderma Reg. 2016, 7, 251–258. [Google Scholar] [CrossRef]
- Oades, J.M. The retention of organic matter in soils. Biogeochemistry 1988, 5, 35–70. [Google Scholar] [CrossRef]
- Bronick, C.J.; Lal, R. Soil structure and management: A review. Geoderma 2005, 124, 3–22. [Google Scholar] [CrossRef]
- Chen, Y.; Wang, K.; Lin, Y.; Shi, W.; Song, Y.; He, X. Balancing green and grain trade. Nat. Geosci. 2015, 8, 739–741. [Google Scholar] [CrossRef]
- Feng, X.; Fu, B.; Piao, S.; Wang, S.; Ciais, P.; Zeng, Z.; Wu, B. Revegetation in China’s Loess Plateau is approaching sustainable water resource limits. Nat. Clim. Change 2016, 6, 1019–1022. [Google Scholar] [CrossRef]
- Jia, X.; Shao, M.; Zhu, Y.; Luo, Y. Soil moisture decline due to afforestation across the Loess Plateau, China. J. Hydrol. 2017, 546, 113–122. [Google Scholar] [CrossRef]
- Zhang, S.; Yang, D.; Yang, Y.; Piao, S.; Yang, H.; Lei, H.; Fu, B. Excessive afforestation and soil drying on china’s loess plateau. J. Geophys. Res-Biogeo. 2018, 123, 923–935. [Google Scholar] [CrossRef]
- Liang, H.; Xue, Y.; Li, Z.; Wang, S.; Wu, X.; Gao, G.; Fu, B. Soil moisture decline following the plantation of Robinia pseudoacacia forests: Evidence from the Loess Plateau. For. Ecol. Manag. 2018, 412, 62–69. [Google Scholar] [CrossRef]
- Nadler, A.; Perfect, E.; Kay, B.D. Effect of polyacrylamide application on the stability of dry and wet aggregates. Soil Sci. Soc. Am. J. 1996, 60, 555–561. [Google Scholar] [CrossRef]
- Laird, D.A.; Fleming, P.; Davis, D.D. Impact of biochar amendments on the quality of a typical Midwestern agricultural soil. Geoderma 2010, 158, 443–449. [Google Scholar] [CrossRef] [Green Version]
- Lim, T.J.; Spokas, K.A.; Feyereisen, G. Predicting the impact of biochar additions on soil hydraulic properties. Chemosphere 2016, 142, 136–144. [Google Scholar] [CrossRef]
- Kenawy, E.R.; Seggiani, M.; Cinelli, P.; Elnaby, H.; Azaam, M.M. Swelling capacity of sugarcane bagasse-g-poly (acrylamide)/attapulgite superabsorbent composites and their application as slow release fertilizer. Eur. Polym. J. 2020, 133, 109769. [Google Scholar] [CrossRef]
- Garland, T.O.; Patterson, M.W.H. Six cases of acrylamide poisoning. Br. Med. J. 1967, 4, 134–138. [Google Scholar] [CrossRef] [Green Version]
- Sojka, R.E.; Bjorneberg, D.L.; Entry, J.A.; Lentz, R.D.; Orts, W.J. Polyacrylamide in agriculture and environmental land management. Adv. Agron. 2007, 92, 75–162. [Google Scholar]
- Wang, J.; Xia, K.; Waigi, M.G.; Gao, Y.; Odinga, E.S.; Ling, W.; Liu, J. Application of biochar to soils may result in plant contamination and human cancer risk due to exposure of polycyclic aromatic hydrocarbons. Environ. Int. 2018, 121, 169–177. [Google Scholar] [CrossRef] [PubMed]
- Zhang, C.; Zeng, G.; Huang, D.; Lai, C.; Chen, M.; Cheng, M.; Wang, R. Biochar for environmental management: Mitigating greenhouse gas emissions, contaminant treatment, and potential negative impacts. Chem. Eng. J. 2019, 373, 902–922. [Google Scholar] [CrossRef]
- Hossain, M.K.; Strezov, V.; Chan, K.Y.; Ziolkowski, A.; Nelson, P.F. Influence of pyrolysis temperature on production and nutrient properties of wastewater sludge biochar. J. Environ. Manag. 2011, 92, 223–228. [Google Scholar] [CrossRef]
- Chen, J.; Lü, S.; Zhang, Z.; Zhao, X.; Li, X.; Ning, P.; Liu, M. Environmentally friendly fertilizers: A review of materials used and their effects on the environment. Sci. Total Environ. 2018, 613, 829–839. [Google Scholar] [CrossRef] [PubMed]
- Chen, X.; Cui, J.; Xu, X.; Sun, B.; Zhang, L.; Dong, W.; Sun, D. Bacterial cellulose/attapulgite magnetic composites as an efficient adsorbent for heavy metal ions and dye treatment. Carbohydr. Polym. 2019, 229, 115512. [Google Scholar] [CrossRef] [PubMed]
- Mo, X.; Siebecker, M.G.; Gou, W.; Li, W. EXAFS investigation of Ni (II) sorption at the palygorskite-solution interface: New insights into surface-induced precipitation phenomena. Geochim. Cosmochim. Acta 2021, 314, 85–107. [Google Scholar] [CrossRef]
- Otunola, B.O.; Ololade, O.O. A review on the application of clay minerals as heavy metal adsorbents for remediation purposes. Environ. Technol. Innov. 2020, 18, 100692. [Google Scholar] [CrossRef]
- Gan, F.; Zhou, J.; Wang, H.; Du, C.; Chen, X. Removal of phosphate from aqueous solution by thermally treated natural palygorskite. Water Res. 2009, 43, 2907–2915. [Google Scholar] [CrossRef]
- Huang, J.; Liu, Y.; Jin, Q.; Wang, X.; Yang, J. Adsorption studies of a water soluble dye, Reactive Red MF-3B, using sonication-surfactant-modified attapulgite clay. J. Hazard. Mater. 2007, 143, 541–548. [Google Scholar] [CrossRef]
- Yin, H.; Yan, X.; Gu, X. Evaluation of thermally-modified calcium-rich attapulgite as a low-cost substrate for rapid phosphorus removal in constructed wetlands. Water Res. 2017, 115, 329–338. [Google Scholar] [CrossRef] [PubMed]
- Yang, M.; Dai, J.; Wang, L.; Li, Y.; Song, Y. First principles study of structural stability against the distribution of Mg and Al atoms and adsorption behaviors of heavy metals of attapulgite. Comput. Mater. Sci. 2019, 169, 109106. [Google Scholar] [CrossRef]
- Yang, J.; Cheng, W.; Lin, H. Effect of palygorskite adding NPK fertilizer on plant dry matter accumulation and polysaccharide content of radix hedysari. Med. Plants 2010, 4, 5–8. [Google Scholar]
- Qin, S.; Wu, Z.; Rasool, A.; Li, C. Synthesis and characterization of slow-release nitrogen fertilizer with water absorbency: Based on poly (acrylic acid-acrylic amide)/Na-bentonite. J. Appl. Polym. Sci. 2012, 126, 1687–1697. [Google Scholar] [CrossRef]
- Guan, Y.; Song, C.; Gan, Y.; Li, F. Increased maize yield using slow-release attapulgite-coated fertilizers. Agron. Sustain. Dev. 2014, 34, 657–665. [Google Scholar] [CrossRef]
- Rafiq, M.K.; Joseph, S.D.; Li, F.; Bai, Y.; Shang, Z.; Rawal, A.; Long, R.J. Pyrolysis of attapulgite clay blended with yak dung enhances pasture growth and soil health: Characterization and initial field trials. Sci. Total Environ. 2017, 607, 184–194. [Google Scholar] [CrossRef]
- Zhu, W.L.; Cui, L.H.; OuYang, Y.; Long, C.F.; Tang, X.D. Kinetic adsorption of ammonium nitrogen by substrate materials for constructed wetlands. Pedosphere 2011, 21, 454–463. [Google Scholar] [CrossRef]
- Mu, B.; Wang, A. Adsorption of dyes onto palygorskite and its composites: A review. J. Environ. Chem. Eng. 2016, 4, 1274–1294. [Google Scholar] [CrossRef]
- Li, W.; Liu, J.; Su, J.; Wu, J.; Xia, Y.; Zhu, L.; Zhang, D. An efficient and no pollutants deproteinization method for polysaccharide from Arca granosa by palygorskite adsorption treatment. J. Clean. Prod. 2019, 226, 781–792. [Google Scholar] [CrossRef]
- Liang, Y.; Xu, L.; Bao, J.; Firmin, K.A.; Zong, W. Attapulgite enhances methane production from anaerobic digestion of pig slurry by changing enzyme activities and microbial community. Renew. Energy 2020, 145, 222–232. [Google Scholar] [CrossRef]
- Argun, M.E.; Dursun, S. A new approach to modification of natural adsorbent for heavy metal adsorption. Bioresour. Technol. 2008, 99, 2516–2527. [Google Scholar] [CrossRef] [PubMed]
- Xiao, B.; Thomas, K.M. Adsorption of aqueous metal ions on oxygen and nitrogen functionalized nanoporous activated carbons. Langmuir 2005, 21, 3892–3902. [Google Scholar] [CrossRef]
- Chen, N.; Dempere, L.A.; Tong, Z. Synthesis of ph-responsive lignin-based nanocapsules for controlled release of hydrophobic molecules. ACS Sustain. Chem. Eng. 2016, 4, 5204–5211. [Google Scholar] [CrossRef]
- Xing, B. Sorption of naphthalene and phenanthrene by soil humic acids. Environ. Pollut. 2001, 111, 303–309. [Google Scholar] [CrossRef]
- Falayi, T.; Ntuli, F. Removal of heavy metals and neutralisation of acid mine drainage with un-activated attapulgite. J. Ind. Eng. Chem. 2014, 20, 1285–1292. [Google Scholar] [CrossRef]
- Sheffield, J.; Wood, E.F. Projected changes in drought occurrence under future global warming from multi-model, multi-scenario, IPCC AR4 simulations. Clim. Dyn. 2007, 31, 79–105. [Google Scholar] [CrossRef]
- Xu, Y.; Liang, X.; Xu, Y.; Qin, X.; Huang, Q.; Wang, L.; Sun, Y. Remediation of Heavy Metal-Polluted Agricultural Soils Using Clay Minerals: A Review. Pedosphere 2017, 27, 193–204. [Google Scholar] [CrossRef]
- Van Genuchten, M.T. A closed-form equation for predicting the hydraulic conductivity of unsaturated soils. Soil Sci. Soc. Am. J. 1980, 44, 892–898. [Google Scholar] [CrossRef] [Green Version]
- Zangiabadi, M.; Gorji, M.; Shorafa, M.; Khorasani, S.K.; Saadat, S. Effects of soil pore size distribution on plant available water and least limiting water range as soil physical quality indicators. Pedosphere 2020, 30, 253–262. [Google Scholar] [CrossRef]
- Tian, X.; Fan, H.; Wang, J.; Ippolito, J.; Li, Y.; Feng, S.; Wang, K. Effect of polymer materials on soil structure and organic carbon under drip irrigation. Geoderma 2019, 340, 94–103. [Google Scholar] [CrossRef]
- Liebig, M.A.; Tanaka, D.L.; Wienhold, B.J. Tillage and cropping effects on soil quality indicators in the northern Great Plains. Soil Tillage Res. 2004, 78, 131–141. [Google Scholar] [CrossRef] [Green Version]
- Haverkamp, R.; Leij, F.J.; Fuentes, C. Soil water retention. Soil Sci. Soc. Am. J. 2005, 69, 95–104. [Google Scholar] [CrossRef]
- Amoakwah, E.; Frimpong, K.A.; Okaeanti, D. Soil water retention, air flow and pore structure characteristics after corn cob biochar application to a tropical sandy loam. Geoderma 2017, 307, 189–197. [Google Scholar] [CrossRef]
- Gardner, W.R. Availability and measurement of soil water. Water Deficits Plant Growth 1968, 1, 107–135. [Google Scholar]
- Aghaalikhani, M.; Gholamhoseini, M.; Dolatabadian, A.; Khodaei-Joghan, A.; Asilan, K.S. Zeolite influences on nitrate leaching, nitrogen-use efficiency, yield and yield components of canola in sandy soil. Arch. Agron. Soil Sci. 2012, 58, 1149–1169. [Google Scholar] [CrossRef]
- Liu, H.; Lei, T.W.; Zhao, J.; Yuan, C.P.; Fan, Y.T.; Qu, L.Q. Effects of rainfall intensity and antecedent soil water content on soil infiltrability under rainfall conditions using the run off-on-out method. J. Hydrol. 2011, 396, 24–32. [Google Scholar] [CrossRef]
- Biswas, A.; Chau, H.W.; Bedard-Haughn, A.K.; Si, B.C. Factors controlling soil water storage in the hummocky landscape of the Prairie Pothole Region of North America. Can. J. Soil Sci. 2012, 92, 649–663. [Google Scholar] [CrossRef]
- Fu, Q.; Zhao, H.; Li, T.; Hou, R.; Liu, D.; Ji, Y.; Yang, L. Effects of biochar addition on soil hydraulic properties before and after freezing-thawing. Catena 2019, 176, 112–124. [Google Scholar] [CrossRef]
- Chamberlain, E.J.; Gow, A.J. Effect of freezing and thawing on the permeability and structure of soils. Eng. Geol. 1979, 13, 73–92. [Google Scholar] [CrossRef]
- Hillel, D.; Tadmor, N. Water regime and vegetation in the Central Negev Highlands of Israel. Ecology 1962, 43, 33–41. [Google Scholar] [CrossRef]
- Xiao, B.; Sun, F.; Hu, K.; Kidron, G.J. Biocrusts reduce surface soil infiltrability and impede soil water infiltration under tension and ponding conditions in dryland ecosystem. J. Hydrol. 2018, 568, 792–802. [Google Scholar] [CrossRef]
- Six, J.; Conant, R.T.; Paul, E.A.; Paustian, K. Stabilization mechanisms of soil organic matter: Implications for C-saturation of soils. Plant Soil 2002, 241, 155–176. [Google Scholar] [CrossRef]
- Shi, Y.; Zhao, X.; Gao, X.; Zhang, S.; Wu, P. The effects of long-term fertilizer applications on soil organic carbon and hydraulic properties of a loess soil in China. Land Degrad. Dev. 2016, 27, 60–67. [Google Scholar] [CrossRef]
- Gao, L.; Wang, B.; Li, S.; Wu, H.; Wu, X.; Liang, G.; Gong, D.; Zhang, X.; Cai, D.; Degré, A. Soil wet aggregate distribution and pore size distribution under different tillage systems after 16 years in the Loess Plateau of China. Catena 2019, 173, 38–47. [Google Scholar] [CrossRef]
- Xu, X.; Nieber, J.L.; Gupta, S.C. Compaction effects on the gas diffusion coefficients in soils. Soil Sci. Soc. Am. J. 1992, 56, 1743–1750. [Google Scholar] [CrossRef] [Green Version]
- Mamedov, A.; Shainberg, I.; Levy, G. Wetting rate and sodicity effects on interrill erosion from semi-arid Israeli soils. Soil Tillage Res. 2002, 68, 121–132. [Google Scholar] [CrossRef]
- Wakindiki, I.I.C.; Ben-Hur, M. Soil mineralogy and texture effects on crust micromorphology, infiltration, and erosion. Soil Sci. Soc. Am. J. 2002, 66, 897–905. [Google Scholar] [CrossRef]
- Ruiz-Vera, V.M.; Wu, L. Influence of sodicity, clay mineralogy, prewetting rate, and their interaction on aggregate stability. Soil Sci. Soc. Am. J. 2006, 70, 1825–1833. [Google Scholar] [CrossRef]
- Reichert, J.M.; Norton, L.D.; Favaretto, N.; Huang, C.; Blume, E. Settling velocity, aggregate stability, and interrill erodibility of soils varying in clay mineralogy. Soil Sci. Soc. Am. J. 2009, 73, 1369–1377. [Google Scholar] [CrossRef] [Green Version]
- Kemper, W.D.; Rosenau, R.C.; Dexter, A.R. Cohesion development in disrupted soils as affected by clay and organic matter content and temperature. Soil Sci. Soc. Am. J. 1987, 51, 860–867. [Google Scholar] [CrossRef] [Green Version]
- Li, H.; Shi, W.; Shao, H.; Shao, M. The remediation of the lead-polluted garden soil by natural zeolite. J. Hazard. Mater. 2009, 169, 1106–1111. [Google Scholar] [CrossRef]
- Lentz, R.D. Polyacrylamide and biopolymer effects on flocculation, aggregate stability, and water seepage in a silt loam. Geoderma 2015, 241, 289–294. [Google Scholar] [CrossRef]
Figure 1.
Location of the Chinese Loess Plateau and the region for soil sample collections.

Figure 2.
Soil water retention curve (SWRC) for lou soil (LS), dark loessial soil (DS), cultivated loess soil (CS), and sandy soil (SS). pF = log10|h|, where h is the pressure head (cm).
Figure 2.
Soil water retention curve (SWRC) for lou soil (LS), dark loessial soil (DS), cultivated loess soil (CS), and sandy soil (SS). pF = log10|h|, where h is the pressure head (cm).

Figure 3.
Pore size distribution for lou soil (LS), dark loessial soil (DS), cultivated loess soil (CS), and sandy soil (SS). Different lowercase letters indicate significant differences in the parameters for different ATP amounts applied in the same pore size.
Figure 3.
Pore size distribution for lou soil (LS), dark loessial soil (DS), cultivated loess soil (CS), and sandy soil (SS). Different lowercase letters indicate significant differences in the parameters for different ATP amounts applied in the same pore size.

Figure 4.
Saturated hydraulic conductivity (Ks) for lou soil (LS), dark loessial soil (DS), cultivated loess soil (CS), and sandy soil (SS). Different lowercase letters indicate significant differences in the parameters for different ATP amounts applied in the same soil type. Error bars refer to the standard deviation.

Figure 5.
Composition of soil water-stable aggregates with lou soil (LS), dark loessial soil (DS), cultivated loess soil (CS), and sandy soil (SS). Different letters within a size fraction indicate significant differences between the four treatments (p < 0.05). Error bars refer to the standard deviation.


Table 1.
Soil physical index.
| Soil Types | BD (g·cm−3) | IWC (%) | SOM (%) | Particle Composition (%) | Soil Texture | ||
|---|---|---|---|---|---|---|---|
| Clay | Silt | Sand | |||||
| Lou soil (LS) | 1.33 | 3.23 | 15.4 ± 0.4 | 31.0 | 35.0 | 34.0 | Clay loam |
| Dark loessial soil (DS) | 1.38 | 3.69 | 10.9 ± 0.3 | 23.4 | 29.8 | 46.8 | Loam |
| Cultivated loess soil (CS) | 1.38 | 3.58 | 7.9 ± 0.4 | 16.3 | 23.0 | 60.7 | Sandy loam |
| Sandy soil (SS) | 1.57 | 2.27 | 6.8 ± 0.2 | 8.1 | 9.4 | 82.5 | Loamy sand |
Notes: BD is the bulk density; IWC is the initial water content; SOM is the soil organic matter content.
Table 2.
Soil physical properties.
| Soil Types | Treatments | Clay (%) | Silt (%) | Sand (%) | TP (%) | CP (%) |
|---|---|---|---|---|---|---|
| LS | CK | 31.0 ± 0.1 Da | 35.0 ± 0.0 Ba | 34.0 ± 0.1 Ad | 50.8 ± 0.7 Cd | 46.9 ± 1.8 Aa |
| ATP-1 | 31.8 ± 0.1 CDa | 36.6 ± 0.1 Aa | 31.6 ± 0.2 Cd | 51.2 ± 3.1 Bc | 47.2 ± 1.8 Aa | |
| ATP-2 | 32.5 ± 1.0 Ca | 35.4 ± 0.9 Ba | 32.2 ± 0.1 Bd | 51.3 ± 1.3 ABd | 48.3 ± 1.7 Aa | |
| ATP-3 | 34.5 ± 0.0 Aa | 34.6 ± 0.1 Ba | 30.8 ± 0.0 Dd | 51.3 ± 1.1 ABd | 48.7 ± 1.5 Aa | |
| ATP-4 | 34.7 ± 0.2 Ba | 36.7 ± 0.2 Aa | 28.6 ± 0.4 Ed | 52.0 ± 2.0 Ac | 48.4 ± 2.2 Ab | |
| DS | CK | 23.4 ± 0.2 Cb | 29.8 ± 0.3 Cb | 46.8 ± 0.4 Ac | 52.0 ± 0.9 Ac | 47.0 ± 1.2 Aa |
| ATP-1 | 23.3 ± 0.1 Cb | 32.8 ± 0.1 Ab | 43.9 ± 0.1 Dc | 52.7 ± 0.4 Bb | 46.9 ± 0.7 Aa | |
| ATP-2 | 24.4 ± 0.0 Bb | 29.7 ± 0.0 Cb | 45.9 ± 0.0 Bc | 52.6 ± 0.8 bCc | 47.3 ± 1.3 Aa | |
| ATP-3 | 24.9 ± 0.0 Ab | 29.5 ± 0.0 Db | 45.6 ± 0.0 Bc | 53.0 ± 1.2 CDc | 48.1 ± 1.1 Aa | |
| ATP-4 | 25.5 ± 0.0 Bb | 30.5 ± 0.0 Bb | 43.9 ± 0.0 Cc | 52.8 ± 0.3 Db | 47.8 ± 0.3 Abc | |
| CS | CK | 16.3 ± 0.1 Ec | 23.0 ± 0.0 Cc | 60.7 ± 0.1 Bb | 50.6 ± 0.7 Ab | 47.9 ± 0.9 Ca |
| ATP-1 | 16.4 ± 0.0 Dc | 22.6 ± 0.0 Ec | 60.9 ± 0.1 Ab | 50.9 ± 0.5 Bb | 48.5 ± 0.9 BCa | |
| ATP-2 | 18.1 ± 0.0 Cc | 22.9 ± 0.0 Dc | 59.1 ± 0.0 Cb | 51.0 ± 0.9 Cb | 49.1 ± 1.0 ABCa | |
| ATP-3 | 20.5 ± 0.0 Bc | 25.1 ± 0.0 Bc | 54.5 ± 0.0 Db | 51.3 ± 0.3 Cb | 49.7 ± 1.1 ABa | |
| ATP-4 | 21.1 ± 0.0 Ac | 26.4 ± 0.0 Ac | 52.5 ± 0.0 Eb | 50.9 ± 2.5 Da | 50.8 ± 0.3 Aa | |
| SS | CK | 8.1 ± 0.0 Ed | 9.4 ± 0.0 Ed | 82.5 ± 0.0 Aa | 45.9 ± 0.1 Aa | 44.2 ± 0.1 Cb |
| ATP-1 | 8.9 ± 0.1 Dd | 10.2 ± 0.1 Cd | 80.9 ± 0.1 Ba | 46.0 ± 1.2 Aa | 44.7 ± 0.1 Bb | |
| ATP-2 | 9.1 ± 0.0 Cd | 9.9 ± 0.0 Dd | 81.0 ± 0.1 Ba | 46.2 ± 1.9 Ba | 45.0 ± 0.1 Bb | |
| ATP-3 | 12.4 ± 0.0 Ad | 13.4 ± 0.0 Ad | 74.2 ± 0.0 Da | 46.3 ± 1.1 Ba | 45.8 ± 0.1 Ab | |
| ATP-4 | 13.0 ± 0.1 Bd | 11.5 ± 0.1 Bd | 75.5 ± 0.1 Ca | 46.2 ± 2.5 Ba | 46.1 ± 0.4 Ac |
Note: LS is lou soil; DS is dark loessial soil; CS is cultivated loess soil; SS is sandy soil. TP is total porosity; CP is capillary porosity. The data represent means ± standard deviation. Different uppercase letters indicate significant differences in the parameters for different ATP amounts applied in the same soil type. Different lowercase letters indicate significant differences in the parameters for the same ATP amount applied in different soil types.
Table 3.
Parameter fitting for the van Genuchten model.
| Soil Types | Treatments | Van Genuchten | |||||
|---|---|---|---|---|---|---|---|
| θr | θs | A | n | R2 | RMSE | ||
| LS | CK | 0.077 | 0.480 | 0.039 | 1.317 | 0.9989 | 0.009 |
| ATP-1 | 0.082 | 0.496 | 0.040 | 1.310 | 0.9999 | 0.008 | |
| ATP-2 | 0.092 | 0.503 | 0.041 | 1.307 | 0.9999 | 0.006 | |
| ATP-3 | 0.093 | 0.503 | 0.035 | 1.305 | 0.9997 | 0.015 | |
| ATP-4 | 0.097 | 0.514 | 0.035 | 1.294 | 0.9999 | 0.008 | |
| DS | CK | 0.049 | 0.467 | 0.028 | 1.341 | 0.9995 | 0.005 |
| ATP-1 | 0.052 | 0.471 | 0.029 | 1.341 | 0.9999 | 0.005 | |
| ATP-2 | 0.052 | 0.480 | 0.029 | 1.338 | 0.9992 | 0.005 | |
| ATP-3 | 0.059 | 0.490 | 0.026 | 1.335 | 0.9996 | 0.008 | |
| ATP-4 | 0.060 | 0.493 | 0.025 | 1.316 | 0.9992 | 0.004 | |
| CS | CK | 0.061 | 0.448 | 0.023 | 1.520 | 0.9999 | 0.013 |
| ATP-1 | 0.062 | 0.460 | 0.024 | 1.497 | 0.9999 | 0.010 | |
| ATP-2 | 0.062 | 0.469 | 0.024 | 1.437 | 0.9998 | 0.007 | |
| ATP-3 | 0.067 | 0.476 | 0.025 | 1.425 | 0.9996 | 0.013 | |
| ATP-4 | 0.071 | 0.455 | 0.031 | 1.411 | 0.9999 | 0.007 | |
| SS | CK | 0.027 | 0.373 | 0.022 | 1.770 | 0.9996 | 0.004 |
| ATP-1 | 0.031 | 0.375 | 0.024 | 1.716 | 0.9999 | 0.005 | |
| ATP-2 | 0.041 | 0.383 | 0.029 | 1.702 | 0.9993 | 0.010 | |
| ATP-3 | 0.053 | 0.409 | 0.031 | 1.687 | 0.9999 | 0.008 | |
| ATP-4 | 0.057 | 0.486 | 0.032 | 1.649 | 0.9999 | 0.006 | |
Note: LS is lou soil; DS is dark loessial soil; CS is cultivated loess soil; SS is sandy soil. θr is the residual volumetric water content (cm3 cm−3); θs is the saturated volumetric water content (cm3 cm−3); α is the reciprocal of the intake value (cm−1); n is the parameters characterizing the shape of the curve. θr, θs, α, and n are statistical parameters of the van Genuchten model, obtained using RETC software; R2 = correlation coefficient; RMSE = root mean square error.
Table 4.
Soil physical properties of lou soil, dark loessial soil, cultivated loess soil, and sandy soil obtained from the soil water retention curve.
Table 4.
Soil physical properties of lou soil, dark loessial soil, cultivated loess soil, and sandy soil obtained from the soil water retention curve.
| Soil Types | Treatments | FC (cm·cm−3) | PWP (cm·cm−3) | AWC (cm·cm−3) |
|---|---|---|---|---|
| LS | CK | 0.258 ± 0.008 Da | 0.133 ± 0.004 Da | 0.125 ± 0.004 Cb |
| ATP-1 | 0.267 ± 0.008 Ca | 0.139 ± 0.004 Ca | 0.128 ± 0.004 Bb | |
| ATP-2 | 0.276 ± 0.008 Ba | 0.148 ± 0.004 Ba | 0.128 ± 0.004 Bb | |
| ATP-3 | 0.281 ± 0.008 Ba | 0.153 ± 0.005 Ba | 0.128 ± 0.004 Bc | |
| ATP-4 | 0.299 ± 0.009 Aa | 0.163 ± 0.005 Aa | 0.136 ± 0.004 Cb | |
| DS | CK | 0.249 ± 0.012 Ca | 0.102 ± 0.005 Cb | 0.147 ± 0.007 Ba |
| ATP-1 | 0.252 ± 0.013 BCa | 0.105 ± 0.005 Bb | 0.146 ± 0.007 Ba | |
| ATP-2 | 0.255 ± 0.013 Bb | 0.107 ± 0.005 Bb | 0.148 ± 0.007 Ba | |
| ATP-3 | 0.273 ± 0.014 Aa | 0.117 ± 0.006 Ab | 0.156 ± 0.008 Aa | |
| ATP-4 | 0.272 ± 0.014 Ab | 0.116 ± 0.006 Ab | 0.156 ± 0.008 Aa | |
| CS | CK | 0.198 ± 0.008 Eb | 0.079 ± 0.003 Dc | 0.119 ± 0.005 Db |
| ATP-1 | 0.206 ± 0.008 Db | 0.082 ± 0.003 Cc | 0.124 ± 0.005 Cb | |
| ATP-2 | 0.216 ± 0.009 Cc | 0.086 ± 0.003 Bc | 0.131 ± 0.005 Bb | |
| ATP-3 | 0.229 ± 0.009 Bc | 0.086 ± 0.003 Bc | 0.143 ± 0.006 Aa | |
| ATP-4 | 0.234 ± 0.009 Ab | 0.091 ± 0.004 Ac | 0.143 ± 0.006 Ab | |
| SS | CK | 0.111 ± 0.010 Ec | 0.029 ± 0.003 Ed | 0.082 ± 0.007 Cc |
| ATP-1 | 0.122 ± 0.011 Dc | 0.033 ± 0.003 Dd | 0.088 ± 0.008 Bc | |
| ATP-2 | 0.140 ± 0.013 Cd | 0.044 ± 0.004 Cd | 0.096 ± 0.009 Ac | |
| ATP-3 | 0.154 ± 0.014 Bc | 0.057 ± 0.005 Bd | 0.097 ± 0.009 Ad | |
| ATP-4 | 0.161 ± 0.014 Ad | 0.065 ± 0.006 Ad | 0.096 ± 0.009 Ac |
Note: LS is lou soil; DS is dark loessial soil; CS is cultivated loess soil; SS is sandy soil. FC is the field water holding capacity; PWP is the permanent wilting point; AWC is the available water content. The data represent means ± standard deviation. Different uppercase letters indicate significant differences in the parameters for different ATP application amounts for the same soil type. Different lowercase letters indicate significant differences in the parameters for the same ATP application amount in different soil types.
Table 5.
Changes in soil aggregates (>0.25 mm) content, mean weight diameter, geometric mean diameter, and percentage of aggregate destruction with different material treatments.
Table 5.
Changes in soil aggregates (>0.25 mm) content, mean weight diameter, geometric mean diameter, and percentage of aggregate destruction with different material treatments.
| Soil Types | Treatments | WR0.25 (%) | W−MWD (mm) | W−GWD (mm) | DR0.25 (%) | D−MWD (mm) | D−GWD (mm) | PAD0.25 (%) |
|---|---|---|---|---|---|---|---|---|
| LS | CK | 29.6 ± 0.4 Db | 0.392 ± 0.014 Db | 0.243 ± 0.003 Db | 88.9 ± 0.4 Da | 3.244 ± 0.062 Da | 1.941 ± 0.050 Da | 66.7 ± 0.6 Ab |
| ATP-1 | 56.7 ± 0.2 Aa | 0.625 ± 0.012 Ca | 0.406 ± 0.003 Bb | 89.9 ± 0.2 Ca | 3.488 ± 0.055 Ca | 2.137 ± 0.046 Ca | 36.9 ± 0.3 Dc | |
| ATP-2 | 55.0 ± 0.2 Ba | 0.658 ± 0.023 Ba | 0.471 ± 0.007 Aa | 92.5 ± 0.2 Ba | 3.858 ± 0.046 Aa | 2.716 ± 0.052 Aa | 35.2 ± 0.4 Ec | |
| ATP-3 | 43.5 ± 0.8 Cc | 0.705 ± 0.034 Aa | 0.334 ± 0.010 Cc | 92.3 ± 0.6 Ba | 3.577 ± 0.065 BCa | 2.557 ± 0.088 Ba | 52.8 ± 1.2 Bb | |
| ATP-4 | 56.2 ± 0.3 Ba | 0.596 ± 0.022 Cb | 0.413 ± 0.006 Bc | 93.5 ± 0.4 Aa | 3.642 ± 0.051 Ba | 2.676 ± 0.065 Aa | 39.9 ± 0.6 Cd | |
| DS | CK | 33.7 ± 0.8 Dd | 0.501 ± 0.027 Ca | 0.216 ± 0.006 Ec | 81.4 ± 0.2 Eb | 3.196 ± 0.058 Ca | 1.709 ± 0.040 Db | 58.5 ± 1.0 Ac |
| ATP-1 | 36.7 ± 2.4 Cb | 0.565 ± 0.064 Ba | 0.257 ± 0.003 Dc | 84.1 ± 0.3 Db | 3.353 ± 0.056 Bb | 1.974 ± 0.041 Cb | 56.4 ± 2.9 Ab | |
| ATP-2 | 52.6 ± 0.4 Bb | 0.580 ± 0.026 Bb | 0.418 ± 0.007 Cb | 85.2 ± 0.3 Cb | 3.416 ± 0.055 Bb | 2.082 ± 0.049 Bb | 38.2 ± 0.7 Cb | |
| ATP-3 | 62.7 ± 0.2 Aa | 0.675 ± 0.022 Aa | 0.516 ± 0.006 Bb | 87.7 ± 0.2 Ab | 3.523 ± 0.043 Aa | 2.335 ± 0.041 Ab | 28.6 ± 0.3 Dc | |
| ATP-4 | 51.0 ± 0.2 Bb | 0.714 ± 0.011 Aa | 0.550 ± 0.003 Aa | 86.7 ± 0.3 Bb | 3.583 ± 0.052 Aa | 2.397 ± 0.059 Ab | 41.2 ± 0.5 Bc | |
| CS | CK | 18.1 ± 0.5 Dd | 0.271 ± 0.016 Bc | 0.155 ± 0.003 Cd | 74.0 ± 0.0 Ec | 2.957 ± 0.037 Db | 1.536 ± 0.023 Ec | 75.6 ± 0.7 Ba |
| ATP-1 | 19.6 ± 0.8 Cd | 0.317 ± 0.024 Ac | 0.183 ± 0.005 Bd | 75.4 ± 0.1 Cc | 3.061 ± 0.035 Cc | 1.664 ± 0.024 Cc | 74.0 ± 1.1 Ba | |
| ATP-2 | 32.8 ± 0.5 Ad | 0.336 ± 0.018 Ad | 0.244 ± 0.004 Ac | 76.4 ± 0.1 Bc | 3.289 ± 0.034 Ac | 1.836 ± 0.026 Bc | 57.1 ± 0.6 Da | |
| ATP-3 | 17.8 ± 0.8 Dd | 0.348 ± 0.022 Ac | 0.186 ± 0.005 Bd | 78.7 ± 0.12 Ac | 3.209 ± 0.037 Bb | 1.960 ± 0.033 Ac | 77.4 ± 1.1 Aa | |
| ATP-4 | 22.3 ± 0.8 Bd | 0.329 ± 0.026 Ac | 0.161 ± 0.005 Cd | 74.9 ± 0.0 Dc | 3.030 ± 0.041 Cb | 1.603 ± 0.026 Dc | 70.2 ± 1.1 Ca | |
| SS | CK | 23.6 ± 1.9 Ec | 0.315 ± 0.061 Bc | 0.368 ± 0.014 Ea | 30.1 ± 0.8 Ed | 0.788 ± 0.089 Dc | 0.567 ± 0.019 Ed | 21.7 ± 4.2 Cd |
| ATP-1 | 33.1 ± 1.2 Dc | 0.432 ± 0.042 Ab | 0.514 ± 0.009 Ba | 46.1 ± 0.8 Dd | 1.465 ± 0.079 Cd | 0.753 ± 0.023 Dd | 28.2 ± 1.3 Bd | |
| ATP-2 | 44.1 ± 0.5 Bc | 0.409 ± 0.026 Ac | 0.480 ± 0.006 Ca | 48.7 ± 0.4 Cd | 1.553 ± 0.079 Cd | 0.851 ± 0.025 Cd | 9.5 ± 0.3 Ed | |
| ATP-3 | 48.8 ± 0.5 Ab | 0.434 ± 0.033 Ab | 0.554 ± 0.021 Aa | 56.7 ± 0.6 Bd | 2.082 ± 0.064 Bc | 1.077 ± 0.027 Bd | 14.0 ± 0.1 Dd | |
| ATP-4 | 37.4 ± 0.7 Cc | 0.318 ± 0.030 Bc | 0.428 ± 0.007 Db | 66.3 ± 1.3 Ad | 2.557 ± 0.057 Ac | 1.437 ± 0.039 Ad | 43.6 ± 0.0 Ab |
Note: LS is lou soil; DS is dark loessial soil; CS is cultivated loess soil; SS is sandy soil. WR0.25 is the content of >0.25 mm soil water-stable aggregate; DR0.25 is the content of >0.25 mm soil mechanical stable aggregate; W−MWD is the mean weight diameter of water-stable aggregate; D−MWD is the mean weight diameter of mechanical stable aggregate; W−GWD is the geometric mean diameter of water-stable aggregate; D−GWD is the geometric mean diameter of mechanical stable aggregate; PAD0.25 is the >0.25 mm percentage of aggregate destruction. The data represent means ± standard deviation. Different uppercase letters indicate significant differences in the parameters for different ATP application amounts for the same soil type. Different lowercase letters indicate significant differences in the parameters for the same ATP application amounts in different soil types.
Publisher’s Note: MDPI stays neutral with regard to jurisdictional claims in published maps and institutional affiliations. |
© 2022 by the authors. Licensee MDPI, Basel, Switzerland. This article is an open access article distributed under the terms and conditions of the Creative Commons Attribution (CC BY) license (https://creativecommons.org/licenses/by/4.0/).
Share and Cite
MDPI and ACS Style
Yang, T.; Xing, X.; Gao, Y.; Ma, X. An Environmentally Friendly Soil Amendment for Enhancing Soil Water Availability in Drought-Prone Soils. Agronomy 2022, 12, 133. https://0-doi-org.brum.beds.ac.uk/10.3390/agronomy12010133
AMA Style
Yang T, Xing X, Gao Y, Ma X. An Environmentally Friendly Soil Amendment for Enhancing Soil Water Availability in Drought-Prone Soils. Agronomy. 2022; 12(1):133. https://0-doi-org.brum.beds.ac.uk/10.3390/agronomy12010133
Chicago/Turabian StyleYang, Ting, Xuguang Xing, Yan Gao, and Xiaoyi Ma. 2022. "An Environmentally Friendly Soil Amendment for Enhancing Soil Water Availability in Drought-Prone Soils" Agronomy 12, no. 1: 133. https://0-doi-org.brum.beds.ac.uk/10.3390/agronomy12010133
Note that from the first issue of 2016, this journal uses article numbers instead of page numbers. See further details here.