Article

Early Effects of Fertilizer and Herbicide Reduction on Root-Associated Biota in Oil Palm Plantations

1
Forest Botany and Tree Physiology, University of Goettingen, 37077 Göttingen, Germany
2
Agriculture Faculty, Khairun University, Ternate 97719, Indonesia
3
Genomic and Applied Microbiology and Göttingen Genomics Laboratory, University of Goettingen, 37077 Göttingen, Germany
4
Faculty of Agriculture, Tadulako University, Palu 94118, Indonesia
5
Forestry Department, Agriculture Faculty, University of Jambi, Jambi 36361, Indonesia
*
Author to whom correspondence should be addressed.
Submission received: 22 December 2021 / Revised: 7 January 2022 / Accepted: 11 January 2022 / Published: 14 January 2022

Abstract

:
To secure high yield, tropical oil palm plantations are fertilized, and understory vegetation is controlled by chemical clearing with herbicides. These treatments cause a drastic turnover of soil microbes and cause loss of beneficial mycorrhizal fungi. Here, we tested if reduced fertilization and weeding instead of conventional treatments restored beneficial ecological groups associated with roots. We conducted our study one year after the start of the reduced management in large-scale oil palm plantations. We hypothesized that reduced fertilizer application and weeding result in shifts of the root-associated species composition because changes in the management regimes affect belowground biomass and nutrients in soil and roots. Alternatively, we hypothesized that the legacy of massive soil fertilization and herbicide application preclude compositional shifts of root-associated biota within short time periods. We did not find any significant treatment effects on root nutrient contents, root biomass, and nutrients in soil. At the level of species (based on operational taxonomic units obtained by Illumina sequencing) or phyla, no significant effects of reduced management were observed. However, distinct functional groups showed early responses to the treatments: nematodes decreased in response to weeding; yeasts and ectomycorrhizal-multitrophic fungi increased under fertilizer treatments; arbuscular mycorrhizal fungi increased under fertilizer reduction. Since the responsive ecological groups were represented by low sequence abundances, their responses were masked by very high sequence abundances of saprotrophic and pathotrophic fungi. Thus, the composition of the whole root-associated community was unaffected by reduced management. In conclusion, our results show that changes in management regimes start to re-wire critical constituents of soil–plant food webs.

1. Introduction

The main driver of tropical rain forest transformation in south-east Asia is the expansion of oil palm plantations [1,2]. Palm oil is the most lucrative oil crop in the world and Indonesia is one of the main producers and exporters of this commodity [3,4]. The expansion of areas for palm oil production has benefited the economic situation of smallholder farmers and decreased the country’s dependence on the import of fossil fuels [5,6]. However, the high deforestation rate to enlarge plantation areas [7,8] comes with ecological trade-offs in biodiversity and ecosystem functions [9,10].
Multiple studies on Sumatera, a hotspot of expanding oil palm (Elaeis guineensis Jacq.) cultivation, show that aboveground species richness is drastically declining after transformation of natural or secondary rain forests in oil palm plantations [11,12,13]. The transformation of highly diverse ecosystems in monocultures results in nitrogen leaching, loss in soil carbon stocks, disturbance in hydrology, degradation of root health, and losses of many other ecosystem functions and services [13,14,15,16,17].
In contrast to species loss in most organismal groups (e.g., tree species, understory plant species, insects, birds, bats, mammals, etc.) found in oil palm plantations [9,12,13,18,19], the richness of soil microbes was less affected by or even increased in response to forest transformation [19]. For instance, neither marker lipids for fungal and bacterial biomass nor soil respiration varied with rain forest conversion [20]; the abundances of prokaryotic organisms increased [21], while fungal abundances decreased marginally [22,23]. Protists, another group of important eukaryotic soil microbes, remained stable [24]. However, all these microbial groups showed drastic compositional shifts in oil palm plantations compared to rain forests, suggesting significant functional turn-over [20,21,22,24,25]. For example, the abundance of genes associated with nitrogen fixation significantly decreased in plantation soils, indicating that the intensive management of oil palms results in a reduction in prokaryotes with the ability for natural N2 fixation [25]. In comparison to rain forest soils, loss in ectomycorrhizal fungi, reduction in root colonization with arbuscular mycorrhizal fungi and increases in saprotrophic and pathogenic fungi were reported in oil palm plantations [22,26].
Oil palm plantations are managed in different ways with regard to harvesting cycles, pruning, weeding, and fertilization [27,28]. Fertilizers are applied to maintain productivity of oil palms but the amounts of nutrients added are often far beyond those taken out by fruit removal [29]. First results of experimental fertilizer reduction in large-scale company estates indicated that oil palm management can be more sustainable without an immediate negative impact on yield [29]. Weeding is performed either by cutting or by herbicide application to remove the understory plants, which may compete for resources [30]. While complete clearing practices, e.g., by glyphosate, have negative effects on soil compaction and nutrient retention, weeding by mechanical cutting retains understory roots and is less detrimental to belowground biological activities [31,32]. However, it is not understood how mechanical weeding and fertilizer reduction influence soil biota associated with plant roots in oil palm plantations.
Here, we used a management experiment in a large-scale state-owned estate to investigate the effects of reduced fertilizer application and mechanical weeding in comparison with business-as-usual-practices on root-associated soil biota. We focused on roots because they are a hot spot for numerous organisms [33,34,35,36] and influence key soil processes [37]. Apart from prokaryotes, phyla associated with roots include fungi, oomycetes, nematodes, protozoa, algae, and arthropods [33]. One year after the implementation of reduced conventional management, we traced root-associated eukaryotes by Illumina sequencing. Furthermore, we determined root and soil chemistry. We hypothesized that reduced fertilizer application and weeding result in shifts of the root-associated species composition because changes in the management regimes affect belowground organic biomass and nutrients in soil and roots. We anticipated that the effects on the species composition were moderate due to the relatively short duration (one year) of the reduced management regimes. Alternatively, we hypothesized that the legacy of soil fertilization and herbicide application preclude compositional shifts of root-associated biota within short time periods.

2. Materials and Methods

2.1. Research Plots and Experimental Treatments

We used sixteen oil palm research plots, which had been established in four blocks located in two afdelings (i.e., a division maintained by a different manager) in a large-scale state-owned estate (PTPN VI Batanghari) on Sumatera in Jambi province (Indonesia). The location of the plots has been described by Darras et al. [29]. The geographic coordinates of the sampling sites in those plots are listed in Supplementary Table S1. The climate in PTPN VI is tropical humid with an average air temperature of 26.7 ± 0.4 °C and an annual sum of precipitation of 2075 ± 94 mm, including two peaks of rainfall in the rainy season in November and March (Supplementary Figure S1). The soil type is an acid acrisol, which is typical for lowland areas in the Jambi province. However, in the plantation the pH is enhanced by lime applications (429 kg dolomite ha−1 year−1) resulting in pH values of 6.8 ± 0.1 (Supplementary Table S1). Furthermore, mineral nutrients (Mg, Ca, B, Cu, Zn, and Mn) are added (142 kg ha−1 year−1).
In November 2016, four treatments were introduced, resulting in a fully factorial experimental design: conventional fertilization and herbicide treatment (CH), conventional fertilization and weeding (CW), reduced fertilization and herbicide treatment (RH), reduced fertilization and weeding (RW) (4 treatments × 4 blocks = 16 plots). Conventional fertilizer treatment consisted of the application of 260 kg N ha−1 year−1, 50 kg P kg ha−1 year−1, and 220 kg K ha−1 year−1 applied 2 times a year, 1 m apart from the oil palm stem base. Reduced fertilizer application corresponded to 130 kg N ha−1 year−1, 17 kg P kg ha−1 year−1, and 187 kg K ha−1 year−1 applied 2 times a year, 1 m apart from the stem base. The conventional herbicide application was glyphosate treatment (4 times a year in a 2 m radius around the palm stem basis, resulting in a dose of 1500 cm3 ha−1 year−1 and twice a year glyphosate treatment in the inter-rows [middle between two rows of palm trees] resulting in 750 cm3 ha−1 year−1). When mechanical weeding replaced the glyphosate treatment, the herbs were cut with a brush cutter 4 times a year within a circle of 2 m radius around each palm and twice a year in the inter-rows at the same time when the fertilizer was applied. Each treatment was applied to the plot area of 50 m × 50 m. The inner 30 m × 30 m area was used for sampling.

2.2. Collecting Samples in the Field

The oil palms (Elaeis guineensis Jacq.) had an age of about 19 years and were planted in rows with a distance of 5 m between the rows. Sampling took place in December 2017. We used the inter-rows, i.e., the middle of oil palm rows at a distance of about 2.5 m from the stems, following the plantation structure from north to south for sample collection. Before soil sampling, we determined soil temperature (Mextech Pen type soil thermometer DT-9, Mumbai, India), soil moisture and pH (Takemura soil pH tester DM-13, Tokyo, Japan, Supplementary Table S1). We collected 5 soil cores per row at a distance of about 5 m from each other. If present, organic matter was removed and then a soil corer (5 cm in diameter) was drilled to a depth of 10 cm into the upper soil layer. These five soil cores were pooled to one sample. In each plot, three samples were collected, each in a different row. Each fresh soil sample corresponded to a soil volume of 981.25 cm3. All samples (a total 16 × 3 = 48) were cooled and immediately transported to the University of Jambi (Jambi, Indonesia) for further processing.

2.3. Preparation of Soil and Root Samples

In the laboratory, the fresh samples were weighed and stored at 4 °C. The soil was sieved through two layers of mesh widths of 1.5 cm and 0.5 cm, respectively, to separate roots from the soil. Afterwards, the roots were washed in a 2 mm strainer, dried on the surface quickly between tissue papers, and weighed. Then, the fine roots (less than 2 mm in diameter) and coarse roots (more than 2 mm in diameter) were separated, weighed, and stored in zipper plastic bags at −15 °C.
To measure soil water content, about 20 g of fresh, sieved soil was weighed and dried in oven at a temperature of 105 °C for two days. The dry sample was weighed again and used to determine the relative soil water content and soil bulk density:
Soil   moisture   content   ( % ) = a l i q u o t   o f   f r e s h   s o i l   ( g ) a l i q u o t   o f   d r y   s o i l   ( g ) a l i q u o t   o f   d r y   s o i l   ( g ) × 100
Soil   Bulk   Density   ( g   cm 3 ) = t o t a l   d r y   s o i l   ( g ) n u m b e r   o f   s o i l   c o r e s   π × r 2   × h
with r = radius of soil core = 2.5 cm, n = number of soil cores in one sample = 5, and h = depth of soil sample = 10 cm.
Frozen and dry samples were transported to the University of Göttingen (Göttingen, Germany) for further analyses. Aliquots of the frozen roots were used to determine the dry mass after drying for 48 h in drying oven at 60 °C. The dry-to-fresh mass ratio was used to determine the number of fine roots:
Biomass   of   fine   roots   ( kg   m 2 ) = t o t a l   m a s s   o f   f r e s h   f i n e   r o o t s   p e r   p o o l e d   s a m p l e   ( g ) × d r y f r e s h m a s s   r a t i o / 1000 ( 5 × π × r 2     )
with n = 5 indicating the number of soil cores used for pooling and r = radius of the soil corer of 2.5 cm.

2.4. Preparing Root Samples for Illumina Sequencing

Fine root samples (stored at −15 to −20 °C) were milled (Type MM400, Retsch GmbH, Haan, Germany) for 1 min (frequency: 30 oscillations/sec) in 25 mL containers equipped with a stainless-steel ball (20 mm) under liquid nitrogen. DNA was isolated from a 100 mg homogenized sample using the innuPREP plant DNA Kit (SLS Protocol, Analytik Jena, Jena, Germany). For DNA elution, a total amount of 100 µL nuclease-free water (AppliChem, Darmstadt, Germany) was used. Isolated DNA was further purified with the MoBIO PowerClean Pro DNA Clean-Up Kit (Qiagen, Hilden, Germany) and eluted in 50 µL nuclease-free water (AppliChem, Darmstadt, Germany). DNA yields were estimated by employing a Quant-iT dsDNA HS assay kit (Thermo Fisher Scientific, Osterode am Harz, Germany) and a Qubit fluorometer (Invitrogen GmbH, Karlsruhe, Germany) following the manufacturer’s (Invitrogen) instructions. Amplification of the internal transcribed spacer region ITS1 was conducted using the forward primer (Microsynth, Balgach, Switzerland) ITS1-F_KYO2 [38] and the reverse primer (Microsynth) ITS2 [39]. Amplification of the fungal small subunit ribosomal RNA (18S rRNA) amplicons was prepared using forward primer (Microsynth) NS31 [40] and reverse primer (Microsynth) AML2 [41]. Primers were labeled with an Illumina adapter overhang (Microsynth) (forward: TCGTCGGCAGCGTCAGATGTGTATAA GAGACAG, reverse: GTCTCGTGGGCTCGGAGATGTGTATAAGAGACAG). The primer sets NS31 and AML2 and ITS1-F_KYO2 and ITS2, respectively, were used in individual polymerase chain reaction (PCR) assays before combining them for sequencing. The PCRs were performed using 50 ng of template DNA (10 ng µL−1), 10 μL 5x Phusion GC buffer (New England Biolabs, Germany), 0.15 μL of MgCl2 (50 mM New England Biolabs, Germany), 1 μL of each primer (10 mM, Microsynth, Wolfurt, Austria), 1 μL dNTP mix (10 mM each, Thermo Fisher Scientific, Osterode am Harz, Germany), 0.5 μL Phusion High-Fidelity DNA Polymerase (2 U μL−1, New England Biolabs, Germany) and adjusted to a total volume of 50 µL with nuclease-free distilled water. PCRs were performed in a Labcycler (SensoQuest, Göttingen, Deutschland) with the following thermal cycling scheme: initial denaturation at 98 °C for 5 min, 30 cycles of denaturation at 98 °C for 30 s, annealing for 20 s at 47 °C, and extension at 72 °C for 20 s, followed by a final extension period at 72 °C for 5 min. All PCRs were performed in triplicate. The resulting PCR products were checked by agarose gel electrophoresis for appropriate size, pooled and purified by magnetic bead clean-up using the MagSi-NGSPrep Plus as recommended by the manufacturer (MagnaMedics Diagnostics B.V., Geleen, the Netherlands). Quantification of the PCR products was performed using the Quant-iT dsDNA HS assay kit and a Qubit fluorometer following the manufacturer’s instructions. Pooled PCR products were used to attach indices and Illumina sequencing adapters using the Nextera XT Index kit (Illumina, San Diego, CA, USA). Index PCR was performed using 5 μL of template PCR product, 2.5 μL of each index primer, 12.5 μL of 2× KAPA HiFi HotStart ReadyMix and 2.5 μL PCR grade water. Thermal cycling scheme was as follows: 95 °C for 3 min, 8 cycles for 30 s at 95 °C, 30 s at 55 °C and 30 s at 72 °C and a final extension at 72 °C for 5 min.
The Göttingen Genomics Laboratory determined ITS1 and 18S rRNA gene sequences by using the dual index paired-end approach (2 × 300 bp, v3 chemistry) and the Illumina MiSeq platform. Paired-end sequencing data were quality-filtered with fastp (version 0.20.0) [42] using default settings with the addition of an increased per base phred score of 20, base pair corrections by overlap (-c), as well as 5′- and 3′-end read trimming with a sliding window of 4, a mean quality of 20 and minimum sequence size of 50 bp. After quality control, the paired-end reads were merged using PEAR (version 0.9.11) [43] and primers clipped using cutadapt (version 2.5) [44] with default settings. Sequences were then processed using VSEARCH (v2.12.0). This included sorting and size-filtering of the paired reads to ≥140 bp (--sortbylength --minseqlength 140), dereplication (--derep_fulllength). Dereplicated amplicon sequence variants (ASVs) were denoised with UNOISE3 using default settings (--cluster_unoise – minsize 8) and chimeras were removed (--uchime3_denovo). An additional reference-based chimera check was performed (--uchime_ref) [45] against the SILVA SSU NR database (version 132) and UNITE database (v8.1). Raw reads were mapped to ASVs (--usearch_global–id 0.97). The resulting ASVs (97% sequence identity) correspond to operational taxonomic units (OTUs). The taxonomy was assigned using BLAST 2.9.0+ against the UNITE database (v8.1) and SILVA SSU 132 NR database [46,47]. The resulting OTU count table was rarefied to 20,000 sequences per sample, using the rrarefy() function of the package vegan v2.5.6 [48]. The annotation of fungal guilds was conducted with the software FUNguild [49].

2.5. Element Analyses in Soil and Roots

Aliquots of dry root and soil samples were milled in a ball mill (MM400, Retsch, Haan, Germany). The milled root samples (about 30 mg) were weighed in reagent vessels and total elements were extracted by the microwave method (2 mL 65% HNO3, 2 mL 30% H2O2, 3 mL HPLC-grade water) [47]. The extracts were filtered (MN 640 WE, Macherey-Nagel, Düren, Germany), the filters washed with HPLC-grade water, and the collected filtrate adjusted to 25 mL with HPLC grade water.
To determine potentially plant-available nutrients, soil (100 mg) was extracted for 1 h in 15 mL Bray-1 solution (0.03 N NH4F and 0.025 N HCl) [50], and filtered through phosphate-free pleated filters (5893 Blauband filter, Macherey-Nagel MN 619 G). The filters were washed with ultra-pure water and the filtrates were adjusted to 25 mL. Aliquots of the filtrates were measured by inductively coupled plasma optical emission spectrometry (ICP OES, iCAP 7000 Series ICP–OES, Thermo Fisher Scientific, Dreieich, Germany). Elements were calibrated with a series of concentrations by element standards (Einzelstandards, Bernd Kraft, Duisburg, Germany).
To measure carbon (C) and nitrogen (N), milled root (2 mg) or soil (20 mg) powder was weighed into tin capsules (IVA Analysentechnik, Meerbusch, Germany) using a microbalance (Cubis MSA 2.7S-000-DM, Sartorius, Göttingen, Germany). The samples were measured in a CN analyzer (vario MICRO cube CN analyzer, Elementar Analysensysteme GmbH, Langenselbold Germany). Acetanilide was used as the standard.

2.6. Statistical Analyses

Statistical analyses were conducted with R studio (version 1.2.5001, RStudio, Inc., Boston, MA, USA). Count data (Illumina data) were analyzed with generalized linear models (GLM) and negative binomial distribution. Differences between treatments were considered to be significant when Chi2 < 0.05. The distribution of continuous data (soil and root chemistry) was checked by visual inspection of the residuals and was log-transformed to meet the criteria of normal distribution if required. Data were used for analyses of variance by two-way factorial analysis of variance (ANOVA). Tukey’s HSD test was applied as the post hoc test to determine homogenous groups. Different letters in figures indicate significant differences at p < 0.05. The biodiversity indices (Shannon index, species richness, evenness), dissimilarities of the communities by nonmetric multidimensional scales (nMDS), and environmental variables (envfit) were determined with the vegan package [48].

3. Results

3.1. Soil Properties and Root Chemistry Are Not Affected by Reduced Management Intensity

The reduction in fertilizer and replacement of herbicides by manual weeding did neither affect carbon, nitrogen, C/N ratio nor the contents of extractable elements in soil (Table 1). Soil pH, soil bulk density, and soil humidity did not differ among the treatments (Table 1). Nutrient element contents in roots were not significantly affected by the diminished fertilization or by manual weeding instead of herbicide application (Table 2).

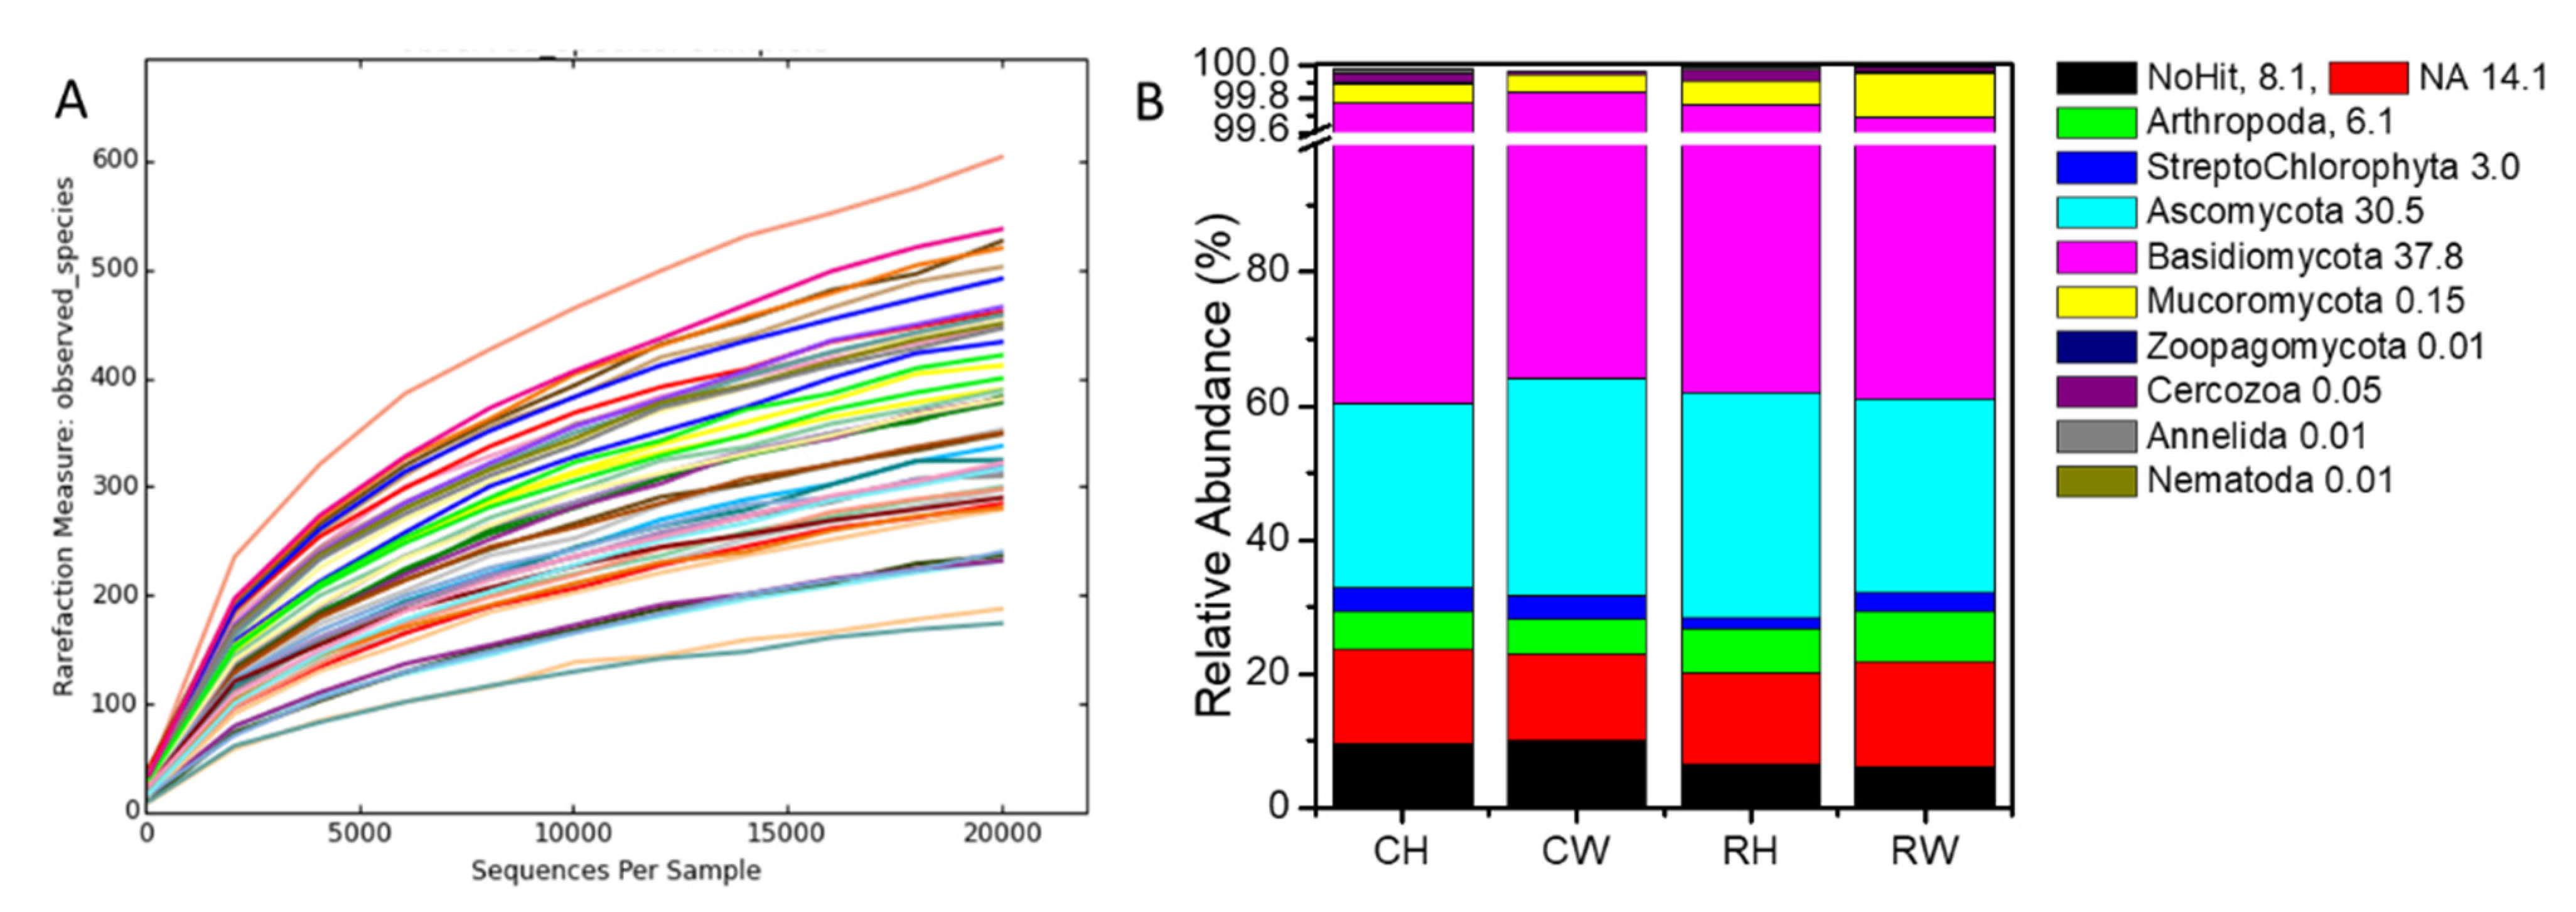
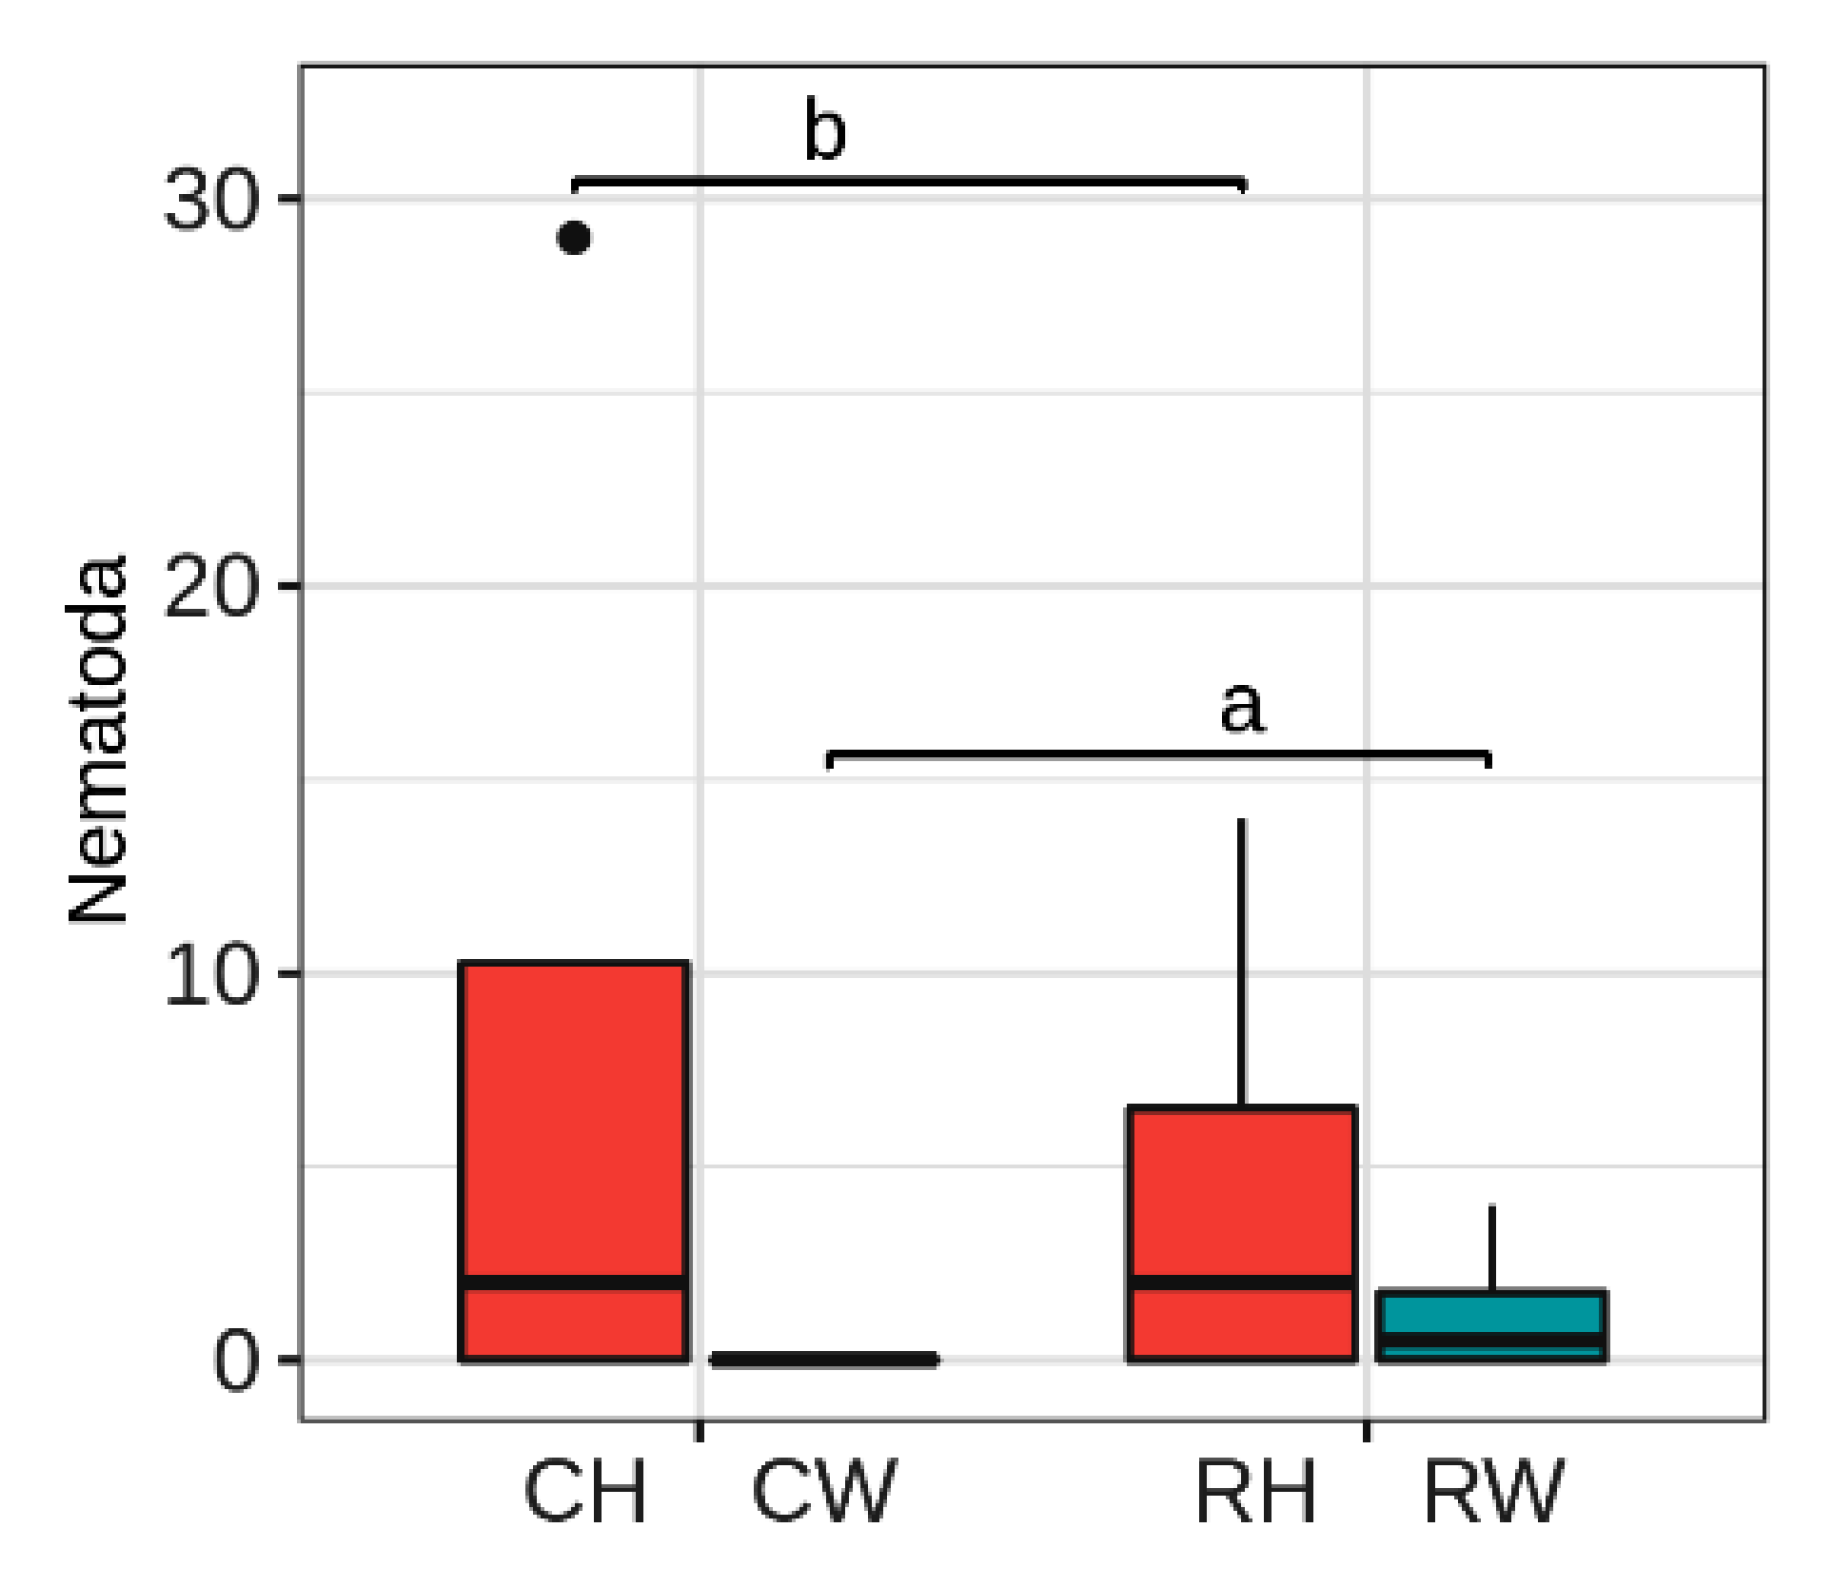
3.2. Diversity of Root-Associated Biota Is Not Affected by Reduced Management Intensity, but Nematodes Respond to Weeding

We kept all sequences for eukaryotic organisms and rarefied each sample to 20,000 sequences (Figure 1A). In this data set, we found 10 eukaryotic phyla with abundances greater than 0.01% of total number of sequences (total rarefied sequences: 960,000). About 8% of the sequences had no hit in the database and 14.1% were not assigned to any phylum (Figure 1B). Fungal sequences were dominant (68.5%), reflecting our primer choice for fungal taxa. Hits for streptophyta (plants without green algae) were mainly due to Elaies sp. (>90%), as expected due to our sampling strategy, collecting specifically oil palm roots (Supplementary Table S2).
Reduced fertilizer and weeding instead of herbicide-induced soil clearing had no effect on the relative abundance of the root-associated phyla (GLM, negative binomial, Chi2 > 0.05), with one notable exception: nematodes were less abundant on roots from plots, where the ground vegetation was controlled by weeding instead of herbicide treatment (Chi2 = 0.027) (Figure 2).
The nMDS ordination did not show significant clustering of phyla according to the treatments (Figure 3A,B). Environmental variables that correlated with the ordination at p < 0.1 were included (Figure 3B). At the conventional threshold of p < 0.05, only two vectors, C and C/N ratio in roots, were retained (Figure 3B) and showed the closest match with Elaies sp. (Figure 3A).
Neither weeding nor reduced fertilizer application affected the diversity of root-associated taxa (Table 3). The mean number of taxa (OTU-based at the 97% identity level) per plot was 787 with a Shannon index of 3.47. Evenness was low (Table 3), indicating that the data sets were dominated by sequences of a few very abundant taxa. The most abundant taxa were classified as saprotrophs or pathogens (Supplementary Table S2).

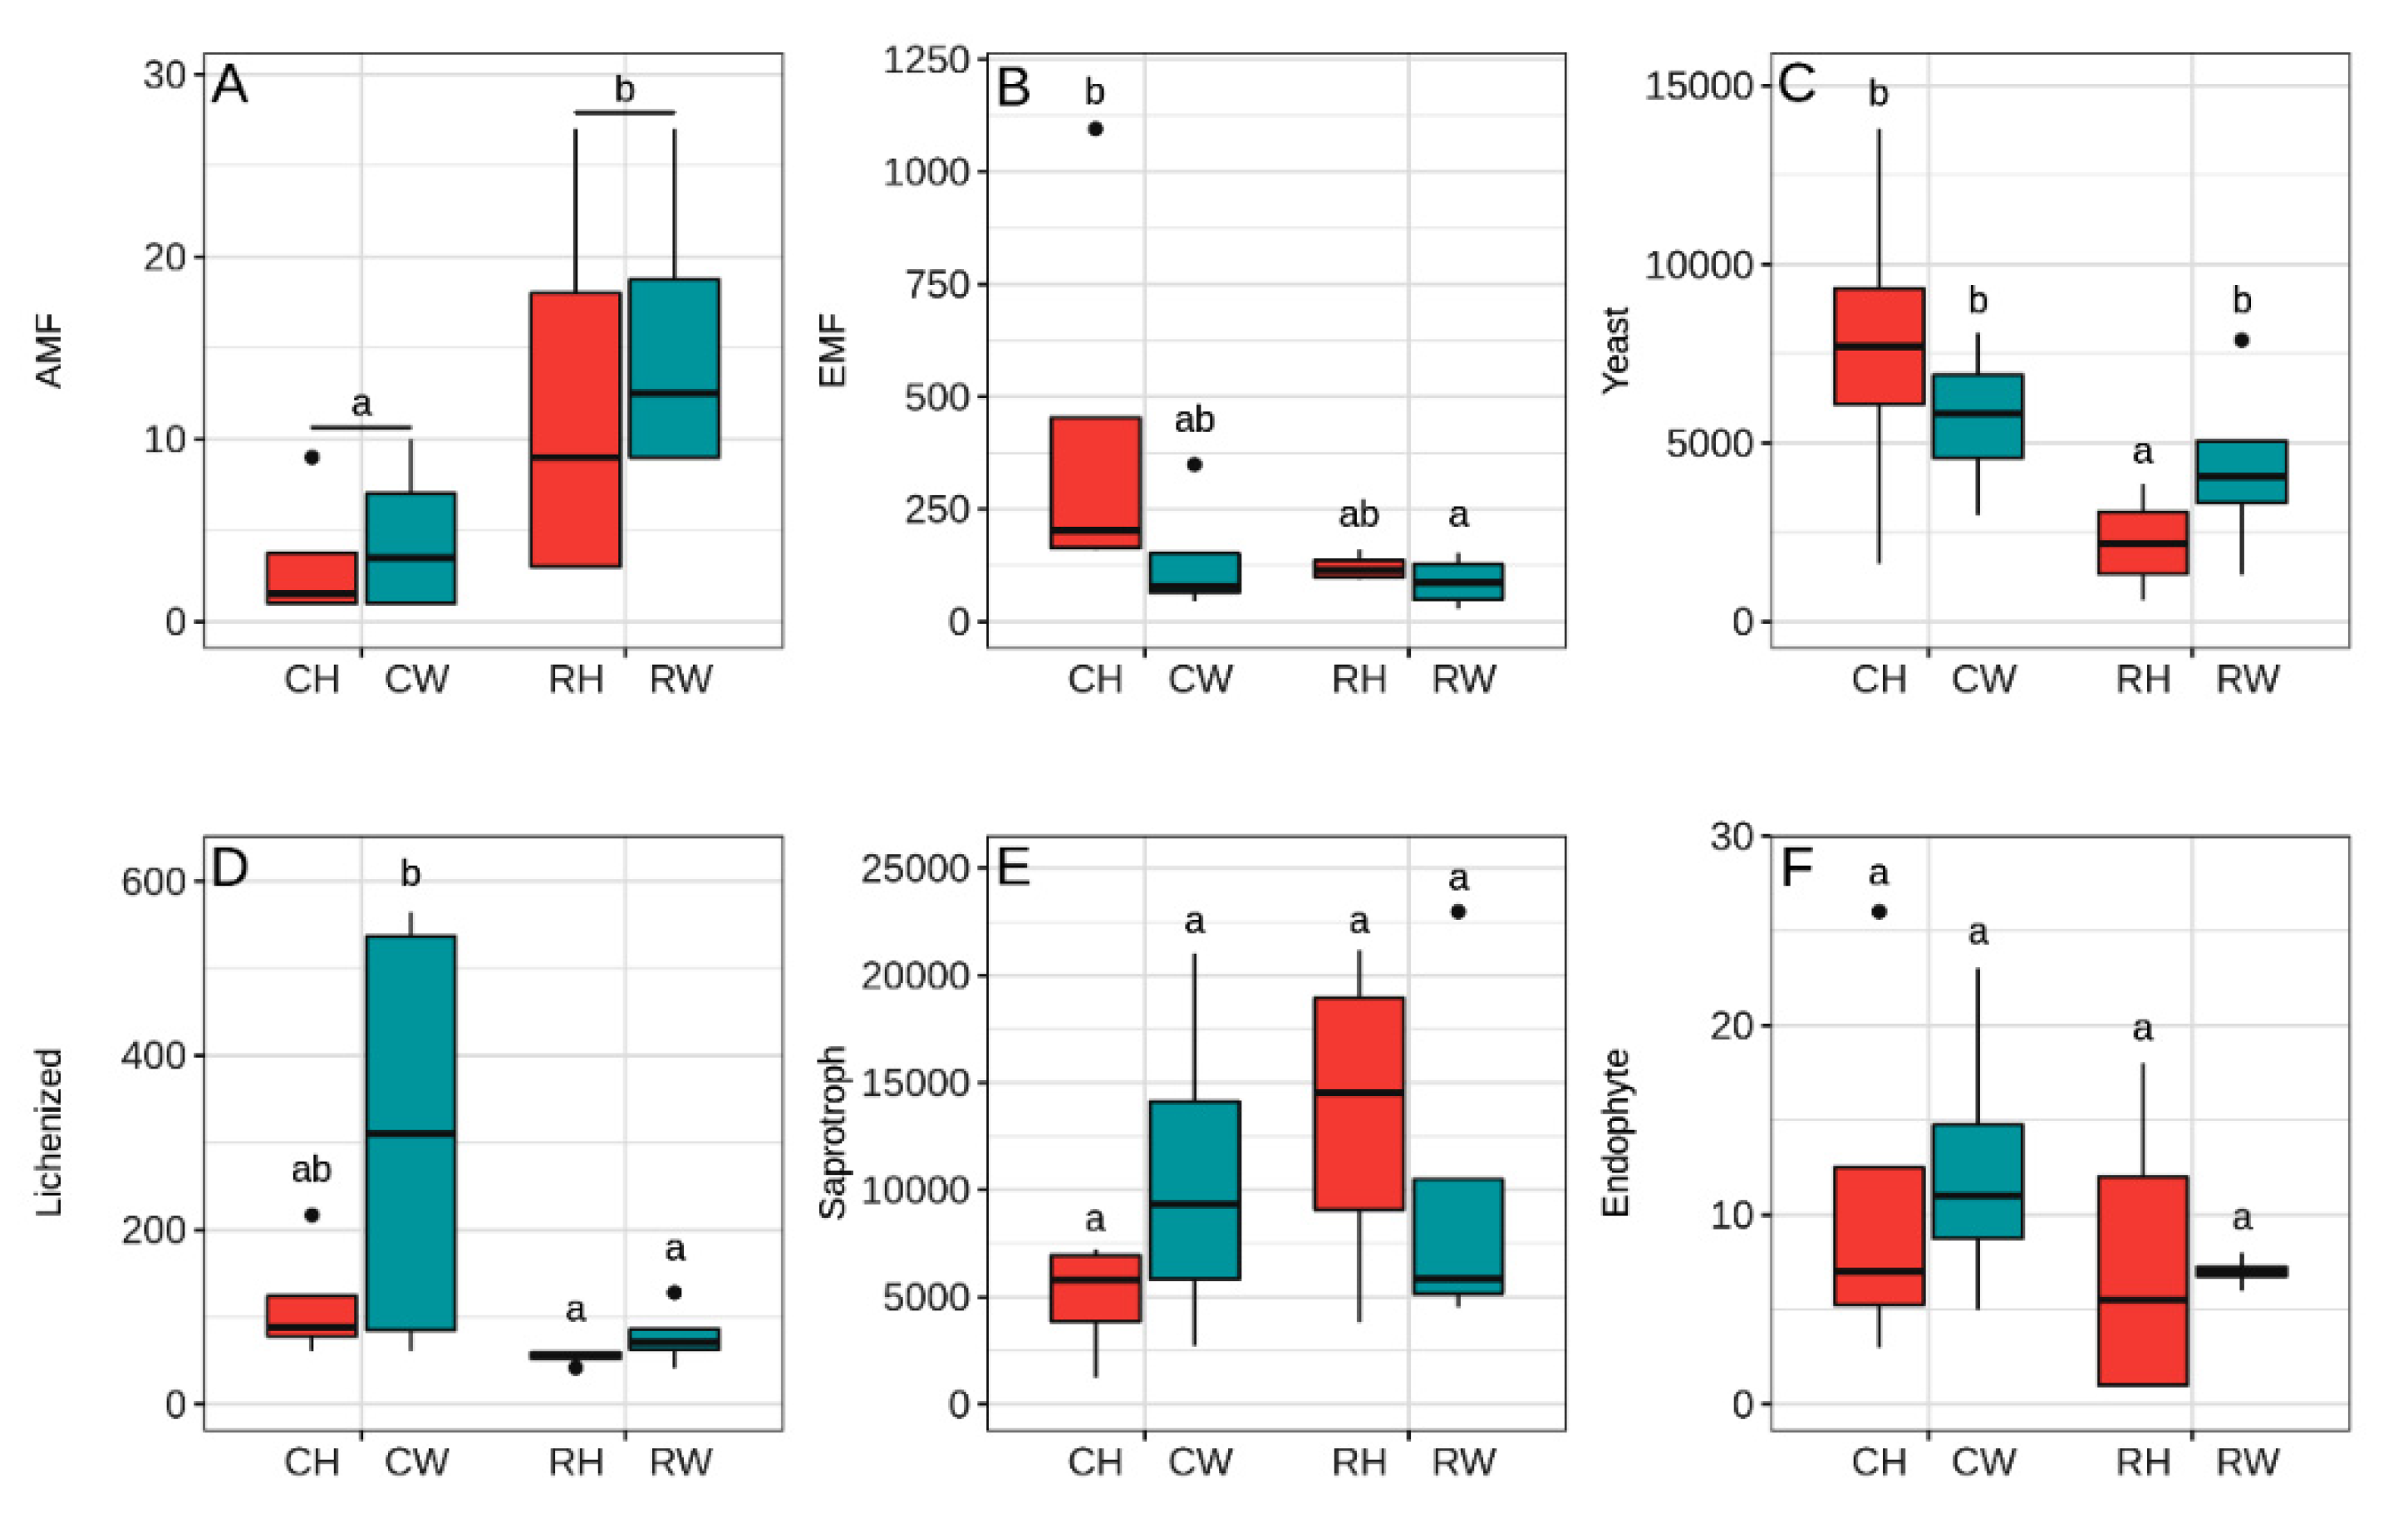
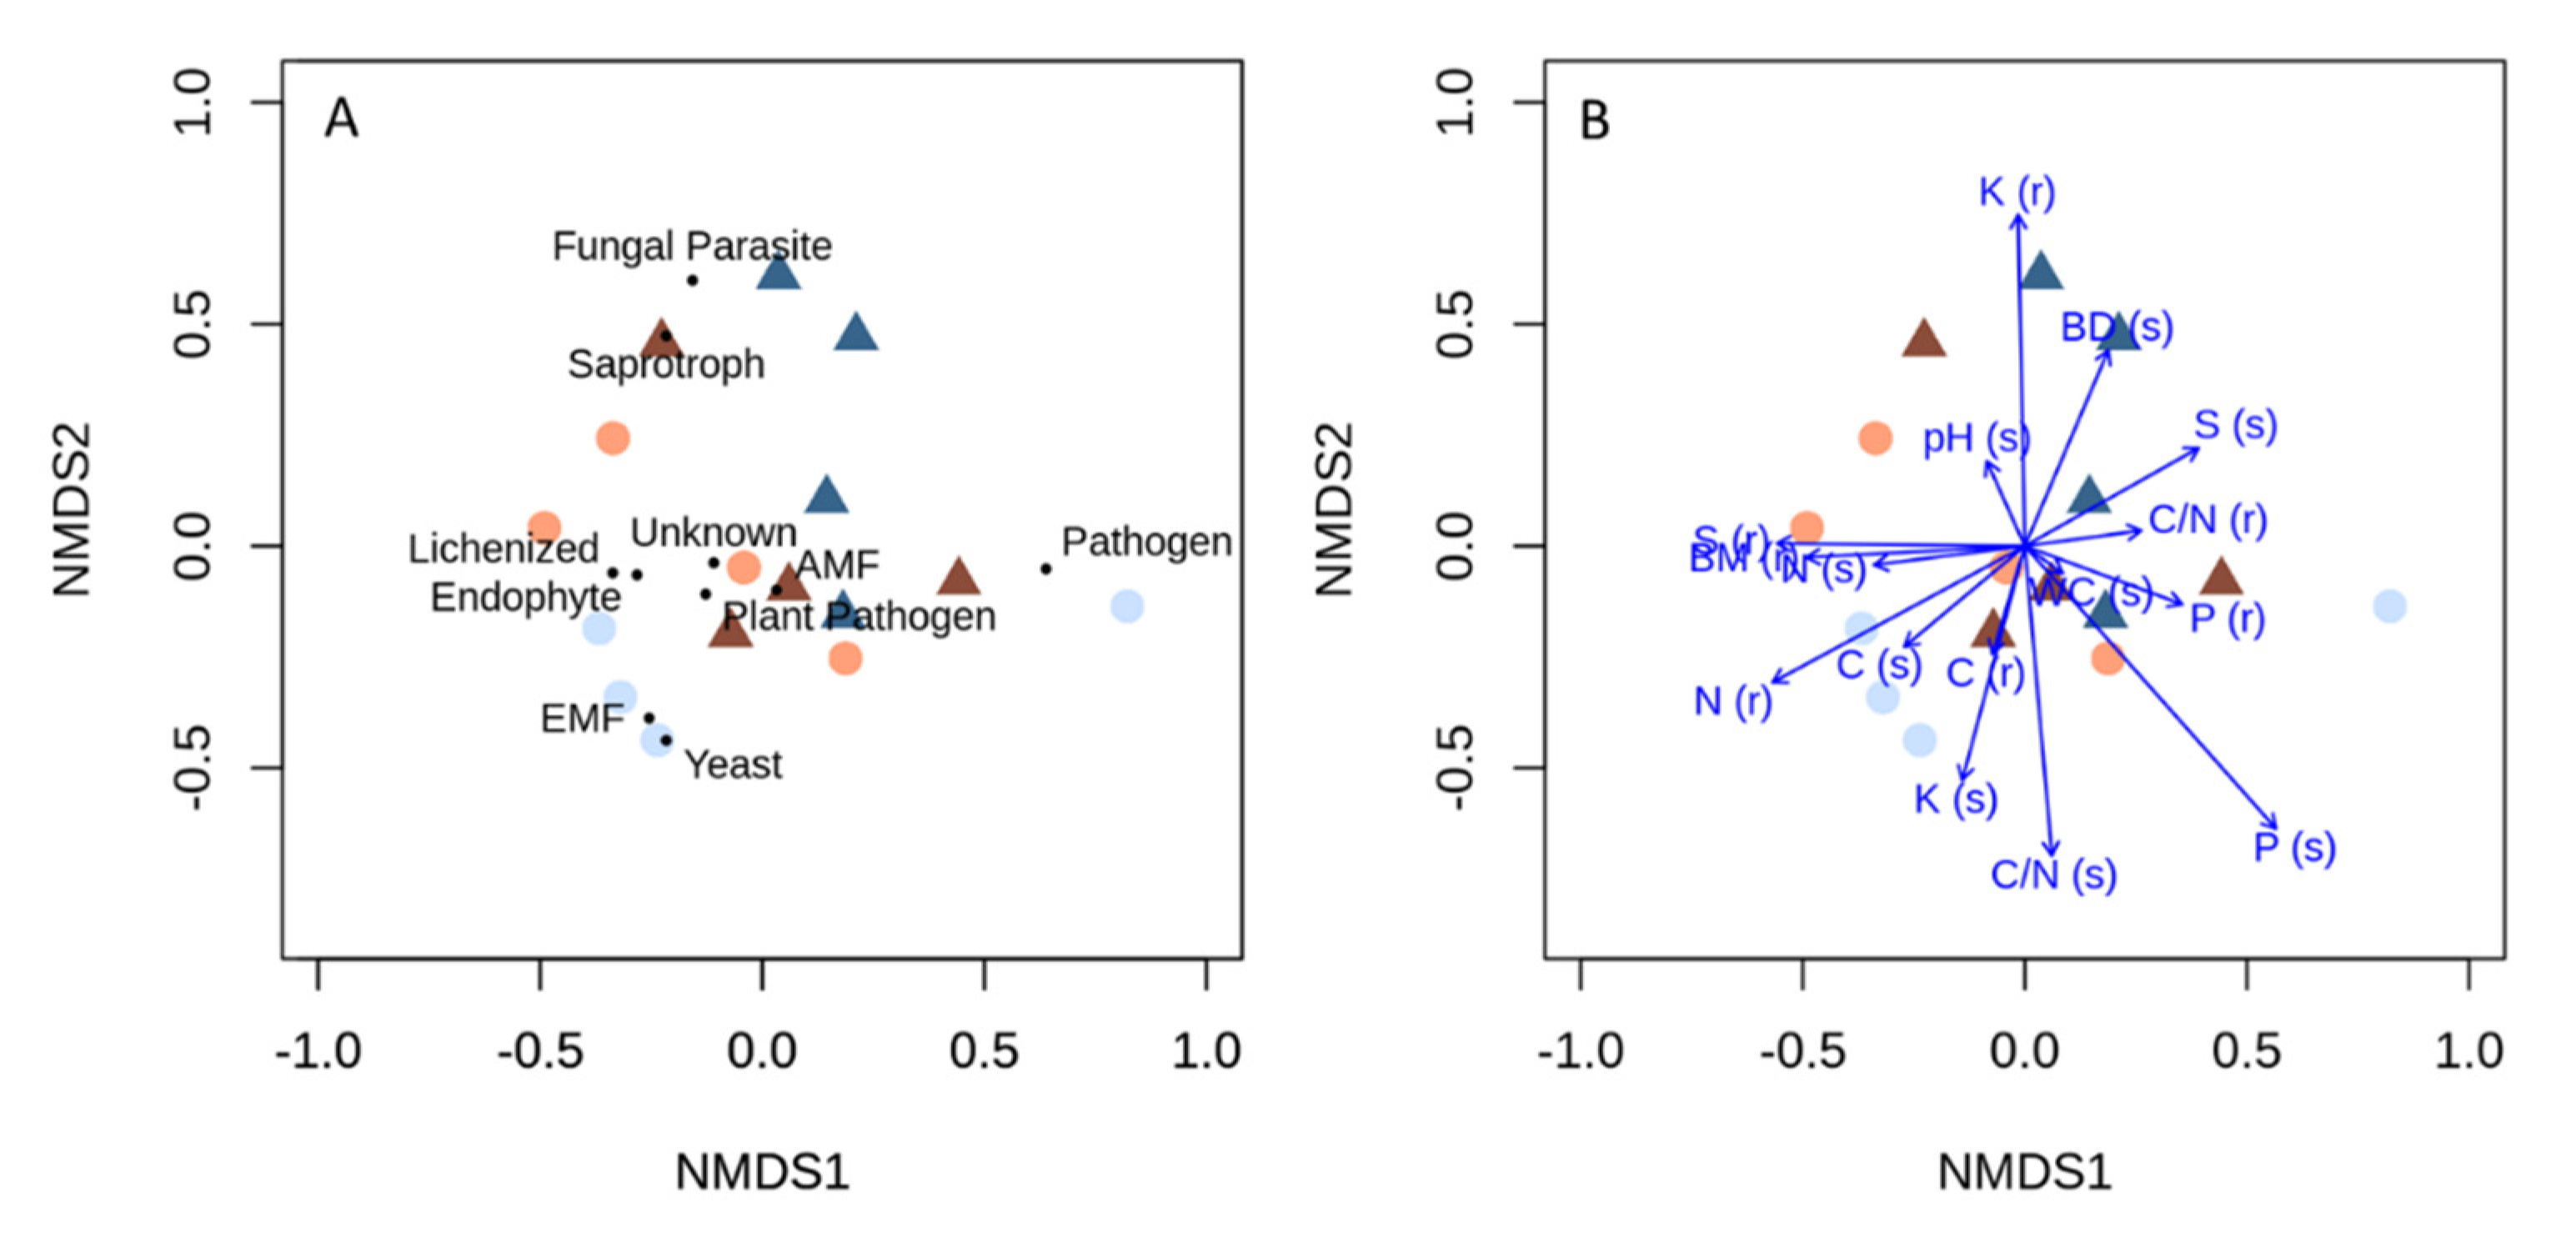
3.3. Fungal Guilds Are Shifted by Reduced Fertilizer and Weeding

Oil palm roots form mutualistic associations with arbuscular mycorrhizal fungi (AMF). Reduced fertilizer application resulted in a significant increase in AMF (Figure 4A). Fungi with a variable lifestyle, classified as symbiotroph–pathotroph–saprotroph showed higher abundances on roots in the conventionally managed plantations than in other treatments (Figure 4B). This increase was mainly due to high abundances of Entoloma sp. (Supplementary Table S2) in conventional plots. We also assigned typical ectomycorrhizal fungal genera and families (Amanita, Cortinarius, Inocybaceae, Xerocomellus, Coltricia, Russula, Sebacinaceae and Hydnellum) to the category of fungi with a variable lifestyle (16.7% in this category) because ectomycorrhizal fungi grow as saprotrophs in the absence of host plants.
The abundance of yeasts was reduced with reduced fertilization (Chi2 = 0.012, Figure 4C). This was also observed for lichenized fungi (Chi2 < 0.001), which benefited, however, from weeding (Chi2 = 0.022, Figure 4D). Saprotrophic fungi and endophytes were unaffected by the decreased management intensity (Figure 4E,F). Further fungal guilds (fungal parasites, plant pathogens, other pathogens, unknown lifestyle) were unaffected by the different treatments (Figure 5A–D).
The nMDS of the fungal guilds revealed that the second axis separated the conventionally managed plots from those with reduced fertilizers (Figure 6A) with the exception of one plot. Soil P was the only environmental parameter with a significant correlation with the ordination of guilds (p < 0.05) (Figure 6B). Weeding did not lead to clear clustering of the guilds. Fungi with close plant associations, such as AMF, lichenized fungi, endophytes, and plant pathogens, clustered together (Figure 6A). This fungal group was aligned with root biomass (p < 0.1) (Figure 6B). Fungi with variable lifestyle, including ectomycorrhizal fungi and yeasts, showed a moderate correlation with root N, while saprotrophs and fungal parasites were aligned with soil pH and root K, considering vectors at p < 0.1 (Figure 6A,B).

4. Discussion

4.1. Reduced Management Intensity Does Not Affect Root and Soil Chemistry or Diversity of Root-Associated Phyla

To develop more sustainable management practices, experiments have been initiated in the tropics in large-scale plantations, reducing fertilizer application and controlling understory by weeding instead of herbicide application [29,30]. Here, we show that soil and root mineral nutrients were unaffected in the initial phase, one year after the start of the experimental treatments. This result agrees with other short-term studies, where management was stopped or reduced [51,52,53] and might have been expected because it is well known that agricultural soil usage has long-lasting legacy effects [54,55]. For example, recovery of N cycling takes almost a decade [56,57]. In the plots used for our experiment, short-term effects on mineral elements, carbon stocks, and gross N cycling were not found [35] and the composition of active (RNA-based) and total (DNA-based) communities of bacteria in bulk soil did not change in response to reduced management treatments [58]. Plant species richness was unaffected by weeding compared to herbicide treatment but the plant cover increased [29].
Since the previous analyses of bulk soil did not reveal early effects of management reduction [29,58], we focused on eukaryotic organisms associated with roots. On basis of OTUs, early effects on species richness, Shannon diversity or community composition were not detected. At the level of phyla, a more differentiated pattern emerged. At this classification level, we observed that weeding resulted in a significant reduction in nematodes. Nematodes are an indicator species for soil health and crucial organisms in soil food webs as predators and intermediary decomposers, but some species are harmful to plants [59]. Nematodes respond to changes in habitat conditions; for example, transformation of rain forests into oil palm plantations caused a relative increase in species with short generation times, compared to those with long generation times [60]. Since we used general primers, species assignments in this phylum were not possible. Here, we can just speculate that nematodes might have responded to differences in disturbance imposed by weeding compared with chemical clearing. It is obvious that further analyses of this important phylum are necessary to understand better the impact of management practices on soil food webs. Since our study showed treatment effects in only one of ten phyla, which was represented by a relatively low number of sequences, the composition of root-associated phyla was unaffected in response to reduced management. This result agrees with our hypothesis that legacy effects are dominant and overshadow subtle shifts in distinct groups.

4.2. Fungal Guilds Show Differentiated Patterns to Reduced Fertilizer Application and Weeding

A focus of our study was on root-associated fungi, using general bar-coding primers for fungi and specific ones for arbuscular mycorrhizal fungi (AMF). Here, we found a significant increase in AMF abundances in response to fertilizer reduction. Previous studies showed negative long-term effects of inorganic fertilizers on AMF [61,62], although the magnitude of the responses varied with soil environment [63]. In Indonesian tropical transformation systems, the abundance and colonization of oil palm roots with AMF was decreased compared with roots of rainforest trees [17,22]. However, the opposite that recovery of AMF is one of the earliest effects in the root-associated fungal community is a novel result. This effect appears to be specific to roots since the presence of AMF in soil was unaffected in plots of oil palm plantations after discontinuing fertilization [54]. The observed recovery in AMF abundance has the potential for shifts in ecosystem functions since mycorrhizal fungi play a prominent role in plant nutrition and increase plant protection from pathogens [64,65]. Therefore, the early increase in AMF under reduced fertilization is encouraging for the development of environmentally friendly managing techniques.
In contrast to AMF, root colonization with most other fungal guilds was unaffected by reduced management. This included saprotrophic fungi, endophytic fungi, fungal parasites, as well as plant and other pathogenic fungi. Since these guilds encompassed the majority of fungal sequences under our experimental conditions, the separation of guilds by nMDS ordination was not pronounced. Moderate differences occurred between high and reduced fertilization on plots, where the understory was cleared by herbicide treatments. The ordination indicated an association of increased abundances of multi-guild fungi (including ectomycorrhizal fungi) and yeasts, which also have multiple ecological functions as decomposers, mutualists, parasites or pathogens [66], with increased root bio-mass or root N. Since yeasts are early colonizers of nutrient-rich substrates [66], which are then followed by fungal saprotrophs, their increased abundances along with enhanced root N might have been expected. However, it must be noted that these associations were weak (p < 0.1), not meeting the conventional significance threshold of p < 0.05. Since we report early effects after only one year of reduced management intensity, the observed trends may nevertheless be a first hint and their development should be observed in future studies.
The presence of fungi with a potential ectomycorrhizal life style in the conventionally managed plantations may be surprising since oil palm is typically colonized by AMF [27]. However, Rembold et al. [13] showed that the understory in oil palm plantations contains forest tree and shrub species that can form ectomycorrhizae. We assume that re-growth of mixed vegetation may be the reason for the presence of this important fungal group in decade-old, often cleared plantations [22,67]. The surprising increase in multi-guild taxa in the conventional plantations was due to enrichment in Entoloma sp., a species which has been annotated as “ectomycorrhizal, fungal parasite, soil saprotroph” [68]. The increased abundance of Entoloma sp. and yeasts in the conventionally managed plots suggests that these guilds profit from high nutrient input and high decomposition rates of litter in the humid tropics [69].
Another interesting observation was an increased abundance of lichenized fungi in conventionally fertilized, weeded treatments. The most abundant genus detect here was Chaenothecopsis, whose members are widely distributed [70,71]. Tropical species of Chaenothecopsis have been reported to grow on angiosperm exudates [72] but the reasons why this guild was enriched on roots from fertilized, weeded treatments, remain elusive.
We expected that manual weeding would influence root-associated fungal communities in comparison with chemical clearing by glyphosate because the former practice retains living roots in the soil, whereas the latter results in complete die-off of monocots. However, overall, fungal communities were unaffected by weeding compared with glyphosate treatment. Under controlled conditions, glyphosate treatments usually show short-term increases in bacterial activities and biomass, which disappear after a few days [73,74], whereas the bacterial soil communities under the conditions of our study were also unaffected [58]. It is therefore possible that the impact of weeding or glyphosate occurs on very short times scales, but information on very short-term responses to herbicide treatments of fungal communities in tropical soils is not available. Soil from long-term (>10 years) herbicide-treated horticultural and fruit plantations on Java (Indonesia) contained five fungal species that were able to grow on glyphosate as a sole P source, among them Acremonium sp., Aspergillus sp., and Fusarium sp. [75]. Species from these genera were also found in our study. Fusarium species are known as pathogenic-saprotrophic fungi. They were particularly abundant on the oil palm roots of our study but were unaffected by short-term reduced management regimes.

5. Conclusions

In conclusion, we found that the reduction in fertilizer application led to early increases in the abundances of AMF and decreases in ectomycorrhizal-multitrophic fungi and yeasts. While most fungal guilds were relatively invariant to weeding or glyphosate treatment, the abundances of nematodes, which are important components of the soil decomposer system, were reduced by weeding. These results support our first hypothesis that reduced management intensities lead to subtle shifts in groups of root-associated taxa. These taxa were apparently most sensitive to small changes in habitat conditions. Our short-term study demonstrates that changes in management regimes start to re-wire critical constituents of the soil–plant food webs. The guilds with significant responses to decreased management intensity were represented by low abundances, while the invariant groups, especially saprotrophic fungi, were represented by high abundances. Consequently, the taxonomic composition of the whole community of root-colonizing biota superimposed subtle biodiversity shifts. Future studies will show if the recovery of AMF proceeds during longer time scales and can compensate to some extent for fertilizer reduction. This is an important issue for the development of sustainable management practices, under the premise of an economic need for plantation productivity.

Supplementary Materials

The following supporting information can be downloaded at: https://0-www-mdpi-com.brum.beds.ac.uk/article/10.3390/agronomy12010199/s1, Supplement Figure S1: Monthly mean air temperature (°C) and monthly mean sum of precipitation (mm) measured at the PTPN6 meteorological tower; Supplement Table S1: Plot locations, treatments, soil and root chemistry; Supplement Table S2: Rarefied count table of sequences, taxonomy and functional annotations of root-associated fungi in oil palm plantations.

Author Contributions

Conceptualization, A.R.R. and A.P.; methodology, A.R.R.; formal analysis, A.R.R., D.J. and D.S.; investigation, A.R.R.; field resources, B.I. and A.T.; sequencing resources: R.D.; data curation, D.J. and D.S.; writing—original draft preparation, A.R.R.; writing—review and editing, A.P., D.S. and A.T.; visualization, D.J.; supervision, A.P.; project administration, A.T. and B.I.; funding acquisition, A.P. All authors have read and agreed to the published version of the manuscript.

Funding

This study was funded in part by the Deutsche Forschungsgemeinschaft (DFG, German Research Foundation)—project ID 192626868 SFB 990/2 and SFB 990/3—in the framework of the collaborative German—Indonesian research project CRC990. ARR holds a Ph.D. scholarship from the Indonesia Endowment Fund for Education (LPDP), the Ministry of Finance (KEMENKEU) and the Ministry of Research, Technology and Higher Education (RISTEKDIKTI) of the Republic of Indonesia under the BUDI-LN 2016 scholarship scheme. The APC was partly funded by the Open Access Publication Funds of the Göttingen University.

Data Availability Statement

Data for the sequences are available in the NCBI database under Bio-Project number PRJNA787757. Data for soil and root chemistry (Table S1) and rarefied sequence data (Table S2) are found in the supplements.

Acknowledgments

This study was part of the project B07 and an associated project to CRC990-EFForTS. We acknowledge the collaborations with PTPN VI, and project Z01 (central core support) for the implementation and maintenance of this field experiment. We are grateful for the research permit (Surat Izin Penelitian, reference number: 328/SIP/FRP/E5/Dit.KI/IX/2016), issued by the Ministry of Research Technology and Higher Education (Kementrian Riset, Teknologi dan Pendidikan Tinggi, Jakarta, Indonesia). The permit recommendations for sample collection, domestic sample transport, sample export, and access to the genetic material were issued by the Research Center for Biology of the Indonesian Institute of Science (Lembaga Ilmu Pengetahuan Indonesia, Jakarta, Indonesia), numbers 2781/IPH.1/KS.02.04/IX/2016 and B-1345/IPH.1/KS.02.04/III/2019. We thank our field assistants for their valuable support. We are grateful to N. Brinkmann for advice regarding the molecular work, to T. Klein (Laboratory for Radioisotopes), and M. Franke-Klein (Forest Botany and Tree Physiology) for excellent technical support.

Conflicts of Interest

The authors declare no conflict of interest. The PTPN VI company provided no funding and did not have any influence on the study design, data collection, analysis, or interpretation. The funders had no role in the design of the study; in the collection, analyses, or interpretation of data; in the writing of the manuscript, or in the decision to publish the results.

References

  1. Gibbs, H.K.; Ruesch, A.S.; Achard, F.; Clayton, M.K.; Holmgren, P.; Ramankutty, N.; Foley, J.A. Tropical Forests Were the Primary Sources of New Agricultural Land in the 1980s and 1990s. Proc. Natl. Acad. Sci. USA 2010, 107, 16732–16737. [Google Scholar] [CrossRef] [Green Version]
  2. Asner, G.P.; Rudel, T.K.; Aide, T.M.; Defries, R.; Emerson, R. A Contemporary Assessment of Change in Humid Tropical Forests. Conserv. Biol. J. Soc. Conserv. Biol. 2009, 23, 1386–1395. [Google Scholar] [CrossRef]
  3. Miller, D.C.; Ordoñez, P.J.; Brown, S.E.; Forrest, S.; Nava, N.J.; Hughes, K.; Baylis, K. The Impacts of Agroforestry on Agricultural Productivity, Ecosystem Services, and Human Well-Being in Low-and Middle-Income Countries: An Evidence and Gap Map. Campbell Syst. Rev. 2020, 16, e1066. [Google Scholar] [CrossRef] [Green Version]
  4. Petrenko, C.; Paltseva, J.; Searle, S. Ecological Impacts of Palm Oil Expansion in Indonesia. 2016. Available online: https://theicct.org/publications/ecological-impacts-palm-oil-expansion-indonesia (accessed on 11 January 2022).
  5. Khatiwada, D.; Palmén, C.; Silveira, S. Evaluating the Palm Oil Demand in Indonesia: Production Trends, Yields, and Emerging Issues. Biofuels 2021, 12, 135–147. [Google Scholar] [CrossRef] [Green Version]
  6. Euler, M.; Schwarze, S.; Siregar, H.; Qaim, M. Oil Palm Expansion among Smallholder Farmers in Sumatra, Indonesia. J. Agric. Econ. 2016, 67, 658–676. [Google Scholar] [CrossRef]
  7. Wijaya, A.; Sugardiman Budiharto, R.A.; Tosiani, A.; Murdiyarso, D.; Verchot, L.V. Assessment of Large Scale Land Cover Change Classifications and Drivers of Deforestation in Indonesia. ISPRS Int. Arch. Photogramm. Remote Sens. Spat. Inf. Sci. 2015, XL-7/W3, 557–562. [Google Scholar] [CrossRef] [Green Version]
  8. Kubitza, C.; Krishna, V.V.; Urban, K.; Alamsyah, Z.; Qaim, M. Land Property Rights, Agricultural Intensification, and Deforestation in Indonesia. Ecol. Econ. 2018, 147, 312–321. [Google Scholar] [CrossRef]
  9. Grass, I.; Kubitza, C.; Krishna, V.V.; Corre, M.D.; Mußhoff, O.; Pütz, P.; Drescher, J.; Rembold, K.; Ariyanti, E.S.; Barnes, A.D.; et al. Trade-offs between Multifunctionality and Profit in Tropical Smallholder Landscapes. Nat. Commun. 2020, 11, 1186. [Google Scholar] [CrossRef] [Green Version]
  10. Foster, W.A.; Snaddon, J.L.; Turner, E.C.; Fayle, T.M.; Cockerill, T.D.; Ellwood, M.D.F.; Broad, G.R.; Chung, A.Y.C.; Eggleton, P.; Khen, C.V.; et al. Establishing the Evidence Base for Maintaining Biodiversity and Ecosystem Function in the Oil Palm Landscapes of South East Asia. Philos. Trans. R. Soc. B Biol. Sci. 2011, 366, 3277–3291. [Google Scholar] [CrossRef] [Green Version]
  11. Drescher, J.; Rembold, K.; Allen, K.; Beckschäfer, P.; Buchori, D.; Clough, Y.; Faust, H.; Fauzi, A.M.; Gunawan, D.; Hertel, D. Ecological and Socio-Economic Functions across Tropical Land Use Systems after Rainforest Conversion. Philos. Trans. R. Soc. B Biol. Sci. 2016, 371, 20150275. [Google Scholar] [CrossRef] [PubMed]
  12. Fitzherbert, E.B.; Struebig, M.J.; Morel, A.; Danielsen, F.; Brühl, C.A.; Donald, P.F.; Phalan, B. How Will Oil Palm Expansion Affect Biodiversity? Trends Ecol. Evol. 2008, 23, 538–545. [Google Scholar] [CrossRef] [PubMed]
  13. Rembold, K.; Mangopo, H.; Tjitrosoedirdjo, S.S.; Kreft, H. Plant Diversity, Forest Dependency, and Alien Plant Invasions in Tropical Agricultural Landscapes. Biol. Conserv. 2017, 213, 234–242. [Google Scholar] [CrossRef]
  14. Allen, K.; Corre, M.D.; Tjoa, A.; Veldkamp, E. Soil Nitrogen-Cycling Responses to Conversion of Lowland Forests to Oil Palm and Rubber Plantations in Sumatra, Indonesia. PLoS ONE 2015, 10, e0133325. [Google Scholar] [CrossRef] [PubMed] [Green Version]
  15. Röll, A.; Niu, F.; Meijide, A.; Ahongshangbam, J.; Ehbrecht, M.; Guillaume, T.; Gunawan, D.; Hardanto, A.; Hertel, D.; Kotowska, M.M.; et al. Transpiration on the Rebound in Lowland Sumatra. Agric. For. Meteorol. 2019, 274, 160–171. [Google Scholar] [CrossRef]
  16. Guillaume, T.; Kotowska, M.M.; Hertel, D.; Knohl, A.; Krashevska, V.; Murtilaksono, K.; Scheu, S.; Kuzyakov, Y. Carbon Costs and Benefits of Indonesian Rainforest Conversion to Plantations. Nat. Commun. 2018, 9, 2388. [Google Scholar] [CrossRef] [PubMed]
  17. Sahner, J.; Budi, S.W.; Barus, H.; Edy, N.; Meyer, M.; Corre, M.D.; Polle, A. Degradation of Root Community Traits as Indicator for Transformation of Tropical Lowland Rain Forests into Oil Palm and Rubber Plantations. PLoS ONE 2015, 10, e0138077. [Google Scholar] [CrossRef] [PubMed] [Green Version]
  18. Senior, M.J.M.; Hamer, K.C.; Bottrell, S.; Edwards, D.P.; Fayle, T.M.; Lucey, J.M.; Mayhew, P.J.; Newton, R.; Peh, K.S.-H.; Sheldon, F.H.; et al. Trait-Dependent Declines of Species Following Conversion of Rain Forest to Oil Palm Plantations. Biodivers. Conserv. 2013, 22, 253–268. [Google Scholar] [CrossRef]
  19. Clough, Y.; Krishna, V.V.; Corre, M.D.; Darras, K.; Denmead, L.H.; Meijide, A.; Moser, S.; Musshoff, O.; Steinebach, S.; Veldkamp, E.; et al. Land-Use Choices Follow Profitability at the Expense of Ecological Functions in Indonesian Smallholder Landscapes. Nat. Commun. 2016, 7, 13137. [Google Scholar] [CrossRef]
  20. Krashevska, V.; Klarner, B.; Widyastuti, R.; Maraun, M.; Scheu, S. Impact of Tropical Lowland Rainforest Conversion into Rubber and Oil Palm Plantations on Soil Microbial Communities. Biol. Fertil. Soils 2015, 51, 697–705. [Google Scholar] [CrossRef]
  21. Schneider, D.; Engelhaupt, M.; Allen, K.; Kurniawan, S.; Krashevska, V.; Heinemann, M.; Nacke, H.; Wijayanti, M.; Meryandini, A.; Corre, M.D.; et al. Impact of Lowland Rainforest Transformation on Diversity and Composition of Soil Prokaryotic Communities in Sumatra (Indonesia). Front. Microbiol. 2015, 6, 1339. [Google Scholar] [CrossRef] [Green Version]
  22. Brinkmann, N.; Schneider, D.; Sahner, J.; Ballauff, J.; Edy, N.; Barus, H.; Irawan, B.; Budi, S.W.; Qaim, M.; Daniel, R.; et al. Intensive Tropical Land Use Massively Shifts Soil Fungal Communities. Sci. Rep. 2019, 9, 3403. [Google Scholar] [CrossRef] [Green Version]
  23. Kerfahi, D.; Tripathi, B.M.; Lee, J.; Edwards, D.P.; Adams, J.M. The Impact of Selective-Logging and Forest Clearance for Oil Palm on Fungal Communities in Borneo. PLoS ONE 2014, 9, e111525. [Google Scholar] [CrossRef] [PubMed]
  24. Schulz, G.; Schneider, D.; Brinkmann, N.; Edy, N.; Daniel, R.; Polle, A.; Scheu, S.; Krashevska, V. Changes in Trophic Groups of Protists with Conversion of Rainforest into Rubber and Oil Palm Plantations. Front. Microbiol. 2019, 10, 240. [Google Scholar] [CrossRef] [PubMed] [Green Version]
  25. Berkelmann, D.; Schneider, D.; Engelhaupt, M.; Heinemann, M.; Christel, S.; Wijayanti, M.; Meryandini, A.; Daniel, R. How Rainforest Conversion to Agricultural Systems in Sumatra (Indonesia) Affects Active Soil Bacterial Communities. Front. Microbiol. 2018, 9, 2381. [Google Scholar] [CrossRef] [PubMed]
  26. McGuire, K.L.; D’Angelo, H.; Brearley, F.Q.; Gedallovich, S.M.; Babar, N.; Yang, N.; Gillikin, C.M.; Gradoville, R.; Bateman, C.; Turner, B.L.; et al. Responses of Soil Fungi to Logging and Oil Palm Agriculture in Southeast Asian Tropical Forests. Microb. Ecol. 2015, 69, 733–747. [Google Scholar] [CrossRef] [Green Version]
  27. Corley, R.H.V.; Tinker, P.B.H. The Oil Palm; John Wiley & Sons: Hoboken, NJ, USA, 2008; ISBN 978-0-470-75036-0. [Google Scholar]
  28. Goh, K.J. Fertilizer Recommendation Systems for Oil Palm: Estimating the Fertilizer Rates. 2004. Available online: http://www.oneoilpalm.com/wp-content/uploads/2015/09/Fertilizer-recommendation-systems-for-oil-palm-estimating-the-fertilizer-rates.pdf (accessed on 7 January 2022).
  29. Darras, K.F.A.; Corre, M.D.; Formaglio, G.; Tjoa, A.; Potapov, A.; Brambach, F.; Sibhatu, K.T.; Grass, I.; Rubiano, A.A.; Buchori, D.; et al. Reducing Fertilizer and Avoiding Herbicides in Oil Palm Plantations—Ecological and Economic Valuations. Front. For. Glob. Chang. 2019, 2, 65. [Google Scholar] [CrossRef] [Green Version]
  30. Luke, S.H.; Advento, A.D.; Aryawan, A.A.K.; Adhy, D.N.; Ashton-Butt, A.; Barclay, H.; Dewi, J.P.; Drewer, J.; Dumbrell, A.J.; Eycott, A.E.; et al. Managing Oil Palm Plantations More Sustainably: Large-Scale Experiments within the Biodiversity and Ecosystem Function in Tropical Agriculture (BEFTA) Programme. Front. For. Glob. Chang. 2020, 2, 75. [Google Scholar] [CrossRef] [Green Version]
  31. Bruggen, A.V.V.; He, M.; Shin, K.; Mai, V.; Jeong, K.C.; Finckh, M.; Morris, J.G. Environmental and Health Effects of the Herbicide Glyphosate. Sci. Total Environ. 2018, 616, 255–268. [Google Scholar] [CrossRef] [PubMed]
  32. Bigelow, S.W.; Ewel, J.J.; Haggar, J.P. Enhancing Nutrient Retention in Tropical Tree Plantations: No Short Cuts. Ecol. Appl. 2004, 14, 28–46. [Google Scholar] [CrossRef]
  33. Mendes, R.; Garbeva, P.; Raaijmakers, J.M. The Rhizosphere Microbiome: Significance of Plant Beneficial, Plant Pathogenic, and Human Pathogenic Microorganisms. FEMS Microbiol. Rev. 2013, 37, 634–663. [Google Scholar] [CrossRef] [PubMed]
  34. Hinsinger, P.; Bengough, A.G.; Vetterlein, D.; Young, I.M. Rhizosphere: Biophysics, Biogeochemistry and Ecological Relevance. Plant Soil 2009, 321, 117–152. [Google Scholar] [CrossRef]
  35. Pierret, A.; Doussan, C.; Capowiez, Y.; Bastardie, F.; Pagès, L. Root Functional Architecture: A Framework for Modeling the Interplay between Roots and Soil. Vadose Zone J. 2007, 6, 269–281. [Google Scholar] [CrossRef]
  36. Raaijmakers, J.M.; Paulitz, T.C.; Steinberg, C.; Alabouvette, C.; Moënne-Loccoz, Y. The Rhizosphere: A Playground and Battlefield for Soilborne Pathogens and Beneficial Microorganisms. Plant Soil 2009, 321, 341–361. [Google Scholar] [CrossRef] [Green Version]
  37. Sofo, A.; Elshafie, H.S.; Camele, I. Structural and Functional Organization of the Root System: A Comparative Study on Five Plant Species. Plants Basel Switz. 2020, 9, E1338. [Google Scholar] [CrossRef] [PubMed]
  38. Toju, H.; Tanabe, A.S.; Yamamoto, S.; Sato, H. High-Coverage ITS Primers for the DNA-Based Identification of Ascomycetes and Basidiomycetes in Environmental Samples. PLoS ONE 2012, 7, e40863. [Google Scholar] [CrossRef] [Green Version]
  39. White, T.J.; Bruns, T.; Lee, S.; Taylor, J. Amplification and Direct Sequencing of Fungal Ribosomal RNA Genes for Phylogenetics. In PCR Protocols; Elsevier: Amsterdam, The Netherlands, 1990; pp. 315–322. ISBN 978-0-12-372180-8. [Google Scholar]
  40. Simon, L.; Lalonde, M.; Bruns, T. Specific Amplification of 18S Fungal Ribosomal Genes from Vesicular-Arbuscular Endomycorrhizal Fungi Colonizing Roots. Appl. Environ. Microbiol. 1992, 58, 291–295. [Google Scholar] [CrossRef] [Green Version]
  41. Lee, J.; Lee, S.; Young, J.P.W. Improved PCR Primers for the Detection and Identification of Arbuscular Mycorrhizal Fungi. FEMS Microbiol. Ecol. 2008, 65, 339–349. [Google Scholar] [CrossRef] [Green Version]
  42. Chen, S.; Zhou, Y.; Chen, Y.; Gu, J. Fastp: An Ultra-Fast All-in-One FASTQ Preprocessor. Bioinformatics 2018, 34, i884–i890. [Google Scholar] [CrossRef]
  43. Zhang, J.; Kobert, K.; Flouri, T.; Stamatakis, A. PEAR a Fast and Accurate Illumina Paired-End ReAd MergeR. Bioinformatics 2014, 30, 614–620. [Google Scholar] [CrossRef] [Green Version]
  44. Martin, M. Cutadapt Removes Adapter Sequences from High-Throughput Sequencing Reads. EMBnet J. 2011, 17, 10–12. [Google Scholar] [CrossRef]
  45. Edgar, R.C.; Haas, B.J.; Clemente, J.C.; Quince, C.; Knight, R. UCHIME Improves Sensitivity and Speed of Chimera Detection. Bioinformatics 2011, 27, 2194–2200. [Google Scholar] [CrossRef] [PubMed] [Green Version]
  46. Nilsson, R.H.; Tedersoo, L.; Ryberg, M.; Kristiansson, E.; Hartmann, M.; Unterseher, M.; Porter, T.M.; Bengtsson-Palme, J.; Walker, D.M.; de Sousa, F.; et al. A Comprehensive, Automatically Updated Fungal ITS Sequence Dataset for Reference-Based Chimera Control in Environmental Sequencing Efforts. Microbes Environ. 2015, 30, 145–150. [Google Scholar] [CrossRef] [PubMed] [Green Version]
  47. Abarenkov, K.; Henrik Nilsson, R.; Larsson, K.-H.; Alexander, I.J.; Eberhardt, U.; Erland, S.; Høiland, K.; Kjøller, R.; Larsson, E.; Pennanen, T.; et al. The UNITE Database for Molecular Identification of Fungi—Recent Updates and Future Perspectives. New Phytol. 2010, 186, 281–285. [Google Scholar] [CrossRef] [PubMed]
  48. Oksanen, J.; Blanchet, F.G.; Friendly, M.; Kindt, R.; Legendre, P.; McGlinn, D.; Minchin, P.R.; O’Hara, R.B.; Simpson, G.L.; Solymos, P.; et al. Vegan: Community Ecology Package. 2015. Available online: http://CRAN.R-project.org/package=vegan (accessed on 11 January 2022).
  49. Nguyen, N.H.; Song, Z.; Bates, S.T.; Branco, S.; Tedersoo, L.; Menke, J.; Schilling, J.S.; Kennedy, P.G. FUNGuild: An Open Annotation Tool for Parsing Fungal Community Datasets by Ecological Guild. Fungal Ecol. 2016, 20, 241–248. [Google Scholar] [CrossRef]
  50. Bray, R.H.; Kurtz, L.T. Determination of Total, Organic, and Available Forms of Phosphorus in Soils. Soil Sci. 1945, 59, 39–46. [Google Scholar] [CrossRef]
  51. Formaglio, G.; Veldkamp, E.; Damris, M.; Tjoa, A.; Corre, M.D. Mulching with Pruned Fronds Promotes the Internal Soil N Cycling and Soil Fertility in a Large-Scale Oil Palm Plantation. Biogeochemistry 2021, 154, 63–80. [Google Scholar] [CrossRef]
  52. Ashton-Butt, A.; Aryawan, A.A.; Hood, A.S.; Naim, M.; Purnomo, D.; Wahyuningsih, R.; Willcock, S.; Poppy, G.M.; Caliman, J.P.; Turner, E.C.; et al. Understory Vegetation in Oil Palm Plantations Benefits Soil Biodiversity and Decomposition Rates. Front. For. Glob. Chang. 2018, 1, 10. [Google Scholar] [CrossRef]
  53. Silver, W.L.; Thompson, A.W.; Reich, A.; Ewel, J.J.; Firestone, M.K. Nitrogen Cycling in Tropical Plantation Forests: Potential Controls on Nitrogen Retention. Ecol. Appl. 2005, 15, 1604–1614. [Google Scholar] [CrossRef]
  54. Ballauff, J.; Zemp, D.C.; Schneider, D.; Irawan, B.; Daniel, R.; Polle, A. Legacy Effects Overshadow Tree Diversity Effects on Soil Fungal Communities in Oil Palm-Enrichment Plantations. Microorganisms 2020, 8, 1577. [Google Scholar] [CrossRef]
  55. Turley, N.E.; Bell-Dereske, L.; Evans, S.E.; Brudvig, L.A. Agricultural Land-Use History and Restoration Impact Soil Microbial Biodiversity. J. Appl. Ecol. 2020, 57, 852–863. [Google Scholar] [CrossRef]
  56. Corre, M.D.; Veldkamp, E.; Arnold, J.; Wright, S.J. Impact of Elevated N Input on Soil N Cycling and Losses in Old-Growth Lowland and Montane Forests in Panama. Ecology 2010, 91, 1715–1729. [Google Scholar] [CrossRef] [PubMed] [Green Version]
  57. Hall, S.J.; Matson, P.A. Nitrogen Oxide Emissions after Nitrogen Additions in Tropical Forests. Nature 1999, 400, 152–155. [Google Scholar] [CrossRef]
  58. Berkelmann, D.; Schneider, D.; Hennings, N.; Meryandini, A.; Daniel, R. Soil Bacterial Community Structures in Relation to Different Oil Palm Management Practices. Sci. Data 2020, 7, 421. [Google Scholar] [CrossRef]
  59. Bongers, T.; Ferris, H. Nematode Community Structure as a Bioindicator in Environmental Monitoring. Trends Ecol. Evol. 1999, 14, 224–228. [Google Scholar] [CrossRef]
  60. Krashevska, V.; Kudrin, A.A.; Widyastuti, R.; Scheu, S. Changes in Nematode Communities and Functional Diversity with the Conversion of Rainforest into Rubber and Oil Palm Plantations. Front. Ecol. Evol. 2019, 7, 487. [Google Scholar] [CrossRef] [Green Version]
  61. Ma, M.; Ongena, M.; Wang, Q.; Guan, D.; Cao, F.; Jiang, X.; Li, J. Chronic Fertilization of 37 Years Alters the Phylogenetic Structure of Soil Arbuscular Mycorrhizal Fungi in Chinese Mollisols. AMB Express 2018, 8, 57. [Google Scholar] [CrossRef] [Green Version]
  62. Williams, A.; Manoharan, L.; Rosenstock, N.P.; Olsson, P.A.; Hedlund, K. Long-Term Agricultural Fertilization Alters Arbuscular Mycorrhizal Fungal Community Composition and Barley (Hordeum Vulgare) Mycorrhizal Carbon and Phosphorus Exchange. New Phytol. 2017, 213, 874–885. [Google Scholar] [CrossRef] [PubMed]
  63. Han, Y.; Feng, J.; Han, M.; Zhu, B. Responses of Arbuscular Mycorrhizal Fungi to Nitrogen Addition: A Meta-Analysis. Glob. Change Biol. 2020, 26, 7229–7241. [Google Scholar] [CrossRef] [PubMed]
  64. Pozo, M.J.; Azcón-Aguilar, C. Unraveling Mycorrhiza-Induced Resistance. Curr. Opin. Plant Biol. 2007, 10, 393–398. [Google Scholar] [CrossRef] [PubMed]
  65. Selosse, M.-A.; Bessis, A.; Pozo, M.J. Microbial Priming of Plant and Animal Immunity: Symbionts as Developmental Signals. Trends Microbiol. 2014, 22, 607–613. [Google Scholar] [CrossRef]
  66. Starmer, W.T.; Lachance, M.-A. Chapter 6—Yeast Ecology. In The Yeasts, 5th ed.; Kurtzman, C.P., Fell, J.W., Boekhout, T., Eds.; Elsevier: London, UK, 2011; pp. 65–83. ISBN 978-0-444-52149-1. [Google Scholar]
  67. Ballauff, J.; Schneider, D.; Edy, N.; Irawan, B.; Daniel, R.; Polle, A. Shifts in Root and Soil Chemistry Drive the Assembly of Belowground Fungal Communities in Tropical Land-Use Systems. Soil Biol. Biochem. 2021, 154, 108140. [Google Scholar] [CrossRef]
  68. Rinaldi, A.C.; Comandini, O.; Kuyper, T.W. Ectomycorrhizal Fungal Diversity: Seperating the Wheat from the Chaff. Fungal Divers. 2008, 33, 1–45. [Google Scholar]
  69. Mohan Kumar, B. Litter Dynamics in Plantation and Agroforestry Systems of the Tropics—A Review of Observations and Methods. In Ecological Basis of Agroforestry; Rani Batish, D., Kumar Kohli, R., Jose, S., Pal Singh, H., Eds.; CRC Press: Boca Raton, FL, USA, 2007; pp. 181–216. ISBN 978-1-4200-4327-3. [Google Scholar]
  70. Tuovila, H.; Davey, M.; Yan, L.; Huhtinen, S.; Rikkinen, J. New Resinicolous Chaenothecopsis Species from China. Mycologia 2014, 106, 989–1003. [Google Scholar] [CrossRef] [PubMed]
  71. Rikkinen, J.; Poinar, G. A New Species of Resinicolous Chaenothecopsis (Mycocaliciaceae, Ascomycota) from 20 Million Year Old Bitterfeld Amber, with Remarks on the Biology of Resinicolous Fungi. Mycol. Res. 2000, 104, 7–15. [Google Scholar] [CrossRef]
  72. Beimforde, C.; Tuovila, H.; Schmidt, A.R.; Lee, W.G.; Gube, M.; Rikkinen, J. Chaenothecopsis Schefflerae (Ascomycota: Mycocaliciales): A Widespread Fungus on Semi-Hardened Exudates of Endemic New Zealand Araliaceae. N. Z. J. Bot. 2017, 55, 387–406. [Google Scholar] [CrossRef] [Green Version]
  73. Haney, R.L.; Senseman, S.A.; Hons, F.M.; Zuberer, D.A. Effect of Glyphosate on Soil Microbial Activity and Biomass. Weed Sci. 2000, 48, 89–93. [Google Scholar] [CrossRef]
  74. Newman, M.M.; Hoilett, N.; Lorenz, N.; Dick, R.P.; Liles, M.R.; Ramsier, C.; Kloepper, J.W. Glyphosate Effects on Soil Rhizosphere-Associated Bacterial Communities. Sci. Total Environ. 2016, 543, 155–160. [Google Scholar] [CrossRef] [Green Version]
  75. Arfarita, N.; Imai, T.; Prasetya, B. Potential Use of Soil-Born Fungi Isolated from Treated Soil in Indonesia to Degrade Glyphosate Herbicide. J. Degrad. Min. Lands Manag. 2014, 1, 63–68. [Google Scholar] [CrossRef]
Figure 1. Rarefaction curves of individual samples (A) and relative abundances of phyla (B) associated with oil palm roots. CH = conventional fertilization and herbicide treatment, CW = conventional fertilization and weeding, RH = reduced fertilization and herbicide treatment, RW = reduced fertilization and weeding. Phyla with sequence abundances ≥0.01% were included. Numbers next to phylum name indicate means (%) across all samples with 100% = 240,000 reads per treatment. NoHit = read had no match in the database, NA = reads were not assigned to any phylum. Please note that owing to primers bias, the relative abundance of a phylum cannot be compared across the phyla, but only among the treatments.
Agronomy 12 00199 g001
Figure 2. Species richness of nematodes associated with oil palm roots. CW = conventional fertilization and weeding, RH = reduced fertilization and herbicide treatment, RW = reduced fertilization and weeding. Species richness in four plots per treatment with three replicate samples per plot. Data show boxplots (20% to 80%, horizontal line = mean). Different letters above the boxes indicate significant treatment effects at Chi2 < 0.05.
Agronomy 12 00199 g002
Figure 3. NMDS of phyla (A) and potential environmental drivers (B) associated with oil palm roots. Conventional fertilization and herbicide treatment = light blue circle, Conventional fertilization and weeding = pink circle, reduced fertilization and herbicide treatment = dark blue triangle, reduced fertilization and weeding = brown triangle. Stress(nMDS phyla) = 0.051. Lengths of the vectors in (B) are proportional to the correlation between ordination and environmental variable. Vectors with p < 0.1 are shown.
Agronomy 12 00199 g003
Figure 4. Species richness of fungal guilds associated with oil palm roots. (A): Arbuscular mycorrhizal fungi, (B): Multiguild fungi with ectomycorrhizal potential; (C): yeasts; (D): lichenized fungi; (E): saprotrophic fungi; (F): endophytic fungi. CW = conventional fertilization and weeding, RH = reduced fertilization and herbicide treatment, RW = reduced fertilization and weeding. Species richness in four plots per treatment with three replicate samples per plot. Data show boxplots (20% to 80%, horizontal line = mean). Different letters above the boxes indicate significant treatment effects at Chi2 < 0.05.
Agronomy 12 00199 g004
Figure 5. Species richness of root-associated fungal guilds with potentially negative or unclear effects on oil palms. (A): Plant pathogenic fungi; (B): path = other potentially pathogenic fungi, (C): fungal parasitic fungi; (D): UNK = fungi with unknown lifestyle. CW = conventional fertilization and weeding, RH = reduced fertilization and herbicide treatment, RW = reduced fertilization and weeding. Species richness in four plots per treatment with three replicate samples per plot. Data show boxplots (20% to 80%, horizontal line = mean). Different letters above the boxes indicate significant treatment effects at Chi2 < 0.05.
Agronomy 12 00199 g005
Figure 6. NMDS of fungal guilds (A) and potential environmental drivers (B). Conventional fertilization and herbicide treatment = light blue circle, Conventional fertilization and weeding = pink circle, reduced fertilization and herbicide treatment = dark blue triangle, reduced fertilization and weeding = brown triangle. Stress(guild) = 0.117. Length of vectors (B) is proportional to the correlation between ordination and environmental variable. Vectors with p < 0.1 are shown.
Agronomy 12 00199 g006
Table 1. Potentially plant-available elements in soil (mg g−1 dry soil), soil pH, soil moisture (MC, %) and bulk density (SBD, g cm−3).
ParameterCHCWRHRWpfPwPfxw
C13.19 ± 1.1512.55 ± 2.0513.22 ± 1.6014.15 ± 0.910.5860.9230.600
N0.823 ± 0.0690.808 ± 0.1320.849 ± 0.0950.858 ± 0.0450.6780.9700.899
P0.144 ± 0.0330.164 ± 0.0440.101 ± 0.0190.186 ± 0.0500.7770.1790.402
S0.044 ± 0.0020.054 ± 0.0050.050 ± 0.0050.052 ± 0.0040.6360.1380.322
K0.029 ± 0.0050.032 ± 0.0070.024 ± 0.0020.025 ± 0.0030.1720.5860.853
Na0.042 ± 0.0010.083 ± 0.0230.058 ± 0.0070.059 ± 0.0080.7540.0940.124
Mg0.139 ± 0.0230.137 ± 0.0190.144 ± 0.0320.163 ± 0.0330.5730.7610.685
Ca0.395 ± 0.0570.513 ± 0.0950.410 ± 0.0820.489 ± 0.0810.9610.2240.808
Mn0.005 ± 0.0010.005 ± 0.0010.005 ± 0.0010.006 ± 0.0010.8540.3640.535
Fe1.007 ± 0.0551.086 ± 0.0371.168 ± 0.0511.110 ± 0.0580.0760.8370.185
Al5.99 ± 0.366.57 ± 0.496.28 ± 0.586.64 ± 0.570.7240.3570.828
C/N16.07 ± 0.38314.29 ± 1.35015.43 ± 0.40516.45 ± 0.4000.3240.6180.072
Soil pH6.76 ± 0.056.84 ± 0.036.85 ± 0.026.85 ± 0.040.2270.3000.300
MC20.06 ± 0.5020.70 ± 0.7620.21 ± 0.9819.45 ± 0.710.4710.9430.362
SBD1.31 ± 0.021.28 ± 0.031.33 ± 0.031.30 ± 0.030.5060.4150.969
CH = conventional fertilization and herbicide treatment, CW = conventional fertilization and weeding, RH = reduced fertilization and herbicide treatment, RW = reduced fertilization and weeding. Data show means per treatment (n = 4 plots per treatment and 3 replicates per plot, ± SE). Statistical analyses (p) show the results of a two-way ANOVA with the main factors f = “fertilized” and w = “weeded”, and their interaction.
Table 2. Elements in fine roots (mg g−1 dry mass) and root biomass (kg m−2) in oil palm plantations.
ParameterCHCWRHRWPfPwPfxw
C427.1 ± 19.7440.1 ± 22.7457.9 ± 30.2479.3 ± 28.50.1790.5060.871
N5.91 ± 0.266.57 ± 0.495.86 ± 0.245.73 ± 0.240.1800.4290.233
P0.321 ± 0.0160.332 ± 0.0430.400 ± 0.0950.434 ± 0.0750.1700.7290.856
S0.680 ± 0.0470.731 ± 0.0520.651 ± 0.0270.690 ± 0.0350.4040.2850.882
K0.318 ± 0.0550.356 ± 0.0520.391 ± 0.0730.412 ± 0.1160.4150.7080.914
Na0.340 ± 0.0330.318 ± 0.0430.221 ± 0.0260.291 ± 0.0460.0590.5340.231
Mg0.723 ± 0.0850.724 ± 0.0830.847 ± 0.1090.965 ± 0.1450.1000.5860.592
Ca1.749 ± 0.1881.892 ± 0.3284.362 ± 2.3132.891 ± 0.9300.1590.6010.525
Mn0.039 ± 0.0120.033 ± 0.0050.047 ± 0.0180.037 ± 0.0160.6760.5910.894
Fe6.124 ± 2.0415.127 ± 0.8037.149 ± 2.9833.868 ± 1.3010.9530.2820.564
Al11.87 ± 0.7313.65 ± 1.0412.33 ± 0.9710.49 ± 1.190.1840.9810.077
C/N73.3 ± 4.572.0 ± 7.180.3 ± 7.286.1 ± 7.30.1220.7380.596
RB0.211 ± 0.0320.252 ± 0.0720.169 ± 0.0400.165 ± 0.0250.1670.6850.628
CH = conventional fertilization and herbicide treatment, CW = conventional fertilization and weeding, RH = reduced fertilization and herbicide treatment, RW = reduced fertilization and weeding. Data show means per treatment (n = 4 plots per treatment and 3 replicates per plot, ± SE). Statistical analyses (p) show the results of a two-way ANOVA with the main factors f = “fertilized” and w = “weeded”, and their interaction. Root biomass (RB) was determined to a depth of 10 cm, n = 4 ± SE).
Table 3. Diversity indices for root-associated taxa in oil palm plantations.
IndexCHCWRHRWPfPwPfxw
Shannon3.45 ± 0.463.65 ± 0.183.29 ± 0.253.49 ± 0.230.6060.5100.996
Richness790 ± 87856 ± 27737 ± 48768 ± 540.2490.4230.772
Evenness0.047 ± 0.0120.047 ± 0.0080.039 ± 0.0070.045 ± 0.0070.5640.7330.741
Taxa were determined as virtual species (OTU-based). CH = conventional fertilization and herbicide treatment, CW = conventional fertilization and weeding, RH = reduced fertilization and herbicide treatment, RW = reduced fertilization and weeding. Data are means of n = 4 per treatment and 3 replicates per plot (±SE.). Statistical analyses (p) show the results of a two-way ANOVA with the main factors f = “fertilized” and w = “weeded”, and their interaction.
Publisher’s Note: MDPI stays neutral with regard to jurisdictional claims in published maps and institutional affiliations.

