Article

Light Intensity: The Role Player in Cucumber Response to Cold Stress

by
Tahereh Ashrostaghi
1,†,
Sasan Aliniaeifard
1,*,
Aida Shomali
1,†,
Shiva Azizinia
1,2,
Jahangir Abbasi Koohpalekani
3,
Moein Moosavi-Nezhad
1 and
Nazim S. Gruda
4
1
Photosynthesis Laboratory, Department of Horticulture, Aburaihan Campus, University of Tehran, Pakdasht 33916-53755, Iran
2
Agriculture Victoria, AgriBio, Centre for AgriBioscience, Bundoora, VIC 3083, Australia
3
Department of Genetics and National Plant Gene Bank of Iran, Seed and Plant Improvement Institute, Agricultural Research, Education and Extension Organization (AREEO), Karaj 31359-33151, Iran
4
Department of Horticultural Science, INRES-Institute of Crop Science and Resource Conservation, University of Bonn, 53121 Bonn, Germany
*
Author to whom correspondence should be addressed.
These authors contributed equally to this work.
Agronomy 2022, 12(1), 201; https://doi.org/10.3390/agronomy12010201
Submission received: 8 December 2021 / Revised: 29 December 2021 / Accepted: 30 December 2021 / Published: 14 January 2022
(This article belongs to the Collection Crop Physiology and Stress)

Abstract

:
Low temperatures are a substantial limitation in the geographic distribution of warm-season crops such as cucumber (Cucumis sativus L.). Tolerance to low temperatures varies among different plant species and genotypes when changes in environmental cues occur. Therefore, biochemical and biophysical events should be coordinated to form a physiological response and cope with low temperatures. We examined how light intensity influences the effects of low temperature on photosynthesis and some biochemical traits. We used chlorophyll fluorescence imaging and polyphasic fluorescence transient to analyze cold stress damage by 4 °C. Photosynthetic Photon Flux Densities (PPFDs) of 0, 300, and 600 μmol m−2 s−1, in four accessions of cucumber, were investigated. The results show that the negative effects of cold stress are PPFD-dependent. The adverse effect of cold stress on the electron transport chain is more pronounced in plants exposed to 600 μmol m−2 s−1 than the control and dark-exposed plants, indicated by a disturbance in the electron transport chain and higher energy dissipation. Moreover, biochemical traits, including the H2O2 content, ascorbate peroxidase activity, electrolyte leakage, and water-soluble carbohydrate, increased under low temperature by increasing the PPFD. In contrast, chlorophyll and carotenoid contents decreased under low temperature through PPFD elevation. Low temperature induced a H2O2 accumulation via suppressing ascorbate peroxidase activity in a PPFD-dependent manner. In conclusion, high PPFDs exacerbate the adverse effects of low temperature on the cucumber seedlings.

Graphical Abstract

1. Introduction

Cucumber is a warm-season crop that belongs to the Cucurbitaceae family. Therefore, its growing season and geographical distribution are restricted by an ambient temperature [1,2]. To overcome multiple environmental stresses, plants have evolved complicated mechanisms at the cellular and molecular levels through evolution, enabling them to survive multiple stresses which exist in ever-changing environments [3,4,5]. Moreover, plants are sometimes deliberately exposed to cold environments by growers such as when seedling producers are forced to cold-store seedlings to reach a proper time for land cultivation. They prefer cold over normal temperatures to prevent the seedlings from over-growing in the seedling trays. However, the intensity of light they have to use during this storage period should not be very low as to deplete the plant’s carbohydrate supplies, nor very high as to cause photoinhibition in the seedlings. As another example, the transplant/explant producers usually acclimatize their products to the situation of the natural environment with a lower (sometimes higher) temperature and higher light intensities than their production units in the greenhouse or in vitro. Therefore, understanding the underlying stress tolerance mechanisms is an essential step for not only the development of stress-tolerant cultivars, but also to facilitate assisting commercial growers. Although the processes behind a plant’s response to the cool-light condition are not fully clarified, it has been known that a series of integrated events involving anatomical, morphological, biochemical, and molecular factors result in stress tolerance [6].
Plants respond to different aspects of light, including the intensity, duration, wavelength, and direction [7,8]. In general, their response differs according to other environmental cues, genotype, season, cultivation practices, and many others [9]. Light is the only energy source for photosynthesis; however, it can simultaneously act as a stress agent. Under high-light stress or when plants are exposed to other abiotic stresses (e.g., cold conditions), the supply from the electron transport chain (ETC) (including ATP and NADPH) is more than the demand of Calvin-Benson reactions [10]; thus, in such conditions, the exorbitant light energy directly defects electron transfer machinery, especially photosystem II (PSII) [11]. PSII impairment induces the production of reactive oxygen species (ROS), thereby resulting in the impairment of the D1 protein and also the prevention of its repair known as photoinhibition [12,13]. Cold tolerance in plants underlies their ability to keep their primary quinone acceptor of PSII oxidized, and are known to be less sensitive to cold stress, a phenomenon that seems to be correlated with the maximum freezing tolerance of plants [14]. Energy inequality between photochemical processes, electron transport, and the metabolism is aggravated under conditions of either high photosynthetic photon flux densities (PPFDs) or cold stress, leading to an advanced excitation force in PSII. To make up for the exposure to an increased PSII excitation force, plants seek to diminish energy transfer to PSII. This is usually performed either by dissipating surplus energy as heat through nonphotochemical fluorescence quenching (NPQ) or by redirecting energy from PSII to Photosystem I (PSI) [15]. Wanner and Junttila [16] suggest that the cue for the inauguration of freezing tolerance is developed not by over-reduction within PSII, but by electron transport through QB or the downstream of QB. This is suitable as additionally explicit proof for the preliminary role of the photosynthetic electron processes in specifying the level of freezing. Further, the Calvin-Benson cycle reactions of photosynthesis are halted due to a disturbance in the enzymatic activity and structural destruction, resulting in a dead-end for products of light reaction to reach their downstream target. Therefore, the reductive power leads to the production of ROS, further disturbing the ETC machinery [13,17,18]. Through this circumstance, abiotic stresses target photosynthesis and cause a reduction in its efficiency. The maximum quantum efficiency of PSII, FV/FM, has been introduced as a valuable index for detecting low- and high-temperature damage to components of photosynthesis. Thus, tolerant genotypes of faba bean to temperature stress could be identified [19].
Chlorophyll fluorescence has widely been used as an easily-applicable method for assessing the adverse effects of environmental stresses on plants [3,7,20,21] as well as an index for the screening of the genotype for cold tolerance [22,23,24]. This may suggest that chlorophyll fluorescence, which reflects energy excitation in PSII, can be used as an index for studying stress tolerance in plants. The merits of this index are its stability under changing climates and its fast and easy application [25,26,27]. Furthermore, the parameters reflected by chlorophyll fluorescence indicate the overall photochemical status of the leaf, but not the short-term status [25].
The rapid fluorescence induction kinetics (OJIP transient) is a quick and non-destructive method that has been used in many studies to assess photosynthetic functionality under different stress conditions [28,29,30,31,32,33]. OJIP transient reflects details about energy flow through the thylakoid membrane, specifically in PSII components [34], and provides information about the physiological state of PSII [35].
The response of plants to cold is always concomitant with exposure to different PPFDs. Several studies reported the important role of PPFDs on cold stress acclimation and plants’ overall health. However, there are some challenges within those studies. For instance, firstly, those investigations were mostly conducted on model plants such as Arabidopsis thaliana. Secondly, mainly dark, low, and normal light intensities have been used together with cold stress, and/or high light has been applied at a normal temperature [36,37,38]. For example, Prerostova et al. [37] subjected A. thaliana to darkness, 20 μmol m−2 s−1 as low light, and 150 μmol m−2 s−1 as normal light under cold stress, and Szalai et al. [36] studied 20 μmol m−2 s−1 and 250 μmol m−2 s−1 under cold conditions and also 500 μmol m−2 s−1 as high light in normal temperature on wheat plants [36,38].
Light affects cold-exposed plants in two opposing ways; although it is essential for the development of freezing tolerance by increasing the expression of genes encoding various light-harvesting complex proteins which are involved in cold acclimation [39], it induces photoinhibition especially at high PPFDs [38]. Yet, the mechanism underlying photoinhibition in cold-exposed plants is not clearly understood. To address this, the present study takes a further step by evaluating the combinational effects of relatively higher PPFDs (i.e., 300 and 600 μmol m−2 s−1) and cold stress on the cucumber as a subtropical horticultural crop (not a model plant) by assessing biochemical traits and photosynthesis functionality via chlorophyll fluorescence imaging and an OJIP analysis.
We hypothesize that plants’ biophysical and biochemical responses might alter in response to cold conditions, and the alternations might vary under different PPFDs. In addition, investigating the interaction between cold temperature and PPFD can advance our knowledge about the integrated effects of light and temperature as two vital requisites for plant growth and potential stressors in non-optimal ranges.

2. Materials and Methods

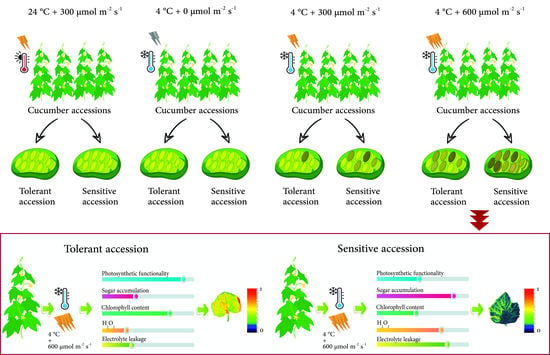
2.1. Plant Materials and Growth Condition

Seeds of four cucumber (Cucumis sativus L.) accessions were provided by the gene bank of the Seed and Plant Improvement Institute of Iran. Including two commercial hybrids, Nunhems Gouhar (N) and Super Sultan (S), as well as two domesticated cultivars, Tabriz (T) and T–141, which, respectively, originated from Tabriz and Shiraz provinces of Iran.After seeds’ surface sterilization for 1 min in a 3% sodium hypochlorite (NaOCI) solution, seeds were planted in pots containing a mixture of cocopeat (i.e., coconut coir) and perlite (1:1 v/v). Seedlings were planted in the greenhouse under temperatures 27/18 ± 2 °C (day/night) and 50 ± 5% RH. After the emergence of true leaves, the seedlings were irrigated with half-strength Hoagland solution two times a week. This irrigation round was chosen based on air temperature and RH, pot volume, substrate water-holding capacity, and seedlings’ above-ground biomass to fulfill seedlings’ water requirements without causing excessive runoff or water deficit.

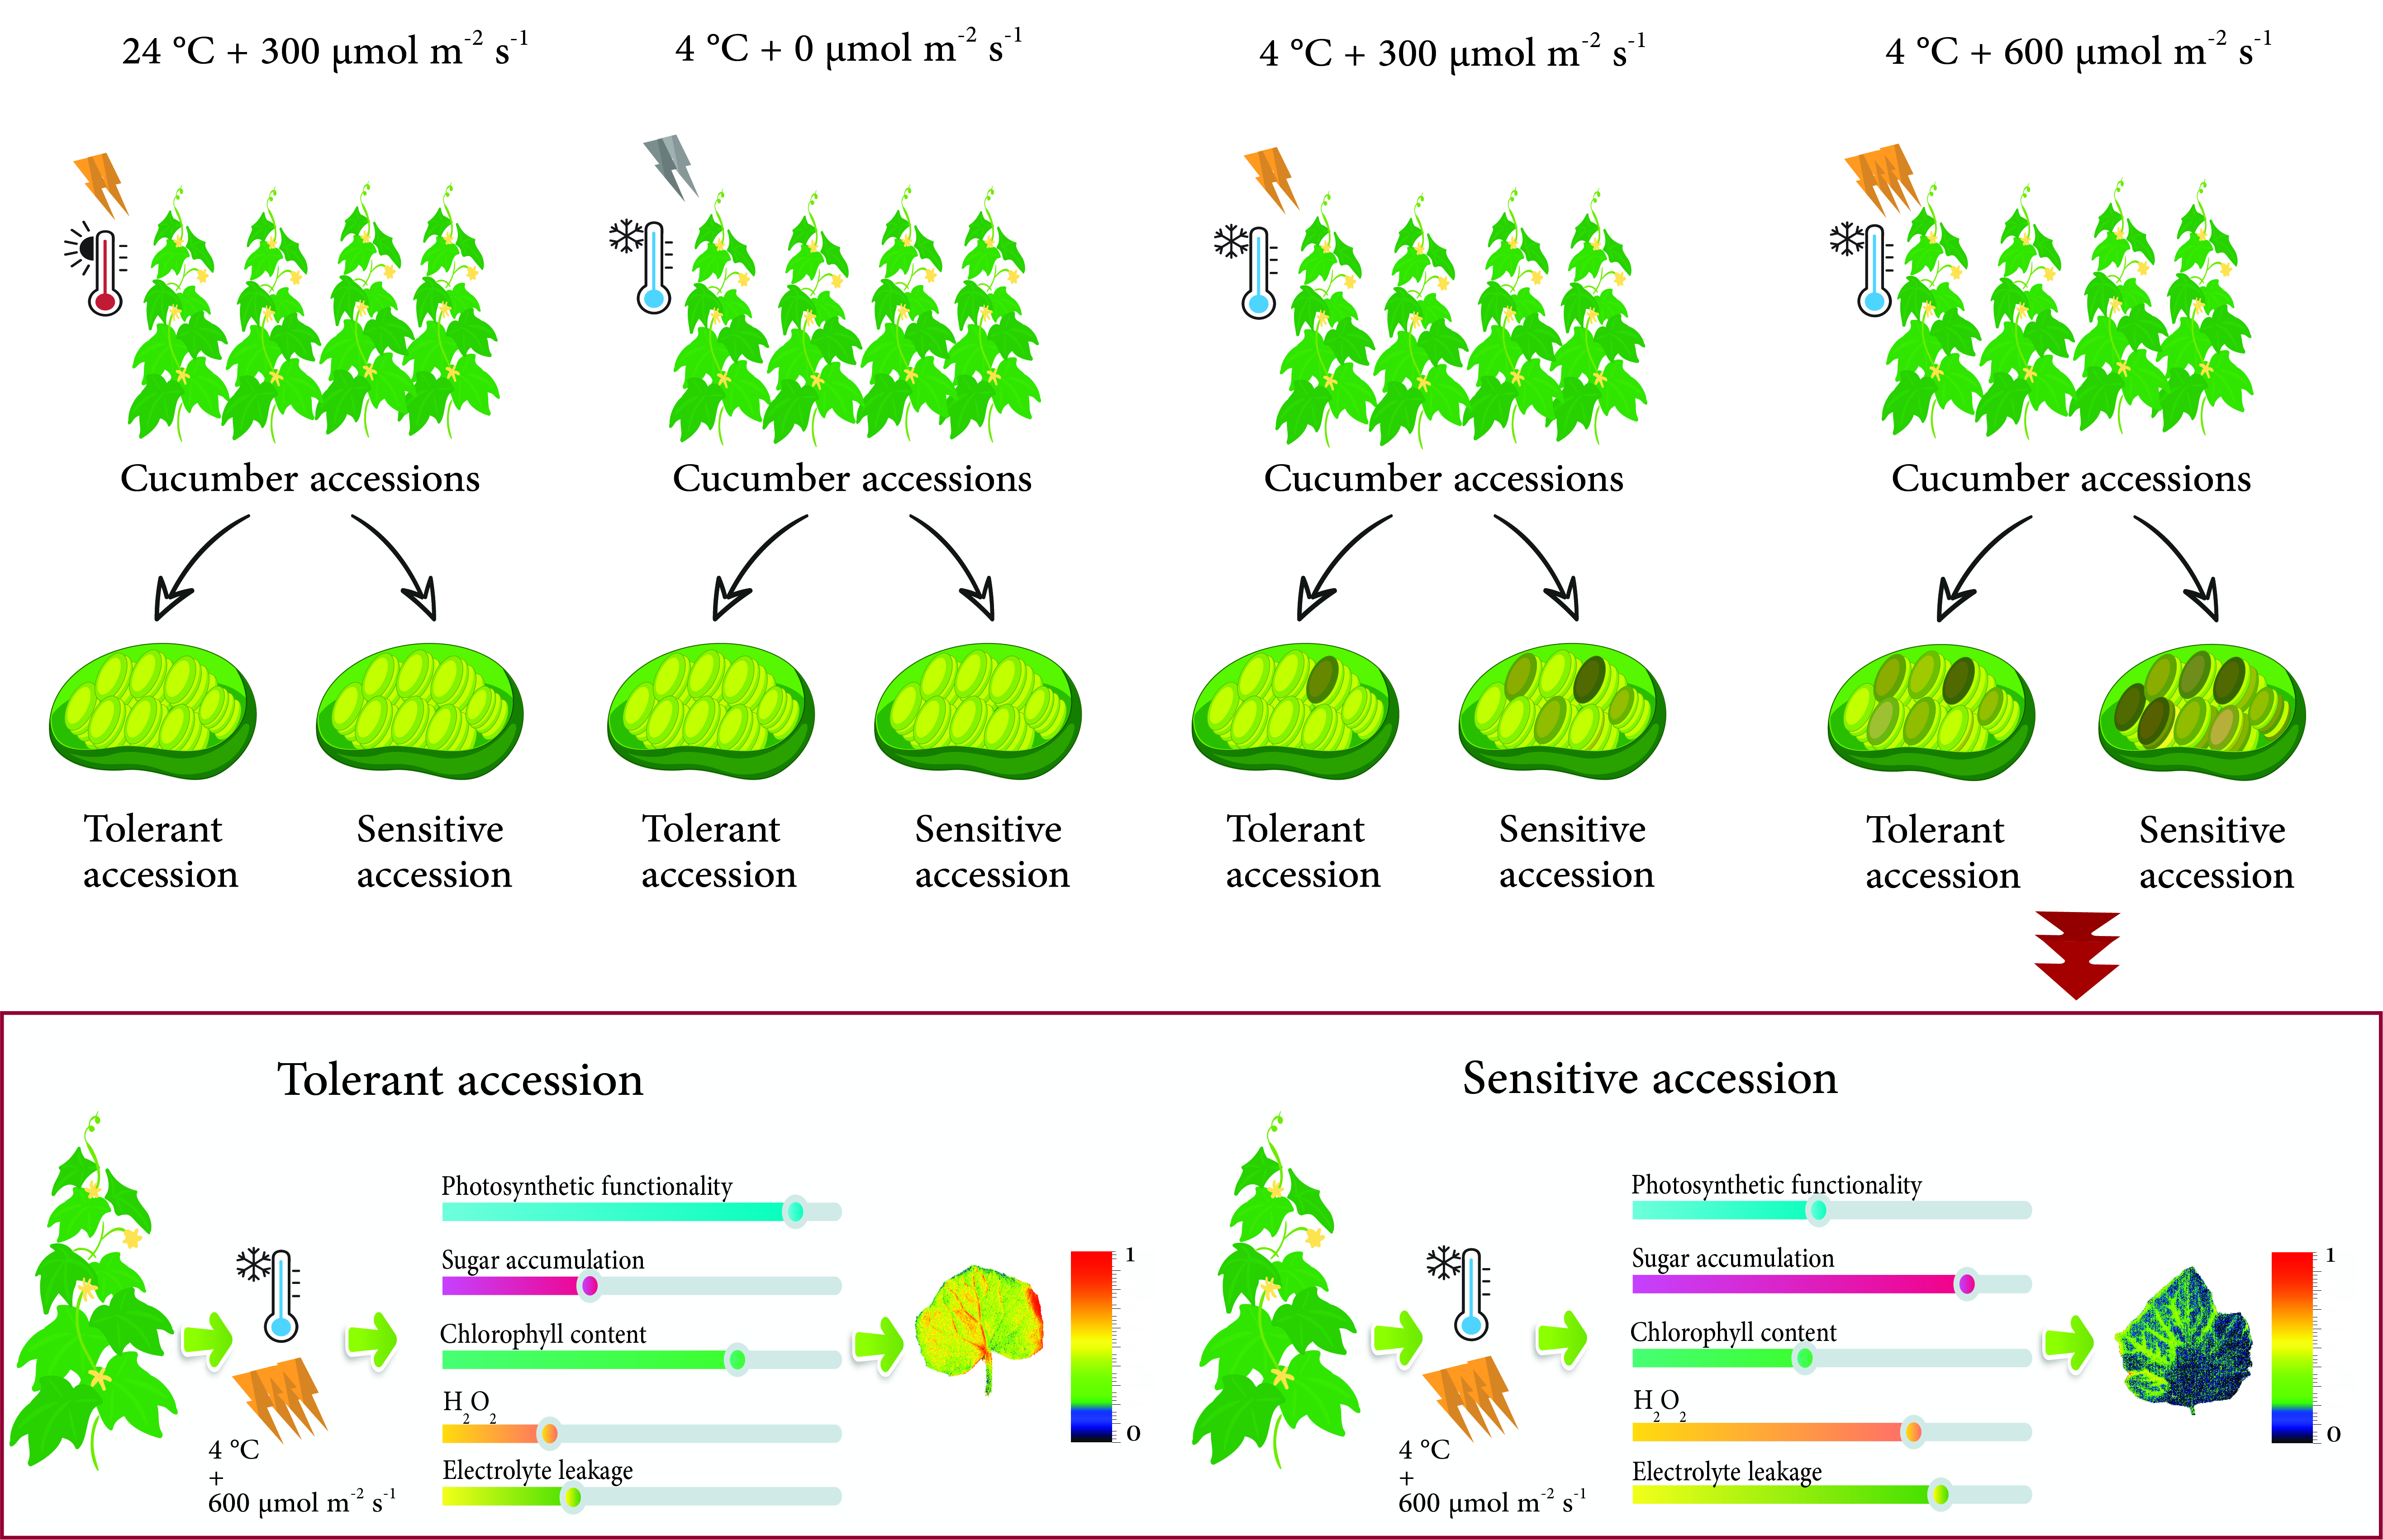
2.2. Light Treatments under Cold Condition

After the four-leaf stage, cucumber seedlings were transferred to growth chambers and were exposed to either cold conditions (4 °C) or optimum temperature (24 °C) at 50% RH for 15 h. In the cold conditions, seedlings were exposed to different PPFDs (0, 300, and 600 μmol m−2 s−1) supplied by white LED modules (Iran Grow Light, Tehran, Iran; see spectral distribution in Figure 1) under 4 °C. One set of plants was also exposed to 300 μmol m−2 s−1 under 24 °C as the control. After the application of treatments, plants were immediately transferred to the laboratory for further investigations.

2.3. Chlorophyll Fluorescence Imaging and OJIP Test Measurements

Chlorophyll fluorescence imaging was performed in leaves detached from plants of each treatment. For this purpose, biophysical measurements were performed after plants were placed in darkness for 20 min. The temperature for these measurements was the same as the temperature of the experiment (i.e., 4 °C for cold stress treatments and 24 °C for control). The petioles of young leaves were placed into falcons containing distilled water and immediately subjected to Fv/FM assessment using a fluorometer equipped with an imager (Handy FluorCam FC 1000–H, Photon Systems Instruments, Drásov, Czech Republic). The calculation of FV/FM was based on a custom-made protocol [40,41,42].
The fluorescence transient, plotted on a logarithmic time scale, typically included the following phases: O to J, J to I, and I to P. Overall, F0 represented the so-called “open” (O) state of the OJIP transient, and was the fluorescence intensity when all PSII reaction centers (RCs) were open. FM, on the other hand, came from the reduction-oxidation state of the primary quinone electron acceptor of PSII (QA) and denoted the maximal chlorophyll fluorescence intensity when all PSII reaction centers were closed. FV stands for the variable chlorophyll fluorescence (FV = FM − F0), and, finally, FV/FM (also known as TR0/ABS; see equation in Table 1) is the maximum photochemical efficiency of PSII, also known as the maximum quantum yield of the primary photochemistry. The highest Fv/Fm value was around 0.84 for horticultural plants, while decreasing its value is often considered as a hallmark of stress [20,33,34].
A polyphasic chlorophyll fluorescence induction curve (OJIP transient) was also obtained in intact leaves attached to the plants. FluorPen FP 100-MAX (Photon Systems Instruments, Drásov, Czech Republic) was used to obtain the parameters of polyphasic chlorophyll a fluorescence (OJIP) transients. The OJIP test investigated different biophysical and phenomenological parameters related to PSII status [34] according to the protocol described by [31]. Parameters derived from the OJIP test provided information on the energy fluxes of light absorption (ABS) and trapping (TR0) of the excitation energy and electron transport (ET0) per reaction center (RC), which are described in Table 1.

2.4. Photosynthetic Pigments’ Measurements

The light regimes as well as temperature effects on photosynthetic pigments (chlorophyll a, b, and carotenoids) content were assessed. For the determination of chlorophyll a, chlorophyll b, and carotenoid contents, the protocol described by Lichtenthaler and Wellburn [43] was applied. The absorbance of supernatants was spectrophotometrically (Lambda 25 UV/VIS) recorded at 645, 663, and 470 nm, and Chl (a + b) and carotenoids were calculated according to Lichtenthaler and Wellburn [43]. The entire process was conducted in low-light conditions, and the results were expressed as mg g−1 on a fresh weight basis.

2.5. Ascorbate Peroxidase (APX) Activity

For the determination of ascorbate peroxidase (APX) activity, the method described by Nakano and Asada [44] was used with minor modifications. APX activity was determined by oxidation of ascorbic acid (AA) at 265 nm (ε = 13.7 mM−1cm−1). The reaction mixture contained the enzyme extract, 50 mM potassium phosphate buffer (pH 7.0), 5 mM AA, and 0.5 mM H2O2. The reaction was started by adding H2O2. The rates were corrected for the non-enzymatic oxidation of AA by the inclusion of a reaction mixture without the enzyme extract (blind sample). The enzyme activity was expressed in AA μmol−1 min−1 per g of fresh weight [44].

2.6. Hydrogen Peroxide (H2O2) Content

For the measurement of H2O2, the method described by Patterson et al. [45] was applied. Measurement started by reaction of the sample with potassium iodide (KI). The reaction mixture contained 0.5 mL of trichloroacetic acid (TCA; 0.1%), leaf extract supernatant, 0.5 mL of K-phosphate buffer (100 mm), and 2 mL reagent (1 M KI (w/v) in fresh double-distilled H2O). Absorbance was measured at 390 nm after the development of the reaction for 1 h in darkness. A standard curve prepared with known concentrations of H2O2 as described by Patterson et al. [45] was used for the calculation of H2O2 content in the supernatant.

2.7. Electrolyte Leakage (EL)

Cell membrane stability was estimated in plant tissue by measurement of EL. Ten leaf discs (0.5 cm diameter) from the young fully developed leaves were taken using a cork borer. Leaf disc samples were washed with deionized water to remove surface-adhered electrolytes and immersed in 10 mL deionized water in closed vials at room temperature for 24 h. Then, the electrical conductivity (EC) of the samples was recorded as primary leakage (PL) and after one hour of boiling of the samples in a bain-marie (100 °C), the secondary leakage (SL) was recorded. EL was calculated using the following equation [44,46].
E L = 1 ( P L S L ) 100

2.8. Water-Soluble Carbohydrates (WSC)

Total WSC in cucumber leaves was determined by the anthrone colorimetric reagent as described by Yemm and Willi [47]. Five mL of ethanol (80%) was added to 0.5 g fresh leaves three times. They were centrifuged for 15 min at 1500× g. Then, 100 μL of the extract was added to 3 mL of 0.2% anthrone reagent. The solution mixture was boiled at 95 °C for 10 min. Subsequently, the reaction was terminated quickly in an ice bath. The absorbance of the samples was recorded spectrophotometrically at 620 nm using glucose as the standard and expressed as mg soluble carbohydrates g−1 fresh weight [47].

2.9. Statistical Analysis

The experiment was conducted in randomized block design with three levels of light intensity (0, 300, and 600 μmol m−2 s−1), four accessions (N, S, T, T141), and two temperatures (24 and 4 °C) with five replications. The statistical analysis was performed by SAS® software (version 9.4).

3. Results

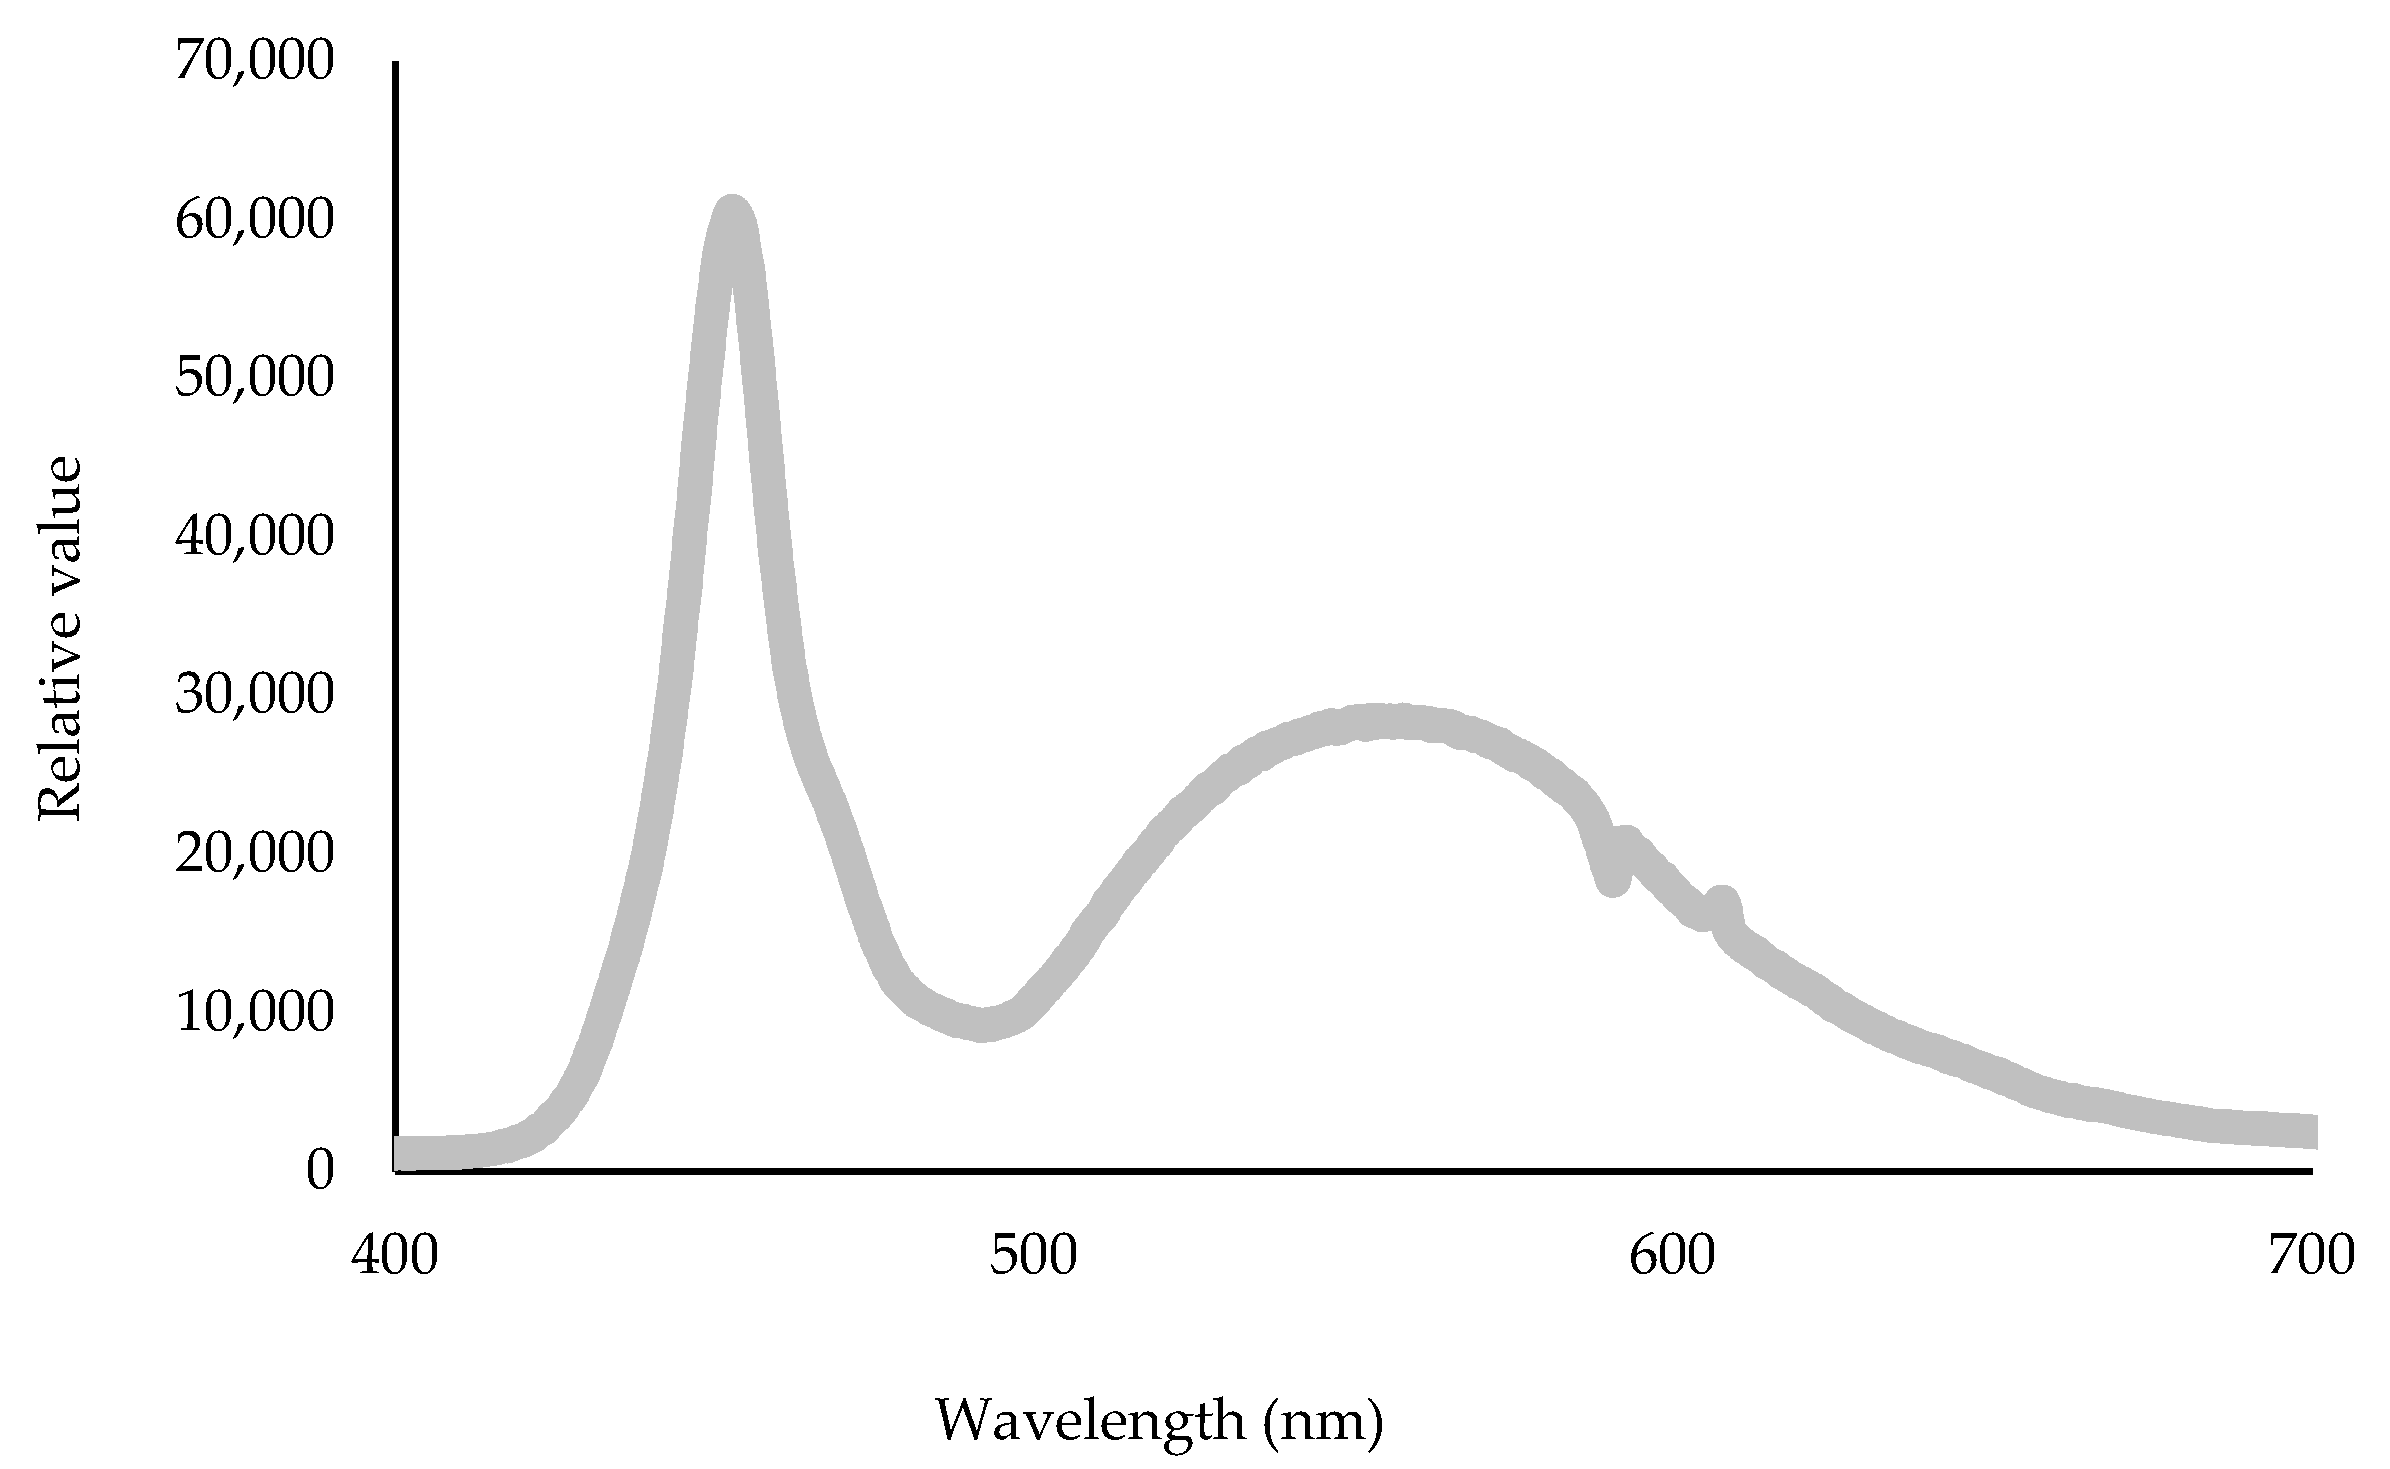
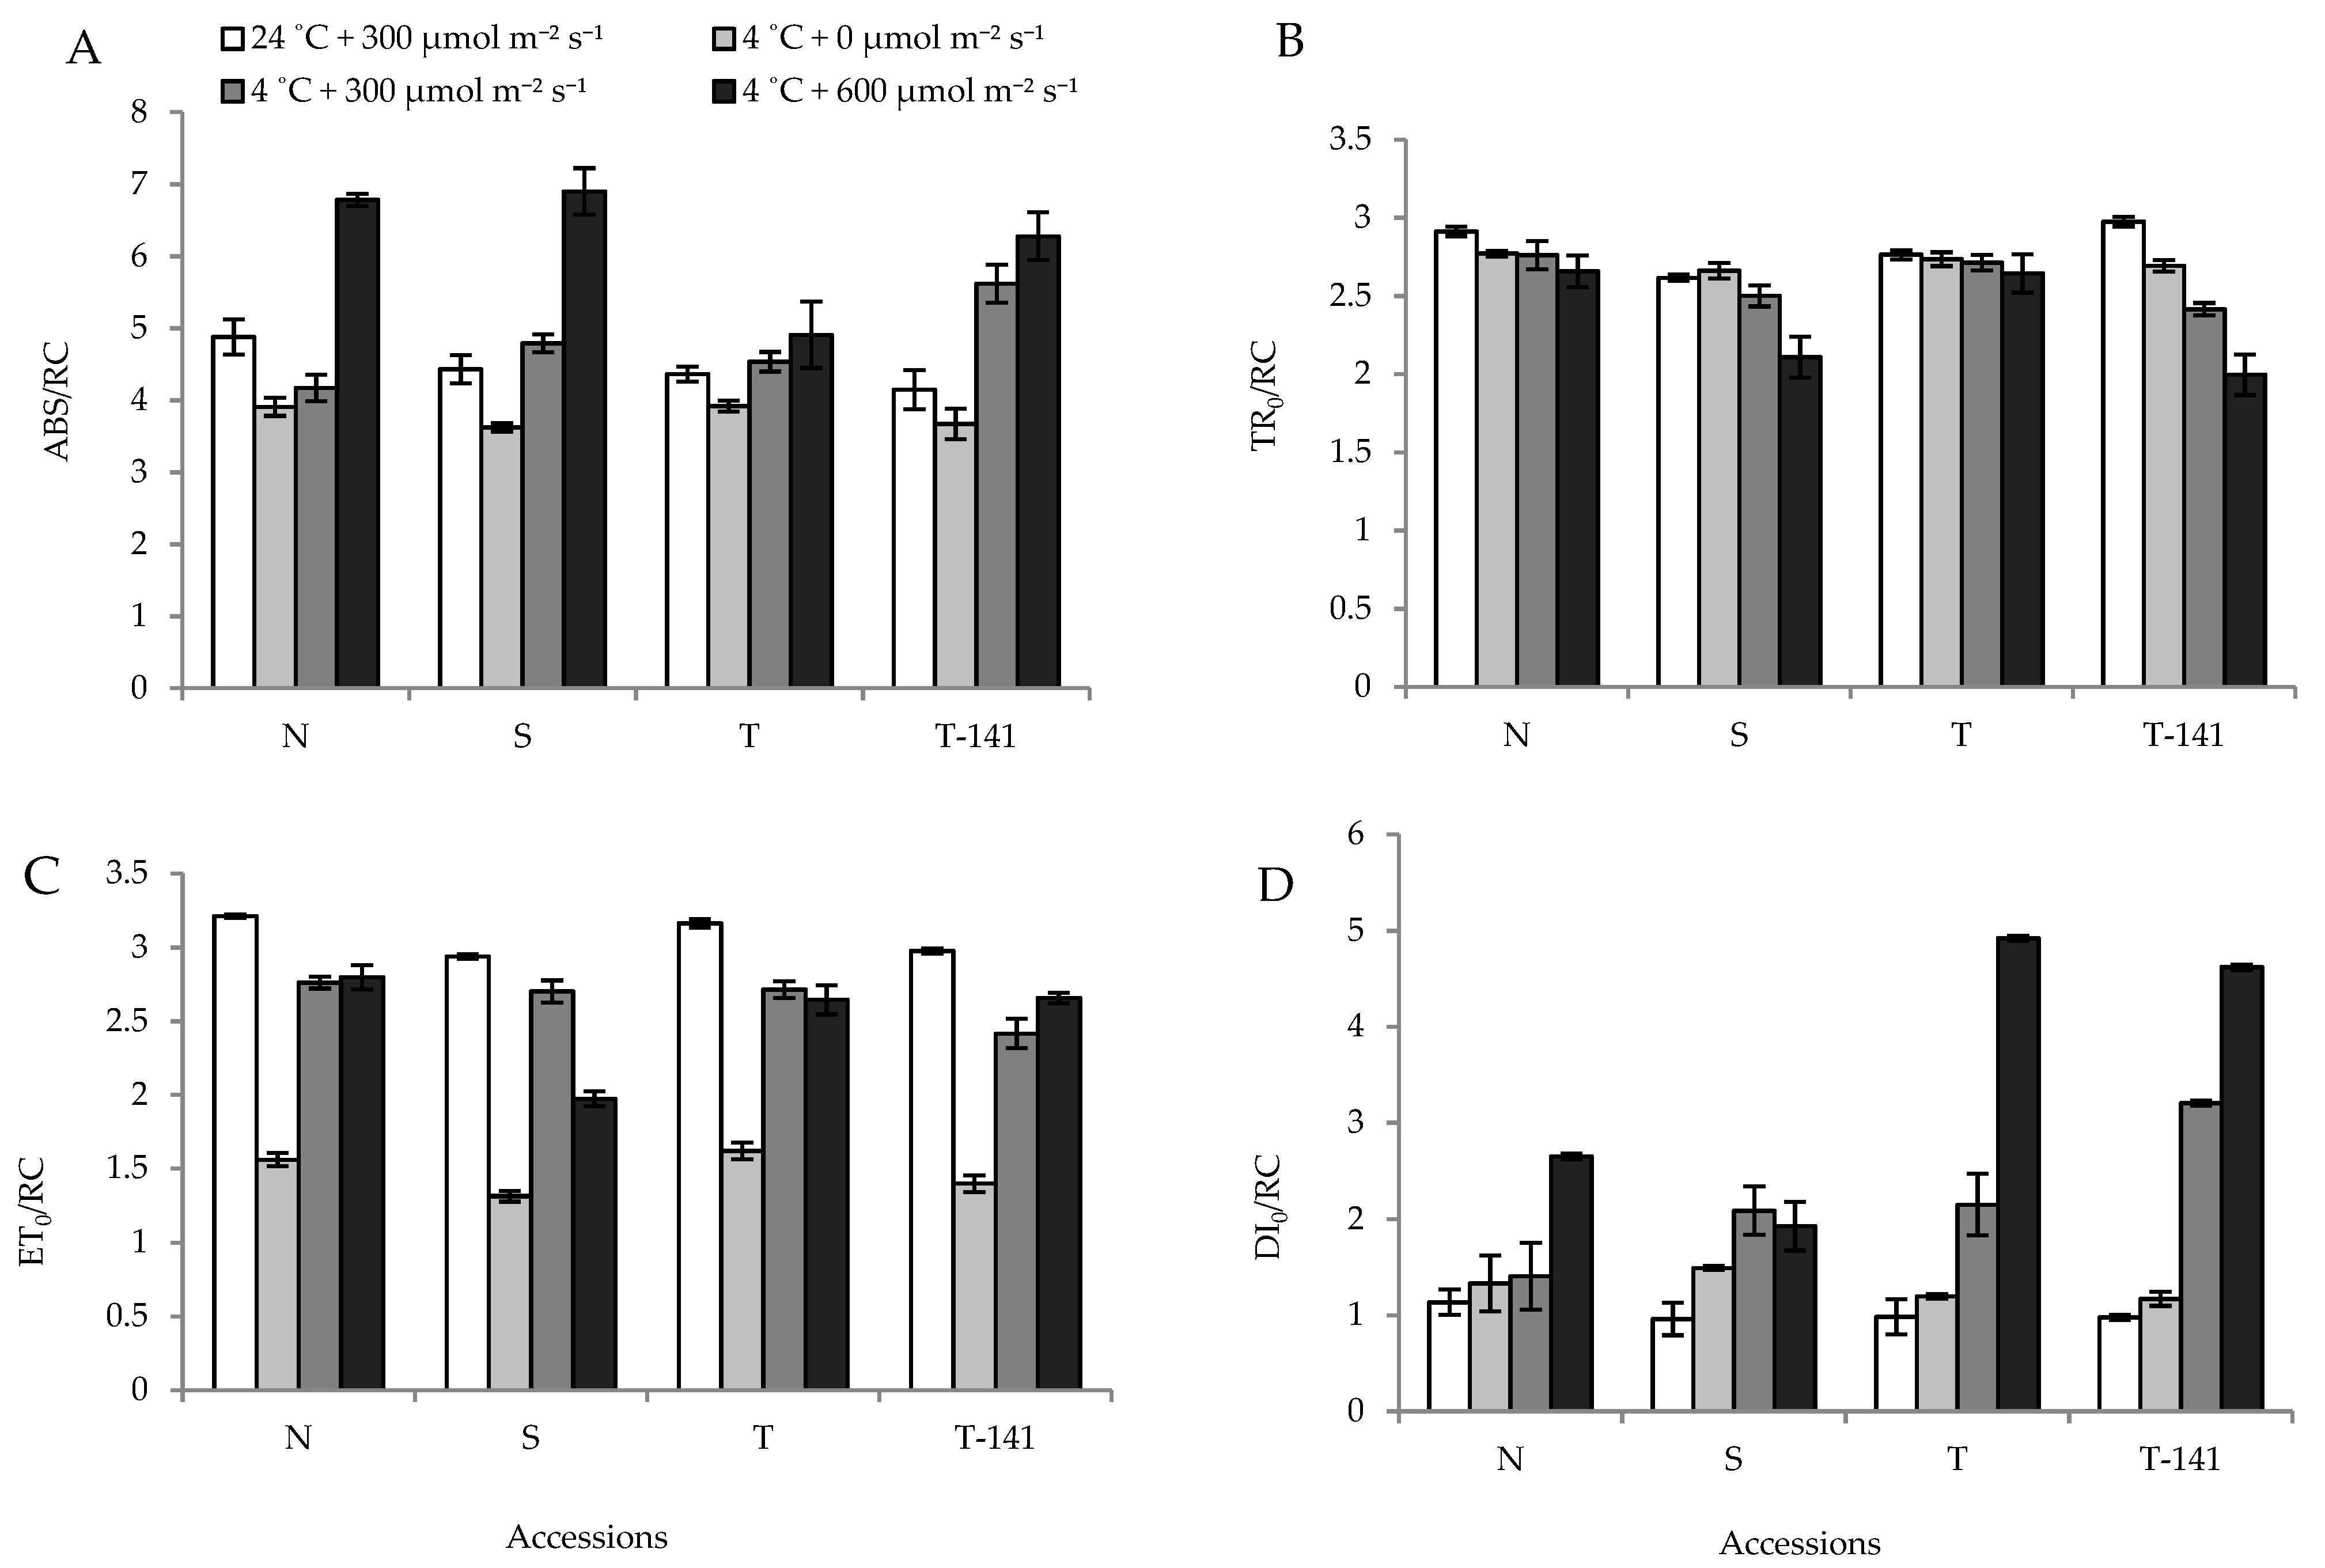
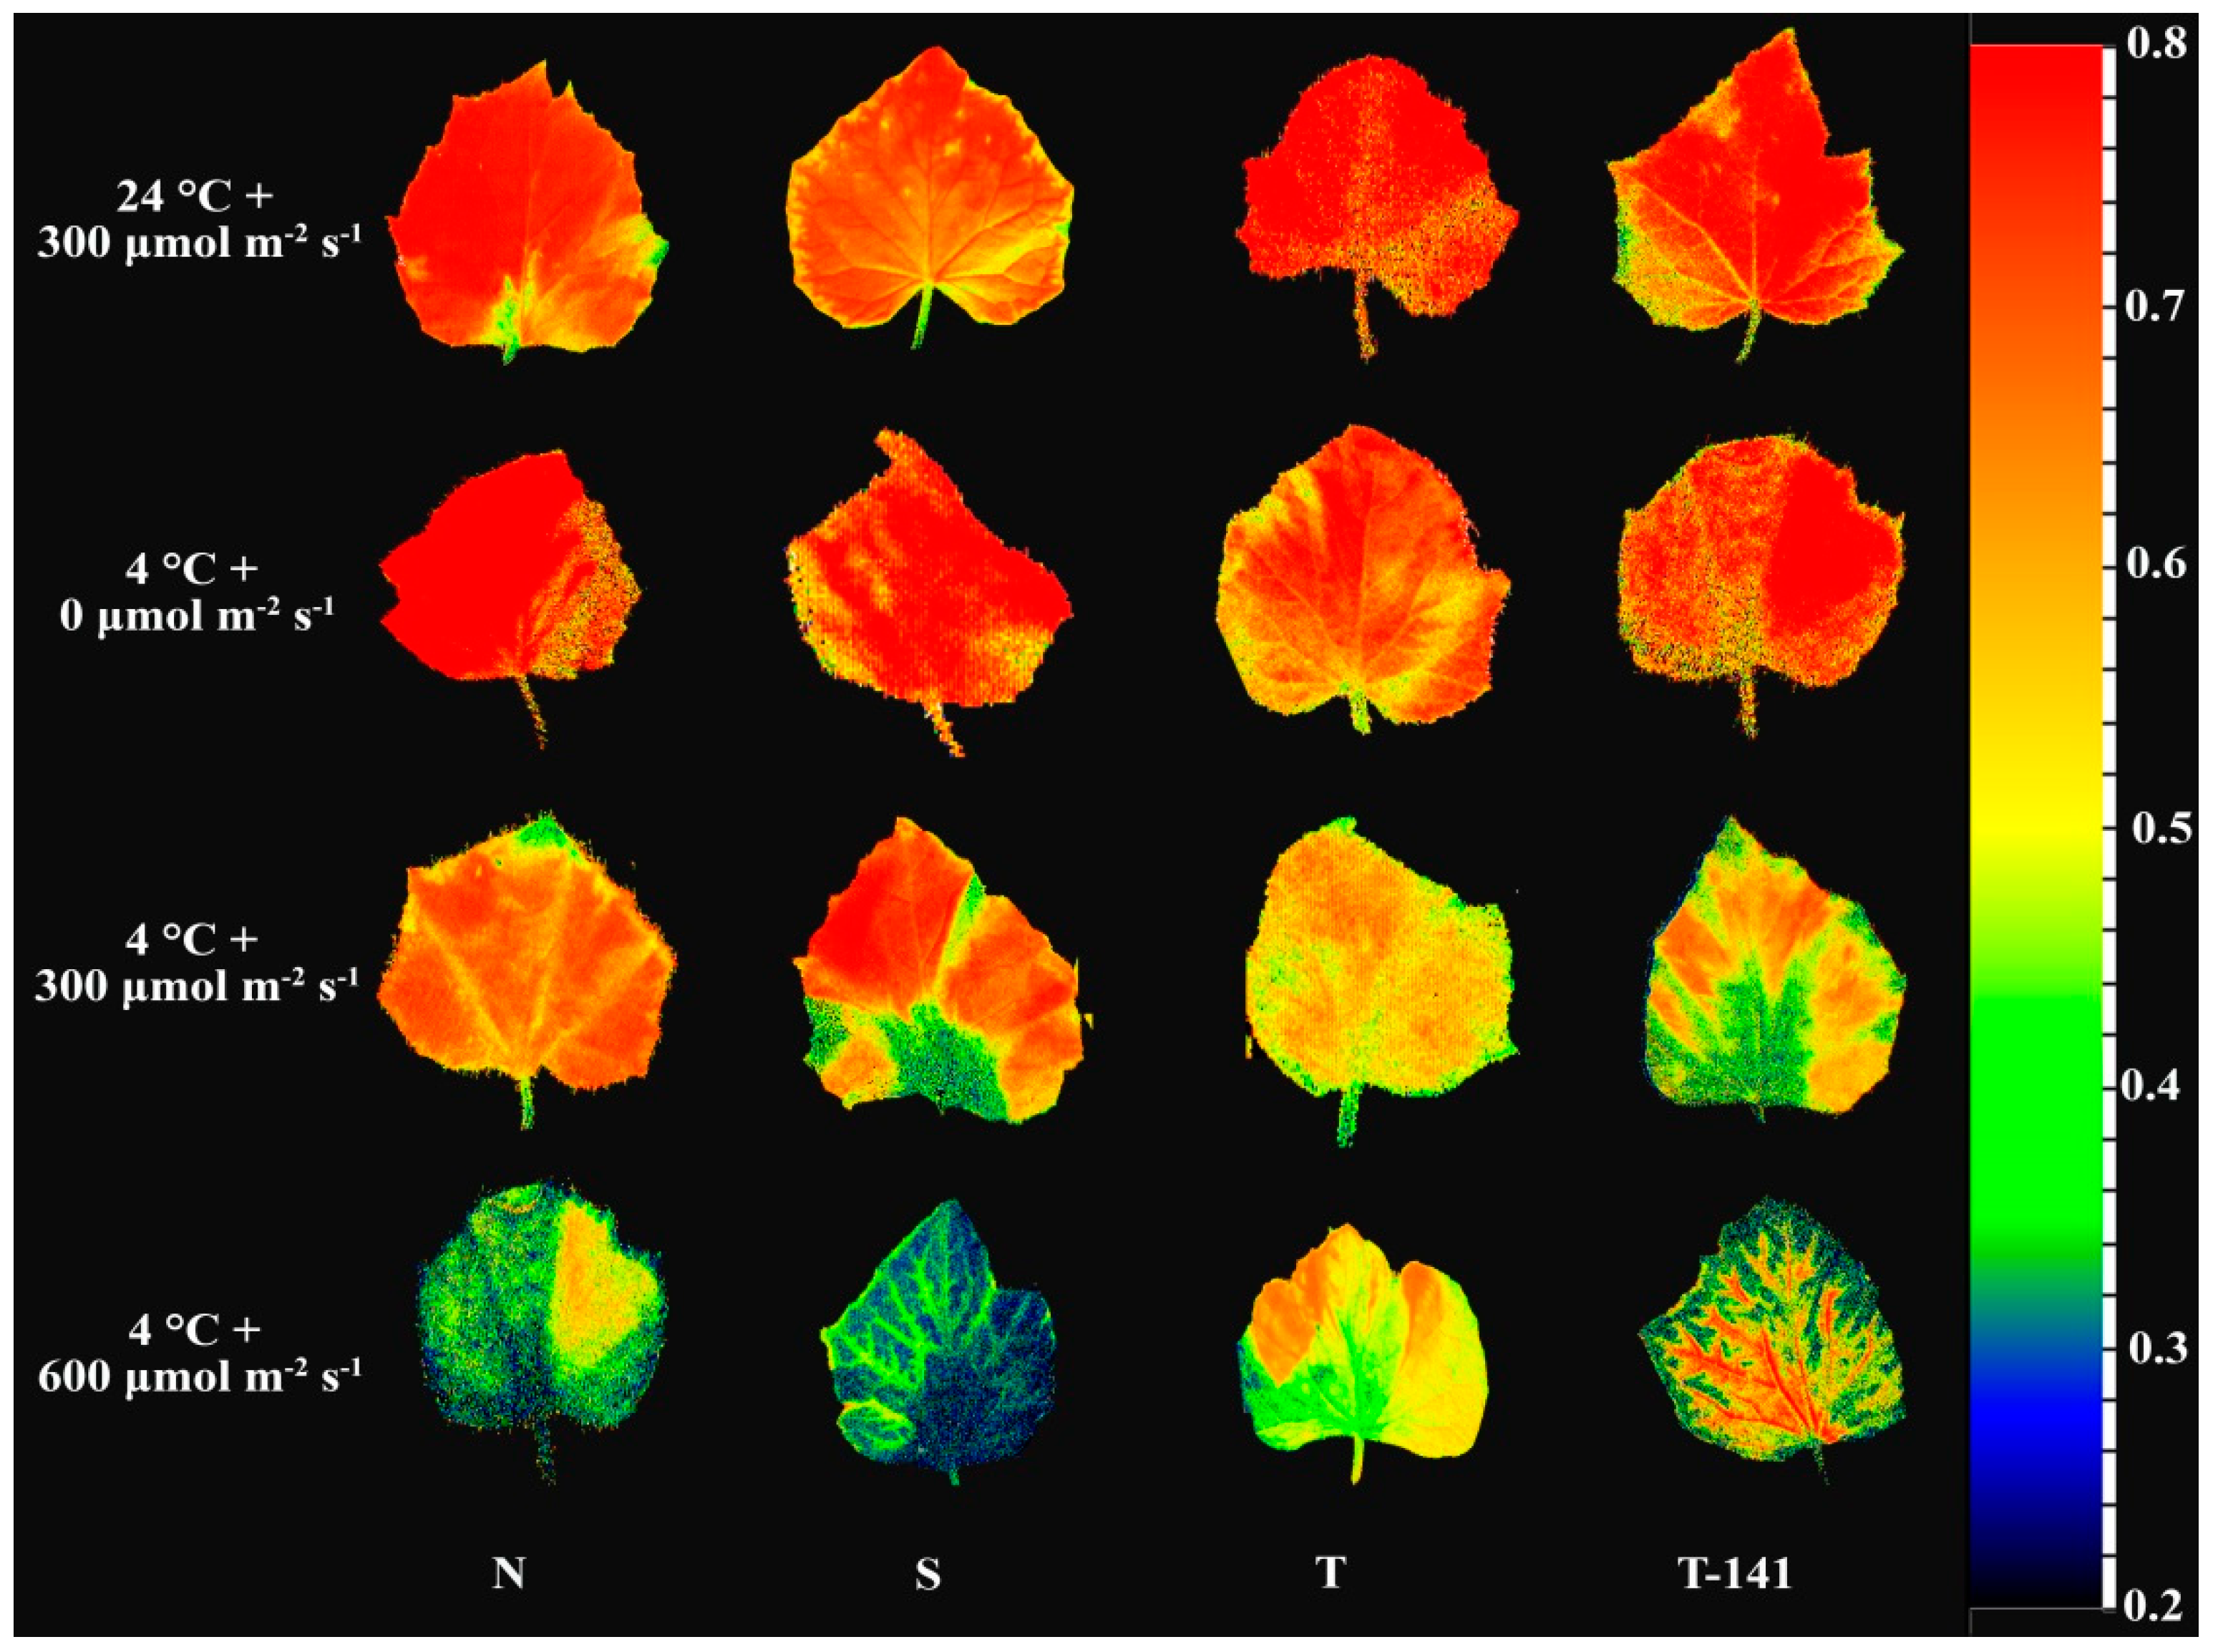
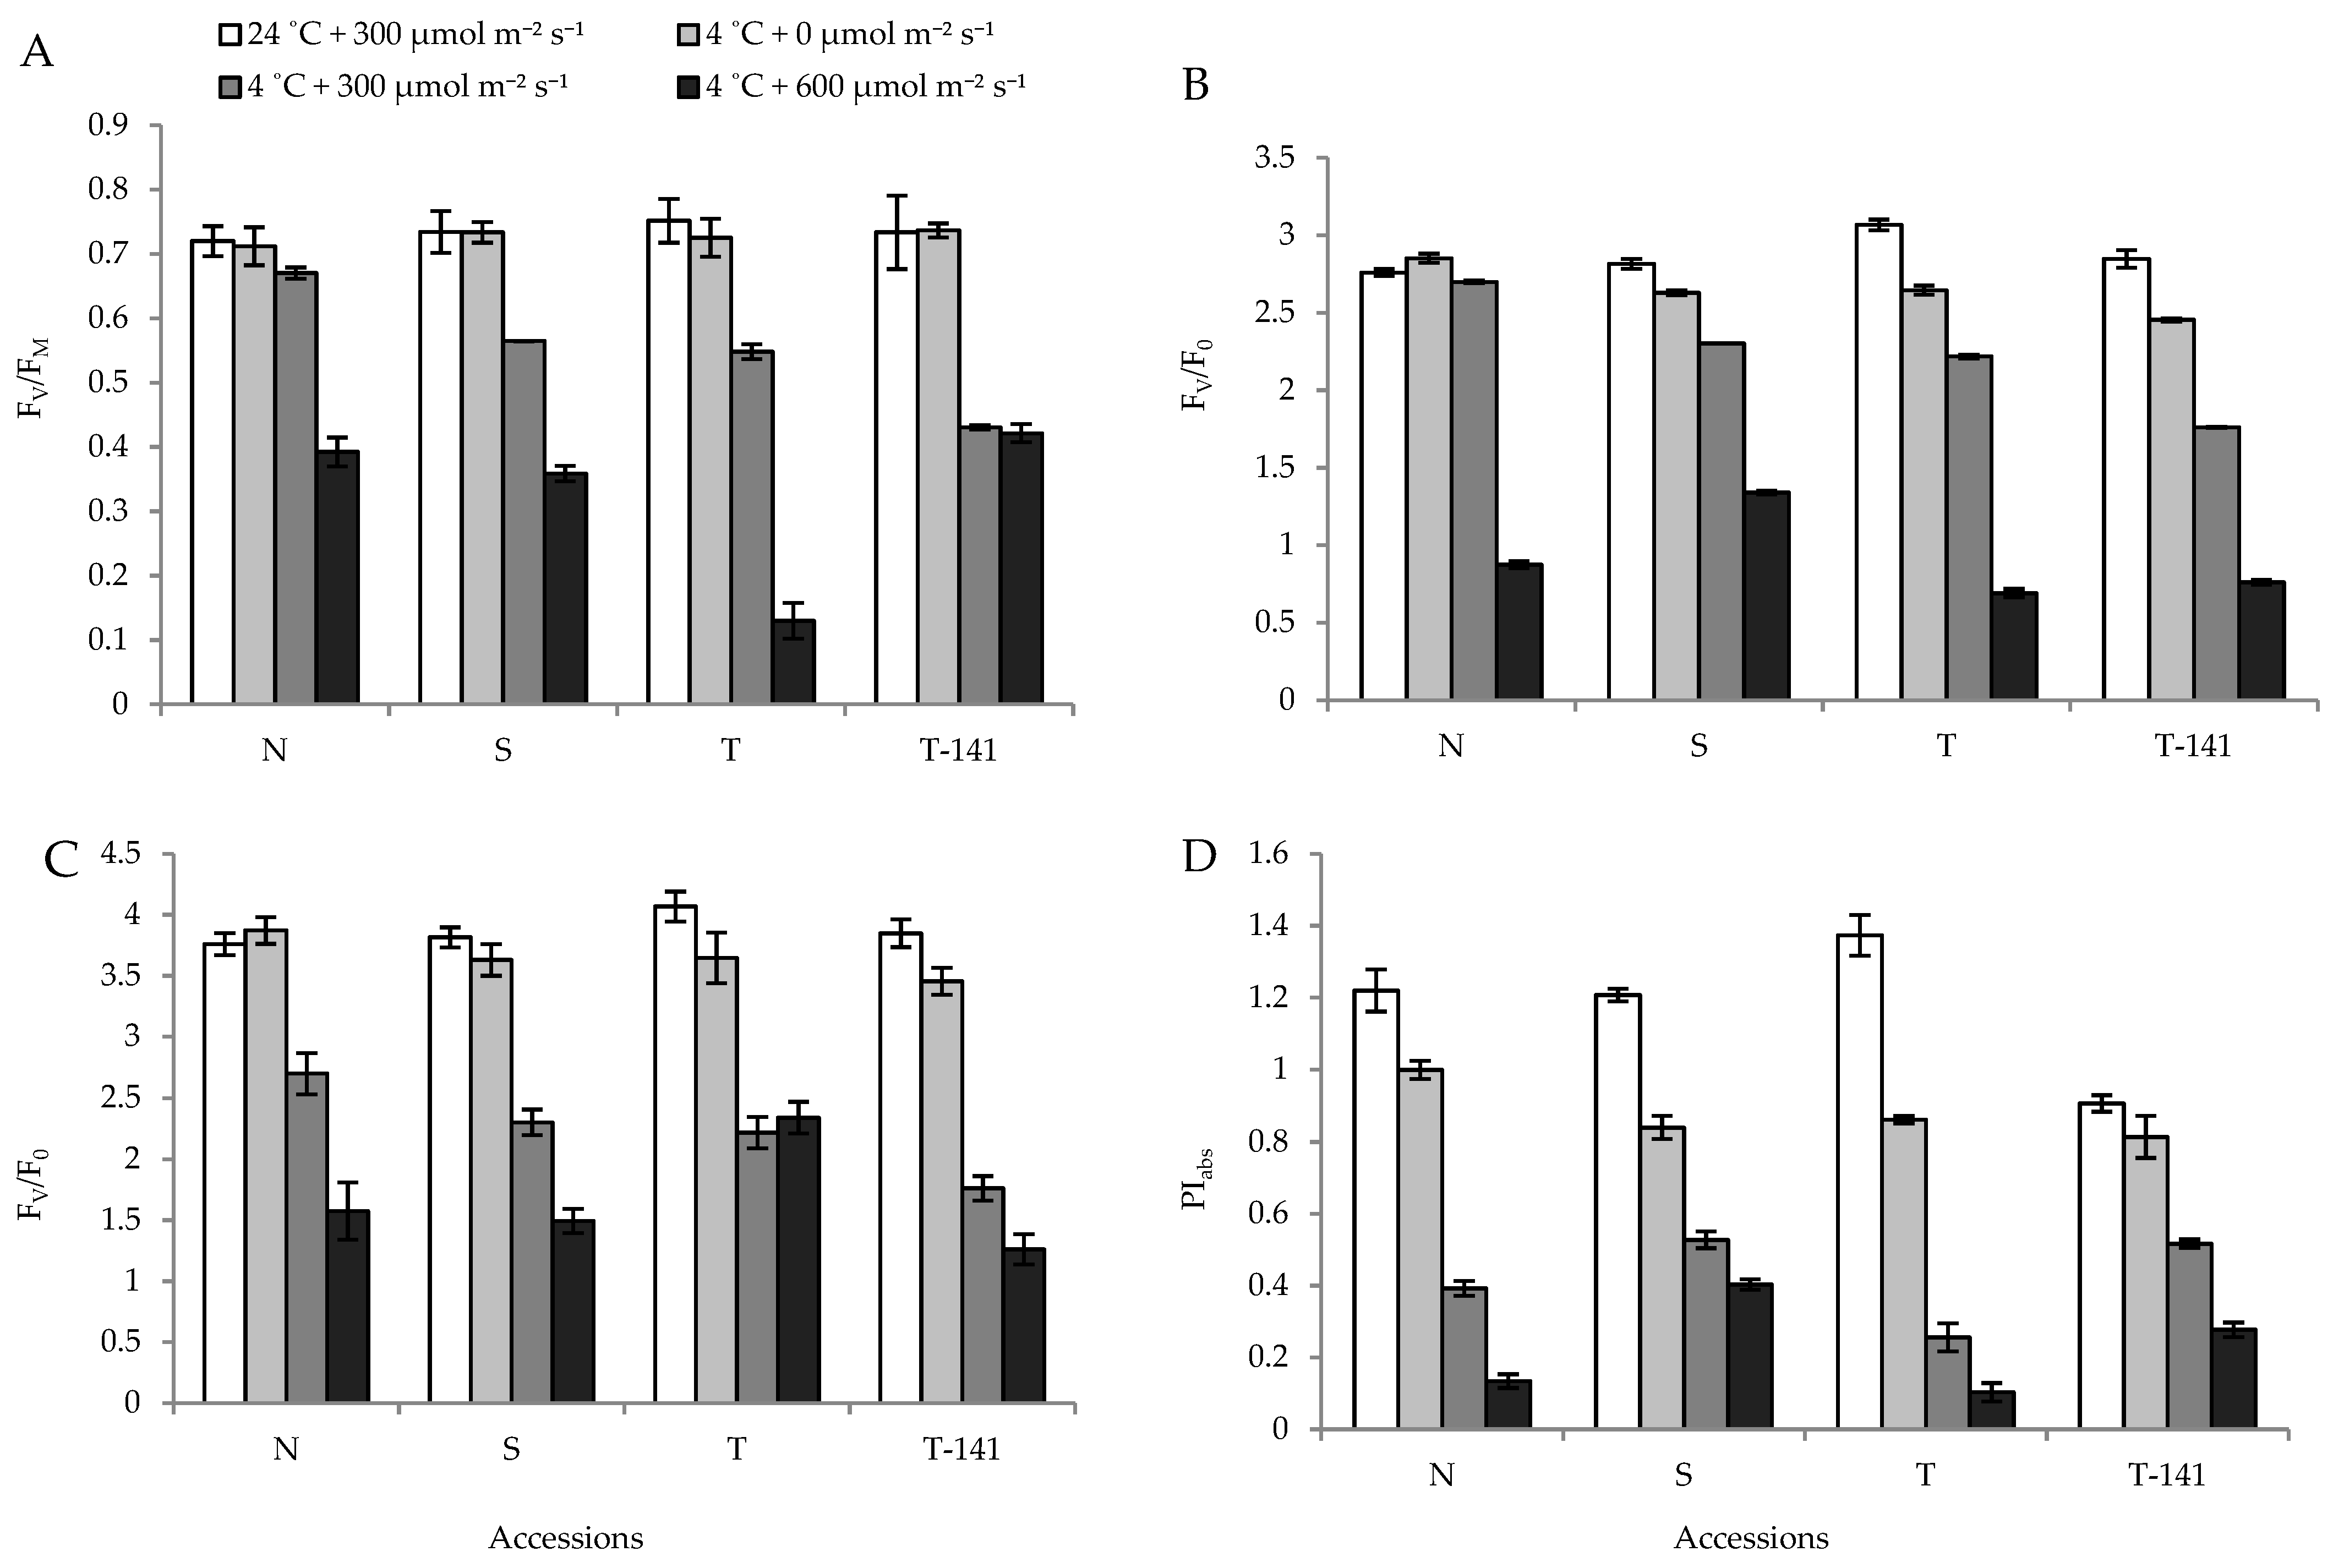
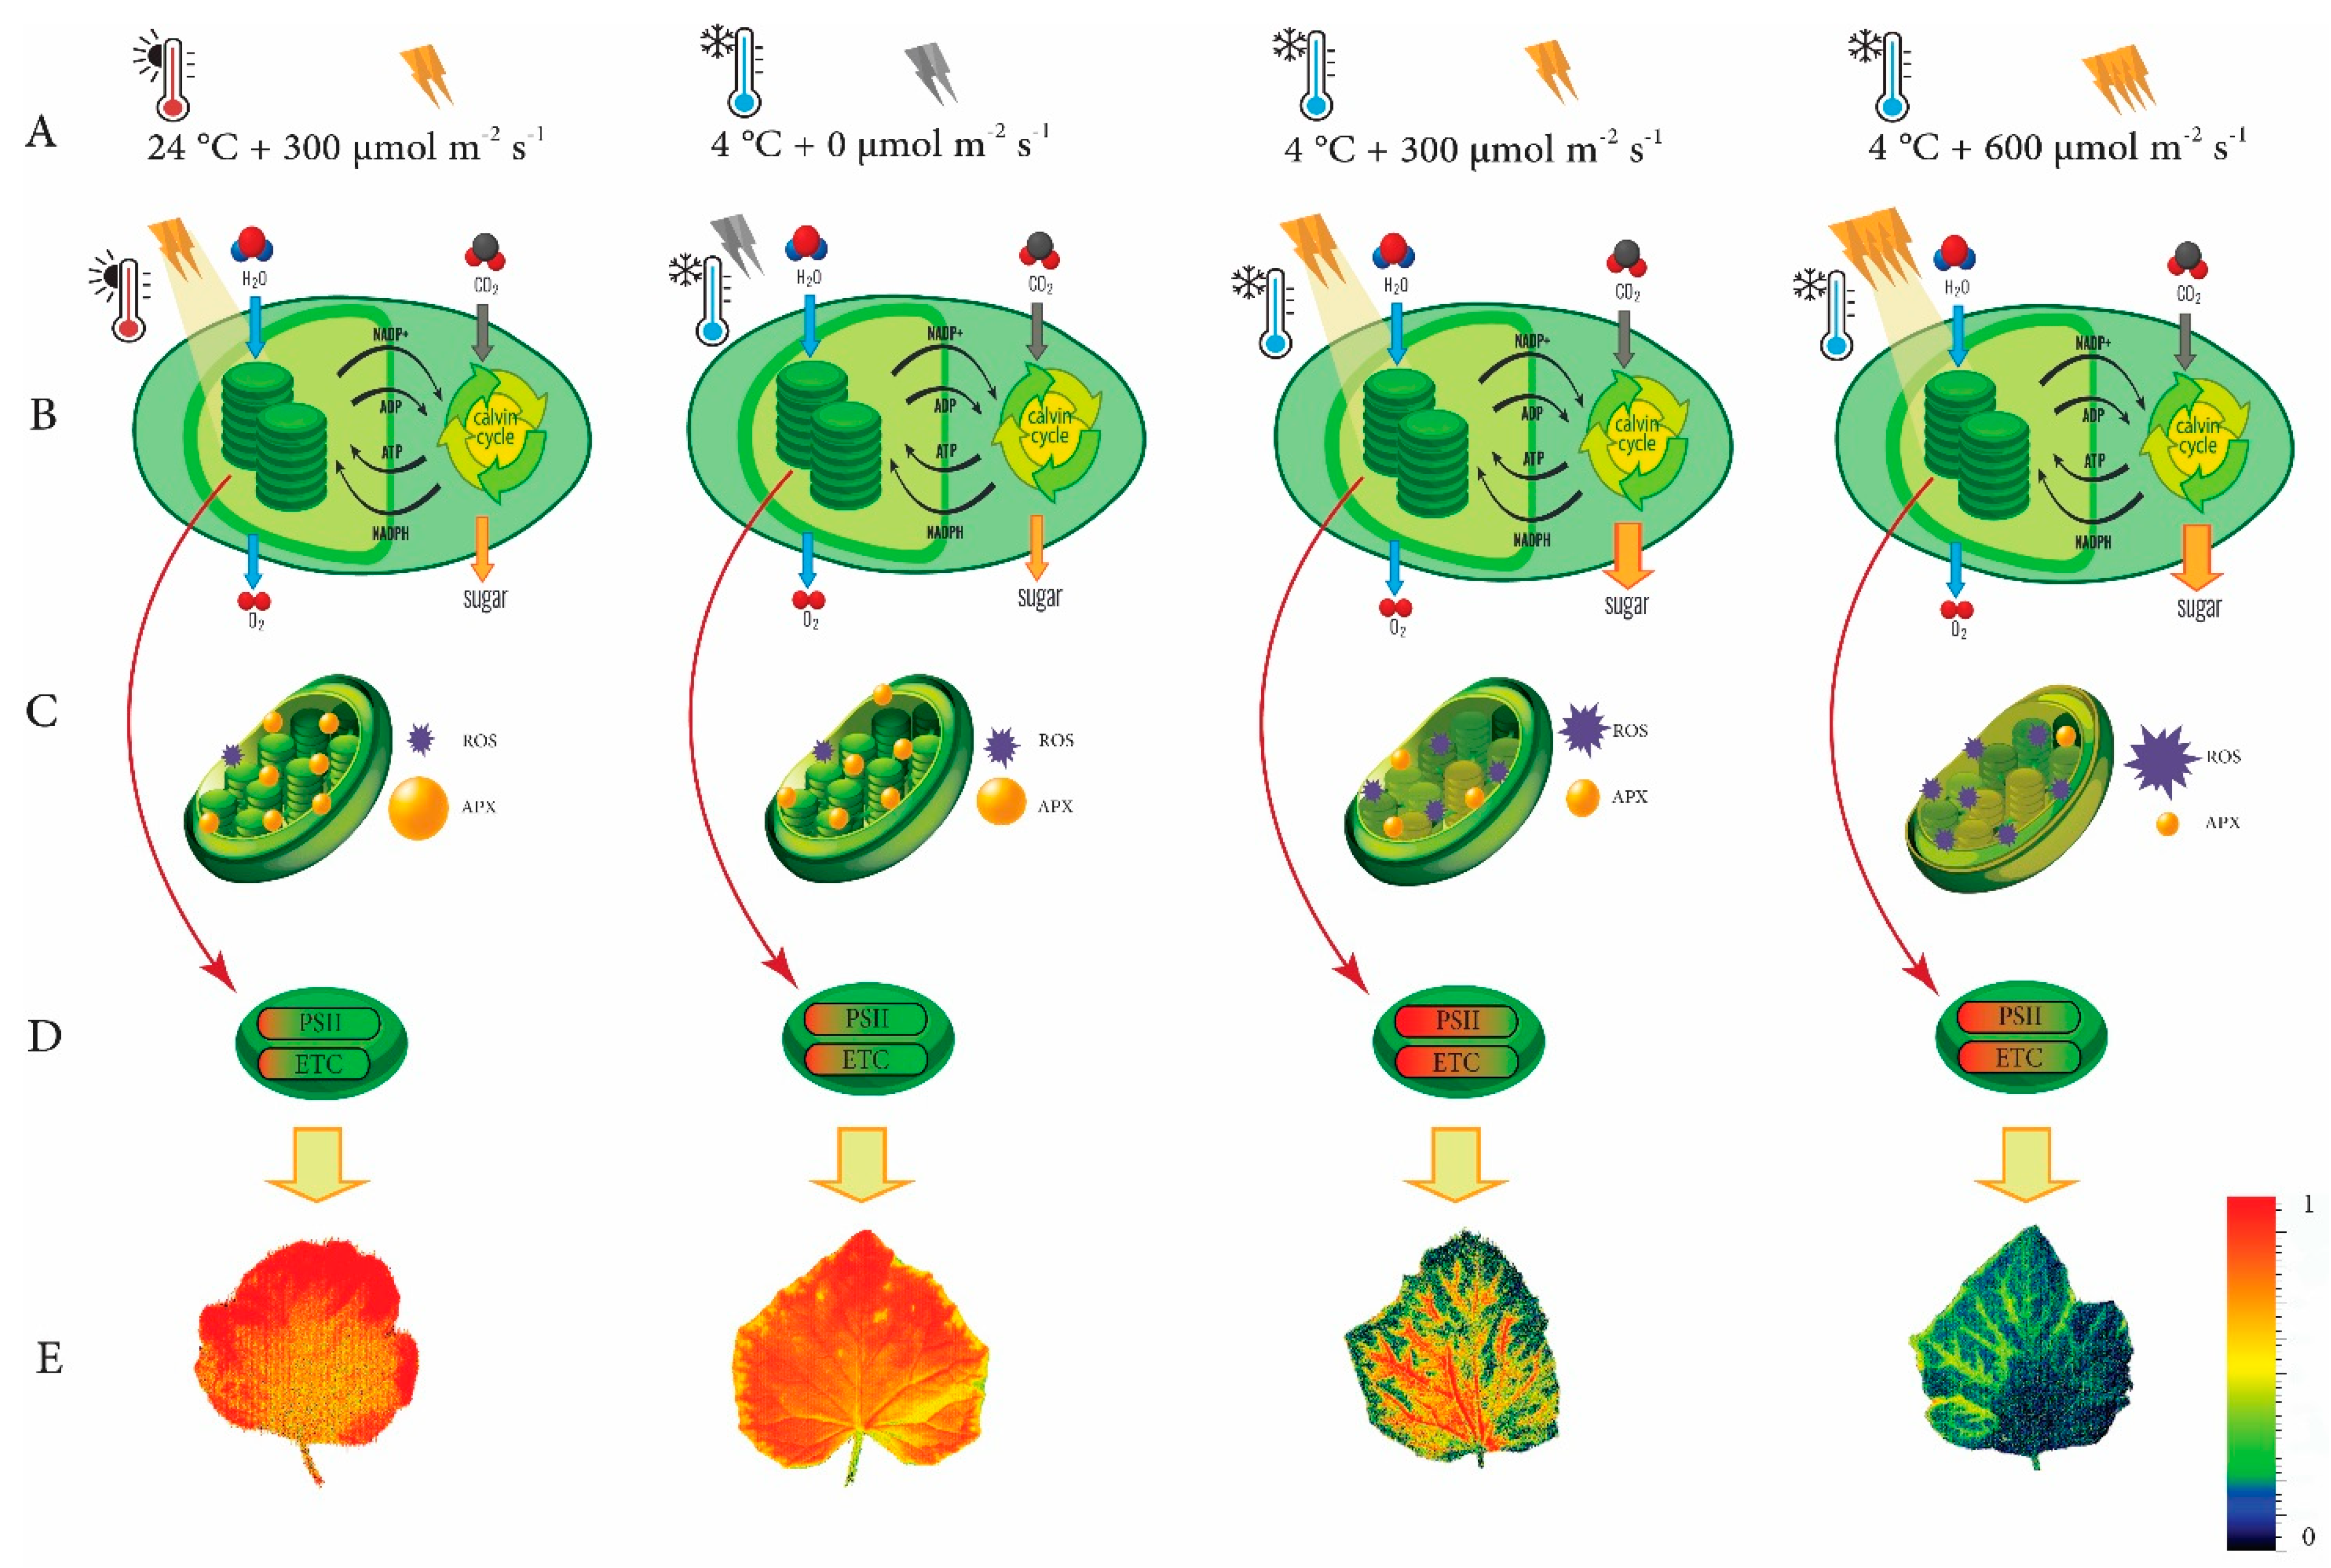
3.1. Biophysical Response of Cucumber Seedlings to Low Temperature Varies among Plants Exposed to Different PPFDs

The energy content of different PPFDs was absorbed by the chlorophyll pigments, which directly affected the ETC of the photosynthetic apparatus. Therefore, to assess the impacts of different PPFDs on the photosynthetic functionality, the OJIP test on the dark-adapted leaves of four cucumber accessions’ seedlings was analyzed. Specified energy fluxes per QA (the reduced PSII reaction center was significantly (p > 0.05) affected by PPFD and low temperature. The light absorbance flux by the PSII antenna per reaction center (ABS/RC; Figure 2A) decreased when plants were exposed to a low-temperature condition together with darkness. Yet, except for N accession, the value of ABS/RS increased in plants exposed to 300 μmol m−2 s−1 in a low-temperature condition when compared to the control (300 μmol m−2 s−1 and optimum temperature). Accordingly, exposing a plant to 600 μmol m−2 s−1 led to an average increase of 22.5% in ABS/RC (i.e., 20.4% for N, 22.5% for S, 22.9% for T, and 24.1% for T–141). The lowest ABS/RC, on the other hand, was noted for all accessions in dark conditions (Figure 2A). The trapped energy per reaction center (TR0/RC; Figure 2B) decreased by an increase in PPFD under low temperature. TR0/RC remained relatively unchanged under darkness and 300 μmol m−2 s−1, whereas an average of an 8% decrease was detected in accessions under low temperature and 600 μmol m−2 s−1 (9% for N, 8% for S, 9% for T, and 6% for T–141) compared to the control (300 μmol m−2 s−1 and normal temperature; Figure 2B).
The electron transport flux per reaction center (ET0/RC; Figure 2C) was reduced by exposure to low temperature in a PPFD-dependent manner. Plants exposed to low temperature showed a reduced ET0/RC under darkness and 300 μmol m−2 s−1, while the highest increase was noted under 600 μmol m−2 s−1. This meant their ET0/RC increased by an average of 8% (8% for N, 6% for S, 8% for T, and 8% for T–141) compared to the control (300 μmol m−2 s−1 and normal temperature; Figure 2C). The low temperature also increased the energy flux not intercepted by an RC, but dissipated in the form of heat (DI0/RC; Figure 2D). Thus, under low temperature, the value of DI0/RC remained relatively unchanged under darkness and increased in 300 μmol m−2 s−1. This increase was more profound under 600 μmol m−2 s−1 than those of the control (300 μmol m−2 s−1 and normal temperature). Under low temperature, the increase in DI0/RC markedly increased as PPFD increased. DI0/RC was increased by an average of 77.72% (75% for N, 67% for S, 83.4% for T, and 85.4% for T–141) in all accessions when exposed to low temperature and 600 μmol m−2 s−1 compared to the plants exposed to the dark conditions (Figure 2D).
The value for FV/FM decreased due to an increase in PPFD in all four accessions (Figure 3 and Figure 4A). However, in comparison to the control (300 μmol m−2 s−1 and normal temperature), FV/FM markedly decreased by an average of 55% in the four accessions of cucumber (54% for N, 51% for S, 82% for T, and 42% for T–141) when exposed to 600 μmol m−2 s−1 and low temperature (Figure 4A).
The maximum efficiency of the water diffusion reaction on the donor side of PSII (FV/F0) was reduced drastically by low temperature, and the reduction showed a PPFD-dependent manner (Figure 4A). For example, plants exposed to low temperature and 600 μmol m−2 s−1 portrayed an average of a 31% (31% for N, 24% for S, 43.4% for T, and 26% for T–141) reduction in FV/F0 in comparison with those under control conditions (300 μmol m−2 s−1 and normal temperature; Figure 4B).
The relative value of maximal and minimum chlorophyll fluorescence (FM/F0; Figure 4C), which portrays the structural damage to PSII [48], was profoundly affected by both low temperature and PPFD. The lowest value of FM/F0 was detected in those plants placed under low temperature and simultaneously exposed to 600 μmol m−2 s−1 (67% decrease), followed by those exposed to 300 μmol m−2 s−1 and darkness, respectively.
Performance index per absorbed light (PIabs) indicated the potential for reducing intersystem electron acceptors by photons absorbed via PSII [49]. The PIabs of cold-exposed cucumber accessions was considerably lower in seedlings exposed to 300 and 600 μmol m−2 s−1 than with the PIABS of control and dark-exposed seedlings (Figure 4D). The more drastic decrease in PIabs (on average 76% compared to control) was recorded under low temperature and 600 μmol m−2 s−1 (Figure 4D).

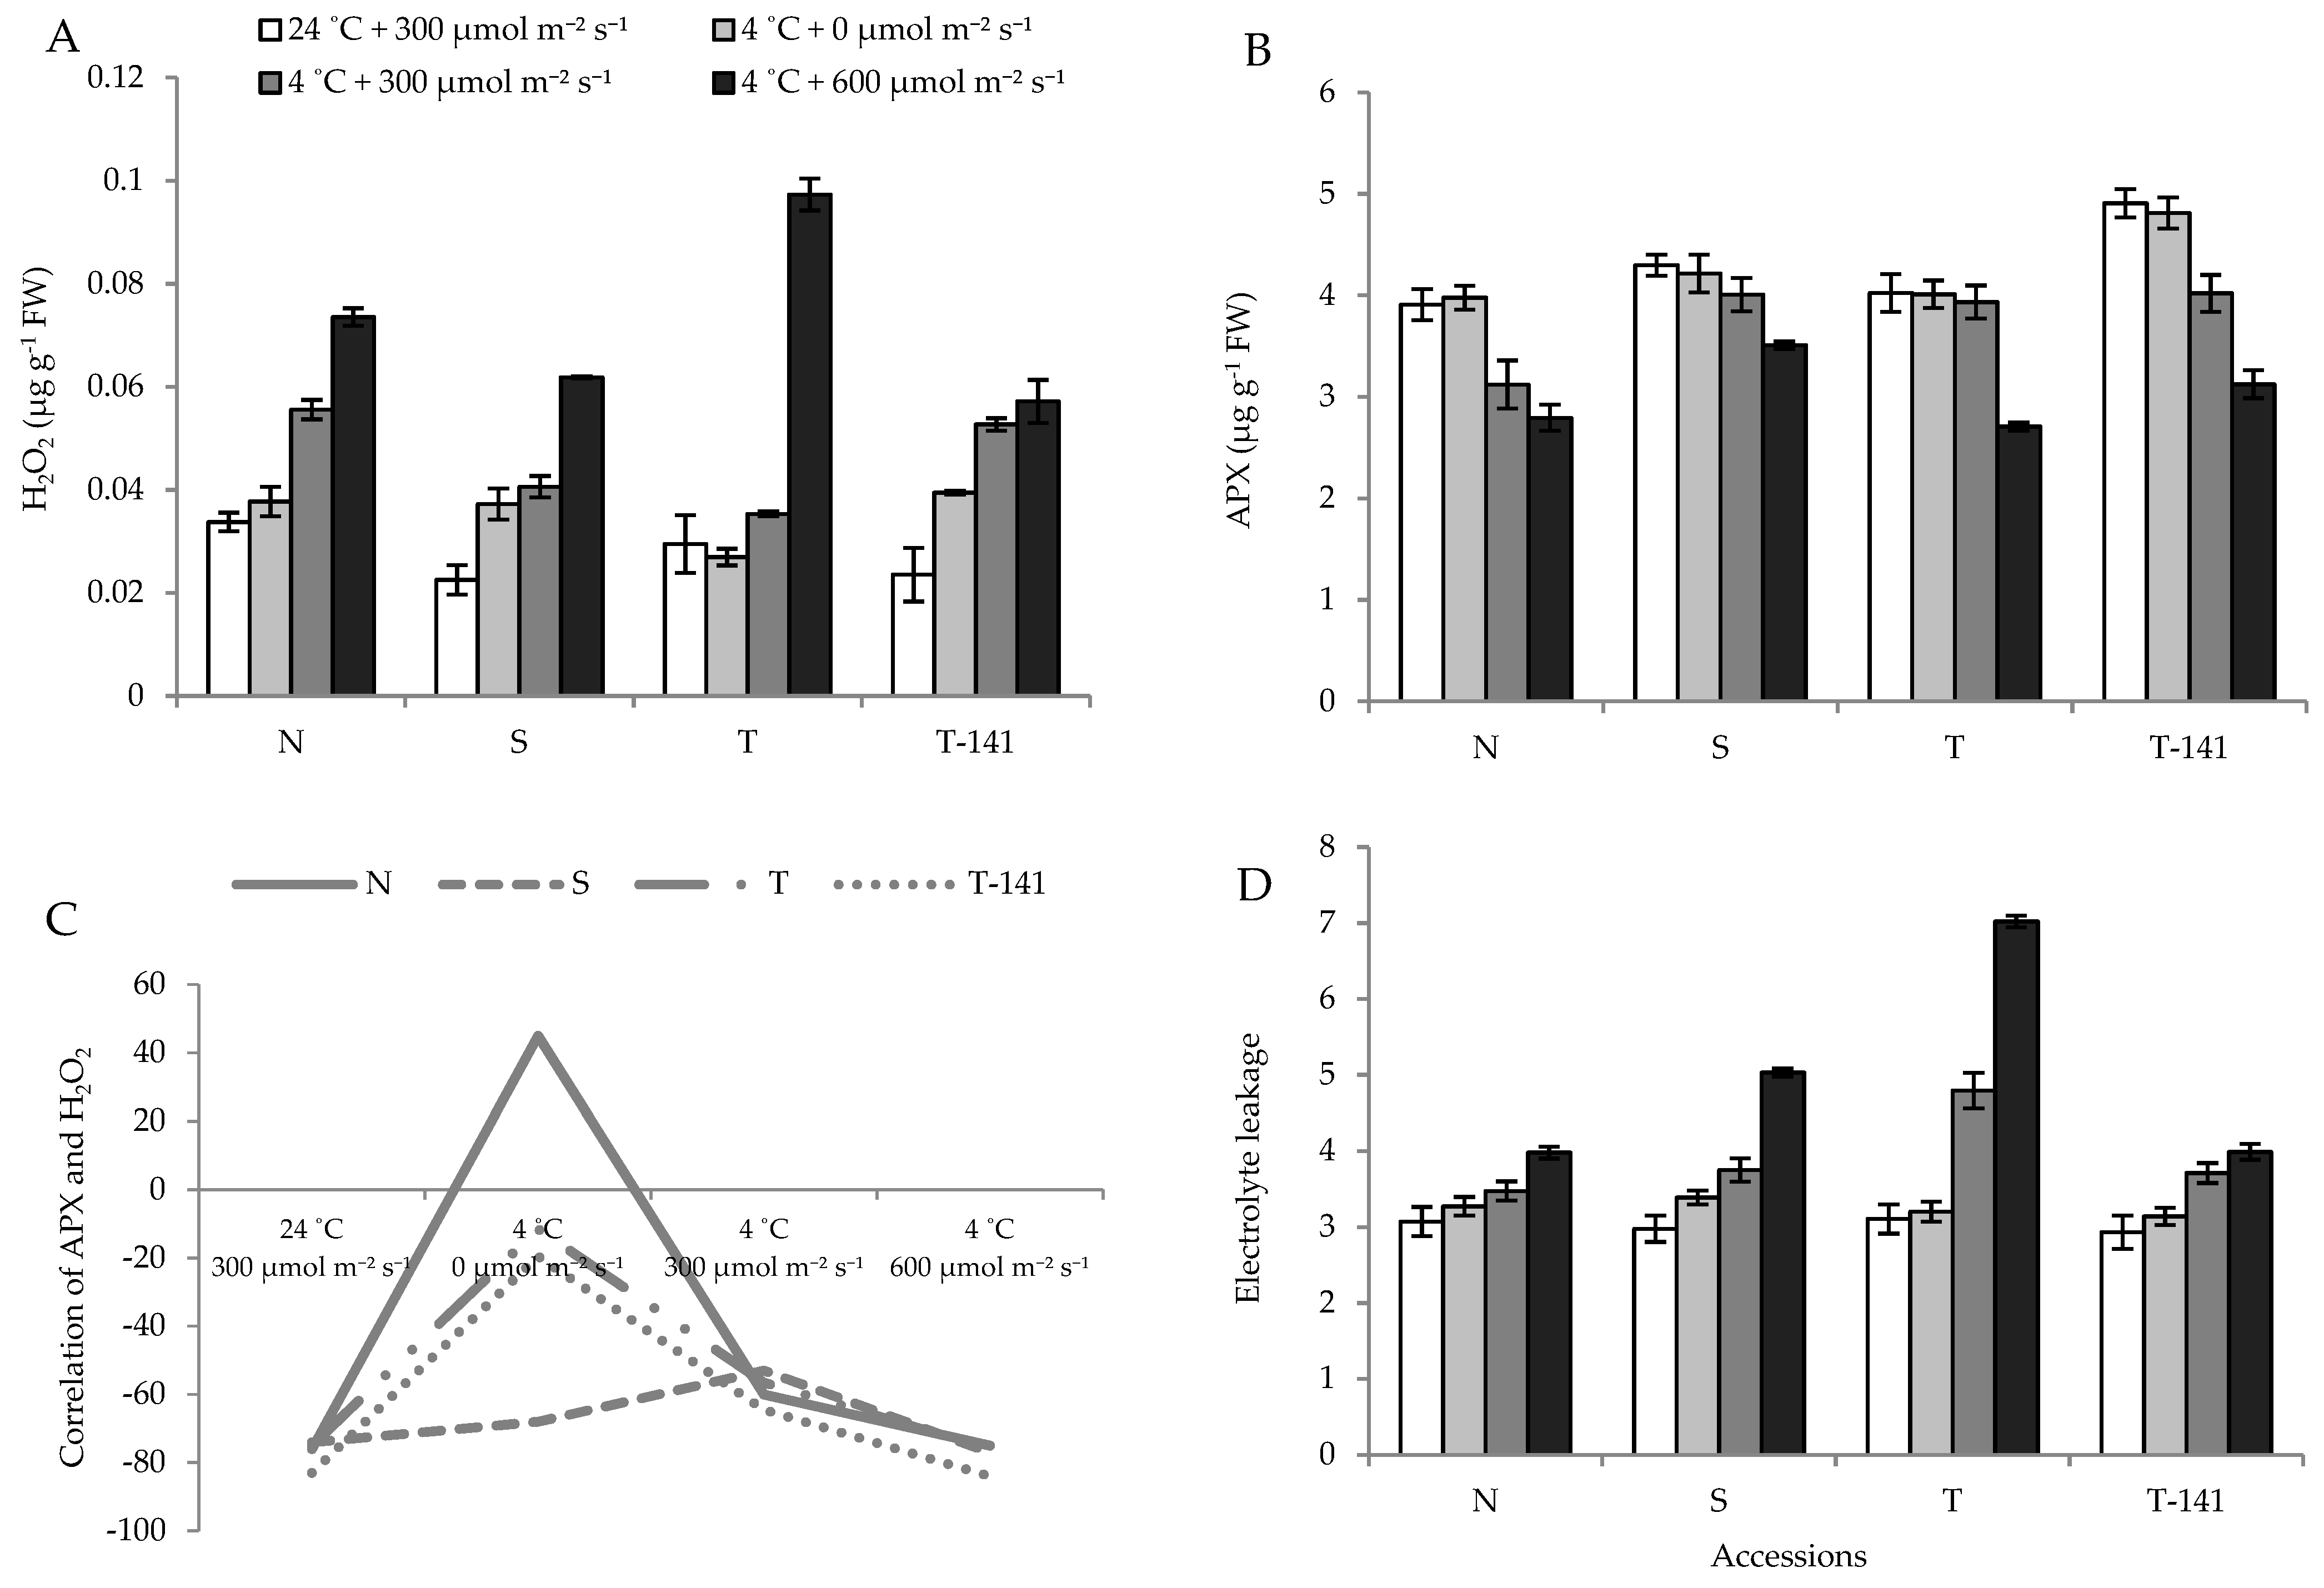
3.2. Biophysical Response of Cucumber Seedlings to Low Temperature Varies among Plants Exposed to Different PPFDs

The levels of H2O2 showed a stepwise increase by rising in PPFD under low temperature. The highest H2O2 level was recorded under 600 μmol m−2 s−1, by an average 2.5-fold increase in the four accessions of cucumber (2.1-fold for N, 2.7-fold for S, 3.3-fold for T, and 2.4-fold for T–141) compared to the control (Figure 5A).
Ascorbate peroxidase (APX) activity decreased when plants were exposed to low temperatures, yet it was negligible under dark and profound under 300 μmol m−2 s−1 and 600 μmol m−2 s−1 compared to the control. The most noticeable decrease in APX activity occurred when plants were exposed to low temperature under 600 μmol m−2 s−1, which showed an average decrease of 28% in the four successions of cucumber (28.1% for N, 18% for S, 32% for T, and 36% for T–141) compared to the control (Figure 5B).
A negative correlation was observed between H2O2 and APX with an average of 77% for those placed in the control environment. For plants placed in low-temperature treatments, the correlation was −13.5%, −58.5%, and −78% under darkness, 300 or 600 μmol m−2 s−1, respectively (Figure 5C). This negative correlation showed the removal of H2O2 through the high activity of APX as strongly detected in the control treatment, whereas the negative correlation between the APX activity and H2O2 content under low temperature and 600 μmol m−2 s−1 indicated H2O2 accumulation at the expense of the suppression of APX activity due to low-temperature injury.
The level of EL was affected by low temperature and PPFD. Regardless of PPFD, the value for EL in all treatments was higher under low temperature than control, though with a negligible increase under darkness. Under low temperature, EL was increased stepwise by an increase in PPFD. The highest EL obtained under 600 μmol m−2 s−1 showed an average increase of 65% in the four accessions of cucumber (29% for N, 68% for S, 125% for T, and 36% for T–141) compared to control (300 μmol m−2 s−1 and normal temperature; Figure 5D).

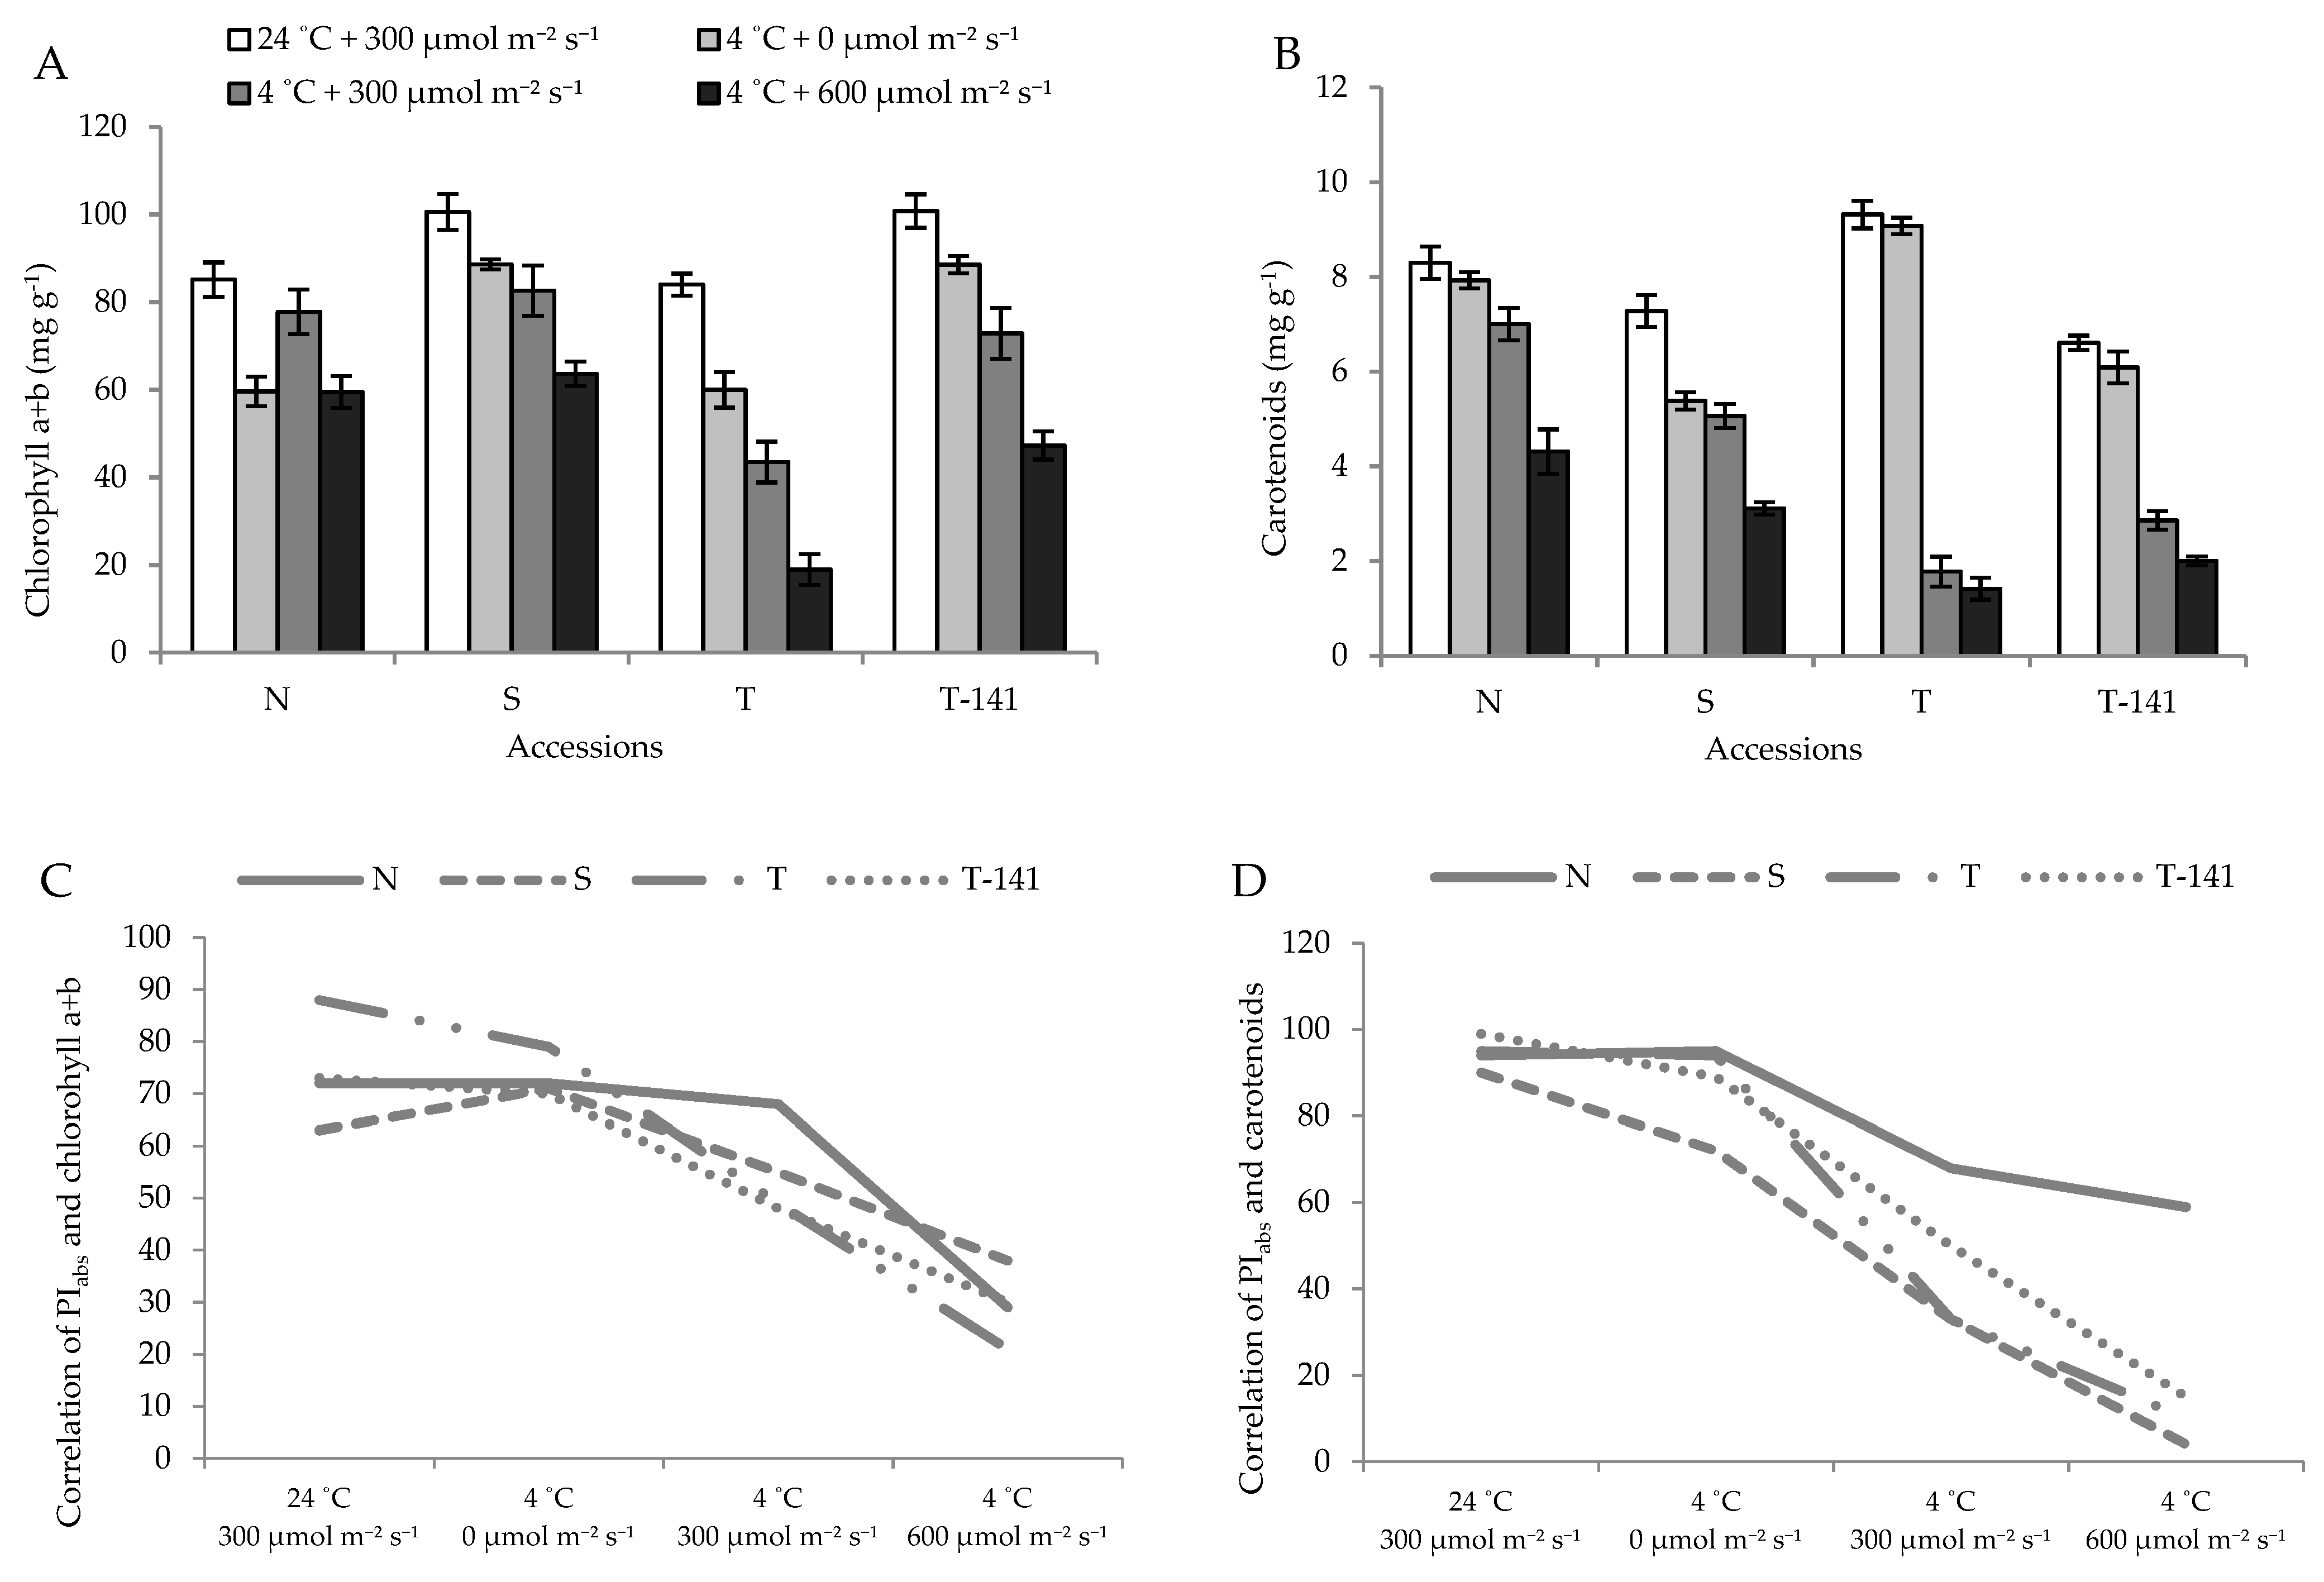
3.3. Low Temperature Decreased the Leaf Photosynthesis Pigment Contents in a PPFD-Dependent Manner

Cold stress can damage photosynthesis pigments in plants. In the present study, both low temperature and PPFD affected the chlorophyll (a + b) of cucumber accessions. Regardless of PPFD, the chlorophyll (a + b) content reduced when plants were exposed to low temperature, and the level of reduction was more drastic under 600 μmol m−2 s−1 compared to the dark, 300 μmol m−2 s−1, and the control. Furthermore, an average decrease of 49% (30% for N, 36% for S, 77% for T, and 53% for T–141) in the chlorophyll (a + b) content was observed under 600 μmol m−2 s−1 and low temperature compared to the control condition (Figure 6A).
The carotenoid was also affected by both PPFD and low temperature. An increased PPFD observed a stepwise decrease in the carotenoid content under low temperatures. Under low temperature and 600 μmol m−2 s−1, the decrease in carotenoid was more drastic than 300 μmol m−2 s−1, dark, and the control, showing an average decrease of 64% (48% for N, 57% for S, 84% for T, and 69% for T–141) in the carotenoid content compared to the control (Figure 6B). The correlation between chlorophyll (a + b) and carotenoid with PIabs was analyzed to better understand the association between photosynthesis pigments and efficiency. Therefore, both chlorophyll (a + b) and carotenoid were negatively correlated with PIabs, and the correlation was weakened by low temperature and PPFD. The correlation between PIabs and chlorophyll (a + b) reduced from an average of 74% (72% for N, 63% for S, 88% for T, and 73% for T–141) in the control to an average of 29% (29% for N, 38% for S, 21 for T%, and 30% for T–141) for plants exposed to 600 μmol m−2 s−1 under low temperature (Figure 6C). The correlation between carotenoid and PIabs showed a stepwise decrease by increased PPFD under low temperature compared to the control. The highest correlation between PIabs and carotenoid was observed in the control (94% for N, 90% for S, 95% for T, and 99% for T–141), and the lowest correlation was obtained in plants placed in low-temperature condition and 600 μmol m−2 s−1 (59% for N, 4% for S, 10% for T, and 15% for T–141) (Figure 6D).

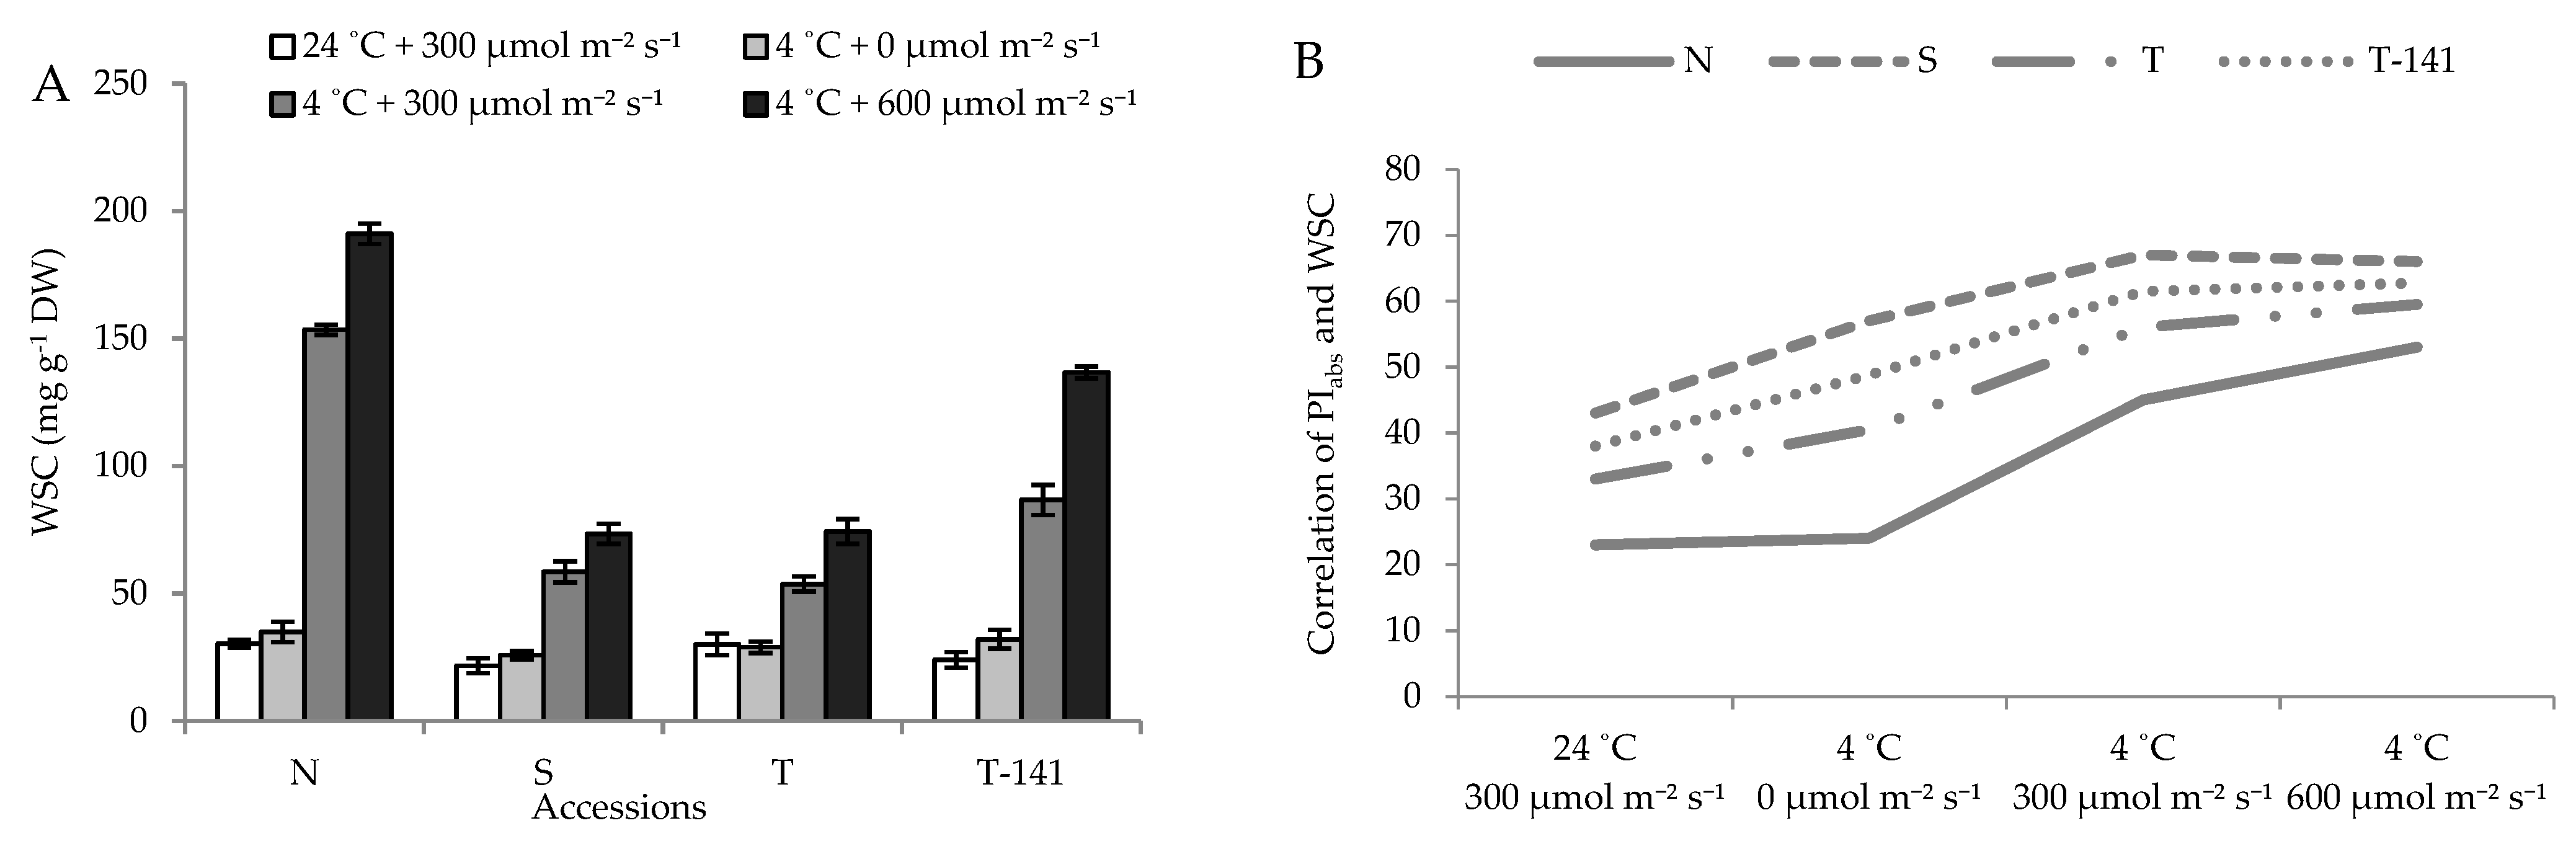
3.4. Water-Soluble Carbohydrate (WSC) Accumulates in Plants under Low Temperature

Both PPFD and low temperature affected WSC in the cucumber accessions. The effect of low temperature was negligible on the WSC of plants exposed to darkness, while the increase in PPFD led to a considerable increase in WSC. More accumulation of WSC was observed in seedlings placed under the low-temperature condition and 600 μmol m−2 s−1 than those placed under 300 μmol m−2 s−1 and the control, which showed an average 4.5-fold increase in the four accessions of cucumber (six-fold for N, three-fold for S, two-fold for T, and five-fold for T–141) (Figure 7A). By increasing PPFD under low temperature, a correlation between WSC and PIabs increased compared to the control (300 μmol m−2 s−1 and normal temperature). In the control condition, WSC and PIabs showed an average of 34% correlation (23% for N, 43% for S, 33% for T, and 38% for T–141), while under low temperature and 600 μmol m−2 s−1, the correlation increased to an average of 60% in the four accessions of cucumber (53% for N, 66% for S, 59% for T and 62% for T–141) (Figure 7B).

4. Discussion

The physiological impacts of cold stress on plants depend on the acclimatization, treatment, plant developmental stage, and PPFD [50]. Light intensity is one of the most important factors affecting the magnitude of perceived stress by plants. Light influences both molecular and whole-plant responses to imposed stresses [50]. In the present study, seedlings of four cucumber accessions were exposed to either low temperature (4 °C) under simultaneous different light intensities (0, 300, 600 μmol m−2 s−1) or optimum temperature (24 °C) under 300 μmol m−2 s−1 (Figure 8A). The photosynthetic performance of the cucumber plants decreased by exposure to low temperature and simultaneous higher PPFDs (Figure 2, Figure 3 and Figure 4 and Figure 8D,E). Accordingly, FV/FM decreased by co-exposure to low temperature and 600 μmol m−2 s−1 PPFD. However, the value of FV/FM in both darkness-exposed and control treatments was close to 0.8. In accordance, it has been shown that low temperature and light stress reduced the FV/FM and quantum yield of PSII in Zea maize and Pinus leucodermis [51,52]. A decrease in FV/FM due to low-temperature stress has also been reported in nine Stevia rebaudiana cultivars [53].
These results indicate that low temperature-light stress caused photoinhibition, notably when PPFD increased from 0 to 600 μmol m−2 s−1. In line with the present study’s findings, the occurrence of photoinhibition resulting from the higher rate of photodamage than repair on PSII under low temperature-light stress has been reported in a study on three Paphiopedilum species [54]. Low-temperature consequences in the depression of chemical reactions include the inhibition of the Calvin-Benson Cycle, thereby blocking the photosynthetic electron transport passway from PSII to NADP+ [55]. The results obtained from this study showed that the maximum efficiency of the water-diffusion reaction on the donor side of PSII dropped drastically under 600 μmol m−2 s−1, indicated by the lower FV/F0 when compared to that of other treatments. The maximum FV/F0 was related to dark-exposed and control seedlings, and its minimum value was observed in seedlings under low temperature and 600 μmol m−2 s−1 (Figure 4B). This is common in stress conditions, specifically light stress [56,57,58,59]. The oxygen-evolving complex (OEC) is the most sensitive link in ETC and is responsible for the transfer of electrons from water to ETC [17,34]. Therefore, our results suggested that the disruption of OEC associated with structural damage to PSII [48] was exacerbated by an increase in PPFD under low temperature, which was in line with the results of Fracheboud et al. [52].
In the current study, the reduction in ET0/RC was associated with higher PPFDs, while only a slight reduction was observed in ET0/RC of darkness-exposed and control seedlings. It should be noted that ET0/RC depends on both the energy flux produced through the transfer of a high-energy electron from QA to the ETC acceptors [30] and the plant’s demand for the photosynthetic products. This is defined by plants’ physiological conditions, which are controlled by environmental factors, in particular, abiotic stresses. Therefore, any disturbance in light reactions in photosynthesis causes a reduction in the rate of ET0/RC [34].
The data showed that TR0/RC decreased under low temperature synergistically with an increase in PPFD. When TR0/RC decreases, not only does the oxidation of QA to QA slow down to cessation [60], but it also causes a reduction in the rate of ET0/RC. Indeed, when TR0 is diminished, ETC is fed by the lower level of absorbed energy [60]. High QA over-reduction due to the inhibition of ET0 to the downstream electron receptors located in ETC results in a disturbance in ETC [61] (Figure 8D).
ABS/RC increased with the rise in light intensity under low temperatures. Presumably, with the increase in PPFD, the absorption flux cannot proceed through electron acceptors in RC due to the reduced status of QA. As a result, the energy flux dissipates as heat [60]. In accordance, our results revealed that dissipated energy in the form of DI0/RC increased with the increase in PPFD. This showed the route where absorbed light energy was directed under light stress conditions. Under stress conditions, the energy flux that was not intercepted by RC consequences in the reduced electron transport through ETC, and, as a result, the energy dissipates in the form of heat or fluorescence [34].
An increase in DI0/RC is another indicator of stress [3,28,62]. The current research obtained the maximum DI0/RC from plants exposed to 600 and 300 μmol m−2 s−1, respectively. In contrast, plants under control conditions showed the lowest DI0/RC. Results obtained from this research allowed us to claim that, in normal conditions, the share of energy that participates in photochemical work outweighs that of energy dissipated in other routes indicated by lower DI0/RC in control plants compared to that of plants under other treatments. The low temperature shifted the direction of energy to the route of dissipation. Moreover, an increase in light intensity under low temperature, as a consequence, increased the share of energy passed through the route of dissipation instead of photochemical activity.
In this research, the PIabs of leaves in all four accessions decreased under low-temperature stress (Figure 4D). They declined the following exposure to 300 and 600 μmol m−2 s−1 when compared to their value in darkness-exposed and control seedlings. A very slight reduction in PIabs was observed in low temperature- and darkness-exposed seedlings compared to PIabs of control seedlings, which confirmed the previous reports regarding the significant effect of light stress on PIabs. A reduction in PIabs underlies an increase in absorbed (ABS/RC) and dissipated (DI0/RC) energy together with the reduction in ET0/RC [28]. PIabs is the most applicable performance index (PI) [30] that states the potential for the reduction in intersystem electron acceptors by photons absorbed via PSII; more specifically, the energy flux at the onset of the absorption process up to the reduction in plastoquinone (PQ). PI is also an index for the overall vitality of PSII and is known as the most sensitive indicator in this regard [34,63].
In this study, the chlorophyll a, chlorophyll b, and carotenoid contents were measured to characterize the effect of light intensity and low-temperature stress on cucumber accessions. Chlorophylls are the most abundant pigments in plants, capturing light energy during photosynthesis. When plants face biotic or abiotic stresses, an impaired chlorophyll biosynthesis or accelerated chlorophyll degradation causes a reduction in the chlorophyll content [64]. Therefore, the investigation of photosynthetic pigments provides more evidence for the photosynthesis down-regulation under low temperatures. Both chlorophylls and carotenoids decreased in seedlings exposed to low temperatures. The highest decline was observed in plants exposed to 600 μmol m−2 s−1 compared with those exposed to 300 μmol m−2 s−1, darkness, and control. Such effects of low-temperature stress on photosynthetic pigments have also been observed in rice cultivars [65]. The correlation between PIabs with other parameters has been used to understand the way different stressors affect plants’ photosynthesis [3]. In our study, a strong correlation was detected between chlorophylls and carotenoids with PIabs in control, while the correlation was weakened by an increase in PPFD under low temperatures (Figure 6C,D). This suggests that not only chlorophylls and carotenoids degraded under low temperature, but existing chlorophylls could not efficiently contribute to improving the photosynthetic performance of the cucumber accessions under low temperature.
In our study, the H2O2 content of leaves was detected following plant exposure to low-temperature stress. The production of ROS in response to various environmental stresses has been considered a hallmark of stress [66]. The impairment of electron flow through ETC induces ROS production that further scavenges through enzymatic and non-enzymatic mechanisms [67,68]. ROS production occurs when abiotic stresses inhibit the PSII complex from being coupled with the electron transport, leading to the complete reduction in the PQ pool and blockage of the electron flow [67]. In this circumstance, H2O2 is produced when an electron from QA is transported to an O2 molecule, which decreases the reduction in the PQ pool [69]. In this study, the increase in H2O2 was more drastic when low-temperature stress was concomitant with 600 μmol m−2 s−1, which was in agreement with the results of previous studies that have shown the H2O2 content increase in watermelon seedlings [70] and rice [71] in response to low-temperature stress.
The activity of APX reduced after exposing plants to low temperature, surging the level of this enzyme by increasing the level of light intensity from 0 to 600 μmol m−2 s−1. APX is an antioxidant enzyme that plays an essential role in removing ROS in plants via the cleavage of H2O2 into H2O and O2 [72,73]. When APX activity decreases, the accumulation of H2O2 occurs and adversely affects electron transport in the stressed plants (Figure 8C). In agreement with the results of this study, a reduction in APX activity in response to low-temperature stress in rice [74] and cassava [75] as well as under light stress in rose [28] has been previously reported.
A negative correlation was observed between H2O2 and APX, the strength of which increased in a PPFD-dependent manner under low temperature (Figure 5C). The correlation was observed in both control plants and plants exposed to simultaneous low temperature and 600 μmol m−2 s−1. However, the reasoning for a strong negative correlation differs. Considering the level of H2O2 and APX and the correlation between them in different treatments demonstrated that the strong correlation between those traits in control plants raised from the high activity of APX coupled with the minute content of H2O2. However, the strong correlation between APX and H2O2 under low-temperature parallel with 600 μmol m−2 s−1 suggested the increase in H2O2 at the expense of suppressed APX activity due to low-temperature injury.
The results of the present study revealed that low-temperature impacts on plants were trivial under darkness and profound under 600 μmol m−2 s−1. The production of ROS has a close relationship with the impairment of electron transport [67], and the fact that light is the driving force for electron production and transport allowed us to conclude that light plays a pivotal role in the occurrence and the magnitude of low-temperature stress.
In the present study, we investigated the effect of light intensity and low-temperature stress by detecting EL that reflected damage to the cell membrane. EL has been introduced as a direct stress marker for the indication of cell membrane damage from low-temperature stress [76]. In this study, the EL increased following the exposure of plants to low temperature. The increase in PPFD led to a higher EL level than that of plants exposed to control and darkness, while in the absence of light, only negligible differences were observed in EL of plants compared to control. Therefore, it can be proposed that an increase in PPFD amplifies the cellular damage caused by low temperature. The low temperature-induced EL has been reported in previous studies on tomatoes [77], cucumber [78], and wheat [79]. However, the involvement of light in low-temperature damage has not been addressed yet.
Despite the decline in PIabs and FV/FM, WSC increased under low-temperature stress. The increase in WSC under low-temperature stress has been explained as a defense mechanism to prevent cellular freezing [80]. In line with our findings, the increase in WSC in response to low temperature has been reported in different plant species [53,81,82]. Moreover, when light reactions of photosynthesis are impaired, feedback inhibition signaling prevents photosynthesis. It inhibits the foliar transport of carbohydrates [83], which was highlighted by an increase in correlation of PIabs and WSC by the rise in PPFD under low temperatures.
Comparing the cultivars regarding their response to cold-light stress discloses differences in their magnitude of response to cold-light stress. Among the four cultivars investigated in this research, the cultivar N was associated with the highest FV/FM, carotenoid, and WSC while displaying the lowest DI0/RC, APX, H2O2, and EL, which features the resilience of plants to abiotic stresses. Since the cultivar N is a commercial hybrid, the evolvement of the stress tolerance mechanisms was expected. Accordingly, the result of our study unraveled the underlying mechanism by which this cultivar extinguished the adverse effects of cold stress. The same mechanisms were shown to be adapted by the tolerant cultivar of Arabidopsis [84], tomato [85], grape [86], and rice [71] which were attributed to reduced levels of photoinhibition and oxidative damage compared with cold-sensitive genotypes [71]. Moreover, it was demonstrated that priming cucumber for cold stress has given rise to reduced photoinhibition and boosted antioxidant activities [87]. On the other hand, the cultivar T, which is a domesticated cultivar, originated from the Tabriz province of Iran, has shown a susceptible photosynthetic performance and lower level of antioxidant activity since it was attributed with the lowest FV/FM, carotenoids, and WSC, while showing the highest DI0/RC, H2O2, and EL compared to that of other cultivars.

5. Conclusions

In the present study, the analysis of plant biophysical responses through chlorophyll a fluorescence imaging and OJIP transient was used as a tool to characterize and evaluate the response of four low temperature-exposed cucumber accessions to different light intensities. OJIP parameters were altered in response to low temperature-light stress in an accession- and PPFD-specific manner, in a way that TR0/RC, ET0/RC, and the downstream signals were retarded. In addition, the share of energy dissipation outweighed that of trapped energy to be utilized for chemical work. All of the observed alternations in OJIP parameters were more pronounced when seedlings were exposed to low temperature-light stress rather than low-temperature stress alone. Moreover, besides photosynthesis pigment degradation, the activity of antioxidant enzymes such as APX was suppressed in a PPFD-dependent manner under low temperature, which led to an increase in H2O2 and the occurrence of photoinhibition. The resulting photoinhibition caused a feedback inhibition for the Calvin cycle, further resulting in WSC accumulation. Therefore, low temperatures injure plants by adversely affecting the photosynthesis machinery, and the magnitude of low-temperature stress damage closely depends on PPFD.

Author Contributions

Conceptualization, S.A., S.A. (Shiva Azizinia), and J.A.K.; methodology, S.A. and S.A. (Shiva Azizinia); investigation, T.A.; software, T.A., A.S. and M.M.-N.; validation, S.A. and S.A. (Shiva Azizinia); formal analysis, T.A. and A.S.; resources, S.A.; data curation, S.A. and A.S.; writing—original draft preparation, A.S.; writing—review and editing, S.A., N.S.G., and M.M.-N.; visualization, A.S. and M.M.-N.; supervision, S.A.; project administration, S.A.; funding acquisition, S.A and N.S.G. All authors have read and agreed to the published version of the manuscript.

Funding

We are grateful for the financial support provided by the University of Tehran.

Institutional Review Board Statement

Not applicable.

Informed Consent Statement

Not applicable.

Data Availability Statement

The datasets generated during and/or analyzed during the current study are available from the corresponding author.

Acknowledgments

We thank the laboratory staff at the Photosynthesis Laboratory for their contributions, continued diligence, and dedication to their craft. The valuable comments of the editor and two anonymous reviewers are also acknowledged.

Conflicts of Interest

The authors declare no conflict of interest.

References

  1. Allen, D.J.; Ort, D.R. Impacts of chilling temperatures on photosynthesis in warm-climate plants. Trends Plant Sci. 2001, 6, 36–42. [Google Scholar] [CrossRef]
  2. Mashayekhi, K.; Jafari, S.; Shomali, A.; Mousavizadeh, S.J. Applying calcium carbide solution affect sex expression and increases yield of monoicous cucumber. J. Plant Physiol. Breed 2017, 7, 99–104. [Google Scholar]
  3. Shomali, A.; Aliniaeifard, S.; Didaran, F.; Lotfi, M.; Mohammadian, M.; Seif, M.; Strobel, W.R.; Sierka, E.; Kalaji, H.M. Synergistic effects of melatonin and Gamma-Aminobutyric Acid on protection of photosynthesis system in response to multiple abiotic stressors. Cells 2021, 10, 1631. [Google Scholar] [CrossRef]
  4. Shomali, A.; Aliniaeifard, S. Overview of signal transduction in plants under salt and drought stresses. In Salt and Drought Stress Tolerance in Plants; Springer: Berlin/Heidelberg, Germany, 2020; pp. 231–258. [Google Scholar]
  5. Aliniaeifard, S.; Shomali, A.; Seifikalhor, M.; Lastochkina, O. Calcium signaling in plants under drought. In Salt and Drought Stress Tolerance in Plants; Springer: Berlin/Heidelberg, Germany, 2020; pp. 259–298. [Google Scholar]
  6. Ibáñez, H.; Ballester, A.; Muñoz, R.; José Quiles, M. Chlororespiration and tolerance to drought, heat and high illumination. J. Plant Physiol. 2010, 167, 732–738. [Google Scholar] [CrossRef] [PubMed]
  7. Seif, M.; Aliniaeifard, S.; Arab, M.; Mehrjerdi, M.Z.; Shomali, A.; Fanourakis, D.; Li, T.; Woltering, E. Monochromatic red light during plant growth decreases the size and improves the functionality of stomata in chrysanthemum. Funct. Plant Biol. 2021, 48, 515–528. [Google Scholar] [CrossRef] [PubMed]
  8. Hosseinzadeh, M.; Aliniaeifard, S.; Shomali, A.; Didaran, F. Interaction of light intensity and CO2 concentration alters biomass partitioning in Chrysanthemum. J. Hortic. Res. 2021, 29. [Google Scholar] [CrossRef]
  9. Kozai, T. Why LED lighting for urban agriculture? In LED Lighting for Urban Agriculture; Springer: Singapore, 2016; pp. 3–18. ISBN 9789811018480. [Google Scholar]
  10. Gu, J.; Zhou, Z.; Li, Z.; Chen, Y.; Wang, Z.; Zhang, H.; Yang, J. Photosynthetic properties and potentials for improvement of photosynthesis in pale green leaf rice under high light conditions. Front. Plant Sci. 2017, 8, 1082. [Google Scholar] [CrossRef] [PubMed] [Green Version]
  11. Huner, N.P.A.; Öquist, G.; Hurry, V.M.; Krol, M.; Falk, S.; Griffith, M. Photosynthesis, photoinhibition and low temperature acclimation in cold tolerant plants. Photosynth. Res. 1993, 37, 19–39. [Google Scholar] [CrossRef] [PubMed]
  12. Vranova, E.; Inzé, D.; Van Breusegem, F. Signal transduction during oxidative stress. J. Exp. Bot. 2002, 53, 1227–1236. [Google Scholar] [CrossRef] [Green Version]
  13. Demarsy, E.; Goldschmidt-Clermont, M.; Ulm, R. Coping with ‘dark sides of the sun’through photoreceptor signaling. Trends Plant Sci. 2018, 23, 260–271. [Google Scholar] [CrossRef]
  14. Janda, T.; Kissimon, J.; Szigeti, Z.; Veisz, O.; Páldi, E. Characterization of cold hardening in wheat using fluorescence induction parameters. J. Plant Physiol. 1994, 143, 385–388. [Google Scholar] [CrossRef]
  15. Gray, G.R.; Chauvin, L.-P.; Sarhan, F.; Huner, N.P.A. Cold acclimation and freezing tolerance (a complex interaction of light and temperature). Plant Physiol. 1997, 114, 467–474. [Google Scholar] [CrossRef] [PubMed] [Green Version]
  16. Wanner, L.A.; Junttila, O. Cold-induced freezing tolerance in arabidopsis. Plant Physiol. 1999, 120, 391–399. [Google Scholar] [CrossRef] [Green Version]
  17. Heldt, H.-W. Plant Biochemistry and Molecular Biology; Oxford University Press: Oxford, UK, 1997; ISBN 019850179X. [Google Scholar]
  18. Takahashi, S.; Murata, N. How do environmental stresses accelerate photoinhibition? Trend Plant Sci. 2008, 13, 178–182. [Google Scholar] [CrossRef] [PubMed]
  19. Zhou, R.; Hyldgaard, B.; Yu, X.; Rosenqvist, E.; Ugarte, R.M.; Yu, S.; Wu, Z.; Ottosen, C.O.; Zhao, T. Phenotyping of faba beans (Vicia faba L.) under cold and heat stresses using chlorophyll fluorescence. Euphytica 2018, 214, 68. [Google Scholar] [CrossRef]
  20. Moosavi-Nezhad, M.; Salehi, R.; Aliniaeifard, S.; Tsaniklidis, G.; Woltering, E.J.; Fanourakis, D.; Żuk-Gołaszewska, K.; Kalaji, H.M. Blue light improves photosynthetic performance during healing and acclimatization of grafted watermelon seedlings. Int. J. Mol. Sci. 2021, 22, 8043. [Google Scholar] [CrossRef]
  21. Moradi, S.; Kafi, M.; Aliniaeifard, S.; Salami, S.A.; Shokrpour, M.; Pedersen, C.; Moosavi-Nezhad, M.; Wróbel, J.; Kalaji, H.M. Blue light improves photosynthetic performance and biomass partitioning toward harvestable organs in saffron (Crocus sativus L.). Cells 2021, 10, 1994. [Google Scholar] [CrossRef] [PubMed]
  22. Hetherington, S.; Smillie, R.; Hardacre, A.; Eagles, H. Using chlorophyll fluorescence in vivo to measure the chilling tolerances of different populations of maize. Funct. Plant Biol. 1983, 10, 247. [Google Scholar] [CrossRef]
  23. Schapendonk, A.H.C.M.; Dolstra, O.; van Kooten, O. The use of chlorophyll fluorescence as a screening method for cold tolerance in maize. Photosynth. Res. 1989, 20, 235–247. [Google Scholar] [CrossRef]
  24. Dolstra, O.; Haalstra, S.R.; van der Putten, P.E.L.; Schapendonk, A.H.C.M. Genetic variation for resistance to low-temperature photoinhibition of photosynthesis in maize (Zea mays L.). Euphytica 1994, 80, 85–93. [Google Scholar] [CrossRef]
  25. Roden, J.S.; Egerton, J.J.G.; Ball, M.C. Effect of elevated [CO2] on photosynthesis and growth of snow gum (Eucalyptus pauciflora) seedlings during winter and spring. Aust. J. Plant Physiol. 1999, 26, 37–46. [Google Scholar] [CrossRef]
  26. Walker, D. The Use of the Oxygen Electrode and Fluorescence Probes in Simple Measurements of Photosynthesis; Citeseer: Pennsylvania, PA, USA, 1987; ISBN 1870232003. [Google Scholar]
  27. Roháček, K. Chlorophyll fluorescence parameters: The definitions, photosynthetic meaning, and mutual relationships. Photosynthetica 2002, 40, 13–29. [Google Scholar] [CrossRef]
  28. Bayat, L.; Arab, M.; Aliniaeifard, S.; Seif, M.; Lastochkina, O.; Li, T. Effects of growth under different light spectra on the subsequent high light tolerance in rose plants. AoB Plants 2018, 10, ply052. [Google Scholar] [CrossRef] [PubMed]
  29. Kalaji, H.M.; Carpentier, R.; Allakhverdiev, S.I.; Bosa, K. Fluorescence parameters as early indicators of light stress in barley. J. Photochem. Photobiol. B Biol. 2012, 112, 1–6. [Google Scholar] [CrossRef] [PubMed]
  30. Stirbet, A.; Lazár, D.; Kromdijk, J. Govindjee Chlorophyll a fluorescence induction: Can just a one-second measurement be used to quantify abiotic stress responses? Photosynthetica 2018, 56, 86–104. [Google Scholar] [CrossRef]
  31. Kalhor, M.S.; Aliniaeifard, S.; Seif, M.; Asayesh, E.J.; Bernard, F.; Hassani, B.; Li, T. Enhanced salt tolerance and photosynthetic performance: Implication of γ-amino butyric acid application in salt-exposed lettuce (Lactuca sativa L.) plants. Plant Physiol. Biochem. 2018, 130, 157–172. [Google Scholar] [CrossRef]
  32. Dai, Y.; Yuan, L.; Zhang, S.; Wang, J.; Xie, S.; Zhao, M.; Chen, G.; Sun, R.; Wang, C. Comprehensive evaluation for cold tolerance in wucai (brassica campestris L.) by the performance index on an absorption basis (PIabs). Agronomy 2019, 9, 61. [Google Scholar] [CrossRef] [Green Version]
  33. Estaji, A.; Kalaji, H.M.; Karimi, H.R.; Roosta, H.R.; Moosavi-Nezhad, S.M. How glycine betaine induces tolerance of cucumber plants to salinity stress? Photosynthetica 2019, 57, 753–761. [Google Scholar] [CrossRef] [Green Version]
  34. Kalaji, M.H.; Goltsev, V.N.; Żuk-Golaszewska, K.; Zivcak, M.; Brestic, M. Chlorophyll Fluorescence: Understanding Crop Performance—Basics and Applications; CRC Press: Boca Raton, FL, USA, 2017; ISBN 9781498764506. [Google Scholar]
  35. Antal, T.; Rubin, A. In vivo analysis of chlorophyll a fluorescence induction. Photosynth. Res. 2008, 96, 217–226. [Google Scholar] [CrossRef]
  36. Szalai, G.; Pap, M.; Janda, T. Light-induced frost tolerance differs in winter and spring wheat plants. J. Plant Physiol. 2009, 166, 1826–1831. [Google Scholar] [CrossRef]
  37. Prerostova, S.; Černý, M.; Dobrev, P.I.; Motyka, V.; Hluskova, L.; Zupkova, B.; Gaudinova, A.; Knirsch, V.; Janda, T.; Brzobohatý, B.; et al. Light regulates the cytokinin-dependent cold stress responses in Arabidopsis. Front. Plant Sci. 2021, 11, 2293. [Google Scholar] [CrossRef] [PubMed]
  38. Janda, T.; Majláth, I.; Szalai, G. Interaction of temperature and light in the development of freezing tolerance in plants. J. Plant Growth Regul. 2014, 33, 460–469. [Google Scholar] [CrossRef] [Green Version]
  39. Soitamo, A.J.; Piippo, M.; Allahverdiyeva, Y.; Battchikova, N.; Aro, E.M. Light has a specific role in modulating Arabidopsis gene expression at low temperature. BMC Plant Biol. 2008, 8, 13. [Google Scholar] [CrossRef] [PubMed] [Green Version]
  40. Genty, B.; Briantais, J.-M.; Baker, N.R. The relationship between the quantum yield of photosynthetic electron transport and quenching of chlorophyll fluorescence. Biochim. Biophys. Acta (BBA)-Gen. Subj. 1989, 990, 87–92. [Google Scholar] [CrossRef]
  41. Aliniaeifard, S.; Malcolm Matamoros, P.; Van Meeteren, U. Stomatal malfunctioning under low Vapor Pressure Deficit (VPD) conditions: Induced by alterations in stomatal morphology and leaf anatomy or in the ABA signaling. Physiol. Plant. 2014, 152, 688–699. [Google Scholar] [CrossRef]
  42. Aliniaeifard, S.; Van Meeteren, U. Natural variation in stomatal response to closing stimuli among Arabidopsis thaliana accessions after exposure to low VPD as a tool to recognize the mechanism of disturbed stomatal functioning. J. Exp. Bot. 2014, 65, 6529–6542. [Google Scholar] [CrossRef]
  43. Lichtenthaler, H.K.; Wellburn, A.R. Determinations of total carotenoids and chlorophylls a and b of leaf extracts in different solvents. Biochem. Soc. Trans. 1983, 11, 591–592. [Google Scholar] [CrossRef] [Green Version]
  44. Nakano, Y.; Asada, K. Hydrogen peroxide is scavenged by ascorbate-specific peroxidase in spinach chloroplasts. Plant Cell Physiol. 1981, 22, 867–880. [Google Scholar]
  45. Patterson, B.D.; MacRae, E.A.; Ferguson, I.B. Estimation of hydrogen peroxide in plant extracts using titanium (IV). Anal. Biochem. 1984, 139, 487–492. [Google Scholar] [CrossRef]
  46. Shiferaw, B.; Baker, D.A. An evaluation of drought screening techniques for Eragrostis tef. Trop. Sci. 1996, 36, 74–85. [Google Scholar]
  47. Yemm, E.W.; Willis, A.J. The estimation of carbohydrates in plant extracts by anthrone. Biochem. J. 1954, 57, 508–514. [Google Scholar] [CrossRef] [Green Version]
  48. Ayyaz, A.; Amir, M.; Umer, S.; Iqbal, M.; Bano, H.; Gul, H.S.; Noor, Y.; kanwal, A.; khalid, A.; Javed, M.; et al. Melatonin induced changes in photosynthetic efficiency as probed by OJIP associated with improved chromium stress tolerance in canola (Brassica napus L.). Heliyon 2020, 6, e04364. [Google Scholar] [CrossRef]
  49. Strasser, R.J.; Tsimilli-Michael, M.; Qiang, S.; Goltsev, V. Simultaneous in vivo recording of prompt and delayed fluorescence and 820-nm reflection changes during drying and after rehydration of the resurrection plant Haberlea rhodopensis. Biochim. Biophys. Acta-Bioenerg. 2010, 1797, 1313–1326. [Google Scholar] [CrossRef] [Green Version]
  50. Raju, S.K.K.; Barnes, A.C.; Schnable, J.C.; Roston, R.L. Low-temperature tolerance in land plants: Are transcript and membrane responses conserved? Plant Sci. 2018, 276, 73–86. [Google Scholar] [CrossRef]
  51. Colom, M.R.; Pini Prato, E.; Giannini, R. Chlorophyll fluorescence and photosynthetic response to light in 1-year-old needles during spring and early summer in Pinus leucodermis. Trees-Struct. Funct. 2003, 17, 207–210. [Google Scholar] [CrossRef]
  52. Fracheboud, Y.; Haldimann, P.; Leipner, J.; Stamp, P. Chlorophyll fluorescence as a selection tool for cold tolerance of photosynthesis in maize (Zea mays L.). J. Exp. Bot. 1999, 50, 1533–1540. [Google Scholar] [CrossRef]
  53. Hajihashemi, S.; Noedoost, F.; Geuns, J.; Djalovic, I.; Siddique, K.H.M. Effect of cold stress on photosynthetic traits, carbohydrates, morphology, and anatomy in nine cultivars of Stevia rebaudiana. Front. Plant Sci. 2018, 9, 1430. [Google Scholar] [CrossRef] [Green Version]
  54. Yang, Y.-J.; Chang, W.; Huang, W.; Zhang, S.-B.; Hu, H. The effects of chilling-light stress on photosystems I and II in three Paphiopedilum species. Bot. Stud. 2017, 58, 53. [Google Scholar] [CrossRef] [PubMed] [Green Version]
  55. Allakhverdiev, S.I.; Murata, N. Salt stress inhibits photosystems II and I in cyanobacteria. Photosynth. Res. 2008, 98, 529–539. [Google Scholar] [CrossRef]
  56. Baker, N.R.; Rosenqvist, E. Corrigendum to: Applications of chlorophyll fluorescence can improve crop production strategies: An examination of future possibilities. J. Exp. Bot. 2020, 71, 1647. [Google Scholar] [CrossRef] [PubMed] [Green Version]
  57. Maxwell, K.; Johnson, G.N. Chlorophyll fluorescence—A practical guide. J. Exp. Bot. 2000, 51, 659–668. [Google Scholar] [CrossRef] [PubMed]
  58. Fu, W.; Li, P.; Wu, Y. Effects of different light intensities on chlorophyll fluorescence characteristics and yield in lettuce. Sci. Hortic. 2012, 135, 45–51. [Google Scholar] [CrossRef]
  59. Hazrati, S.; Tahmasebi-Sarvestani, Z.; Modarres-Sanavy, S.A.M.; Mokhtassi-Bidgoli, A.; Nicola, S. Effects of water stress and light intensity on chlorophyll fluorescence parameters and pigments of Aloe vera L. Plant Physiol. Biochem. 2016, 106, 141–148. [Google Scholar] [CrossRef] [PubMed]
  60. Strasser, R.J.; Srivastava, A.; Tsimilli-Michael, M. The fluorescence transient as a tool to characterize and screen photosynthetic samples. In Probing Photosynthesis: Mechanism, Regulation & Adaptation; Taylor & Francis: London, UK, 2000; pp. 443–480. ISBN 0748408215. [Google Scholar]
  61. Foyer, C.H.; Neukermans, J.; Queval, G.; Noctor, G.; Harbinson, J. Photosynthetic control of electron transport and the regulation of gene expression. J. Exp. Bot. 2012, 63, 1637–1661. [Google Scholar] [CrossRef] [Green Version]
  62. Rodríguez, V.M.; Soengas, P.; Alonso-Villaverde, V.; Sotelo, T.; Cartea, M.E.; Velasco, P. Effect of temperature stress on the early vegetative development of Brassica oleracea L. BMC Plant Biol. 2015, 15, 145. [Google Scholar] [CrossRef] [Green Version]
  63. van Heerden, P.D.R.; Swanepoel, J.W.; Krüger, G.H.J. Modulation of photosynthesis by drought in two desert scrub species exhibiting C3-mode CO2 assimilation. Environ. Exp. Bot. 2007, 61, 124–136. [Google Scholar] [CrossRef]
  64. Perveen, S.; Shahbaz, M.; Ashraf, M. Regulation in gas exchange and quantum yield of photosystem II (PSII) in salt-stressed and non-stressed wheat plants raised from seed treated with triacontanol. Pak. J. Bot 2010, 42, 3073–3081. [Google Scholar]
  65. Han, Q.-H.; Huang, B.; Ding, C.-B.; Zhang, Z.-W.; Chen, Y.-E.; Hu, C.; Zhou, L.-J.; Huang, Y.; Liao, J.-Q.; Yuan, S. Effects of melatonin on anti-oxidative systems and photosystem II in cold-stressed rice seedlings. Front. Plant Sci. 2017, 8, 785. [Google Scholar] [CrossRef]
  66. Steffens, B. The role of ethylene and ROS in salinity, heavy metal, and flooding responses in rice. Front. Plant Sci. 2014, 5, 685. [Google Scholar] [CrossRef]
  67. Pospíšil, P. Production of reactive oxygen species by photosystem II as a response to light and temperature stress. Front. Plant Sci. 2016, 7, 1950. [Google Scholar] [CrossRef]
  68. Ahmad, P.; Jaleel, C.A.; Salem, M.A.; Nabi, G.; Sharma, S. Roles of enzymatic and nonenzymatic antioxidants in plants during abiotic stress. Crit. Rev. Biotechnol. 2010, 30, 161–175. [Google Scholar] [CrossRef] [PubMed]
  69. Caverzan, A.; Passaia, G.; Rosa, S.B.; Ribeiro, C.W.; Lazzarotto, F.; Margis-Pinheiro, M. Plant responses to stresses: Role of ascorbate peroxidase in the antioxidant protection. Genet. Mol. Biol. 2012, 35, 1011–1019. [Google Scholar] [CrossRef] [Green Version]
  70. Rivero, R.M.; Ruiz, J.M.; García, P.C.; López-Lefebre, L.R.; Sánchez, E.; Romero, L. Response of oxidative metabolism in watermelon plants subjected to cold stress. Funct. Plant Biol. 2002, 29, 643–648. [Google Scholar] [CrossRef] [PubMed]
  71. Bonnecarrère, V.; Borsani, O.; Díaz, P.; Capdevielle, F.; Blanco, P.; Monza, J. Response to photoxidative stress induced by cold in japonica rice is genotype dependent. Plant Sci. 2011, 180, 726–732. [Google Scholar] [CrossRef] [PubMed]
  72. Asada, K. The water-water cycle in chloroplasts: Scavenging of active oxygens and dissipation of excess photons. Annu. Rev. Plant Biol. 1999, 50, 601–639. [Google Scholar] [CrossRef] [PubMed]
  73. Scandalios, J.G. The rise of ROS. Trends Biochem. Sci. 2002, 27, 483–486. [Google Scholar] [CrossRef]
  74. Zhang, Z.; Zhang, Q.; Wu, J.; Zheng, X.; Zheng, S.; Sun, X.; Qiu, Q.; Lu, T. Gene knockout study reveals that cytosolic ascorbate peroxidase 2 (OsAPX2) plays a critical role in growth and reproduction in rice under drought, salt and cold stresses. PLoS ONE 2013, 8, e57472. [Google Scholar] [CrossRef]
  75. Xu, J.; Yang, J.; Duan, X.; Jiang, Y.; Zhang, P. Increased expression of native cytosolic Cu/Zn superoxide dismutase and ascorbate peroxidase improves tolerance to oxidative and chilling stresses in cassava (Manihot esculenta Crantz). BMC Plant Biol. 2014, 14, 208. [Google Scholar] [CrossRef] [PubMed]
  76. Cui, G.; Chai, H.; Yin, H.; Yang, M.; Hu, G.; Guo, M.; Yi, R.; Zhang, P. Full-length transcriptome sequencing reveals the low-temperature-tolerance mechanism of Medicago falcata roots. BMC Plant Biol. 2019, 19, 575. [Google Scholar] [CrossRef] [PubMed] [Green Version]
  77. Kim, T.E.; Kim, S.; Han, T.J.; Lee, J.S.; Chang, S.C. ABA and polyamines act independently in primary leaves of cold-stressed tomato (Lycopersicon esculentum). Physiol. Plant. 2002, 115, 370–376. [Google Scholar] [CrossRef]
  78. Nasibi, F.; Manouchehri Kalantari, K.; Manzari Tavakoli, Z. Effects of hydrogen sulfide on cold-induced oxidative damage in Cucumis sativus L. Introduction. Int. J. Hortic. Sci. Technol. 2020, 7, 199–211. [Google Scholar]
  79. Shahryar, N.; Maali-Amiri, R. Metabolic acclimation of tetraploid and hexaploid wheats by cold stress-induced carbohydrate accumulation. J. Plant Physiol. 2016, 204, 44–53. [Google Scholar] [CrossRef]
  80. Améglio, T.; Cochard, H.; Ewers, F.W. Stem diameter variations and cold hardiness in walnut trees. J. Exp. Bot. 2001, 52, 2135–2142. [Google Scholar] [CrossRef]
  81. Wang, K.; Shao, X.; Gong, Y.; Zhu, Y.; Wang, H.; Zhang, X.; Yu, D.; Yu, F.; Qiu, Z.; Lu, H. The metabolism of soluble carbohydrates related to chilling injury in peach fruit exposed to cold stress. Postharvest Biol. Technol. 2013, 86, 53–61. [Google Scholar] [CrossRef]
  82. Yuanyuan, M.; Yali, Z.; Jiang, L.; Hongbo, S. Roles of plant soluble sugars and their responses to plant cold stress. Afr. J. Biotechnol. 2009, 8, 2004–2010. [Google Scholar]
  83. Adams, W.W.; Muller, O.; Cohu, C.M.; Demmig-Adams, B. May photoinhibition be a consequence, rather than a cause, of limited plant productivity? Photosynth. Res. 2013, 117, 31–44. [Google Scholar] [CrossRef] [PubMed]
  84. Mishra, A.; Heyer, A.G.; Mishra, K.B. Chlorophyll fluorescence emission can screen cold tolerance of cold acclimated Arabidopsis thaliana accessions. Plant Methods 2014, 10, 38. [Google Scholar] [CrossRef] [Green Version]
  85. Cao, X.; Jiang, F.; Wang, X.; Zang, Y.; Wu, Z. Comprehensive evaluation and screening for chilling-tolerance in tomato lines at the seedling stage. Euphytica 2015, 205, 569–584. [Google Scholar] [CrossRef]
  86. Aazami, M.A.; Asghari-Aruq, M.; Hassanpouraghdam, M.B.; Ercisli, S.; Baron, M.; Sochor, J. Low temperature stress mediates the antioxidants pool and chlorophyll fluorescence in Vitis vinifera L. Cultivars. Plants 2021, 10, 1877. [Google Scholar] [CrossRef] [PubMed]
  87. Anwar, A.; Wang, J.; Yu, X.; He, C.; Li, Y. Substrate application of 5-aminolevulinic acid enhanced low-temperature and weak-light stress tolerance in cucumber (Cucumis sativus L.). Agronomy 2020, 10, 472. [Google Scholar] [CrossRef] [Green Version]
Figure 1. The spectral distribution of white ((41% blue (400–500 nm), 39% green (500–600 nm), and 20% red (600–700 nm)) LED lights employed in the present study.
Agronomy 12 00201 g001
Figure 2. The absorbance flux per reaction center ((A); ABS/RC), trapped energy flux per reaction center ((B); TR0/RC), electron transport flux per reaction center ((C); ET0/RC), and dissipated-energy per reaction center ((D); DI0/RC) in four accessions of cucumber (Nunhems Gouhar (N), Super Sultan (S), Tabriz (T), and T–141) in control (room temperature + 300 μmol m−2 s−1) and low temperature (4 °C) under 0, 300, and 600 μmol m−2 s−1. Five plants per treatment were assessed, from which the mean values of five measurements are illustrated by the height of the column charts. Error bars represent the standard error of means (SEM).
Agronomy 12 00201 g002
Figure 3. Chlorophyll fluorescence images of FV/FM (equation in Table 1) exhibited by leaves sampled from four cucumber accessions (Nunhems Gouhar (N), Super Sultan (S), Tabriz (T), and T–141) and control following exposure to different PPFDs (0, 300, and 600 μmol m−2 s−1) of white light (see the spectrum in Figure 1) under 4 °C. Control plants were exposed to 300 μmol m−2 s−1 under 24 °C. As results from all five plants of each treatment were similar, representative images are shown.
Agronomy 12 00201 g003
Figure 4. Maximum quantum yield of photosystem II ((A); FV/FM), maximum efficiency of the water-splitting reaction on the donor side of PSII ((B); FV/F0), structural damage to PSII ((C); FM/F0), and performance index on absorbance basis ((D); PIabs) in four accessions of cucumber (Nunhems Gouhar (N), Super Sultan (S), Tabriz (T), and T–141) in control (room temperature + 300 μmol m−2 s−1) and low temperature under 0, 300, and 600 μmol m−2 s−1. Five plants per treatment were assessed, from which the mean values of five measurements are illustrated by the height of the column charts. Error bars represent the standard error of means (SEM).
Agronomy 12 00201 g004
Figure 5. Hydrogen peroxide content ((A); H2O2) of leaves, ascorbate peroxidase activity ((B); APX), the correlation between APX and H2O2 (C), and electrolyte leakage (D) in four accessions of cucumber (Nunhems Gouhar (N), Super Sultan (S), Tabriz (T), and T–141) in control (room temperature + 300 μmol m−2 s−1) and low temperature under 0, 300, and 600 μmol m−2 s−1. Five plants per treatment were assessed, from which the mean values of five measurements are illustrated by the height of the column charts. Error bars represent standard error of means (SEM).
Agronomy 12 00201 g005
Figure 6. Chlorophyll content ((A); Chl (a + b)), carotenoid content of leaves (B), the correlation between PIabs and Chl (a + b) (C), and the correlation between PIabs and carotenoid (D) in four accessions of cucumber (Nunhems Gouhar (N), Super Sultan (S), Tabriz (T), and T–141) in control (300 μmol m−2 s−1) and low temperature under 0, 300, and 600 μmol m−2 s−1. Five plants per treatment were assessed, from which the mean values of five measurements are illustrated by the height of the column charts. Error bars represent the standard error of means (SEM).
Agronomy 12 00201 g006
Figure 7. Water-soluble carbohydrates ((A); WSC) and the correlation between PIabs and WSC (B) in four accessions of cucumber (Nunhems Gouhar (N), Super Sultan (S), Tabriz (T) and T–141) in control (room temperature + 300 μmol m−2 s−1) and low temperature under 0, 300 and 600 μmol m−2 s−1. Five plants per treatment were assessed, from which the mean values of five measurements are illustrated by the height of the column charts. Error bars represent the standard error of means (SEM).
Agronomy 12 00201 g007
Figure 8. Effect of Photosynthetic photon flux density (PPFD) and temperature on photosynthetic apparatus of cucumber leaves (A). Negative impact of light intensity under low temperature on photosynthetic machinery and carbohydrate accumulation (B). H2O2 content and ascorbate peroxidase activity in cucumber leaves increased under low temperature by the increase in PPFD, while chlorophyll and carotenoid contents decreased under low temperature by PPFD elevation (C). Electron transport machinery disturbed and energy dissipation increased by the increase in light intensity under cold stress (D). Representative image exhibiting the negative impact of increase in PPFD under low temperature on maximum quantum yield of photosystem II (E).
Agronomy 12 00201 g008
Table 1. Abbreviations, formulas, and definitions of the OJIP parameters assessed in the current study.
AbbreviationEquationDefinition
FV/F0ϕ P0/(1 − ϕ P0)Maximum efficiency of the water diffusion reaction on the donor side of PSII
FV/FMTR0/ABS = [1 − (F0/FM)]Relative maximal variable fluorescence
FM/F0 Structural damage to PSII
ABS/RCM0 (1/VJ)(1/ϕP0)Light absorbance flux for PSII antenna chlorophylls per reaction center
TR0/RCM0 (1/VJ)Trapped energy flux per reaction center
ET0/RCM0 (1/VJ) ψ0Electron transport flux per reaction center
DI0/RC(ABS/RC) − (TR0/RC)Energy flux not intercepted by an RC, dissipated in the form of heat, fluorescence, or transfer to other systems, at time t = 0
PIabs(RC/ABS) × (ϕP0/(1 − ϕP0)) × (ψ0/(1 − ψ0))Performance index per absorbed light
Publisher’s Note: MDPI stays neutral with regard to jurisdictional claims in published maps and institutional affiliations.

