Article

Soil Nutrient Retention and pH Buffering Capacity Are Enhanced by Calciprill and Sodium Silicate

1
Department of Crop Science, Faculty of Agricultural Science and Forestry, Universiti Putra Malaysia Bintulu Sarawak Campus, Bintulu 97008, Sarawak, Malaysia
2
Department of Forestry Science, Faculty of Agricultural Science and Forestry, Universiti Putra Malaysia Bintulu Sarawak Campus, Bintulu 97008, Sarawak, Malaysia
3
Institut Ekosains Borneo (IEB), Universiti Putra Malaysia Bintulu Sarawak Campus, Bintulu 97008, Sarawak, Malaysia
4
Institute for Mathematical Research, Universiti Putra Malaysia, Serdang 43400, Selangor, Malaysia
5
Crop Production Programme, Faculty of Sustainable Agriculture, Universiti Malaysia Sabah, Sandakan Branch, Locked Bag No. 3, Sandakan 90509, Sabah, Malaysia
6
Faculty of Business Management and Professional Studies, Management and Science University, University Drive, Off Persiaran Olahraga Section 13, Shah Alam 40100, Selangor, Malaysia
7
Omya Asia Pacific Sdn. Bhd., Kuala Lumpur 59200, Malaysia
*
Author to whom correspondence should be addressed.
Submission received: 26 October 2021 / Revised: 26 November 2021 / Accepted: 29 November 2021 / Published: 17 January 2022

Abstract

:
In the tropics, warm temperatures and high rainfall contribute to acidic soil formation because of the significant leaching of base cations (K+, Ca2+, Mg2+, and Na+), followed by the replacement of the base cations with Al3+, Fe2+, and H+ ions at the soil adsorption sites. The pH buffering capacity of highly weathered acid soils is generally low because of their low pH which negatively impacts soil and crop productivity. Thus, there is a need to amend these soils with the right amount of inorganic liming materials which have relatively high neutralizing values and reactivity to overcome the aforementioned problems. Soil leaching and the pH buffering capacity studies were conducted to determine whether the co-application or co-amendment of a calcium carbonate product (Calciprill) and sodium silicate can improve soil nutrient retention and pH buffering capacity of the Bekenu series (Typic Paleudults). A 30 day soil leaching experiment was carried out using a completely randomized design with 16 treatments and 3 replications after which the leached soil samples were used for a pH buffering capacity study. The Calciprill and sodium silicate treatments significantly improved soil pH, exchangeable NH4+, available P, exchangeable base cations, Effective Cation Exchange Capacity (ECEC), and pH buffering capacity in comparison with the untreated soil. The improvements were attributed to the alkalinity of Calciprill and sodium silicate due to their high inherent K+, Ca2+, Mg2+, and Na+ contents. The neutralizing effects of the amendments impeded the hydrolysis of Al3+ (96.5%), Fe2+ (70.4%), and Mn2+ (25.3%) ions resulting in fewer H+ ions being produced. The co-application of Calciprill and sodium silicate reduced the leaching of Ca2+ (58.7%) and NO3 (74.8%) from the amended soils. This was due to the ability of sodium silicate to reduce soil permeability and protect the Calciprill and available NO3 from being leached. This also improved the longevity of Calciprill to enhance the soil pH buffering capacity. However, the amounts of NH4+, P, and base cations leached from the amended soils were higher compared with the un-amended soils. This was due to the high solubility of sodium silicate. The most suitable combination amendment was 7.01 g Calciprill and 9.26 g sodium silicate (C2S5) per kilogram soil. It is possible for farmers to adopt the combined use Calciprill and sodium silicate to regulate soil nutrient retention and improve the soil pH buffering capacity of highly weathered acidic soils. This will enhance soil and crop productivity.

1. Introduction

The leaching of soil nutrients is a process by which water soluble nutrients move downward through the soil profile below the plant root zone via percolation of water that exceeds the field capacity of soils. This process is usually exacerbated by excessive rainfall [1] and leads to soil acidity. Approximately 3.95 billion hectares of global land are acidic [2]. These acidic soils are predominantly Oxisols and Ultisols and are widely distributed in Africa (16.7%), Australia and New Zealand (6.1%), Europe (9.9%), Asia (26.4%), and America (40.9%) [3,4]. In the tropics, highly weathered soils such as Oxisols and Ultisols are formed because of warmer temperatures, high rainfall intensity, and an abundance of kaolinite clay minerals. These highly weathered soils with high kaolinite clay minerals and Al and Fe oxides are generally characterized by a low pH buffering capacity because of low Cation Exchange Capacity (CEC) and base saturations [5]. As a result, these soils are prone to nutrient loss through soil erosion, surface runoff, and leaching due to the high rainfall events over long periods [6]. The leaching of base cations is a major cause of soil acidification, which is worsened when acidic cations such as Al3+, Fe2+, Mn2+, and H+ ions replace the base cations. High amounts of Al3+ and Fe2+ ions in Oxisols and Ultisols also result in P fixation. These soil processes and the low pH buffering capacity hampers soil the nutrient availability in soil and crop productivity [7,8,9]. To reverse soil acidity and Al toxicity, agricultural limes such as CaCO3 and dolomite are commonly used. However, the effectiveness of CaCO3 in ameliorating soil acidity and suppressing Al toxicity is inconsistent due to the impurities and coarse particles in these traditional limes. These carbonates also exhibit poor solubility in soil water and the excessive use of dolomite causes Mg toxicity [10,11]. Therefore, careful selection of the right amendment to effectively suppress exchangeable acidity and manage soil pH is essential.
Soil pH buffering capacity is defined as the ability of a soil to resist pH changes when small amounts of acid or alkaline are added. The pH buffering capacity of soils can be improved by the ddition of reactive carbonate minerals [12] and silicate minerals [13,14]. This is because the dissolution of carbonate minerals can release Ca2+ and CO32− ions to increase soil pH via the neutralisation of added H+ ions, whereas the dissolution of silicate minerals releases SiO44− ions which react with water molecules and transform into silicic acid (H4SiO4) to release four OH ions, thus neutralizing H+ ions and increasing the soil pH buffering capacity [15,16]. However, the dissolution and neutralizing ability of these minerals are influenced by their nature and reactivity [17], the amount of H+ ions [18], soil type and degree of soil weathering [12,19], and phosphate settling on the surfaces of these minerals [20,21]. Increased the soil pH buffering capacity can also be contributed to by increased soil pH [9], soil organic matter [22,23], base saturations [24], and ECEC [7]. For example, the combined use of charcoal and sago bark ash increased soil pH and detoxified Al3+ and Fe2+ ions via chelation because of high inherent base cations in sago bark ash when in contact with soil water. The addition of charcoal increases the number of negatively-charged sites which improves soil CEC to retain more exchangeable base cations (K+, Ca2+, Mg2+, and Na+) at the functional groups such as carboxyl (R-COOH), phenolic (R-OH), and amine (R-NH2) groups and the ability to buffer more H+ ions [25,26]. Nevertheless, the inconsistent and slow effects of these organic amendments could be influenced by the recalcitrant property of charcoal, the raw materials used, and the handling methods. Besides, an unbalanced use of charcoal and sago bark ash can cause heavy metal toxicity, phosphorus fixation by calcium, soil salinization, and environmental pollution [27,28,29]. Therefore, amending soils with the right amount of inorganic liming materials which have relatively high neutralizing values and reactivity is essential. This provides rapid and consistent responses to impede Al3+ and Fe2+ ions that can undergo hydrolysis to release more H+ ions, which causes soil acidification, stabilization of the soil structure, reduced soil permeability, and minimization of nutrient leaching [30,31,32]. The combined use of Calciprill and sodium silicate could be a sustainable management approach for enhancing soil nutrient retention and pH buffering capacity in high weathered soils such as Oxisols and Ultisols.
Calciprill (a calcium carbonate product) and sodium silicate are high quality materials worth considering for liming purposes because of their high purity and high solubility in soil water which enhances the release of base cations. Calciprill is a 2–6 mm prill which can reduce soil acidity because of its high CaCO3 purity and high neutralizing value, which are 95% and 99, respectively. The application of sodium silicate can also strengthen soil stability because the release of Si through dissolution produces a crystalline gel between the soil pores to bind the soil particles [33]. This could decrease the permeability and hydraulic conductivity of soils to reduce the loss of soil nutrients via leaching and runoff. The formation of silica gel is enhanced when the sodium silicate applied is above 2% of the soil volume [33]. The application of sodium silicate is common in soil stabilization because this approach is considered environment friendly and safe [34,35]. Schaller et al. [36] reported that an increase in biogenic amorphous silica reduced soil hydraulic conductivity by improving the negative potential of soil water, which increases the holding capacity of the soil water and reduces the discharge of available NO3 and P into water bodies. Soil stabilization induced by sodium silicate could protect the Calciprill from being lost via leaching and runoff.
There is a dearth of information on the nutrient retention and the pH buffering capacity of tropical acid soils when these amendments are co-applied to such soil. The question about the most suitable or the right combination of Calciprill and sodium silicate to improve soil nutrient retention and pH buffering capacity needs to be answered. Therefore, it was hypothesized that the co-application of Calciprill and sodium silicate can improve soil nutrient retention and pH buffering capacity based on the following assumptions: (i) Calciprill can effectively neutralize soil exchangeable H+ and reduce Al3+ and Fe2+ toxicities for regulating essential nutrient availability; (ii) sodium silicate will increase soil stability via the flocculation of soil particles to reduce water permeability and nutrient loss via leaching. This is plausible because Calciprill is a liming material with high CaCO3 purity (95%) for neutralizing exchangeable acidity. Calciprill could also increase soil ECEC and the number of negatively charged sites for adsorbing exchangeable cations to prevent their leaching out from the plant root zone. The continuous dissolution of CaCO3 could also increase the soil pH buffering capacity to neutralize the H+ ions produced in soil acidification processes. Moreover, the high solubility of sodium silicate does not only increase soil pH rapidly and consistently, the Si can also improve the stability and structure of the soil to reduce the leaching of nutrients. Thus, there was a need for this study because these amendments can provide rapid and consistent responses to enhance nutrient retention and increase soil pH buffering capacity. Based on the aforementioned rationale, the objective of this study was to determine the effects of Calciprill and sodium silicate on nutrient retention and the pH buffering capacity of Bekenu series soil (Typic Paleudults). It is hoped that the present study can present a deeper understanding of the mechanisms of soil nutrient retention and pH buffering capacity influenced by the co-application of Calciprill and sodium silicate on highly weathered acidic soils.

2. Materials and Methods

2.1. Soil Sampling and Preparation

In this study, the soil used was Bekenu Series (which is Typic Paleudults, based on the USDA soil classification system). This soil was selected because it is acidic and commonly used for crop cultivation [37]. According to Paramannanthan [37], the Bekenu series is classified as an Ultisol which is characterized by a fine loamy soil texture, is siliceous in nature (more than 90% by weight silica minerals), and has a deep and well-drained soil profile. The red-yellow soil colour was attributed to its parent material of highly weathered sedimentary rocks which contain more than 30% ferric oxide (Fe2O3) [37]. In addition, high rainfalls and warm temperatures expedite the weathering of these sedimentary rocks to form kaolinite clay minerals [5]. This causes the soil to be prone to the leaching of exchangeable base cations (K+, Ca2+, Mg2+, and Na+). Therefore, it is an infertile soil which is acidic in nature, low in nutrient content, base saturation, pH buffering capacity, and requires corrective measures such as the use of Calciprill and sodium silicate to improve its productivity. The soil was collected from an uncultivated area at Universiti Putra Malaysia Bintulu Campus, Sarawak, Malaysia. The geographical coordinates of the soil sampling location are latitude 03°20′ N and longitude 113°07′ E. The soil was sampled and collected from a pedon 1 m long × 1 m wide × 0.2 m deep in size as described by Soil Survey Staff [38]. The soil was air-dried, manually crushed, and passed through a 2 mm sieve for soil chemical analyses. The sieved soil was bulked for homogenization before being used in the leaching experiment.

2.2. Initial Characterization of the Selected Chemical Properties of Soil, Calciprill, and Sodium Silicate

Soil pH was determined in a 1:2.5 (soil:1 mol dm−3 KCl) suspension using a digital pH meter (SevenEasy pH, Mettler-Toledo GmbH, Schwerzenbach, Switzerland) [39]. Soil electrical conductivity (EC) was determined in a 1:2.5 (soil:distilled water) suspension using an EC meter (SevenEasy Conductivity, Mettler-Toledo GmbH, Schwerzenbach, Switzerland) [39]. Soil exchangeable NH4+ and available NO3 were determined using the method described by Keeney and Nelson [40]. Soil available P and exchangeable cations (K+, Ca2+, Mg2+, Na+, Fe2+, and Mn2+) were extracted using Mehlich’s No.1 double acid solution [41]. Available P in the soil was then determined using Ultraviolet-visible spectrophotometry (Lambda 25, Perkin Elmer, Shelton, CT, USA) after blue colour development [42], whereas exchangeable cations were determined using an Atomic Absorbance Spectrophotometer (AAnalyst 800, Perkin Elmer, Shelton, CT, USA). Soil exchangeable Al3+ was determined using the acid-base titration method described by Rowell [43]. The ECEC was determined by summing the charge equivalent of exchangeable K+, Ca2+, Mg2+, Na+, Mn2+, Fe2+, Al3+, and H+ ions for soil samples with a pH lower than 6.5 and for soil samples with a pH higher than 6.5 but with negligible H+ ions [44] by using the following formulae:
ECEC(pHKCl < 6.5) (cmol(+) kg−1) = ∑(exchangeable K+ + Ca2+ + Mg2+ + Na+ + Mn2+ + Fe2+ + Al3+ + H+)
ECEC(pHKCl > 6.5) (cmol(+) kg−1) = ∑(exchangeable K+ + Ca2+ + Mg2+ + Na+ + Mn2+ + Fe2+ + Al3+)
The Calciprill and sodium silicate were supplied by Humibox (M) Sdn. Bhd., Kuala Lumpur, Malaysia and Omya Asia Pacific Sdn. Bhd., Kuala Lumpur, Malaysia, respectively. The procedures used for the characterization of these two materials used as soil amendments were similar to those for the soil. The initial chemical properties of the soil, Calciprill, and sodium silicate are summarised in Table 1.

2.3. Soil Leaching Study

A leaching study was conducted in the Soil Science Laboratory at the Department of Crop Science, Universiti Putra Malaysia Bintulu Campus, Sarawak, Malaysia using 1 kg of soil placed in polypropylene containers perforated at the base and 15 cm in diameter and 12 cm high. There were a total of 16 treatments in this study and the details of these treatments are summarized in Table 2. The application rates of Calciprill were based on the targeted Ca saturation of 80%, 90%, and 100% [45,46]. These values were converted to per one kilogram soil and were equivalent to 6.22 g (C1), 7.01 g (C2), and 7.80 g (C3), respectively. The application rates of sodium silicate were based on the recommended application rates and the planting density of the black pepper crop (Piper nigrum) at 90 kg ha−1, 105 kg ha−1, 120 kg ha−1, 135 kg ha−1, and 150 kg ha−1, and the values were equivalent to 5.55 g (S1), 6.48 g (S2), 7.41 g (S3), 8.33 g (S4), and 9.26 g (S5), respectively, for one kilogram of soil [47,48]. There was also one treatment which was one kilogram of soil without any amendments (C0S0). The application rates were based on the black pepper crop because it is used as a test crop in future greenhouse and field trials. The soil was mixed thoroughly with Calciprill and sodium silicate based on the treatments of the study (Table 2). For each experimental unit, a 500 mL beaker was placed under the perforated container for leachates collection at five day intervals over the 30 days of leaching.
Before commencing the leaching experiment, the samples mixed with the treatments were moistened to 50% of field capacity [49], which is 300 mL distilled water for the quantity of soil used in this study and left overnight. The following day, at the start of the initial or first leaching, 300 mL distilled water was poured meticulously onto the soil samples and allowed to leach for five days into the leachate collecting beaker for subsequent laboratory analysis. The addition of 300 mL distilled water was repeated six times at five day intervals for the collection of leachates. The whole leaching experiment lasted 30 days. The leachates were then used for the determination of pH, EC, and the amount of nutrients (NH4+, NO3, P, K+, Ca2+, Mg2+, and Na+) leached. Soil samples from each container were taken after the 30 days of leaching, which were then air-dried, manually crushed, and sieved to pass through a 2 mm sieve for chemical analyses using the procedures as described previously.

2.4. Soil pH Buffering Capacity Study

The soil pH buffering capacity was determined using the method described by Aitken and Moody [50] with some modifications. A 10 g soil sample obtained after the leaching experiment was weighed into 100 mL polyethylene plastic vials and mixed with 0.1 mol dm−3 HCl or 0.1 mol dm−3 NaOH at a ratio of 1:5. For the soil samples whose pH were less than 5.5, 0.1 mol dm−3 NaOH was used to reduce the soil suspension effect and to prevent an underestimation of soil acidity in the soil samples [43]. For the soil samples with a pH higher than 6.0, the 0.1 mol dm−3 HCl was used. The 0.1 mol dm−3 HCl or 0.1 mol dm−3 NaOH was added to the soil samples at the rates 0, 0.1, 0.25, 0.5, 1, 2, 4, and 8 mL, then marked up with distilled water in 50 mL volumetric flasks. Thereafter, 1 mL of 0.05 mol dm−3 CaCl2 was added to the soil suspension to reduce ionic strength variation. To inhibit the activity of microorganisms, 0.25 mL toluene was added in place of 0.25 mL chloroform as Wong and Wittwer [51] reported that chloroform will react with NaOH. The soil suspensions were shaken at 180 rpm for 24 h and left to equilibrate for seven days at 25 °C [52,53,54]. The suspensions were shaken for two minutes daily for another six days to re-suspend the contents of the soil solution. After seven days of equilibration, the pH of the soil suspensions was determined using a digital pH meter. The soil pH buffering capacity was calculated using the negative reciprocal of the slope of a linear regression by determining the amount of acid or base added to change the pH by one unit:
pH   buffering   capacity = 1 slope
where slope is the fitted slope of the linear regression line for each sample.

2.5. Experimental Design and Statistical Analysis

The treatments were arranged in a completely randomized design (CRD) with three replications. The collected data were analyzed using one-way Analysis of Variance (ANOVA) to determine the treatment effects, followed by mean comparisons using Tukey’s HSD test at p ≤ 0.05. A regression analysis was used to test the linear relationship between the amount of H+ or OH added and the pH change to obtain the coefficient of determination (R2) of the regression using PROC REG. The software used was the Statistical Analysis System (SAS) version 9.4, Cary, NC, USA.

3. Results and Discussions

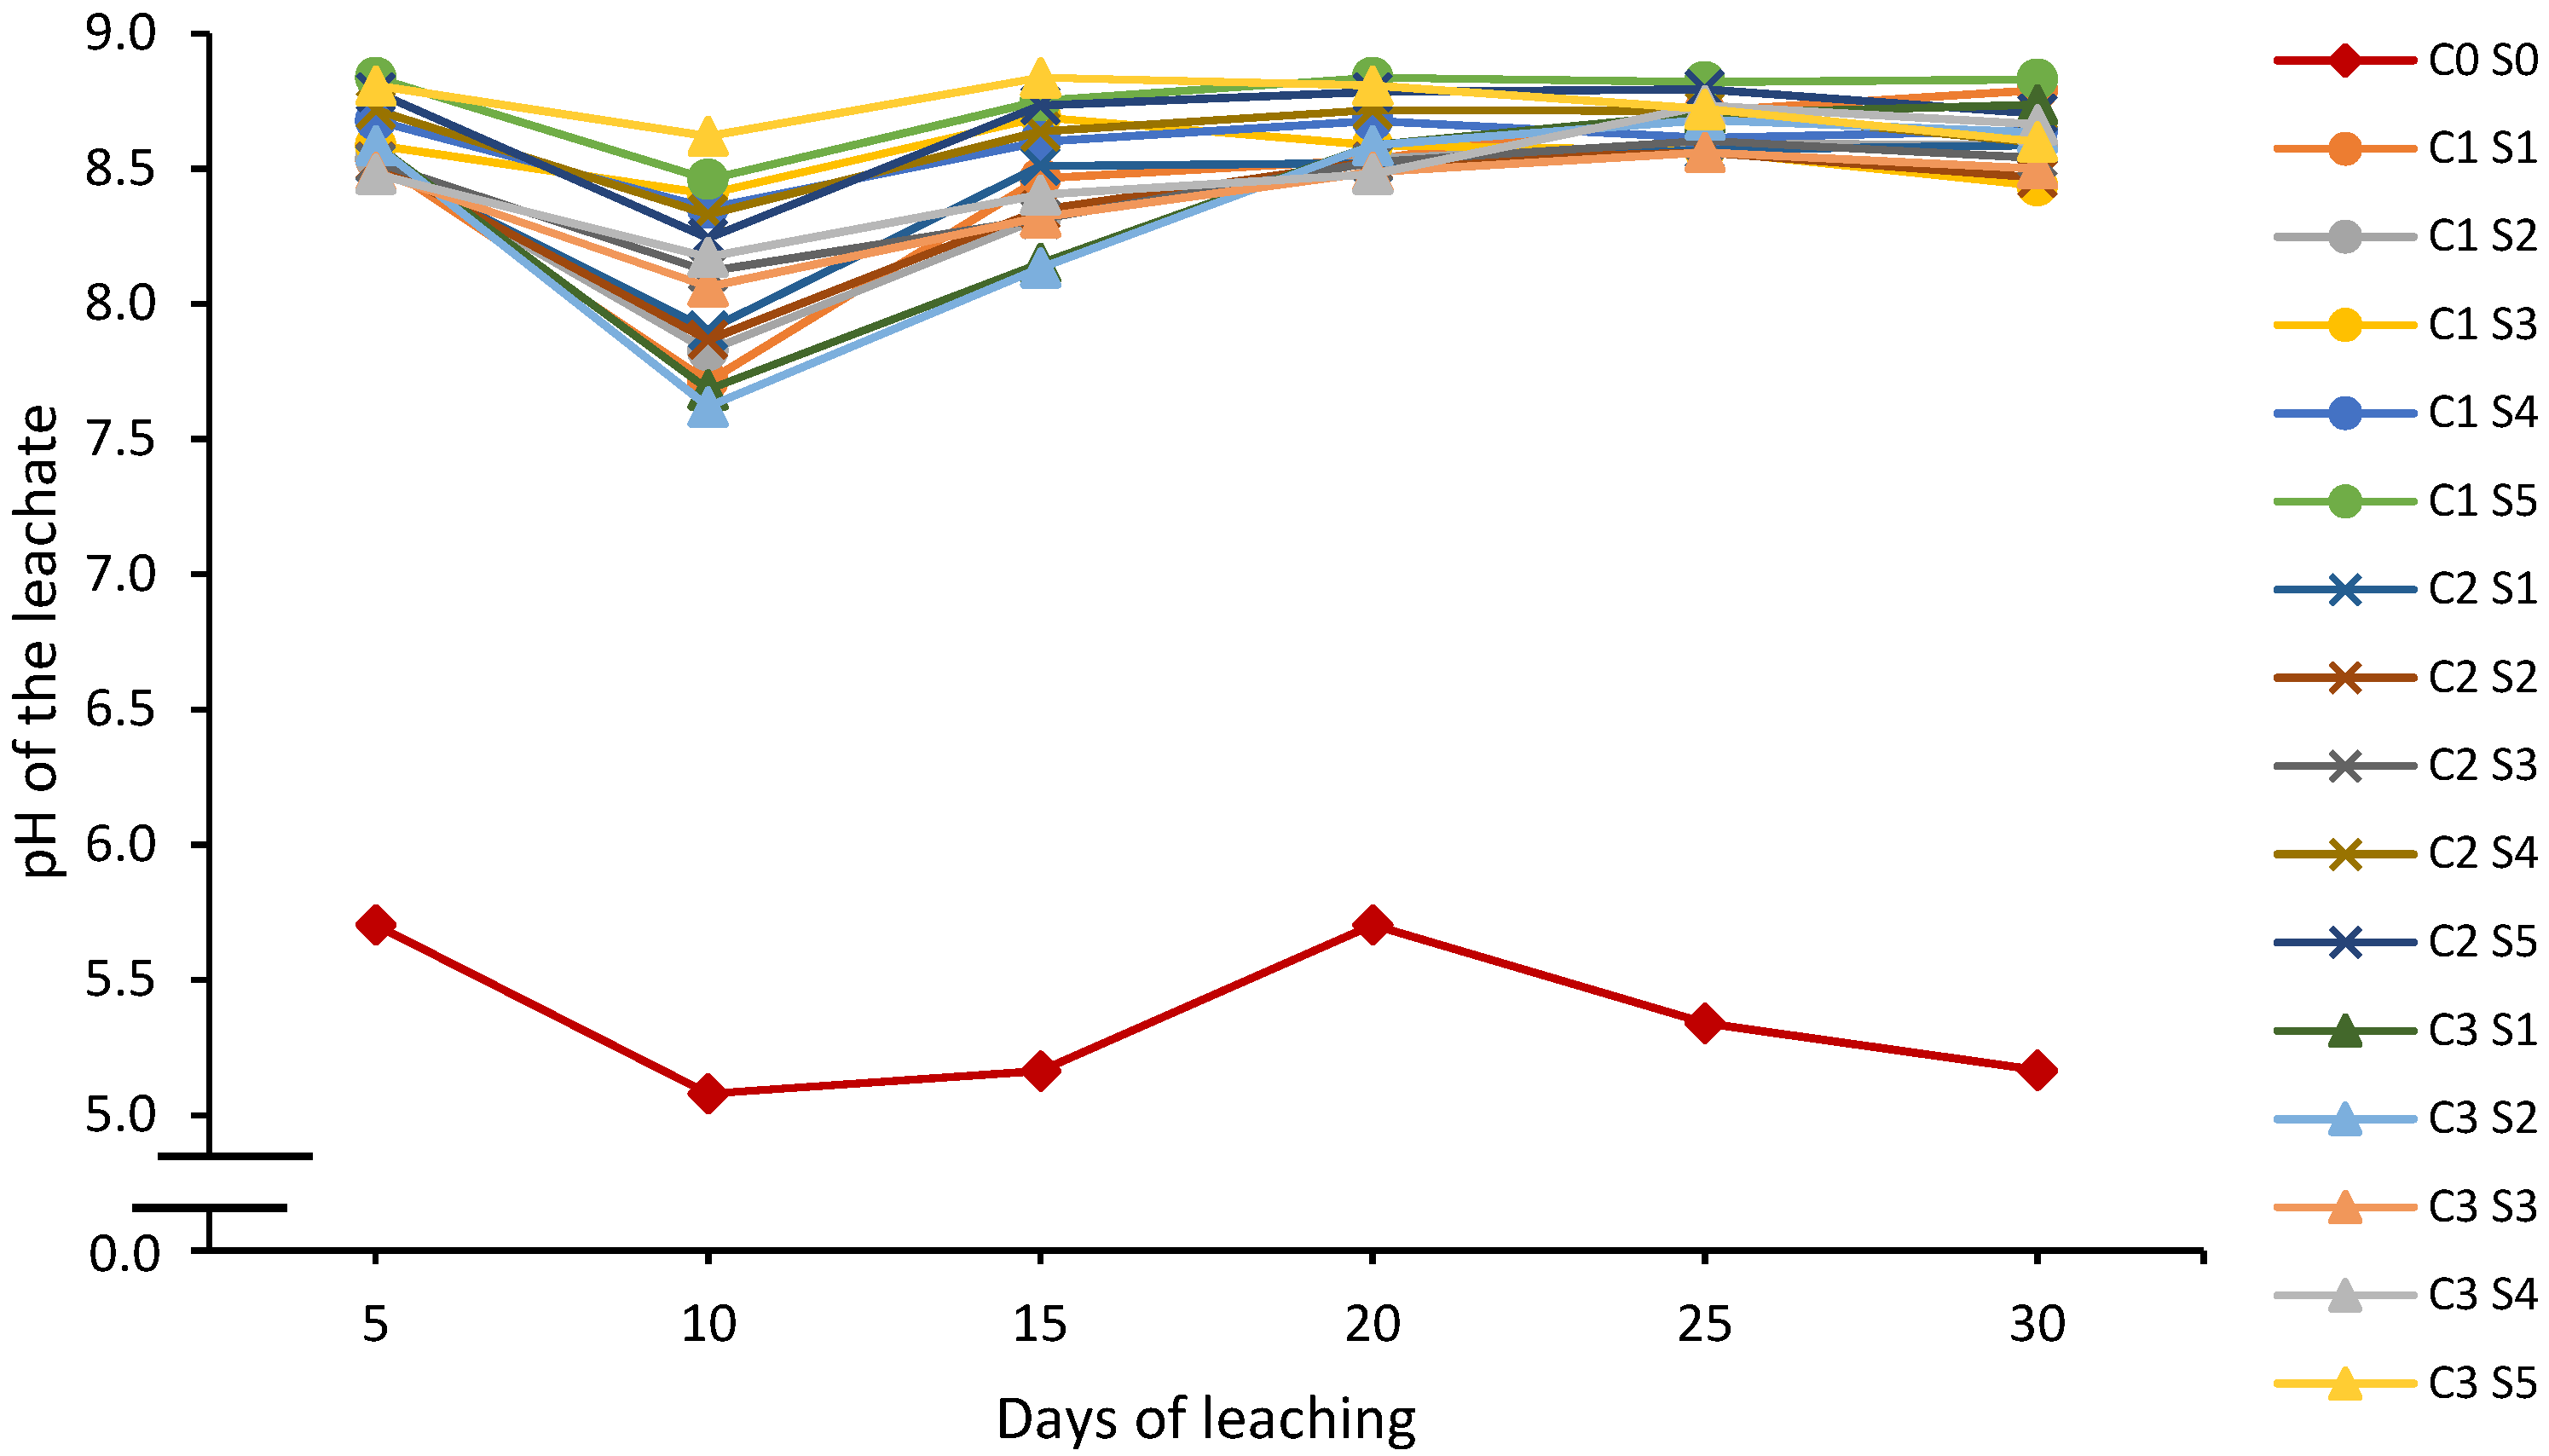
3.1. The Effects of the Co-Application of Calciprill and Sodium Silicate on the pH and Electrical Conductivity of the Leachates

The effects of the co-application of Calciprill and sodium silicate on the pH of the leachates over 30 days of leaching are presented in Figure 1. The pH of the leachates for the soils treated with Calciprill and sodium silicate exceeded 7 whereas that of the soil without any amendments (C0S0) was acidic, suggesting that the alkalinity and high solubility of the amendments were able to neutralize the soil acidity. The dissolution of both Calciprill and sodium silicate occurred when the amendments were in contact with the soil water, to release exchangeable cations such as K+, Ca2+, Mg2+, and Na+ into the soil solution [12,15,55]. The sodium silicate increased the pH of the leachates because of the dissolved Na+ and SiO44− in the soil solution [15,16]. The increase in soil pH was also due to the reaction of CO32− ions to neutralize H+ ions in the soil solution to produce H2CO3, followed by breaking down into CO2 and H2O [56,57]. Furthermore, the amendments impeded Al3+, Fe2+, and Mn2+ from being hydrolysed to produce H+ ions, as is shown in Table 3. Notably, the pH of the leachates from the soils without any amendments (C0S0) increased from day 15 to day 20, followed by a decrease in the pH of leachates on days 25 and 30. The increase in the pH of the leachate of C0S0 from day 15 to day 20 could be due to the dissolution of silicate minerals in the Bekenu series soil that released SiO44− ions, which undergo hydrolysis and transform into silicic acid (H4SiO4) to release four OH ions that neutralize free H+ ions in the soil solution [13,14].
The effects of the Calciprill and sodium silicate on the EC of the leachates over 30 days of leaching are shown in Figure 2. The soil without any amendments (C0S0) resulted in the lowest EC throughout the leaching study with an increase from 0.023 dS m−1 on day 5 to 0.052 dS m−1 on day 10 and a decrease to 0.036 dS m−1 on day 15, followed by slight increments on day 20 (0.026 dS m−1), day 25 (0.029 dS m−1), and day 30 (0.035 dS m−1). The lowest EC was due to the low saturation of base cations because this soil is made up of highly weathered ferric oxide which forms kaolinite clay minerals that are poor in nutrient holding and prone to nutrient leaching. This low number of base cations in the soil without any amendments (C0S0) is the result of losses through leaching during high rainfall as simulated in this experiment. The Calciprill and sodium silicate increased the soil EC due to the dissolution of these amendments which released base cations such as K+, Ca2+, Mg2+, and Na+ into the soil solution. Furthermore, the EC of the leachates decreased with the increase in leaching time, suggesting that the continued leaching removed some of the soluble salts from the soils over time. It is noteworthy that, with the same amount of Calciprill (C1, C2, and C3), the EC of the leachates with the highest rate of sodium silicate (S5) was higher than those with lower rates of sodium silicate, indicating that the sodium silicate influences soil EC significantly due to its high Na+ content. This finding is comparable with that of Cramer [58] who reported that the higher charge density and ionic radius of Ca2+ (0.099 nm) compared with Na+ (0.097 nm) resulted in its stronger electrostatic attraction with CO32− ions, thus Na+ revealed a stronger influence on the EC of the leachates. However, the EC of the leachates did not exceed the saline threshold of 4.0 dS m−1, which implies that the soil solutions in this study will not cause salinity problems in crop cultivation [59].

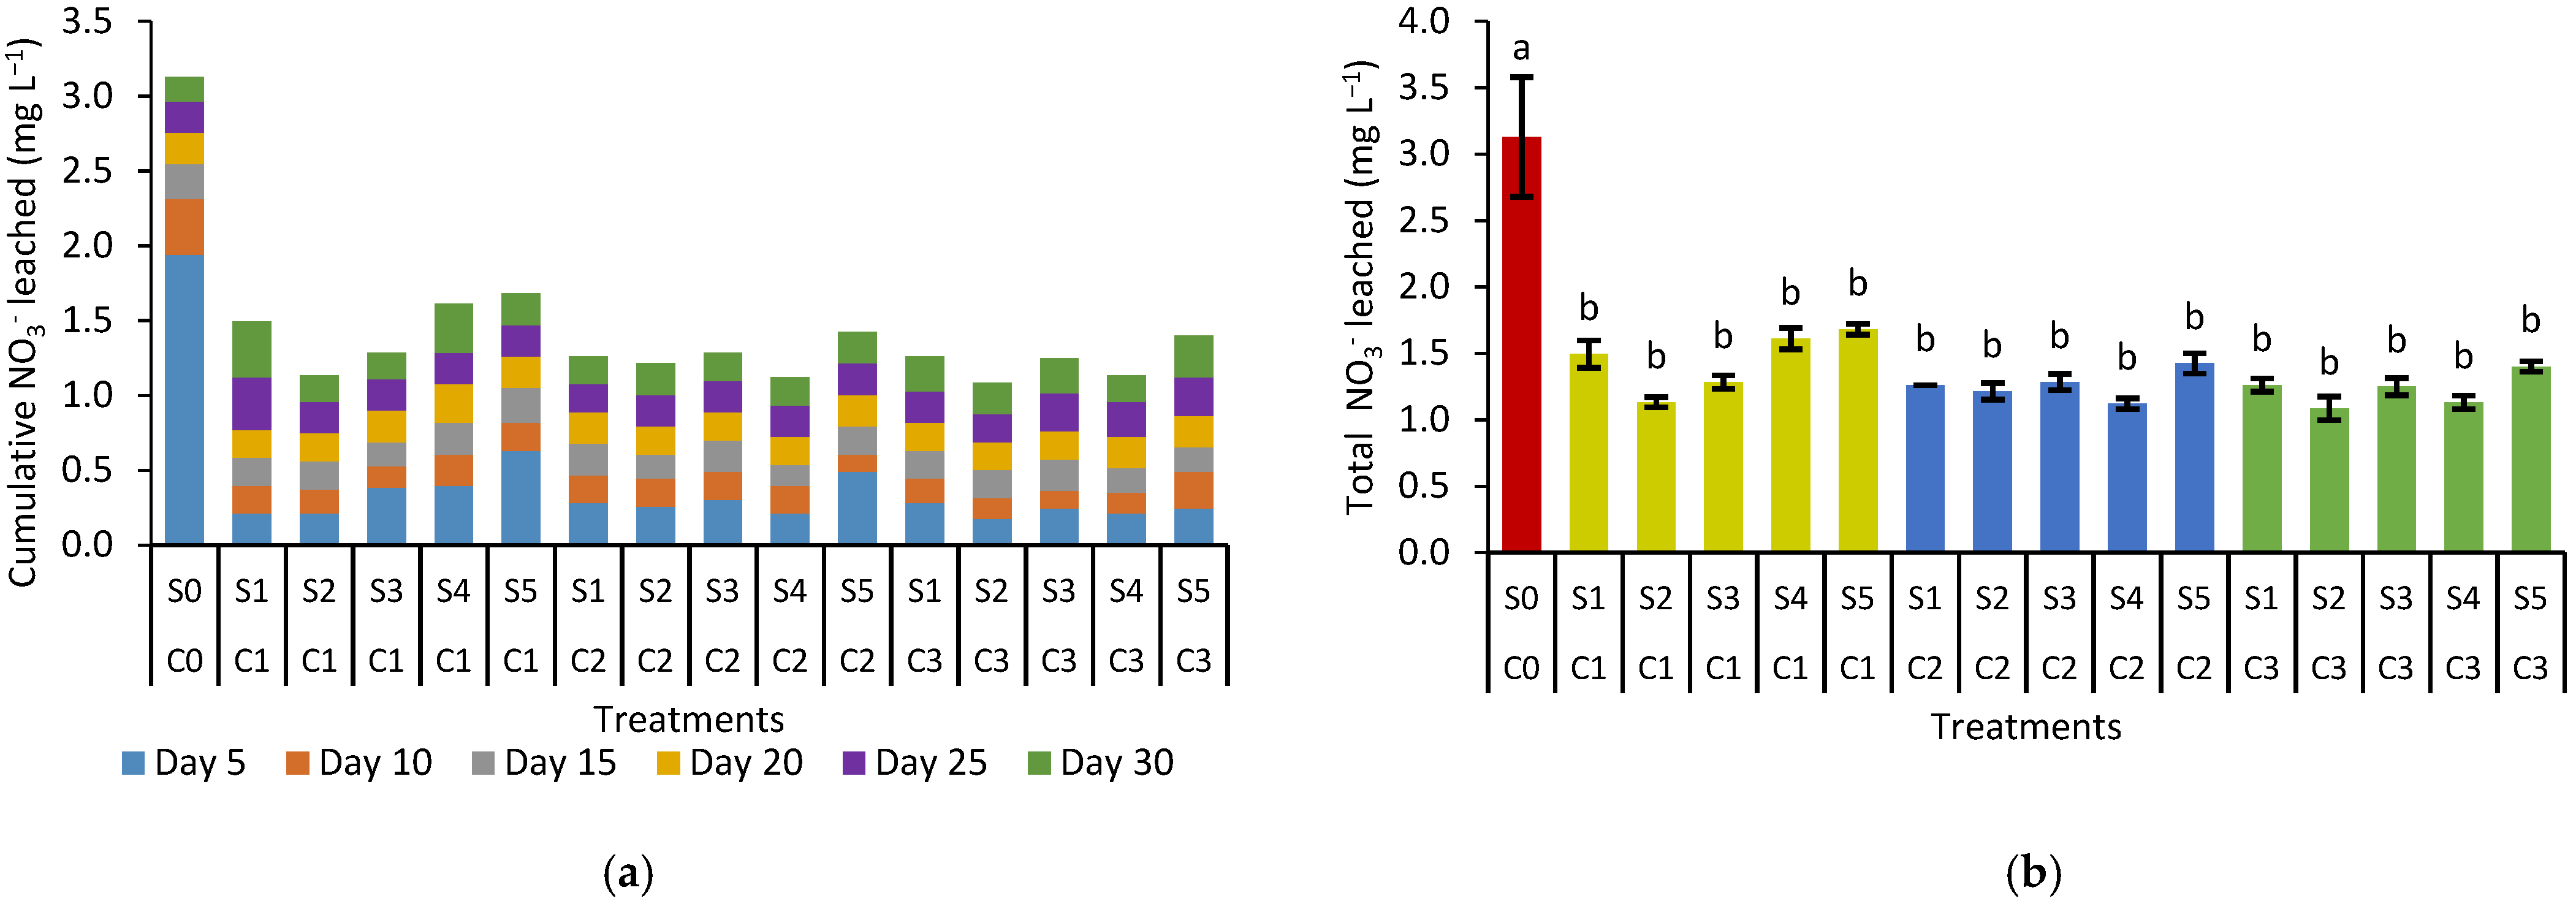
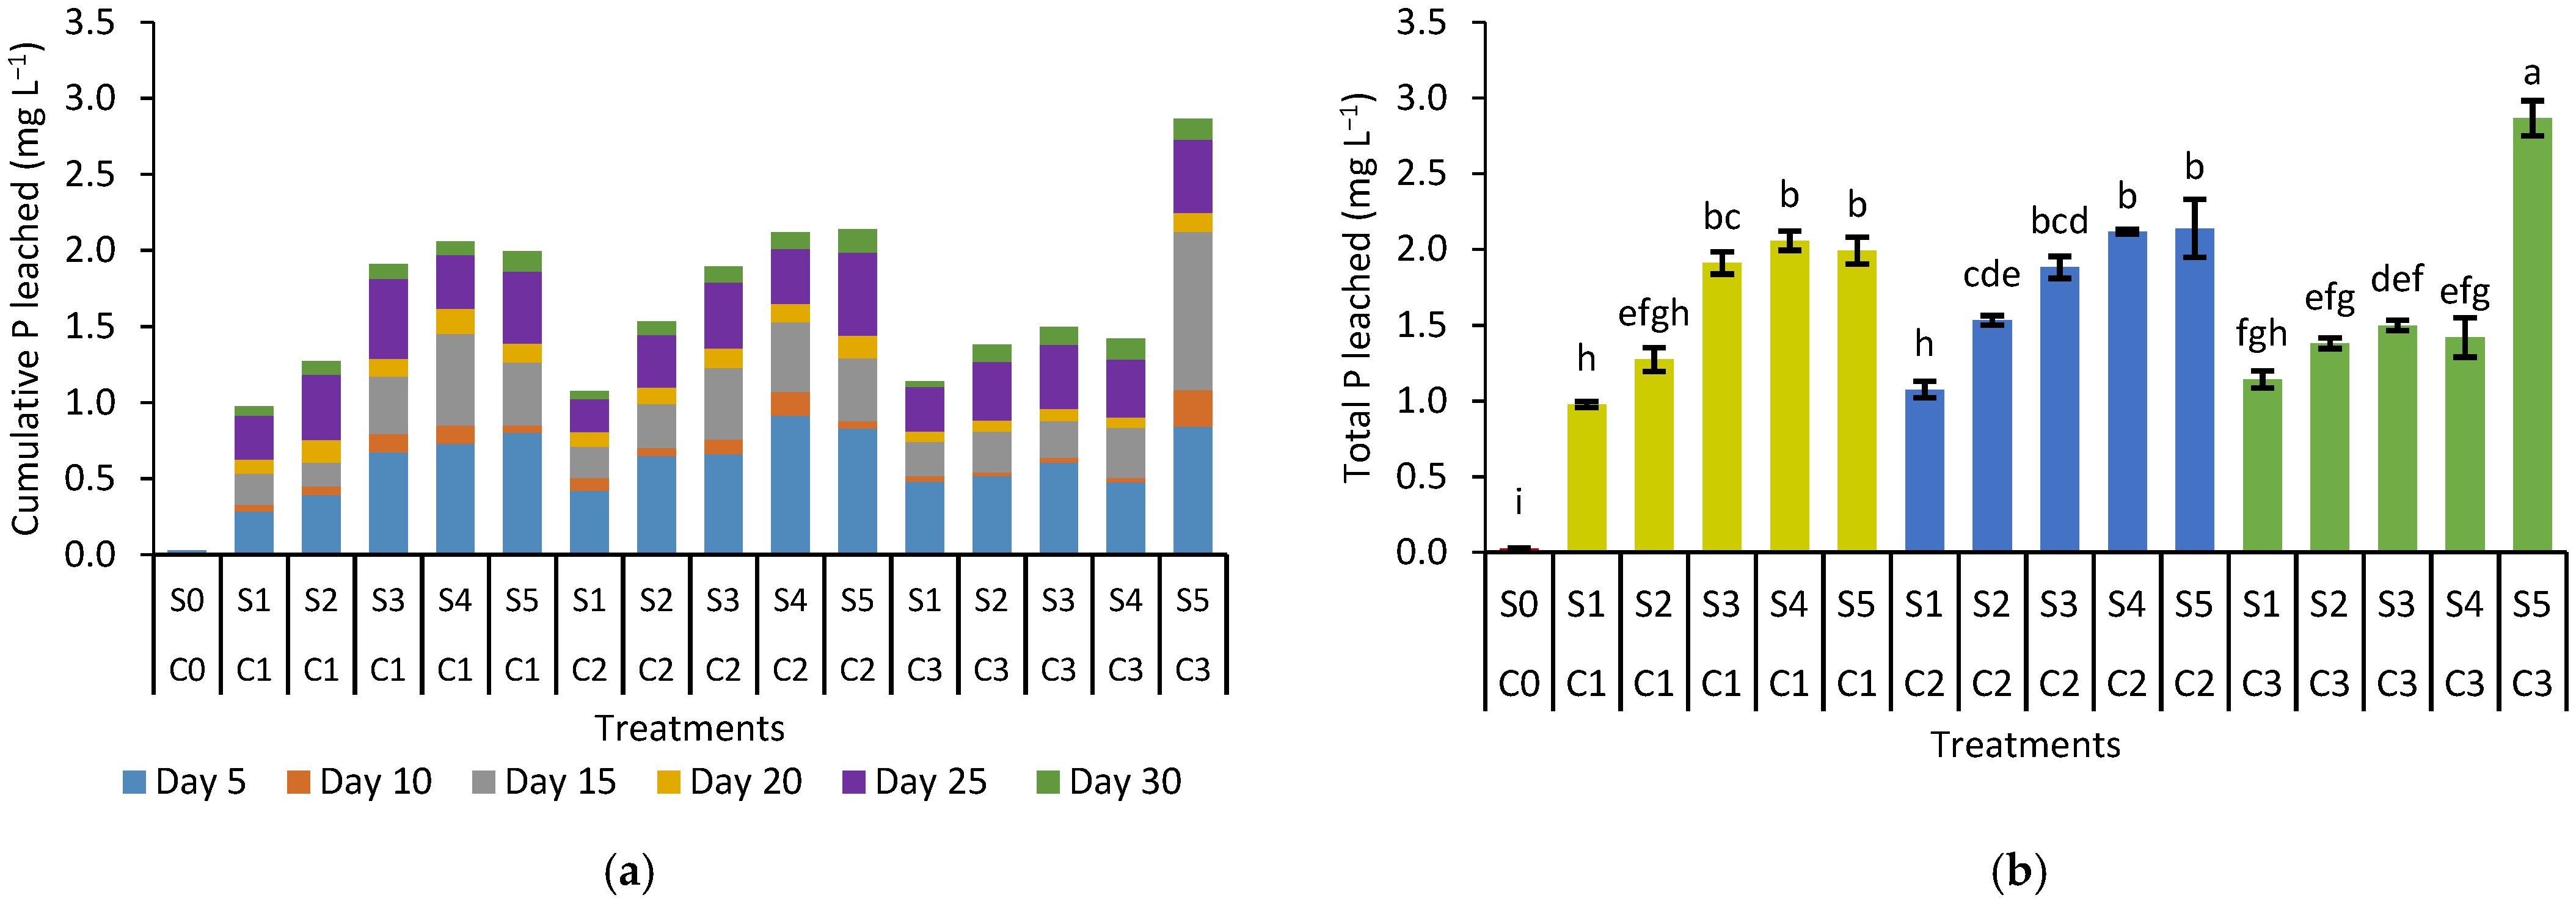
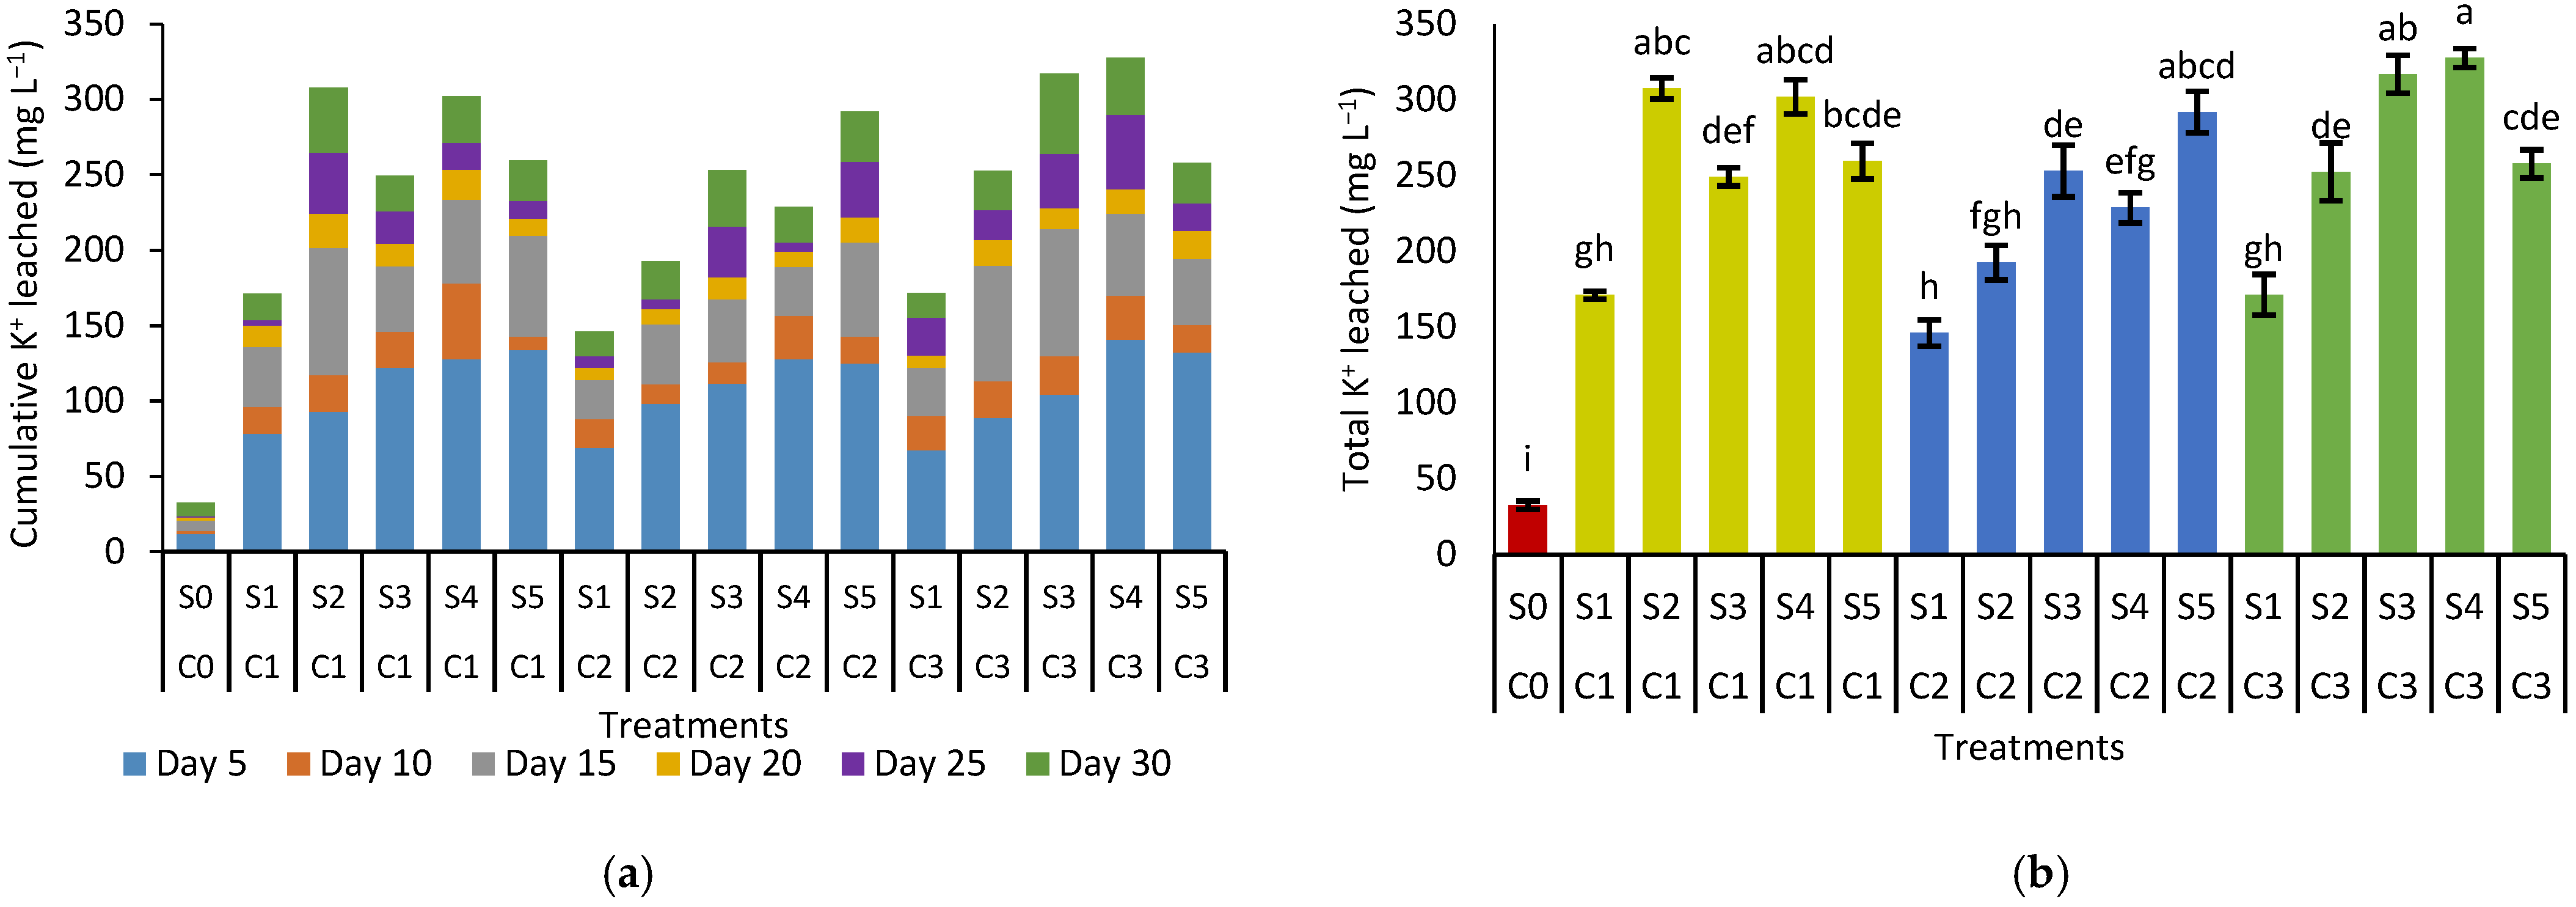
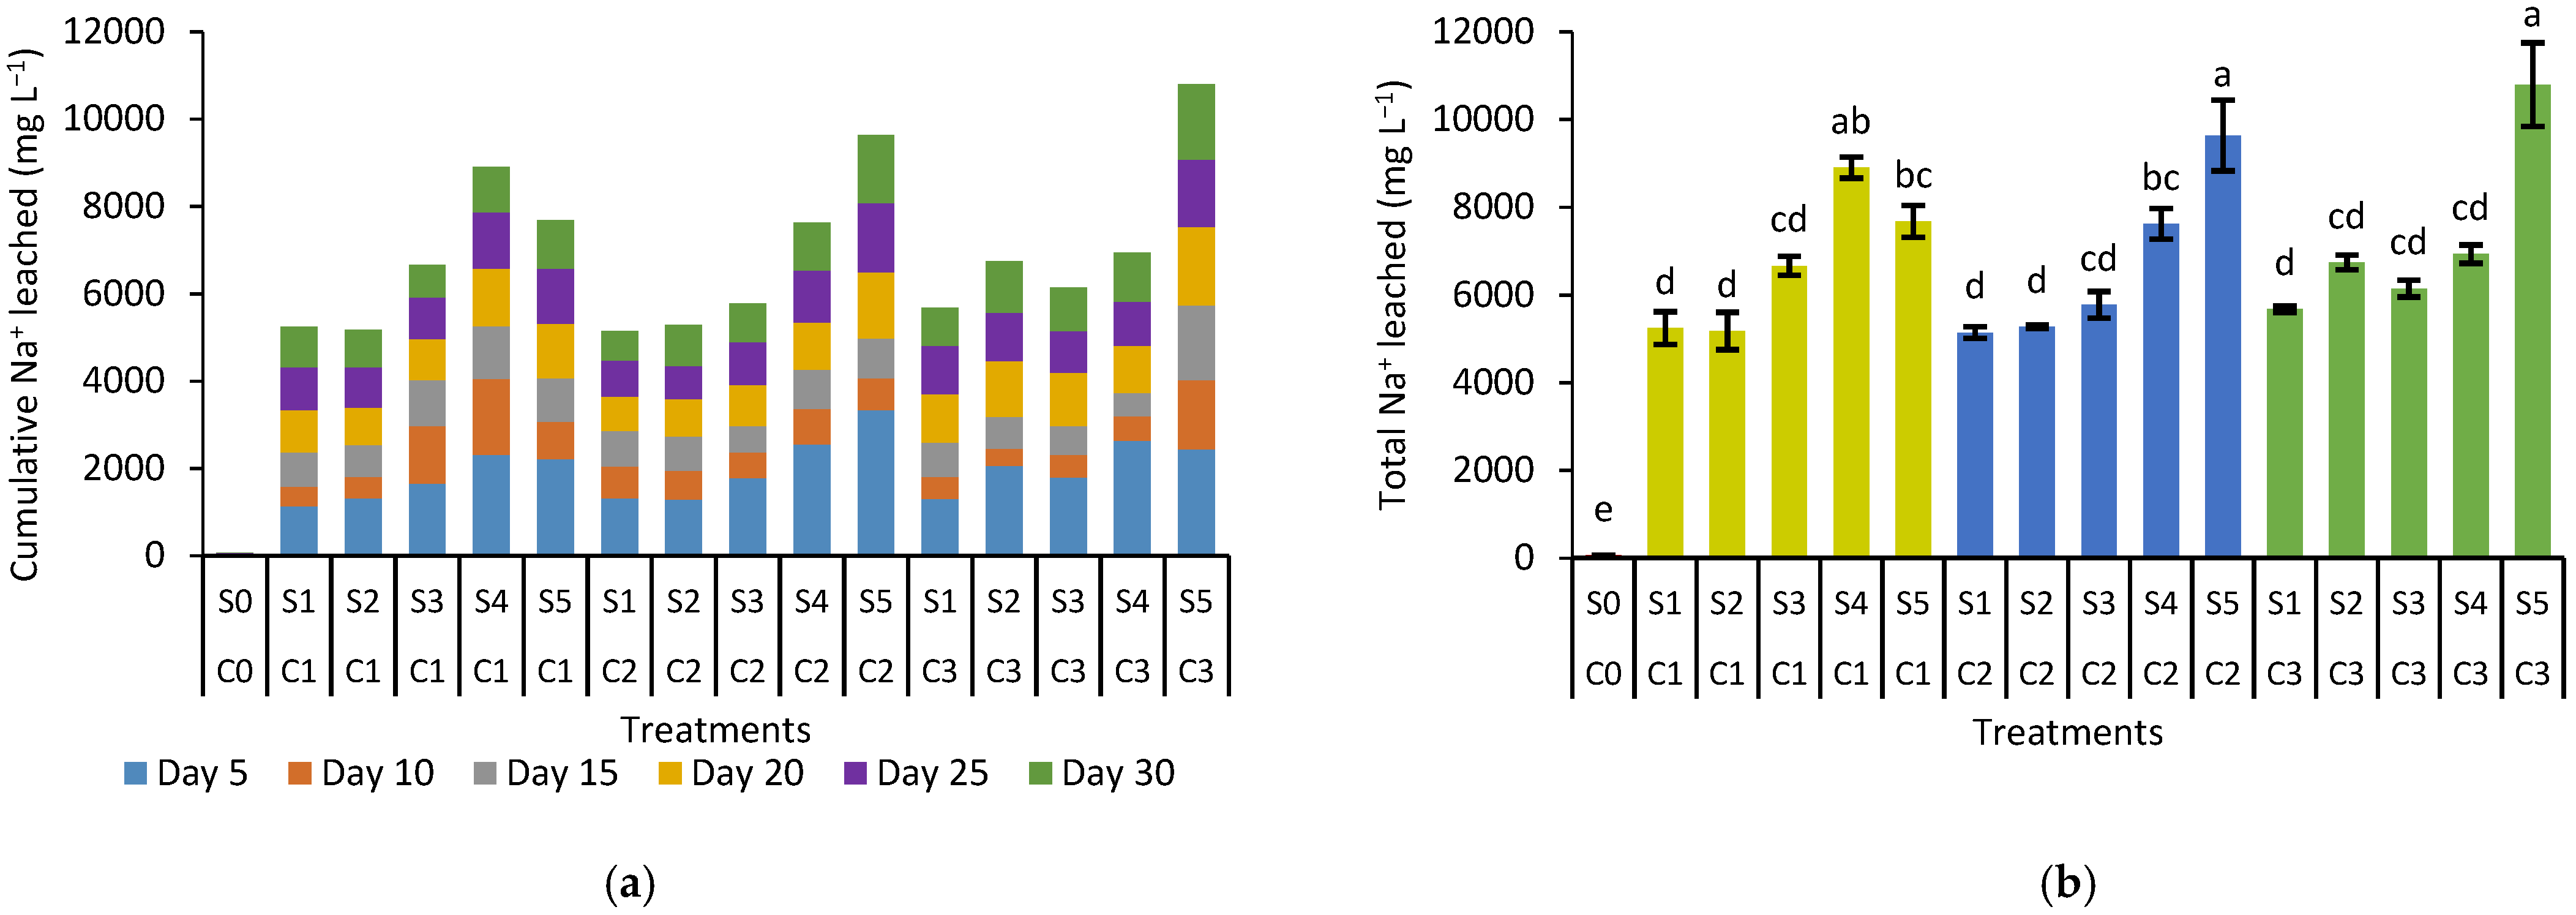
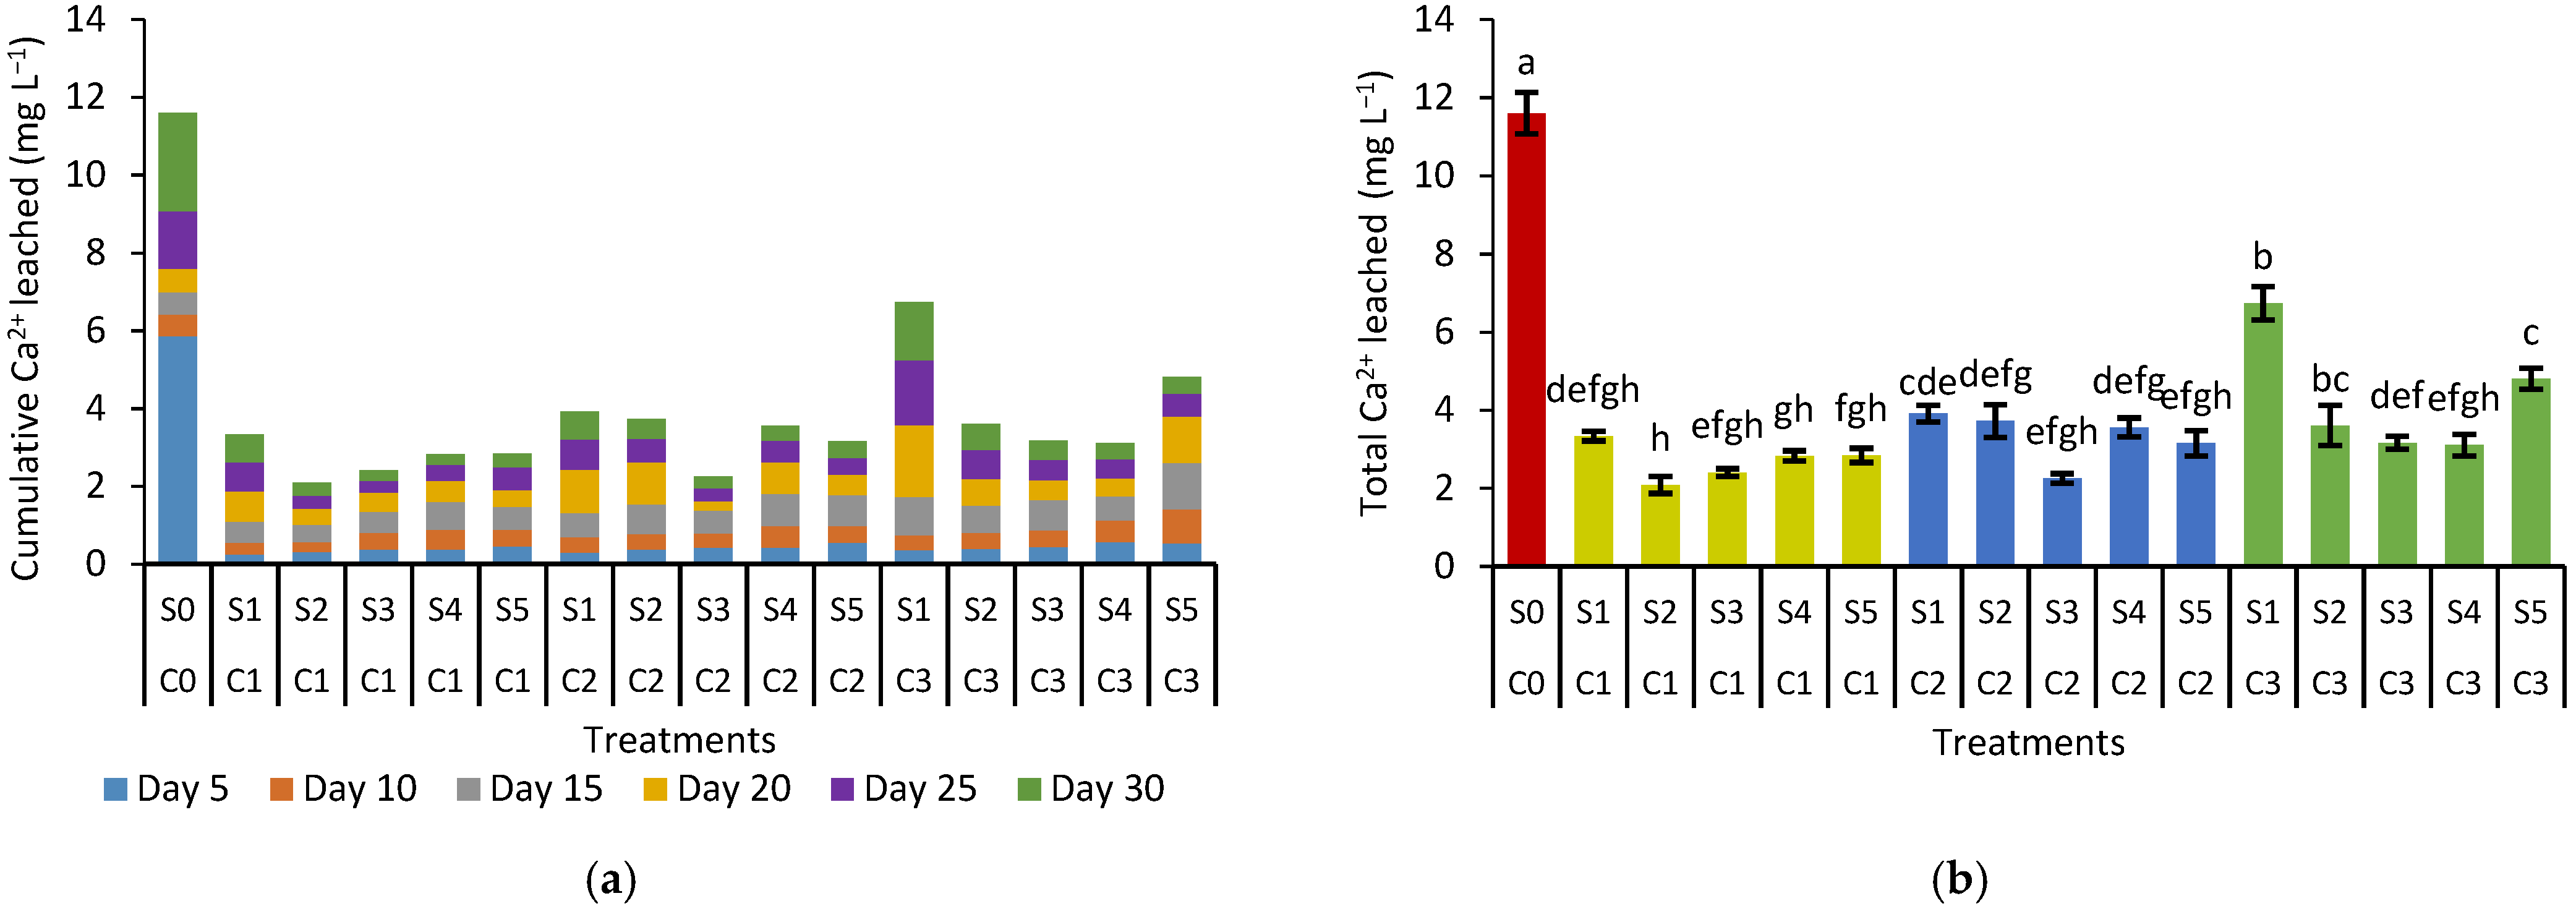
3.2. The Effects of the Co-Application of Calciprill and Sodium Silicate on the Nutrients in the Leachates

The effects of the co-application of Calciprill and sodium silicate on the cumulative concentrations of NH4+ leached over 30 days are presented in Figure 3a. The amount of NH4+ leached was highest for the soil without any amendments (C0S0) on day 5 but gradually decreased towards the end of the leaching study. In other words, the Calciprill and sodium silicate reduced the leaching of NH4+ by amounts ranging from 28.4% to 85.2% on day 5 of leaching. The amount of NH4+ leached from the soils with the amendments gradually increased towards the end of the leaching study. It was observed that the total NH4+ leached from the soils with Calciprill and sodium silicate in C2S5 (3.36 mg L−1) was higher than that for C0S0 (2.41 mg L−1) (Figure 3b). This suggests that Calciprill and sodium silicate significantly improved NH4+ in the soil solution because of the significant increase in soil pH. This finding is comparable with that of Binkley et al. [60] who reported that an increased soil pH facilitates the transformation of organic N into NH4+ in a soil solution via improved mineralization.
Figure 4a shows the cumulative concentrations of available NO3 leached over 30 days. The amount of available NO3 leached was highest in the soil without any amendments (C0S0), especially on day 5 and gradually decreased towards the end of the leaching study. This could be due to the significant amount of available NO3 released during a mineralization flush when dry soil, in the absence of plants, is rewetted at the onset of the rainy season [61], as was simulated in this leaching study. The total amount of available NO3 leached over 30 days was also higher for the soil without any amendments (C0S0) compared with the soils treated with the amendments (Figure 4b). The Calciprill and sodium silicate significantly reduced the leaching of NO3 by amounts ranging from 44.0% to 58.7%. This finding supports the fact that NO3 is easily leached from soils because of lack of interaction between NO3 and negatively charged adsorption sites [61], especially after the rewetting the soils which contributed to the highest availability of NO3 in the first leachate in comparison to the subsequent leachates. The significant increase in soil pH and ECEC caused by Calciprill and sodium silicate also reduced nitrification because the process of nitrification is favourable at lower a soil pH [12,62]. According to Ferguson and Pepper [63] and MacKown and Tucker [64], soils with higher ECEC adsorb more exchangeable NH4+ because the increased number of negatively-charged sites of soil particles impede nitrification in the soil solution. Furthermore, the reduced loss of available NO3 via leaching was partly due to the improved water holding capacity of the soils with Calciprill and sodium silicate compared with the soil without any amendments (C0S0). This finding is in consensus with related studies which have reported that the increased biogenic amorphous silica in the amended soils reduces hydraulic conductivity by elevating the negative water potential of soil water, leading to an increase in the soil water holding capacity and reduced nutrient leaching [6,36].
The cumulative amount of available P leached over 30 days in the soils treated with Calciprill and sodium silicate was consistently higher throughout the leaching study in comparison with the soil without any amendments (C0S0) (Figure 5a). These results are congruent with the higher total available P leached from the amended soils (Figure 5b). This was partly due to the increased soil pH and high solubility of sodium silicate. It has been reported that P availability increased because of the enhanced mineralization which was facilitated by soil microbial activities at a favourable soil pH range [55,65]. In addition, an increased soil pH transforms soil exchangeable Al3+ and Fe2+ in the soil solution into insoluble Al(OH)3 and Fe(OH)3 to unlock fixed P [66,67,68]. This reaction increases the soil available P in the soil. Moreover, the Si released from the sodium silicate mobilizes P from the soil adsorption sites because of the higher bonding affinity of Si to react with soil minerals, subsequently increasing the available P in the soil solution [69,70].
Generally, the concentrations of K+, Mg2+, and Na+ ions in the leachates from the soils treated with Calciprill and sodium silicate were higher compared with the soil without any amendments (C0S0) (Figure 6a, Figure 7a and Figure 8a). The amounts of K+, Mg2+, and Na+ ions leached were higher on day 5 but gradually decreased toward the end of the leaching study, suggesting that sodium silicate contributed to the rapid release of these base cations (K+, Mg2+, and Na+) into the soil solution within a short period. Figure 6b, Figure 7b and Figure 8b show the total concentration of K+, Mg2+, and Na+, respectively in the leachates over the 30 days of leaching. It was observed that the co-application of the amendments significantly increased the amount of the cations leached compared with the soil without any amendments (C0S0) because the Bekenu series is acidic and low in exchangeable cations saturation. The alkalinity of Calciprill and sodium silicate also contributed to an increased amount of these base cations being leached (Table 1).
The results also show that the total amount of K+ leached over 30 days increased with increasing amounts of sodium silicate applied but with the same application rate of Calciprill. Ernani et al. [71] reported that the application of CaCO3 can reduce the leaching of exchangeable K+ in soil because of the increased soil pH and the number of negatively-charged adsorption sites. This improves K+ retention in the topsoil. However, this does not corroborate with our results because of the high solubility of sodium silicate. Moayedi et al. [72] reported that sodium silicate is readily soluble in water to form an alkaline solution. This suggests that the rapid reaction of sodium silicate can release plant nutrients such as exchangeable K+, Na+, and SiO44− in the soil solution. Moreover, the amount of Mg2+ leached from the soils with Calciprill and sodium silicate was significantly higher compared with C0S0. This is related to the rapid dissolution of Calciprill to release Mg2+ in the leachates on day 5, followed by a gradual reduction in the subsequent leachates. This indicates that the Calciprill dissolved rapidly at the beginning of the leaching study and the dissolution decreased gradually because of the soil stabilization induced by the sodium silicate which reduces soil permeability. In contrast, unlike the inconsistent amounts of K+ and Mg2+ leached, the amount of Na+ leached increased with increasing rates of sodium silicate at the same rate of Calciprill (Figure 6b, Figure 7b and Figure 8b). This was due to the lower hydration energy of K+ and Mg2+ compared with Na+, thus suggesting that sodium silicate dissolved more readily than Calciprill when in contact with soil water because Na+ has a lower energy of adsorption and tends to bind more strongly with water molecules [73].
The amount of Ca2+ leached over 30 days was not similar to that for K+, Mg2+, and Na+ because Ca2+ in the leachates of the untreated soil (C0S0), regardless of time, was high (Figure 9a). Moreover, the total amount of Ca2+ leached over 30 days was higher for the soil without any amendments (C0S0) in comparison with the amended soils (Figure 9b). The results show that the leaching of Ca2+ was significantly reduced for the soils amended with Calciprill and sodium silicate compared with the soil without any amendments (C0S0) by amounts ranging from 33.0% to 74.8%. This was due to the dissolution of sodium silicate releasing Si that stabilizes the soil structure and reduces the permeability or porosity of the soil [74]. The reduced dissolution of Calciprill could be also another reason for the reduced leaching of Ca2+ from the soils following the co-application of Calciprill and sodium silicate. This is related to the alkaline soil pH (Table 3) and the increased concentrations of available P in the soil solution (Figure 7) which reduce the dissolution of Calciprill. In related studies, the use of flue-gas desulfurization gypsum (CaSO4) in broiler litter resulted in alkaline soils with a pH greater than 8, which causes the co-precipitation of CaCO3 because of the excessive solubility product of CaCO3 [75,76]. Moreover, phosphate tends to adsorb on the surfaces of CaCO3 to form insoluble Ca-phosphate precipitates which impede the dissolution of Calciprill for releasing Ca2+ ions when the soil pH is above 7.3 [77].

3.3. The Effects of the Co-Application of Calciprill and Sodium Silicate on Soil pH, Exchangeable Aluminium, Iron, and Manganese Hydrolysis

The effects of the co-application of Calciprill and sodium silicate on soil pH and exchangeable Al3+, Fe2+, and Mn2+ are presented in Table 3. The pH of the soil without any amendments (C0S0) decreased to 3.84 from the initial pH of 3.94 (Table 1) after 30 days of leaching. This was due to the continued leaching of exchangeable base cations (K+, Ca2+, Mg2+, and Na+) from the soil. On the other hand, the amendments significantly increased the soil pH to a range of 7.86 to 8.06 after 30 days of leaching. The significant increase in the soil pH was due to the reduction in soil exchangeable acidity and H+ ions in the soils after the co-application of Calciprill and sodium silicate. The soil pH also increased because of the release of CO32− ions from the Calciprill which neutralized H+ ions in the soil solution. The neutralization involves a binding reaction between H+ and CO32− ions to produce H2CO3 which breaks down after into CO2 and H2O [24,56,57].
In addition to this, base cations such as K+, Ca2+, Mg2+, and Na+ that were released by Calciprill and sodium silicate contributed to the increase in the soil pH by neutralization the H+ in the soils. Cai et al. [24] also reported that immobilization of H+ occurs upon application of amendments with higher base cations to acidic soils. This approach does not only improve soil productivity via increased base saturation, but it also reduces free exchangeable H+ ions in the soil solution through immobilization. In addition, the incomplete dissolution of Calciprill enables the retention of nutrients and improves the soil pH buffering capacity. This is because the negatively-charged sites on the surfaces of Calciprill can temporarily adsorb or bind with the essential plant nutrients such as available P and base cations. The continued dissolution of Calciprill with time can neutralize H+ released through nitrification and the cation exchange reaction by the nutrient uptake of plants [12].
Furthermore, the co-application of Calciprill and sodium silicate reduced soil exchangeable Al3+ from the initial 1.05 cmol(+) kg−1 (Table 1) to values ranging from 0.03 cmol(+) kg−1 to 0.05 cmol(+) kg−1 (Table 3). In contrast, the exchangeable Al3+ in the soil without any amendments (C0S0) was 0.85 cmol(+) kg−1, which was significantly higher compared with the soils that were treated with the amendments (Table 3). In other words, the Calciprill and sodium silicate significantly suppressed exchangeable Al3+ in the range of 94.1% to 96.5%. These findings suggest that the co-application of Calciprill and sodium silicate was effective in suppressing Al toxicity because these values are below the threshold for Al toxicity which is 0.8 cmol(+) kg−1 [78,79]. The amendments also reduced the soil exchangeable Fe2+ to the range 558.06 mg kg−1 to 720.93 mg kg−1 after 30 days of leaching. The Calciprill and sodium silicate significantly decreased exchangeable Fe2+ by amounts ranging from 61.8% to 70.4% compared with the amounts for the soil without any amendments (C0S0) which was 1887.08 mg kg−1 after 30 days of leaching (Table 3). Notably, C3S5 (7.80 g kg−1 Caciprill and 9.26 g kg−1 sodium silicate) was the most effective in reducing the soil exchangeable Fe2+ concentration to a value of 558.06 mg kg−1, suggesting that this treatment can be used to suppress Fe toxicity. These results can be explained by the increased soil pH resulting from the co-application of Calciprill and sodium silicate which is capable of supressing Al and Fe hydrolysis from producing H+ ions [56,57]. At a higher soil pH (6–7), exchangeable Al3+ and Fe2+ react with OH ions to precipitate as insoluble Al and Fe hydroxides [30,77,80]. The co-application of Calciprill and sodium silicate also significantly reduced soil exchangeable Mn2+ up to 25.3% (C1S3) after 30 days of leaching (Table 3). This was due to the significant increase in the soil pH which facilitated the transformation of Mn into oxide fractions via oxidation, thus suppressing Mn hydrolysis [81].

3.4. The Effects of the Co-Application of Calicprill and Sodium Silicate on Soil Electrical Conductivity and Nutrient Availability after Thirty Days of Leaching

The effects of the co-application of Calciprill and sodium silicate on soil EC are presented in Table 4. The soil EC significantly increased after the co-application of Calciprill and sodium silicate with values ranging from 0.23 dS m−1 to 0.32 dS m−1 compared with the soil without any amendments (C0S0) which resulted in 0.02 dS m−1. These significant changes in EC were due to the Ca2+ and Mg2+ ions of the Calciprill and Na+ and K+ ions of the sodium silicate (Table 1). The EC of the soils with the same application rate of Calciprill was significantly different because of the different application rates of sodium silicate. For the lowest Calciprill rate (C1), it was observed that the soil EC for C1S4 and C1S5 was significantly different from that for C1S1, CS2, and C1S3, suggesting that the sodium silicate is salty and its excessive use may cause soils to be saline which would impede soil and crop productivity. According to USDA [59], soil EC exceeding 4 dS m−1 causes soils to be saline and this will have detrimental effects on crop growth and the activities of microorganisms. In this study, the EC of all the soils did not exceed the toxic saline threshold, thus suggesting that the co-application rates of Calciprill and sodium silicate in this study will result in acceptable EC levels in future greenhouse and field trials with black pepper plants that will involve these treatments.
The effects of the co-application of Calciprill and sodium silicate on soil exchangeable NH4+, available NO3, and available P are presented in Table 5. After 30 days of leaching, exchangeable NH4+ in the soils with Calciprill and sodium silicate increased significantly for C1S1, C1S2, C1S3, C1S4, C1S5, C2S1, and C3S3 (63.51 mg kg−1 to 66.31 mg kg−1) compared with that for the soil without any amendments (C0S0) which resulted in a value of 42.03 mg kg−1 (Table 5). In other words, the Calciprill and sodium silicate significantly improved the availability of exchangeable NH4+ by amounts in the range of 51.1% to 57.8%. This was partly due to the increased soil pH with the amendments facilitating the transformation of organic N into inorganic NH4+ through enhanced mineralization [60]. Moreover, the improved soil ECEC by the amendments increased the soil’s negatively-charged sites to retain more exchangeable NH4+. This finding is comparable with those of Gasser [82] and Avnimelech and Laher [83] who reported that increased soil CEC can reduce NH4+ loss via volatilization because of enhanced NH4+ retention on the negatively-charged sites of the soil. However, the effects of the treatments with higher amounts of Calciprill regardless of the increasing rates of sodium silicate (C2S2, C2S3, C2S4, C2S5, C3S1, C3S2, C3S4, and C3S5) on soil exchangeable NH4+ were similar compared with that of the soil without any amendments (C0S0) (Table 5). This was probably due to the fact that some of the exchangeable NH4+ might be lost in the form of ammonia (NH3) gas during the leaching study because of increasing CaCO3 content in the soils of the aforementioned treatments. The finding is in agreement with that of Fenn and Kissel [84] who reported that the excessive application of CaCO3 can cause significant losses of soil exchangeable NH4+ through ammonium volatilization.
Available NO3 in the soil did not increase significantly with the co-application of Calciprill and sodium silicate after 30 days of leaching (Table 5). This can be explained by the high mobility of available NO3 in the soil, whereby available NO3 can leach from the soil. The lack of interaction between NO3 and the negatively charged adsorption of the sites was due to the repulsion of available NO3 by the negatively charged soil sites or surfaces [1,85,86]. The significant increase in the soil pH and ECEC caused by the co-application of Calciprill and sodium silicate also contributed to reduced nitrification which is favourable at a lower soil pH [12,62]. Soils with increased ECEC retain more exchangeable NH4+ on the negatively-charged sites of soil particles and this prevents exchangeable NH4+ from being nitrified into available NO3 [63,64]. Furthermore, both Calciprill and sodium silicate have low inorganic N contents (Table 1), thus the use of nitrogen-based fertilizers and organic amendments is essential to meet the crop N requirement in agricultural systems.
The soil available P in the soil significantly increased to range of 1.58 mg kg−1 to 1.74 mg kg−1 in the soils amended with Calciprill and sodium silicate (C1S2, C2S2, C2S4, C3S2, and C3S4) compared with the available P in the soil without any amendments (C0S0) which was 0.93 mg kg−1 (Table 5). The co-application of amendments significantly improved the availability of P in the soil, ranging from 70.0% to 87.1% compared with C0S0. This was partly due to the significant increase in the soil pH which unlocked the fixed P by suppressing Al and Fe concentrations [78]. The literature suggests that increased soil pH facilitates the binding reaction of exchangeable Al3+ and Fe2+ with OH ions to produce insoluble Al and Fe hydroxides and these reactions unlock available P in the soil [30,77,87]. On the other hand, the low available P in the soil without any amendments (C0S0) was partly due to the low soil pH (less than 5.5) which causes the available P to be fixed by exchangeable Al3+ and Fe2+ as insoluble Al-P and Fe-P compounds [67,88]. Moreover, Si released from the sodium silicate mobilized P from the exchangeable sites of the Fe minerals, which could have improved the availability of P in the soil. According to Schaller et al. [70], P mobilization positively correlates with increasing Si availability because of the high affinity of Si to bind with the soil minerals compared with P. This finding is consistent with that of Senn et al. [69] who reported that the replacement reaction of P by Si on the soil minerals resulted in increased P availability in the soil. Moreover, increased Si availability in the soil does not only increase soil pH, but it also reduces the resorption of P onto hydrolysed Al and Fe ions due to a higher Si affinity [89].
It was observed that available P in the soil did not increase consistently with the increasing amount of the amendments (Table 5). This could be due to the reaction of available P with exchangeable Ca2+ ions to produce Ca-P compounds which also relates to the incomplete dissolution of Calciprill, especially when soils are limed and have values above pH 7. When the soil pH is above 7.3, phosphate is adsorbed to the surface of CaCO3 to form insoluble Ca-phosphate compounds and this prevents the dissolution of CaCO3 [20,21]. These findings indicate why phosphate solubility is negatively correlated with soil pH because an increased soil pH can cause crystallization of phosphate into insoluble P compounds [90]. This is the reason why the optimum soil pH for maximizing soil P availability ranges from 6.5 to 7. Therefore, controlling soil pH is essential for P availability in soils [30]. In alkaline soils, exchangeable Na+ reacts with phosphate to from a soluble Na-P compound in the soil solution [87]. This suggests that the availability of P in the soil was influenced by Si, but not the Na released by sodium silicate.
Figure 10 illustrates the effects of the co-application of Calciprill and sodium silicate on soil exchangeable K+, Ca2+, Mg2+, and Na+. After 30 days of leaching, the soil exchangeable base cations significantly increased in the amended soils compared with the soil without any amendments (C0S0). This was due to the inherent contents of the base cations in the Calciprill and sodium silicate. Cai et al. [24] reported that the addition of soil amendments with higher base cations improved soil base saturation. After 30 days of leaching, exchangeable K+ in the soils with Calciprill and sodium silicate (C2S3, C2S4, C2S5, C3S1, C3S2, C3S3, C3S4, and C3S5) increased significantly to the range of 33.20 mg kg−1 to 46.20 mg kg−1 compared with that for the soil without any amendments (C0S0) which resulted in a value of 16.80 mg kg−1 (Table 5). In other words, the Calciprill and sodium silicate significantly increased the availability of exchangeable K+ from 97.6% to 175.0% after 30 days of leaching. This suggests that C2S3 (7.01 g Calciprill and 7.41 g sodium silicate per kilogram soil) is the minimum application rate to improve K+ availability in soil. Notably, C2S5 and C3S1 resulted in the highest exchangeable K+ which was 46.20 mg kg−1 and 44.53 mg kg−1, respectively (Figure 10a), suggesting that these treatments are effective for the K+ availability in soil.
Soil exchangeable Ca2+ significantly increased to a range of 812.00 mg kg−1 to 1428.53 mg kg−1 in all the soils treated with Calciprill and sodium silicate compared with C0S0 (1.20 mg kg−1) (Figure 10b). Based on Figure 10c, soil exchangeable Mg2+ for C1S2 (29.73 mg kg−1), C2S1 (27.60 mg kg−1), and C2S5 (27.07 mg kg−1) significantly increased compared with the other treatments including the soil without any amendments (C0S0) after 30 days of leaching, suggesting that these treatments are suitable for exchangeable Mg2+ availability. The inconsistent soil exchangeable Ca2+ and Mg2+ (Figure 10b,c) was due to the base cations not increasing with the increasing rates of Calciprill and sodium silicate, perhaps because of the incomplete dissolution of the Calciprill. The incomplete dissolution of Calciprill was probably due to the co-precipitation of CaCO3 in alkaline soils and the reaction of Ca with available P to produce insoluble Ca-phosphate precipitates on the surfaces of Calciprill. In related studies, the use of flue-gas desulfurization gypsum (CaSO4) in broiler litter resulted in excessive solubility product of CaCO3 which causes the co-precipitation of CaCO3 when the soil pH is greater than 8 [75,76]. These findings are comparable with our results wherein the co-application of Calciprill and sodium silicate resulted in alkaline soils and could have caused the co-precipitation of CaCO3, leading to the incomplete dissolution of Calciprill throughout the leaching study. Besides, when the soil pH is above 7.3, phosphate is adsorbed to the surface of CaCO3 to form insoluble Ca-phosphate precipitates which prevent the dissolution of Calciprill, resulting in the inconsistent results for soil exchangeable Ca2+ and Mg2+ [20,21]. On the other hand, the exchangeable Na+ increased consistently with the increasing amount of sodium silicate applied but with the same rate of Calciprill (Figure 10d). This suggests that exchangeable Na+ was influenced by the rate of sodium silicate partly because of its high inherent Na+ content and high solubility [33].

3.5. The Effects of the Co-Application of Calciprill and Sodium Silicate on Soil Effective Cation Exchangeable Capacity

The ECEC of the soils amended with Calciprill and sodium silicate significantly increased after 30 days of leaching compared with that of the soil without any amendments (C0S0) (Table 6). Notably, C2S5 showed the highest ECEC (17.82 cmol(+) kg−1), suggesting that it is the most suitable treatment for soil ECEC. High soil ECEC is related to increased soil pH and CaCO3 surfaces. Aprile and Lorandi [91] reported that ECEC is positively correlated with soil pH because of the negligible soil exchangeable acidity in alkaline soils. Furthermore, an incomplete dissolution of the Calciprill increased the soil CaCO3 and this contributed to an increased soil ECEC because the surfaces of CaCO3 are negatively charged to attract more divalent cations. This is indicative by the positive correlations between ECEC, soil pH, and CaCO3 in alkaline soils [12,92,93]. The findings of this study are comparable to that of Sdiri et al. [94] who reported that soils with higher CaCO3 saturations have higher ECEC because of increased surface charges compared with soils with high Al2O3 and Fe2O3. Nevertheless, the continued dissolution of Calciprill decreases soil ECEC especially when soil acidifying fertilizers such as urea are excessively applied because the increased amount of H+ expedites the dissolution of CaCO3. This reaction reduces CaCO3 surfaces which serve as the adsorption sites for base cations [18]. The importance of this is that soil management should be performed sustainably to maintain soil productivity.

3.6. The Effects of the Co-Application of Calciprill and Sodium Silicate on the Soil pH Buffering Capacity

The significant relationships (R2 > 0.8) between the amount of H+ or OH added per one kilogram soil and soil pH suggests that pH buffering capacity reflects the sensitivity of the soils to acidification (Table 7). The soils amended with Calciprill and sodium silicate (except for C1S1, C1S4, C1S5, C2S2, and C2S3) had a significantly improved pH buffering capacity compared with the soil without any amendments (C0S0) (Figure 11). In other words, soil without any amendments (C0S0) demonstrated the lowest pH buffering capacity because the soil pH increased more significantly when OH ions were added. This is because the soil was made up of highly weathered parent material which breaks down into kaolinite clay minerals with high concentrations of Al and Fe oxides which resulted in the formation of an acidic soil that is prone to leaching. Besides, the pH buffering capacity did not increase with the increasing amount of the amendments. This is related to the inconsistent dissolution of Calciprill throughout the leaching study. On the other hand, the significant increase in the pH buffering capacity was partly due to the increased amount of CaCO3 and the improved soil ECEC of the soils treated with the amendments. The incomplete dissolution of Calciprill after 30 days of leaching suggests that the continued dissolution of CaCO3 can increase pH buffering in alkaline soils [7]. Zhang et al. [12] reported that soil ECEC enhances the pH buffering capacity compared with soil CaCO3. This is possible because the CaCO3 content must range between 2.5% and 5.7% to maintain the pH buffering capacity effectively [95,96]. According to Cai et al. [24] and Zhang et al. [12], ECEC plays an essential role in the ion exchange reactions between soil H+ and base cations on the adsorption sites of soil minerals. The co-application of Calcirpill and sodium silicate accelerates the release of H+ ions into the soil solution from the soil adsorption sites and re-adsorbed from the base cations, because this approach increases the soil base saturation. The continued dissolution of the Calciprill over time can neutralize H+ released through nitrification and base cation uptake by plants to increase the pH buffering capacity.

4. Conclusions

The co-application of Calciprill and sodium silicate is an effective soil management approach to improve soil nutrient retention and the pH buffering capacity of Bekenu series soil. The high solubility of sodium silicate facilitates rapid and consistent liming effects to increase the soil pH for suppressing exchangeable Al3+, Fe2+, and Mn2+. This enhanced exchangeable NH4+, available P, and exchangeable base cations (K+, Ca2+, Mg2+, and Na+) availability after 30 days of leaching. These findings indicate that the co-application of Calciprill and sodium silicate could be adopted by farmers to mitigate soil acidity and increase nutrient availability for improving agronomic efficiency in highly weathered acidic soils. For soil nutrient retention, this approach significantly reduced the leaching of NO3 and Ca2+. The incomplete dissolution of Calciprill is one of the reasons for the reduced leaching of NO3 because the improved ability of ECEC to adsorb more exchangeable NH4+, which resulted in reduced nitrification. Besides, the co-precipitation of Calciprill in alkaline soils (pH > 8) resulted from the rapid solubility of sodium silicate and the adsorption of phosphates onto the surface of CaCO3 reduced leaching of Ca2+. The findings reveal that the high solubility and soil structure stabilizing effect of sodium silicate of sodium silicate protects the Calciprill from leaching and runoff, thus improving the longevity of the Calciprill in the soils to enhance pH buffering capacity. The approach also improved the pH buffering capacity of Bekenu series via increased soil pH, ECEC, and CaCO3. The higher availability of exchangeable NH4+, available P, and exchangeable base cations (K+, Mg2+, and Na+) in the leachate from the soils after the co-application of Calciprill and sodium silicate due to the rapid solubility of sodium silicate to release readily available nutrient for plant uptake. The findings of this study suggest that it is possible to combine the use of Calciprill and sodium silicate for regulating soil nutrient availability and improve soil pH buffering capacity of highly weathered acidic soils in cropping systems. The most suitable amendment in this study is 7.01 g Calciprill and 9.26 g sodium silicate (C2S5) per kilogram soil. However, the absence of plants in this laboratory leaching study did not allow for elucidating plant-soil interactions. Further studies are necessary to validate these findings in greenhouse and field trials involving plants.

Author Contributions

Conceptualization, J.F.N. and O.H.A.; methodology, J.F.N., O.H.A. and M.B.J.; investigation, J.F.N.; resources, K.H.P.; writing—original draft preparation, J.F.N. and O.H.A.; writing—review and editing, O.H.A. and M.B.J.; visualization, J.F.N.; supervision, O.H.A., L.O., M.B.J. and Y.M.K.; project administration, O.H.A., M.B.J., L.O., A.A.M. and K.H.P.; funding acquisition, O.H.A., M.B.J., L.O., A.A.M. and K.H.P. All authors have read and agreed to the published version of the manuscript.

Funding

This research was funded by Humibox Sdn. Bhd., Kuala Lumpur, Malaysia (Grant number: 6300920) and Omya Asia Pacific Sdn. Bhd., Kuala Lumpur, Malaysia (Grant numbers: 6300923 and TLS2001).

Institutional Review Board Statement

Not applicable.

Informed Consent Statement

Not applicable.

Data Availability Statement

Not applicable.

Acknowledgments

The authors would like to thank Universiti Putra Malaysia, Universiti Malaysia Sabah, and Management and Science University for the collaborative research with Humibox Sdn. Bhd., Malaysia and Omya Asia Pacific Sdn. Bhd., Malaysia.

Conflicts of Interest

The authors declare no conflict of interest.

References

  1. Lehmann, J.; da Silva, J.P.; Steiner, C.; Nehld, T.; Zech, W.; Glaser, B. Nutrient availability and leaching in an archaeological Anthrosol and a Ferralsol of the Central Amazon basin: Fertilizer, manure and charcoal amendments. Plant Soil 2003, 249, 343–357. [Google Scholar] [CrossRef]
  2. Sunmer, M.E.; Noble, A.D. Soil Acidification: The World Story. In Handbook of Soil Acidity; Renge, Z., Ed.; CRC Press: New York, NY, USA, 2003; pp. 1–28. [Google Scholar] [CrossRef]
  3. Narro, L.; Pandey, S.; León, C.; De Salazar, F.; Arias, M.P. Implications of Soil-Acidity Tolerant Maize Cultivars to Increase Production in Developing Countries. In Plant Nutrient Acquisition; Ae, N., Arihara, J., Okada, K., Srinivasa, A., Eds.; Springer: Tokyo, Japan, 2001; pp. 447–463. [Google Scholar] [CrossRef]
  4. von Uexküll, H.R.; Mutert, E. Global extent, development and economic impact of acid soils. Plant Soil 1995, 171, 1–15. [Google Scholar] [CrossRef]
  5. Shamshuddin, J.; Wan, N. Classification and Management of Highly Weathered Soils in Malaysia for Production of Plantation Crops. In Principles, Application and Assessment in Soil Science, 1st ed.; Gungor, E.B.O., Ed.; InTech: Rijeka, Croatia, 2011; Volume 1, pp. 75–86. [Google Scholar] [CrossRef] [Green Version]
  6. Kuo, Y.L.; Lee, C.H.; Jien, S.H. Reduction of nutrient leaching potential in coarse-textured soil by using biochar. Water 2020, 12, 2012. [Google Scholar] [CrossRef]
  7. Bowman, W.D.; Cleveland, C.C.; Halada, Ĺ.; Hreško, J.; Baron, J.S. Negative impact of nitrogen deposition on soil buffering capacity. Nat. Geosci. 2008, 1, 767–770. [Google Scholar] [CrossRef]
  8. Fageria, N.K.; Nascente, A.S. Management of Soil Acidity of South American Soils for Sustainable Crop Production. Adv. Agron. 2014, 128, 221–275. [Google Scholar] [CrossRef]
  9. Laird, D.; Fleming, P.; Wang, B.; Horton, R.; Karlen, D. Biochar impact on nutrient leaching from a Midwestern agricultural soil. Geoderma 2010, 158, 436–442. [Google Scholar] [CrossRef] [Green Version]
  10. Lalande, R.; Gagnon, B.; Royer, I. Impact of natural or industrial liming materials on soil properties and microbial activity. Can. J. Soil Sci. 2009, 89, 209–222. [Google Scholar] [CrossRef]
  11. Barber, S.A. Liming materials and practices. In Soil Acidity and Liming, 2nd ed.; Adams, F., Ed.; American Society of Agronomy and Soil Science Society of America: Madison, WI, USA, 1984; Volume 12, pp. 171–209. [Google Scholar] [CrossRef]
  12. Zhang, Y.; Zhang, S.; Wang, R.; Cai, J.; Zhang, Y.; Li, H.; Huang, S.; Jiang, Y. Impacts of fertilization practices on pH and the pH buffering capacity of calcareous soil. Soil Sci. Plant Nutr. 2016, 62, 432–439. [Google Scholar] [CrossRef]
  13. Baba, M.; Okazaki, M. Changes in aluminum pools of andisols due to soil acidification. Soil Sci. Plant Nutr. 2000, 46, 797–805. [Google Scholar] [CrossRef] [Green Version]
  14. Hinsinger, P.; Bolland, M.D.A.; Gilkes, R.J. Silicate rock powder: Effect on selected chemical properties of a range of soils from Western Australia and on plant growth as assessed in a glasshouse experiment. Fertil. Res. 1995, 45, 69–79. [Google Scholar] [CrossRef]
  15. Ramos, L.A.; Nolla, A.; Korndörfer, G.H.; Pereira, H.S.; De Camargo, M.S. Reactivity of soil acidity correctives and conditioners in lysimeters. Rev. Bras. Ciência Solo 2006, 30, 849–857. [Google Scholar] [CrossRef] [Green Version]
  16. Antonangelo, J.A.; Neto, J.F.; Crusciol, C.A.C.; Alleoni, L.R.F. Lime and calcium-magnesium silicate in the ionic speciation of an oxisol. Sci. Agric. 2017, 74, 317–333. [Google Scholar] [CrossRef] [Green Version]
  17. Rovira, P.; Vallejo, V.R. Changes in δ13C composition of soil carbonates driven by organic matter decomposition in a Mediterranean climate: A field incubation experiment. Geoderma 2008, 144, 517–534. [Google Scholar] [CrossRef]
  18. Plan, L. Factors controlling carbonate dissolution rates quantified in a field test in the Austrian alps. Geomorphology 2005, 68, 201–212. [Google Scholar] [CrossRef]
  19. Oulehle, F.; Jones, T.G.; Burden, A.; Copper, M.D.A.; Lebron, I.; Zieliński, P.; Evans, C.D. Soil-solution partitioning of DOC in acid organic soils: Results from a UK field acidification and alkalization experiment. Eur. J. Soil Sci. 2013, 64, 787–796. [Google Scholar] [CrossRef]
  20. Karageorgiou, K.; Paschalis, M.; Anastassakis, G.N. Removal of phosphate species from solution by adsorption onto calcite used as natural adsorbent. J. Hazard. Mater. 2007, 139, 447–452. [Google Scholar] [CrossRef] [PubMed]
  21. Perassi, I.; Borgnino, L. Adsorption and surface precipitation of phosphate onto CaCO3-montmorillonite: Effect of pH, ionic strength and competition with humic acid. Geoderma 2014, 232–234, 600–608. [Google Scholar] [CrossRef]
  22. Shi, R.Y.; Li, J.Y.; Ni, N.; Xu, R.K. Understanding the biochar’s role in ameliorating soil acidity. J. Integr. Agric. 2019, 18, 1508–1517. [Google Scholar] [CrossRef]
  23. Peng, X.; Ye, L.L.; Wang, C.H.; Zhou, H.; Sun, B. Temperature- and duration-dependent rice straw-derived biochar: Characteristics and its effects on soil properties of an Ultisol in southern China. Soil Tillage Res. 2011, 112, 159–166. [Google Scholar] [CrossRef]
  24. Cai, Z.; Wang, B.; Xu, M.; Zhang, H.; He, X.; Zhang, L.; Gao, S. Intensified soil acidification from chemical N fertilization and prevention by manure in an 18-year field experiment in the red soil of southern China. J. Soils Sediments 2015, 15, 260–270. [Google Scholar] [CrossRef]
  25. Johan, P.D.; Ahmed, O.H.; Omar, L.; Hasbullah, N.A. Charcoal and Sago Bark Ash on pH Buffering Capacity and Phosphorus Leaching. Agronomy 2021, 11, 2223. [Google Scholar] [CrossRef]
  26. Hamidi, N.H.; Ahmed, O.H.; Omar, L.; Ch’ng, Y.H.; Johan, P.D.; Paramisparam, P.; Jalloh, M.B. Acid Soils Nitrogen Leaching and Buffering Capacity Mitigation Using Charcoal and Sago Bark Ash. Agronomy 2021, 11, 11808. [Google Scholar] [CrossRef]
  27. Paramisparam, P.; Ahmed, O.H.; Omar, L.; Ch’ng, H.Y.; Johan, P.D.; Hamidi, N.H. Co-Application of Charcoal and Wood Ash to Improve Potassium Availability in Tropical Mineral Acid Soils. Agronomy 2021, 11, 2081. [Google Scholar] [CrossRef]
  28. Johan, P.D.; Ahmed, O.H.; Omar, L.; Hasbullah, N.A. Phosphorus transformation in soils following co-application of charcoal and wood ash. Agronomy 2021, 11, 2010. [Google Scholar] [CrossRef]
  29. Hamidi, N.H.; Ahmed, O.H.; Omar, L.; Ch’ng, Y.H. Soil Nitrogen Sorption Using Charcoal and Wood Ash. Agronomy 2021, 11, 1801. [Google Scholar] [CrossRef]
  30. Brady, N.C.; Weil, R.R. The Nature and Properties of Soils, 14th ed.; Pearson Education: Upper Saddle River, NJ, USA, 2008. [Google Scholar]
  31. Högberg, P.; Fan, H.; Quist, M.; Binkley, D.; Tamm, C.O. Tree growth and soil acidification in response to 30 years of experimental nitrogen loading on boreal forest. Glob. Chang. Biol. 2006, 12, 489–499. [Google Scholar] [CrossRef]
  32. Pagani, A.; Mallarino, A.P. Comparison of methods to determine crop lime requirement under field conditions. Soil Sci. Soc. Am. J. 2012, 76, 1855–1866. [Google Scholar] [CrossRef]
  33. Madurwar, K.V.; Dahale, P.P.; Burile, A.N. Comparative Study of Black Cotton Soil Stabilization with RBI Grade 81 and Sodium Silicate. Int. J. Innov. Res. Sci. Eng. Technol. 2013, 2, 493–499. [Google Scholar] [CrossRef]
  34. Larsson, S. Binder distribution in lime—Cement columns. In Proceedings of the Institution of Civil Engineers-Ground Improvement; ICE Publishing: London, UK, 2001; pp. 111–122. [Google Scholar] [CrossRef]
  35. Lindh, P. Optimising binder blends for shallow stabilisation of fine-grained soils. In Proceedings of the Institution of Civil Engineers-Ground Improvement; ICE Publishing: London, UK, 2001; Volume 5, pp. 23–34. [Google Scholar] [CrossRef]
  36. Schaller, J.; Cramer, A.; Carminati, A.; Zarebanadkouki, M. Biogenic amorphous silica as main driver for plant available water in soils. Sci. Rep. 2020, 10, 1–8. [Google Scholar] [CrossRef] [Green Version]
  37. Paramananthan, S. Malaysian Soil Taxonomy, 3rd ed.; Agricultural Crop Trust and Param Agricultural Soil Surveys (M) Sdn. Bhd.: Petaling Jaya, Malaysia, 2020; pp. 1–244. [Google Scholar]
  38. Soil Survey Staff. Soil Taxonomy: A Basic System of Soil Classification for Making and Interpreting Soil Surveys, 2nd ed.; USDA-Natural Resources Conservation Service: Washington, DC, USA, 1999.
  39. Peech, H.M. Hydrogen-ion activity. In Methods of Soil Analysis, Part 2: Chemical and Microbiological Properties; Norman, A.G., Ed.; American Society of Agronomy and Soil Science Society of America: New York, NY, USA, 1965; Volume 1, pp. 914–926. [Google Scholar] [CrossRef]
  40. Keeney, D.R.; Nelson, D.W. Nitrogen-Inorganic Forms. In Methods of Soil Analysis, Part 2: Chemical and Microbiological Properties; Page, A.L., Ed.; American Society of Agronomy and Soil Science Society of America: New York, NY, USA, 1982; Volume 1, pp. 643–698. [Google Scholar] [CrossRef]
  41. Mehlich, A. Determination of P, Ca, Mg, K, Na, NH4; Short Test Methods Used in Soil Testing Division, Department of Agriculture: Raleigh, NC, USA, 1953; Volume 1, p. 8. Available online: http://www.ncagr.gov/agronomi/pdffiles/mehlich53.pdf (accessed on 4 November 2019).
  42. Murphy, J.; Riley, J.P. A modified single solution method for the determination of phosphate in natural waters. Anal. Chim. Acta 1962, 27, 31–36. [Google Scholar] [CrossRef]
  43. Rowell, D.L. Soil acidity and alkalinity. In Soil Science: Methods and Applications, 1st ed.; Pearson Education Limited: New York, NY, USA, 1994; Volume 1, pp. 153–174. [Google Scholar]
  44. Pansu, M.; Gautheyrou, J. Exchangeable Cations. In Handbook of Soil Analysis, 1st ed.; Goodfellow, D., Ed.; Springer: Berlin/Heidelberg, Germany, 2006; Volume 9, pp. 667–676. [Google Scholar] [CrossRef]
  45. Cantarella, H.; van Raij, B.; Quaggio, J.A. Soil and plant analyses for lime and fertilizer recommendations in Brazil. Commun. Soil Sci. Plant Anal. 1998, 29, 1691–1706. [Google Scholar] [CrossRef]
  46. Meiwes, K.J. Application of lime and wood ash to decrease acidification of forest soils. Water Air Soil Pollut. 1995, 85, 143–152. [Google Scholar] [CrossRef]
  47. Bazilevich, N.I. The Biological Productivity of North Eurasian Ecosystems; RAS Institute of Geography: Moscow, Russia, 1993; Volume 293. [Google Scholar]
  48. Malaysian Pepper Board. Laporan Kajian Verifikasi Hasil; Malaysian Pepper Board: Kuching, Malaysia, 2017; p. 11.
  49. USDA Natural Resources Conservation Service. Soil Health Quality Indicators: Available Water Capacity. Available online: https://www.nrcs.usda.gov/Internet/FSE_DOCUMENTS/nrcs142p2_053288.pdf (accessed on 23 November 2021).
  50. Aitken, R.L.; Moody, P.W. The effect of valence and ionic strength on the measurement of pH buffer capacity. Aust. J. Soil Res. 1994, 32, 975–984. [Google Scholar] [CrossRef]
  51. Wong, M.T.F.; Wittwer, K. Evaluation of rapid buffer methods to estimate pH buffer capacity of highly weathered soils from south west of Western Australia. In Proceedings of the 19th World Congress of Soil Science: Symposium 3.1.1: Further Development of Soil Evaluation Methods: Soil Solutions for a Changing World, Brisbane, Australia, 1–6 August 2010; pp. 57–60. [Google Scholar]
  52. Costello, R.C.; Sullivan, D.M. Determining the pH buffering capacity of compost via titration with dilute sulfuric acid. Waste Biomass Valorization 2014, 5, 505–513. [Google Scholar] [CrossRef]
  53. Xu, R.; Zhao, A.; Yuan, J.; Jiang, J. pH buffering capacity of acid soils from tropical and subtropical regions of China as influenced by incorporation of crop straw biochars. J. Soils Sediments 2012, 12, 494–502. [Google Scholar] [CrossRef]
  54. Kissel, D.E.; Sonon, L.S.; Cabrera, M.L. Rapid Measurement of Soil pH Buffering Capacity. Soil Nutr. Manag. Soil Plant Anal. 2012, 76, 694–699. [Google Scholar] [CrossRef]
  55. Opala, P.A.; Okalebo, J.R.; Othieno, C.O. Effects of Organic and Inorganic Materials on Soil Acidity and Phosphorus Availability in a Soil Incubation Study. ISRN Agron. 2012, 2012, 1–10. [Google Scholar] [CrossRef] [Green Version]
  56. Thomas, G.W.; Hargrove, W.L. The Chemistry of Soil Acidity. In Soil Acidity and Liming, 2nd ed.; Adams, F., Ed.; American Society of Agronomy and Soil Science Society of America: Madison, WI, USA, 1984; Volume 12, pp. 3–56. [Google Scholar] [CrossRef]
  57. Ritchie, G.S.P. Role of dissolution and precipitation of minerals in controlling soluble aluminium in acidic soils. Adv. Agron. 1994, 53, 47–83. [Google Scholar] [CrossRef] [Green Version]
  58. Cramer, G.R. Sodium-calcium Interactions under Salinity Stress. In Salinity: Environment—Plants—Molecules, 1st ed.; Läuchli, A., Lüttge, U., Eds.; Kluwer Academic: Dordrecht, The Netherlands, 2002; Volume 1, pp. 205–227. [Google Scholar]
  59. USDA Natural Resources Conservation Service. Soil Health Quality Indicators: Chemical Properties, Soil Electrical Conductivity. Available online: https://www.nrcs.usda.gov/wps/portal/nrcs/detail/soils/health/assessment/?cid=stelprdb1237387 (accessed on 13 April 2021).
  60. Binkley, D.; Bell, R.; Solllins, P. Comparison of methods for estimating soil nitrogen transformations in adjacent conifer and alder-conifer forests. Can. J. For. Res. 1992, 22, 858–863. [Google Scholar] [CrossRef]
  61. Lehmann, J.; Schroth, G. Nutrient leaching. In Trees, Crop and Soil Fertility: Concepts and Research Methods, 1st ed.; Schroth, G., Sinclair, F.L., Eds.; CABI Publshing: London, UK, 2003; pp. 151–166. [Google Scholar] [CrossRef]
  62. Weier, K.L.; Gilliam, J.W. Effect of Acidity on Nitrogen Mineralization and Nitrification in Atlantic Coastal Plain Soils. Soil Sci. Soc. Am. J. 1986, 50, 1210–1214. [Google Scholar] [CrossRef]
  63. Ferguson, G.A.; Pepper, I.L. Ammonium Retention in Sand Amended with Clinoptilolite. Soil Sci. Soc. Am. J. 1987, 51, 231–234. [Google Scholar] [CrossRef]
  64. MacKown, C.T.; Tucker, T.C. Ammonium Nitrogen Movement in a Coarse-Textured Soil Amended with Zeolite. Soil Sci. Soc. Am. J. 1985, 49, 235–238. [Google Scholar] [CrossRef]
  65. Laboski, C.A.M.; Lamb, J.A. Changes in soil test phosphorus concentration after application of manure or fertilizer. Soil Sci. Soc. Am. J. 2003, 67, 544–554. [Google Scholar] [CrossRef]
  66. Zu, C.; Wu, H.S.; Tan, L.H.; Yu, H.; Yang, J.F.; Li, Z.G. Analysis of Correlation between Soil pH and Nutrient Concentrations across Hainan Black Pepper Advantage Region. Chin. J. Trop. Crop. 2012, 33, 1174–1179. [Google Scholar]
  67. Ifansyah, H. Soil pH and Solubility of Aluminum, Iron, and Phosphorus in Ultisols: The Roles of Humic Acid. J. Trop. Soils 2014, 18, 203–208. [Google Scholar] [CrossRef]
  68. Shenker, M.; Chen, Y. Increasing Iron Availability to Crops: Fertilizers, Organo-Fertilizers, and Biological Approaches. Soil Sci. Plant Nutr. 2005, 51, 1–17. [Google Scholar] [CrossRef] [Green Version]
  69. Senn, A.C.; Kaegi, R.; Hug, S.J.; Hering, J.G.; Mangold, S.; Voegelin, A. Composition and structure of Fe(III)-precipitates formed by Fe(II) oxidation in water at near-neutral pH: Interdependent effects of phosphate, silicate and Ca. Geochim. Cosmochim. Acta 2015, 162, 220–246. [Google Scholar] [CrossRef] [Green Version]
  70. Schaller, J.; Faucherre, S.; Joss, H.; Obst, M.; Goeckede, M.; Planer-Friedrich, B.; Peiffer, S.; Glifedder, B.; Elberling, B. Silicon increases the phosphorus availability of Arctic soils. Sci. Rep. 2019, 9, 1–11. [Google Scholar] [CrossRef] [Green Version]
  71. Ernani, P.R.; Mantovani, A.; Scheidt, F.R.; Nesi, C. Liming Decreases the Vertical Mobility of Potassium in Acidic Soils. Commun. Soil Sci. Plant Anal. 2012, 43, 2544–2549. [Google Scholar] [CrossRef]
  72. Moayedi, H.; Asadi, A.; Huat, B.K.K.; Moayedi, F.; Kazemian, S. Enhancing Electrokinetic Environment to Improve Physicochemical Properties of Kaolinite Using Polyvinyl Alcohol and Cement Stabilizers. Int. J. Electrochem. Sci. 2011, 6, 2526–2540. [Google Scholar]
  73. Mengel, K. Potassium. In Principles of Plant Nutrition, 1st ed.; Braker, A.V., Pilbeam, D.J., Eds.; CRC Press: Boca Raton, FL, USA, 2007; Volume 1, pp. 481–511. [Google Scholar]
  74. Moayedi, H. Stabilization of organic soil using sodium silicate system grout. Int. J. Phys. Sci. 2012, 7, 1395–1402. [Google Scholar] [CrossRef]
  75. Burt, C.D.; Cabrera, M.L.; Rothrock, M.J.; Kissel, D.E. Urea Hydrolysis and Calcium Carbonate Precipitation in Gypsum-Amended Broiler Litter. J. Environ. Qual. 2018, 47, 162–169. [Google Scholar] [CrossRef] [PubMed] [Green Version]
  76. Mishra, A.; Cabrera, M.L.; Kissel, D.E.; Rema, J.A. Gypsum Effect on Nitrogen Mineralization and Ammonia Volatilization from Broiler Litter. Soil Sci. Soc. Am. J. 2013, 77, 2045–2049. [Google Scholar] [CrossRef]
  77. Adnan, A.; Mavinic, D.S.; Koch, F.A. Pilot-scale study of phosphorus recovery through struvite crystallization—Examining the process feasibility. J. Environ. Eng. Sci. 2003, 2, 315–324. [Google Scholar] [CrossRef]
  78. Rahman, Z.A.; Gikonyo, E.W.; Silek, B.; Goh, K.J.; Soltangheisi, A. Evaluation of phosphate rock sources and rate of application on oil palm yield grown on peat soils of Sarawak, Malaysia. J. Agron. 2014, 13, 12–22. [Google Scholar] [CrossRef] [Green Version]
  79. Ch’ng, H.Y.; Ahmed, O.H.; Majid, N.M.A. Minimizing phosphorus sorption and leaching in a tropical acid soil using Egypt rock phosphate with organic amendments. Philipp. Agric. Sci. 2016, 99, 176–185. [Google Scholar]
  80. Moir, J.L.; Moot, D.J. Medium-term soil pH and exchangeable aluminium response to liming at three high country locations. Proc. New Zeal. Grassl. Assoc. 2014, 76, 41–46. [Google Scholar] [CrossRef]
  81. Sims, J.T. Soil pH effects on the distribution and plant availability of manganese, copper, and zinc. Soil Sci. Soc. Am. J. 1986, 50, 367–373. [Google Scholar] [CrossRef]
  82. Gasser, J.K.R. Some factors affecting losses of ammonia from urea and ammonium sulphate applied to soils. J. Soil Sci. 1964, 15, 258–272. [Google Scholar] [CrossRef]
  83. Avnimelech, Y.; Laher, M. Ammonia Volatilization from Soils: Equilibrium Considerations. Soil Sci. Soc. Am. J. 1977, 41, 1080–1084. [Google Scholar] [CrossRef]
  84. Fenn, L.B.; Kissel, D.E. Ammonia Volatilization from Surface Applications of Ammonium Compounds on Calcareous Soils: IV. Effect of Calcium Carbonate Content. Soil Sci. Soc. Am. J. 1975, 39, 631–633. [Google Scholar] [CrossRef]
  85. Smaling, E.M.A.; Stoorvogel, J.J.; Windmeijer, P.N. Calculating soil nutrient balances in Africa at different scales—II. District scale. Fertil. Res. 1993, 35, 237–250. [Google Scholar] [CrossRef]
  86. Schroth, G.; Ferreira Da Silva, L.; Seixas, R.; Geraldes Teixeira, W.; Macêdo, J.L.V.; Zech, W. Subsoil Accumulation of Mineral Nitrogen under Polyculture and Monoculture Plantations, Fallow and Primary Forest in a Ferralitic Amazonian Upland Soil. Agric. Ecosyst. Environ. 1999, 75, 109–120. [Google Scholar] [CrossRef]
  87. Whitelaw, M.A. Growth Promotion of Plants Inoculated with Phosphate-Solubilizing Fungi. Adv. Agron. 1999, 69, 99–151. [Google Scholar] [CrossRef]
  88. Gao, S.; Wang, C.; Pei, Y. Comparison of different phosphate species adsorption by ferric and alum water treatment residuals. J. Environ. Sci. 2013, 25, 986–992. [Google Scholar] [CrossRef]
  89. Koski-Vähälä, J.; Hartikainen, H.; Tallberg, P. Phosphorus Mobilization from Various Sediment Pools in Response to Increased pH and Silicate Concentration. J. Environ. Qual. 2001, 30, 546–552. [Google Scholar] [CrossRef]
  90. Tunesi, S.; Poggi, V.; Gessa, C. Phosphate adsorption and precipitation in calcareous soils: The role of calcium ions in solution and carbonate minerals. Nutr. Cycl. Agroecosyst. 1999, 53, 219–227. [Google Scholar] [CrossRef]
  91. Aprile, F.; Lorandi, R. Evaluation of Cation Exchange Capacity (CEC) in Tropical Soils Using Four Different Analytical Methods. J. Agric. Sci. 2012, 4, 278–289. [Google Scholar] [CrossRef] [Green Version]
  92. Tertre, E.; Page, J.; Beaucaire, C. Ion Exchange Model for Reversible Sorption of Divalent Metals on Calcite: Implications for Natural Environments. Environ. Sci. Technol. 2012, 46, 10055–10062. [Google Scholar] [CrossRef] [PubMed]
  93. Zhao, X.; Jiang, T.; Du, B. Effect of organic matter and calcium carbonate on behaviors of cadmium adsorption—Desorption on/from purple paddy soils. Chemosphere 2014, 99, 41–48. [Google Scholar] [CrossRef] [PubMed]
  94. Sdiri, A.; Higashi, T.; Chaabouni, R.; Jamoussi, F. Competitive removal of heavy metals from aqueous solutions by montmorillonitic and calcareous clays. Water Air Soil Pollut. 2012, 223, 1191–1204. [Google Scholar] [CrossRef]
  95. Najafi, S.; Jalali, M. Effect of heavy metals on pH buffering capacity and solubility of Ca, Mg, K, and P in non-spiked and heavy metal-spiked soils. Environ. Monit. Assess. 2016, 188, 1–11. [Google Scholar] [CrossRef] [PubMed]
  96. Rogovska, N.P.; Blackmer, A.M.; Mallarino, A.P. Relationships between Soybean Yield, Soil pH, and Soil Carbonate Concentration. Soil Sci. Soc. Am. J. 2007, 71, 1251–1256. [Google Scholar] [CrossRef]
Figure 1. pH of leachates for the different treatments over 30 days of leaching.
Agronomy 12 00219 g001
Figure 2. Electrical conductivity of leachates for the different treatments over 30 days of leaching.
Agronomy 12 00219 g002
Figure 3. (a) Cumulative ammonium in leachates at five day intervals and (b) total ammonium in leachates for the different treatments after thirty days of leaching. Different letters indicate significant mean differences using Tukey’s HSD test at p ≤ 0.05. Error bars represent the standard error of the mean.
Agronomy 12 00219 g003
Figure 4. (a) Cumulative available nitrate in leachates at five day intervals and (b) total available nitrate in leachates for the different treatments after thirty days of leaching. Different letters indicate significant mean differences using Tukey’s HSD test at p ≤ 0.05. Error bars represent the standard error of the mean.
Agronomy 12 00219 g004
Figure 5. (a) Cumulative phosphorus in leachates at five day intervals and (b) total phosphorus in leachates for the different treatments after thirty days of leaching. Different letters indicate significant mean differences using Tukey’s HSD test at p ≤ 0.05. Error bars represent the standard error of the mean.
Agronomy 12 00219 g005
Figure 6. (a) Cumulative potassium in leachates at five day intervals and (b) total potassium in leachates for the different treatments after thirty days of leaching. Different letters indicate significant mean differences using Tukey’s HSD test at p ≤ 0.05. Error bars represent the standard error of the mean.
Agronomy 12 00219 g006
Figure 7. (a) Cumulative magnesium in leachates at five-day intervals and (b) total magnesium in leachates for the different treatments after thirty days of leaching. Different letters indicate significant mean differences using Tukey’s HSD test at p ≤ 0.05. Error bars represent the standard error of the mean.
Agronomy 12 00219 g007
Figure 8. (a) Cumulative sodium in leachates at five day intervals and (b) total sodium in leachates for the different treatments after thirty days of leaching. Different letters indicate significant mean differences using Tukey’s HSD test at p ≤ 0.05. Error bars represent the standard error of the mean.
Agronomy 12 00219 g008
Figure 9. (a) Cumulative calcium in leachates at five day intervals and (b) total calcium in leachates for the different treatments after thirty days of leaching. Different letters indicate significant mean differences using Tukey’s HSD test at p ≤ 0.05. Error bars represent the standard error of the mean.
Agronomy 12 00219 g009
Figure 10. Soil exchangeable (a) potassium, (b) calcium, (c) magnesium, and (d) sodium for the different treatments after thirty days of leaching. Different letters indicate significant mean differences using Tukey’s HSD test at p ≤ 0.05. Error bars represent the standard error of the mean.
Agronomy 12 00219 g010
Figure 11. Soil pH buffering capacity for the different treatments after thirty days of leaching. Different letters indicate significant mean differences using Tukey’s HSD test at p ≤ 0.05. Error bars represent the standard error of the mean.
Agronomy 12 00219 g011
Table 1. Initial chemical properties of Bekenu series (Typic Paleudult), Calciprill, and sodium silicate.
Chemical PropertiesValue Determined (Mean ± Standard Error)
SoilCalciprillSodium Silicate
pHKCl3.94 ± 0.017.77 ± 0.0212.96 ± 0.03
EC (dS m−1)0.009 ± 0.013.11 ± 0.12113.17 ± 1.45
(%)
Exchangeable Na+0.001 ± 0.0000.19 ± 0.00310.07 ± 0.06
Total Sin.d.n.d.71.33 ± 0.08
(mg kg−1)
Exchangeable NH4+
Available NO3
28.02 ± 0.00
15.88 ± 0.93
7.47 ± 0.93
8.41 ± 0.00
8.41 ± 0.00
12.14 ± 0.93
Available P1.24 ± 0.081.18 ± 0.0610.90 ± 0.69
Exchangeable K+76.0 ± 21.2311.7 ± 11.3260.3 ± 2.7
Exchangeable Ca2+17.1 ± 4.79696.8 ± 100.21.41 ± 0.01
Exchangeable Mg2+20.4 ± 0.8104.23 ± 1.531.87 ± 0.06
Exchangeable Fe2+476.9 ± 24.849.2 ± 3.830.3 ± 1.1
Exchangeable Mn2+6.1 ± 0.26.6 ± 0.117.9 ± 0.5
(cmol(+) kg−1)
Exchangeable Al3+1.03 ± 0.01n.d.n.d.
Cation Exchange Capacity7.70 ± 0.06n.d.n.d.
n.d. represents not determined.
Table 2. Details of the application rates of Calciprill and sodium silicate treatments for the soil leaching study.
TreatmentTreatment DescriptionApplication Rate
Targeted Calcium Saturation (%)Application Rate per Hectare Soil (kg ha−1)CalciprillSodium Silicate
g kg−1 Soil
C0S0--00
C1S180906.225.55
C1S2801056.226.48
C1S3801206.227.41
C1S4801356.228.33
C1S5801506.229.26
C2S190907.015.55
C2S2901057.016.48
C2S3901207.017.41
C2S4901357.018.33
C2S5901507.019.26
C3S1100907.805.55
C3S21001057.806.48
C3S31001207.807.41
C3S41001357.808.33
C3S51001507.809.26
Note: C0S0 represents soil without any amendments.
Table 3. Mean soil pHKCl, exchangeable aluminium, iron, and manganese for the different treatments after thirty days of leaching.
TreatmentpHKClExchangeable Al3+
(cmol(+) kg−1)
Exchangeable Fe2+Exchangeable Mn2+
(mg kg−1)
C0S03.84 f ± 0.020.85 a ± 0.0801887.1 a ± 11.34.87 a ± 0.03
C1S17.89 de ± 0.040.03 b ± 0.003679.9 bcd ± 21.23.95 bcd ± 0.14
C1S27.94 bcde ± 0.020.03 b ± 0.000630.5 bcd ± 19.43.72 cd ± 0.23
C1S38.00 abcd ± 0.020.03 b ± 0.003664.4 bcd ± 11.43.64 d ± 0.18
C1S48.00 abc ± 0.010.04 b ± 0.003689.8 bc ± 20.64.05 abcd ± 0.20
C1S58.01 abc ± 0.020.04 b ± 0.006707.4 b ± 13.14.00 bcd ± 0.13
C2S17.86 e ± 0.030.04 b ± 0.003720.9 b ± 42.04.47 abcd ± 0.08
C2S27.94 bcde ± 0.020.05 b ± 0.003662.4 bcd ± 10.34.01 bcd ± 0.14
C2S37.97 abcde ± 0.010.03 b ± 0.003666.3 bcd ± 18.04.41 abcd ± 0.08
C2S48.03 ab ± 0.010.04 b ± 0.003644.1 bcd ± 19.43.94 bcd ± 0.03
C2S57.98 abcd ± 0.020.03 b ± 0.003600.1 bcd ± 27.13.97 bcd ± 0.01
C3S17.90 cde ± 0.030.03 b ± 0.006603.9 bcd ± 38.84.44 abcd ± 0.14
C3S27.93 bcde ± 0.010.03 b ± 0.003608.7 bcd ± 17.54.65 ab ± 0.02
C3S38.00 abcd ± 0.010.03 b ± 0.003581.8 cd ± 35.24.47 abcd ± 0.15
C3S48.02 ab ± 0.030.03 b ± 0.003572.0 cd ± 12.94.52 abc ± 0.13
C3S58.06 a ± 0.010.03 b ± 0.006558.1 d ± 31.24.38 abcd ± 0.09
Means (value ± standard error) with different letters within the same column indicate significant differences using Tukey’s test with p ≤ 0.05.
Table 4. Mean soil electrical conductivity for the different treatments after thirty days of leaching.
TreatmentSoil EC (dS m−1)
C0S00.015 g ± 0.001
C1S10.234 f ± 0.004
C1S20.248 def ± 0.009
C1S30.243 ef ± 0.005
C1S40.287 abc ± 0.003
C1S50.290 ab ± 0.003
C2S10.239 f ± 0.003
C2S20.248 def ± 0.002
C2S30.254 cdef ± 0.002
C2S40.275 bcde ± 0.001
C2S50.284 abcd ± 0.006
C3S10.240 ef ± 0.011
C3S20.245 ef ± 0.004
C3S30.266 cdef ± 0.009
C3S40.316 a ± 0.016
C3S50.303 ab ± 0.007
Means (value ± standard error) with different letters within the same column indicate significant differences using Tukey’s test with p ≤ 0.05.
Table 5. Mean soil exchangeable ammonium, available nitrate, and available phosphorus for the different treatments after thirty days of leaching.
TreatmentExchangeable NH4+Available NO3Available P
(mg kg−1)
C0S042.03 b ± 2.2916.81 a ± 1.620.93 b ± 0.04
C1S165.38 a ± 3.3714.94 a ± 0.931.40 ab ± 0.18
C1S266.31 a ± 4.9414.94 a ± 0.931.74 a ± 0.15
C1S366.31 a ± 1.8716.81 a ± 1.621.50 ab ± 0.02
C1S463.51 a ± 4.6714.94 a ± 0.931.53 ab ± 0.12
C1S564.45 a ± 1.6215.88 a ± 0.931.51 ab ± 0.15
C2S166.31 a ± 3.3715.88 a ± 0.931.47 ab ± 0.18
C2S258.84 ab ± 2.8017.75 a ± 0.931.61 a ± 0.13
C2S354.17 ab ± 0.9315.88 a ± 0.931.30 ab ± 0.11
C2S456.04 ab ± 1.6214.94 a ± 0.931.58 a ± 0.05
C2S560.71 ab ± 2.4715.41 a ± 1.401.31 ab ± 0.05
C3S152.30 ab ± 1.8715.41 a ± 1.401.48 ab ± 0.15
C3S254.17 ab ± 1.8715.88 a ± 0.931.59 a ± 0.03
C3S363.51 a ± 7.6515.88 a ± 0.931.45 ab ± 0.02
C3S454.17 ab ± 5.6815.41 a ± 1.401.65 a ± 0.09
C3S556.04 ab ± 1.6216.81 a ± 1.621.35 ab ± 0.08
Means (value ± standard error) with different letters within the same column indicate significant differences using Tukey’s test with p ≤ 0.05.
Table 6. Mean soil effective cation exchange capacity for the different treatments after thirty days of leaching.
TreatmentsSoil ECEC (cmol(+) kg−1)
C0S06.98 d ± 0.03
C1S112.45 bc ± 0.68
C1S214.18 abc ± 1.11
C1S312.19 c ± 0.45
C1S414.35 abc ± 0.47
C1S516.41 ab ± 0.38
C2S113.27 bc ± 0.84
C2S213.72 abc ± 0.8
C2S313.33 bc ± 0.94
C2S414.41 abc ± 1.22
C2S517.82 a ± 1.76
C3S113.80 abc ± 0.56
C3S213.19 bc ± 0.62
C3S314.40 abc ± 0.49
C3S413.75 abc ± 0.44
C3S516.03 abc ± 0.15
Means (value ± standard error) with different letters within the same column indicate significant differences using Tukey’s test with p ≤ 0.05.
Table 7. Initial soil pH, regression equations for the relationships between the amount of hydrogen or hydroxide ions added to the soil and pH change, and the regression coefficient (R2) for the different treatments after thirty days of leaching.
TreatmentInitial pHRegression Equation(R2)
C0S04.43 ± 0.01pH = 2.3228 OH + 4.8040.8774 *
C1S17.83 ± 0.06pH = −0.9860 H+ + 7.9220.9375 *
C1S27.99 ± 0.10pH = −1.2886 H+ + 8.1020.9222 *
C1S38.08 ± 0.04pH = −0.7892 H+ + 8.1220.9577 *
C1S47.99 ± 0.04pH = −1.0222 H+ + 8.1610.9193 *
C1S58.28 ± 0.05pH = −1.2906 H+ + 8.2470.9157 *
C2S17.89 ± 0.07pH = −1.0939 H+ + 8.0320.9052 *
C2S27.76 ± 0.07pH = −0.7731 H+ + 7.9600.8825 *
C2S37.86 ± 0.05pH = −1.2058 H+ + 8.1670.8012 *
C2S47.90 ± 0.07pH = −0.8893 H+ + 8.1060.8812 *
C2S58.08 ± 0.09pH = −0.6269 H+ + 8.1480.9504 *
C3S17.86 ± 0.02pH = −0.8318 H+ + 8.0470.9544 *
C3S27.84 ± 0.07pH = −0.6259 H+ + 8.0650.8525 *
C3S37.97 ± 0.04pH = −0.9530 H+ + 8.1530.8973 *
C3S48.13 ± 0.03pH = −0.7592 H+ + 8.1660.9284 *
C3S58.10 ± 0.04pH = −0.9557 H+ + 8.2460.9460 *
R2 values denote the percentage of the relationship that can be explained by the regression line. R2 values with an asterisk indicate a significant relationship at the 95% confidence level.
Publisher’s Note: MDPI stays neutral with regard to jurisdictional claims in published maps and institutional affiliations.

