
Effects of Growth Stage-Based Limited Irrigation Management on Soil CO2 and N2O Emissions, Winter Wheat Yield and Nutritional Quality

1
College of Water Resources and Architectural Engineering, Northwest A&F University, Xianyang 712100, China
2
Key Laboratory of Agricultural Soil and Water Engineering in Arid and Semiarid Areas of Ministry of Education, Northwest A&F University, Xianyang 712100, China
*
Author to whom correspondence should be addressed.
Agronomy 2022, 12(4), 952; https://0-doi-org.brum.beds.ac.uk/10.3390/agronomy12040952
Submission received: 8 February 2022
/
Revised: 7 April 2022
/
Accepted: 8 April 2022
/
Published: 15 April 2022
(This article belongs to the Special Issue Strategizing Agricultural Management for Climate Change Adaptation and Mitigation)
Abstract
:Water scarcity and poor irrigation practices limit crop productivity and increase greenhouse gas (GHG) emissions in arid Northwest China. Therefore, we investigated the effects of five growth stage-based deficit irrigation strategies on the yield, quality, and greenhouse gas emissions of winter wheat. Across treatments, CO2 emissions ranged from 3824.93 to 4659.05 kg ha−1 and N2O emissions from 3.96 to 4.79 kg ha−1. Compared with CK (irrigation in all growth stages), GHG emissions decreased significantly in T1, T2, T3, and T4 (p < 0.05). Water stress reduced the wheat yield, compared with CK, but the decrease depended on the stage without irrigation. Across treatments, the wheat yield was between 5610 and 6818 kg ha−1. The grain protein content decreased in the order T4 > T3 > T1 > T2 > CK. On the basis of a catastrophe progression method evaluation, we recommend T1 as the irrigation practice for winter wheat, because it maintained a high grain yield and quality and reduced GHG emissions. Thus, in practice, soil moisture should be sufficient before sowing, and adequate water should be supplied during the heading and filling stages of winter wheat. This study provides a theoretical basis for exploring the irrigation strategies of high-yield, good-quality, and emission reduction of winter wheat.
1. Introduction
The global annual wheat yield is approximately 730 million tons, and it provides approximately 20% of human dietary calories and protein demand [1]. Therefore, winter wheat is irreplaceable in maintaining global food security. The world population is expected to exceed 9 billion by 2050 [2], and the global demand for grain and crop protein is increasing rapidly. However, as global drought has increased in recent years, shortages of water resources have become a serious problem in wheat production [3]. Although the increasing demand for water resources is not compatible with sustainable development, high wheat yields and quality must be maintained in order to alleviate the pressure of food demand and ensure food security. However, when agricultural management measures, such as flood irrigation and excessive use of nitrogen fertilizer, are used to increase the wheat yield, the resulting environmental problems, such as greenhouse gas (GHG) emissions, are often ignored [4,5]. At present, with global warming becoming increasingly severe, the ecological and environmental problems are a serious threat to human survival and development [6]. Greenhouse gas emissions are one of the major causes of global warming, and emissions from farmlands have been gradually attracting global attention. Agricultural soils are the largest source of GHG emissions, and soil N2O and CO2 emissions during wheat production are important contributors to increasing the levels of global GHGs [7,8]. Increasing the grain yield at the expense of the environment is a poor strategy [9]. Therefore, reasonable and effective measures are needed to reduce emissions and mitigate global warming while ensuring the wheat yield and grain quality (protein content).
The Guanzhong Plain, a semiarid region in Northwest China, is one of the major winter wheat production areas in China. The spatial and temporal heterogeneity of precipitation is the primary factor limiting the sustainable development of winter wheat in the region [8]. Therefore, water management has important effects on the wheat yield and grain protein content, as well as GHG emissions [7,10]. In recent years, different types of new water-saving irrigation technologies have been used, including partial root zone irrigation [11], subsurface drip irrigation [12], and growth stage-based limited irrigation [13]. With growth stage-based limited irrigation, limited water resources are applied to the most water-sensitive period during crop growth in order to minimize the yield loss and optimize the water use. Xu et al. [3] showed that irrigation treatments increased the wheat yield compared with no irrigation after sowing treatment, and the highest yields were in those with irrigation at the wheat jointing and flowering stages. Flagella et al. [14] reported that late-reproductive stage water stress increased the grain protein content but decreased the grain yield compared with irrigation. These studies showed that drought in different growth periods has different effects on the crop quality and yield [10,15,16]. Previous studies on GHG emissions from farmlands in China have focused on the Northeast Plain [17], the North China Plain [18], and the Chengdu Plain [19]. Studies of GHG emissions from agricultural fields in the Guanzhong Plain are rare and mainly focus on the effects of mulch and nitrogen fertilizers [20]. In addition, studies on the effects of deficit irrigation on farmland GHG emissions are mainly based on a single gas [8]. Zhong et al. [18] found that deficit irrigation significantly reduced GHG emissions from wheat fields but simultaneously also decreased yields to varying degrees. Hou et al. [8] found that light water stress in the overwintering stage and ensuring irrigation during the jointing stage to the seed-filling period significantly reduced GHG emissions without significantly reducing the yield. As these studies suggest, how to balance reductions in water use and ensure grain yield and quality and control GHG emissions through rational irrigation has become a central concern in the development of water-saving agriculture.
There remains a lack of research on the effects of growth stage-based limited irrigation management on the crop yield and quality and GHG emissions. Even fewer studies include such a comprehensive analysis of winter wheat. Therefore, in this study, we investigated the effects of water stress treatments applied at different growth stages on the winter wheat yield and grain protein content and GHG emissions (CO2 and N2O). In addition, we used the catastrophe progression method in a comprehensive evaluation of multiple indicators to determine the most suitable irrigation scheme for the arid and semiarid regions of Northwest China. The goal was to identify scientifically sound production technology capable of producing high yields of high quality while reducing GHG emissions in winter wheat.
2. Material and Methods
2.1. Climate and Soil
From October 2020 to June 2021, a local variety of winter wheat (Triticum aestivum L. ‘Xinong 979′) was grown in an experimental field under an automated rolling rainout shelter at the Water-saving Irrigation Experiment Station of Yangling Northwest A&F University in Shaanxi Province (34°20′ N, 108°04′ E), China. When it rained, the automated rolling rainout shelter was closed to avoid rainwater interfering with the experiment; otherwise, the shelter was open to allow winter wheat to receive sunlight. The study area had a typical warm temperate semi-humid monsoon climate, and the annual mean precipitation is 632 mm. Precipitation was unevenly distributed throughout the year, and there was less precipitation during the winter wheat reproductive period. The mean physicochemical properties of the soil at the top 80 cm of the test site were the following: field water-holding capacity, 0.26 cm3 cm−3; pH, 7.6; organic matter, 8.20 g kg−1; and total nitrogen, 0.62 g kg−1.
2.2. Experimental Design
Winter wheat was sown on 16 October 2020 and harvested on 4 June 2021. All plots were irrigated before sowing to create adequate soil moisture conditions, which ensured the uniform appearance of wheat seedlings. Traditional drill planting was used with row spacing of 25 cm and a density of 4 million plants per hectare. Before sowing, 140-kg N ha−1 and 70-kg P2O5 ha−1 were evenly distributed as the base fertilizer. No top fertilizer was applied during the growth period. The winter wheat phenology was divided into the overwintering, regreening, jointing, heading, and filling stages, according to the method of Zadoks et al. [21]. The experiment included five irrigation treatments, and these were irrigation at jointing, heading, and filling (T1); at overwintering, heading, and filling (T2); at overwintering, greening, and filling (T3); at overwintering, greening, and jointing (T4); and irrigation in all growth stages (CK). Each treatment had three replicates, for a total of 15 plots. Plots were rectangular and 8 m2 (4 m long by 2 m wide). Each irrigation event delivered 80 mm of irrigation water using conventional border irrigation. A water meter was used to accurately control the amount.
2.3. Main Indices and Methods
2.3.1. Grain Yield and Protein Content
After harvest, the wheat was air-dried to a grain moisture fraction of 13% and weighed to determine the yield. The grain nitrogen content was determined by the Kjeldahl analysis, and then, the concentration of protein in the wheat grains was calculated by multiplying the nitrogen content by the constant 5.7 [1,22].
2.3.2. Gas Collection and Determination
Gas chromatography was used to measure soil gas emission fluxes under different irrigation treatments during the winter wheat growing season. Measurements were every 15 d before the jointing stage and every 10 d after the jointing stage, with additional samples collected after irrigation events. Gases were collected from static closed chambers made of opaque polyvinyl chloride panels that were 0.5 m in length, 0.5 m in width, and 0.5 m in height. To prevent drastic temperature changes inside the chambers due to sunlight exposure during a sampling period, the exteriors were wrapped in thermal insulation. To ensure uniformity of the air inside chambers, a small fan was installed at the top of the chambers to mix the air. Separate bases of static closed chambers were buried in the center of a plot before sowing to reduce the soil disturbance. There was a 5-cm-deep recess in the top of the bases to accommodate static closed chambers. The recess was filled with water before sampling the isolate gas exchange between inside and outside of the static closed chambers.
Soil CO2 or N2O emission fluxes and cumulative soil CO2 or N2O emissions during the entire growth period of winter wheat were calculated using the following equations [8]:
where F is the CO2 gas emission flux (mg m−2 h−1) or N2O gas emission flux (μg m−2 h−1), ρ is the gas density at the standard conditions (g cm−3), h is the height of the static closed chamber (0.5 m), T is the temperature inside the static closed chamber at the time of sampling (°C), dc/dt is the rate of change in the gas concentration inside a static closed chamber with time, M is the total amount of soil CO2 or N2O emissions (kg ha−1), i is the sampling order, n is the number of samples, and t is the sampling time (d).
2.4. Basic Principle of the Catastrophe Progression Method
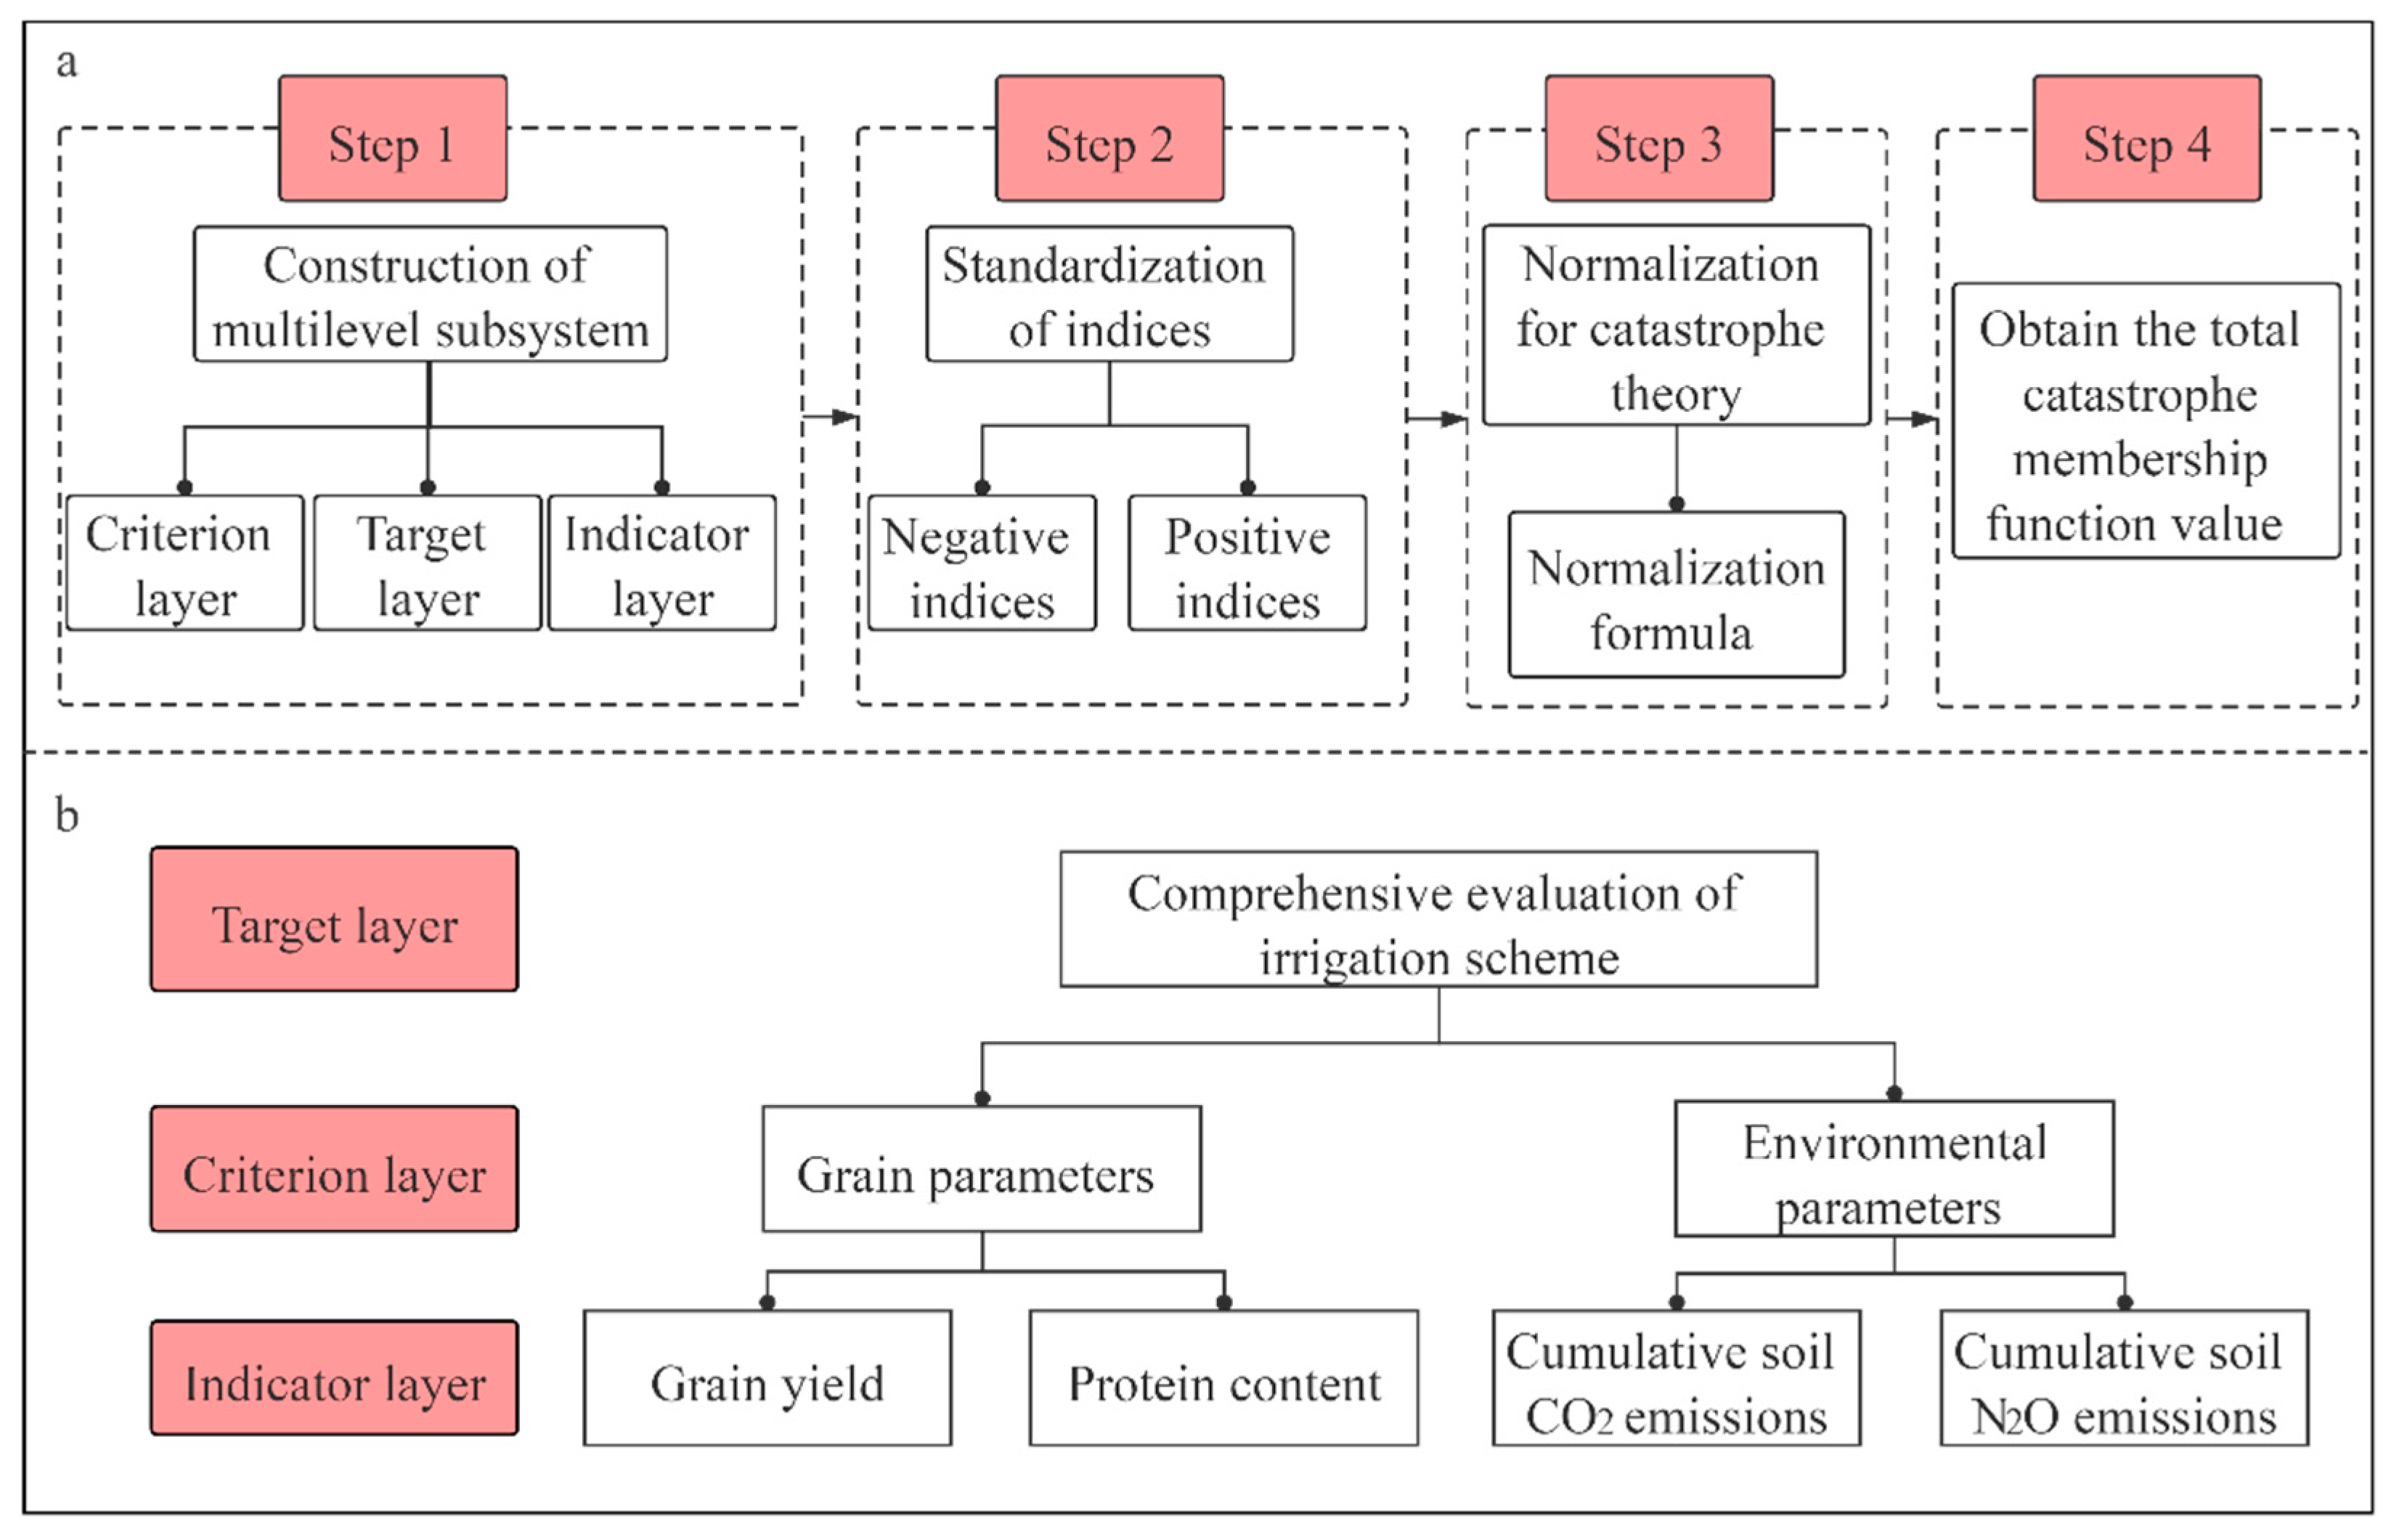
The basic concept of the catastrophe progression method is to decompose the evaluation indicators of the system under study into an inverted dendritic structure. Then, starting from the bottom of the dendritic structure, the mutation level is evaluated upwards to obtain the comprehensive catastrophe membership function value of the evaluation system [23,24,25]. The main steps of the mutation level method are as follows (Figure 1a):
The study analyzed the evaluation system, decomposed the total indicators into a multilayer indicator system, and constructed an evaluation indicator system. The evaluation indices in this study were divided into two categories: grain parameters (yield and grain protein content) and environmental parameters (total CO2 emissions and total N2O emissions; Figure 1b).
The underlying indicators were standardized, and the raw data were processed using the formula, such that the range of the raw data after it was converted into dimensionless data conformed to 0–1. Equations (3) and (4) were used to standardize the indices. In this study, when the grain parameter indicators belonged to positive-type indicators, Formula (3) was used, and when the environmental parameter indicators belonged to negative-type indicators, Formula (4) was used. Equations (3) and (4) are calculated as follows:
where Sj is the standard value of index j, xj is the original data of j, and xjmax and xjmin are maximum and minimum values, respectively, of the original variable xj.
The catastrophe evaluation model of the subsystem was determined, the calculations were carried out according to the normalization formula, and the catastrophe membership function value of the corresponding subsystem was obtained. The catastrophe model used in this study is shown in Table 1 [23,24,25].
The abrupt membership function value was calculated layer by layer, and finally, the comprehensive abrupt membership function value was obtained for evaluation. The catastrophe progression method was used to comprehensively evaluate different irrigation modes and identify the best irrigation treatment. A high comprehensive catastrophe membership function value indicated that an irrigation treatment maintained a high yield and high-quality grain of winter wheat and reduced GHG emissions.
2.5. Statistical Analyses
SPSS 18.0 (IBM, Inc., Armonk, NY, USA) was used to conduct an ANOVA and following the least-significant difference (LSD) multiple comparison test. Significance was accepted at p < 0.05. GraphPad Prism 8 was used to prepare figures (GraphPad Software, San Diego, CA, USA).
3. Results
3.1. Greenhouse Gas Emissions from Winter Wheat Soils under Different Irrigation Treatments
3.1.1. Seasonal Emission Fluxes and Cumulative Emissions of Soil CO2 under Different Irrigation Treatments
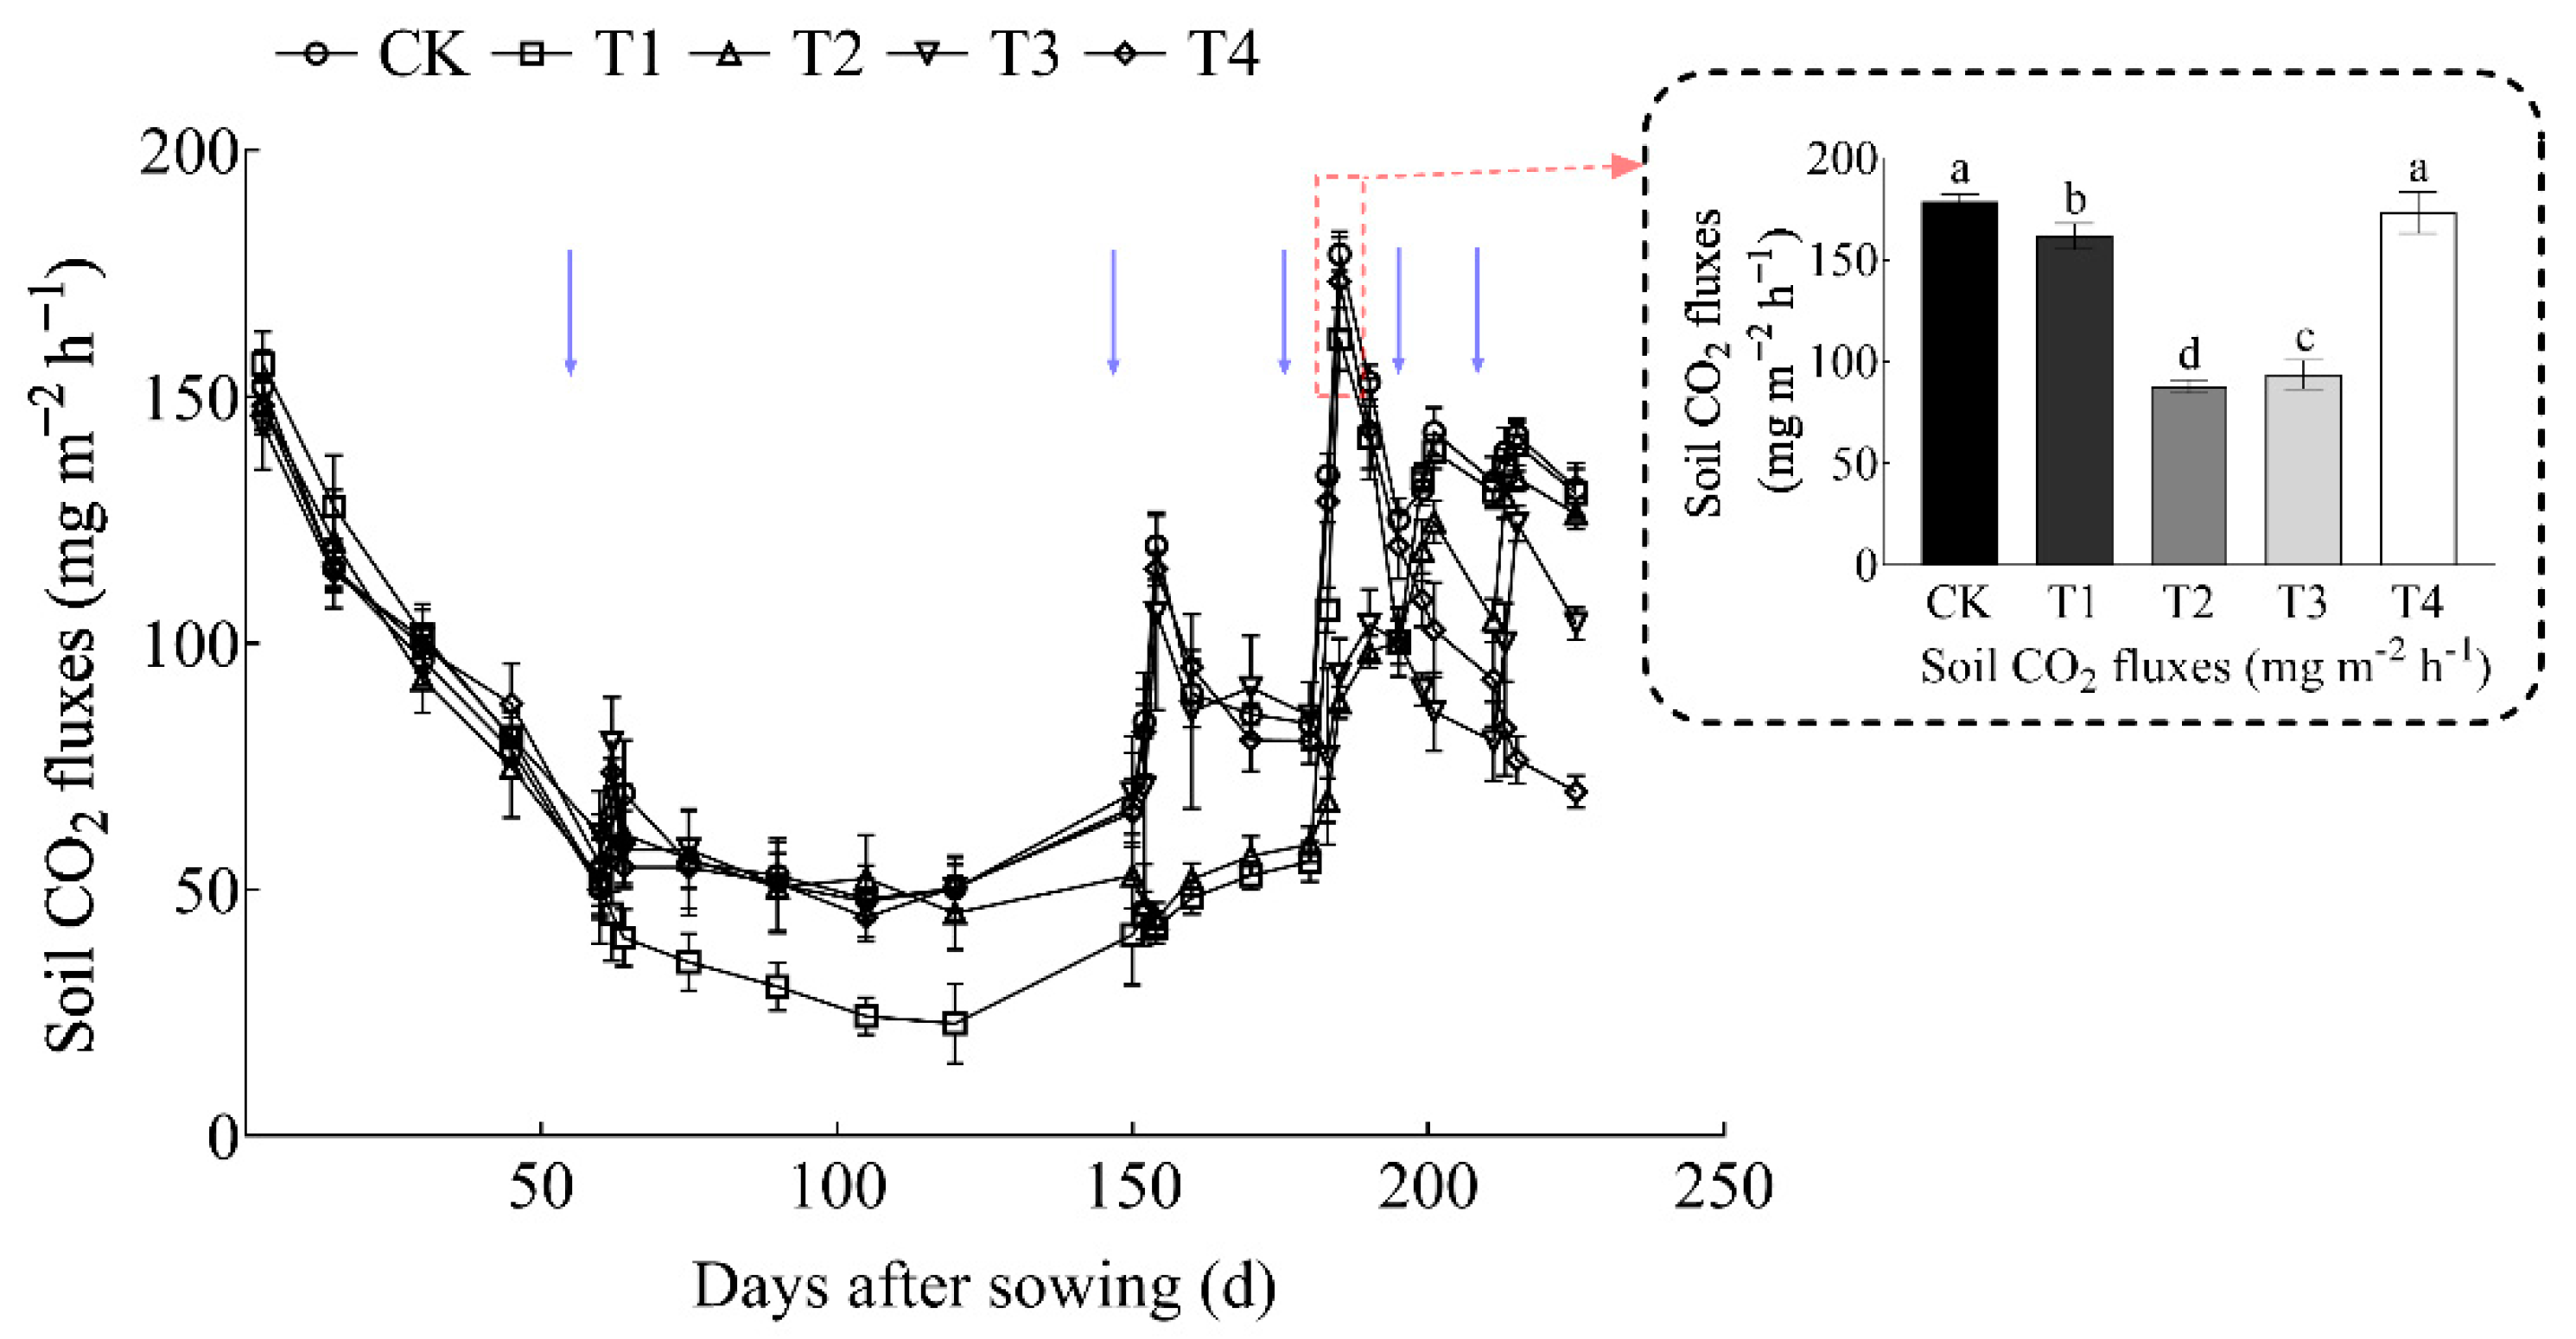
Figure 2 shows changes in the soil CO2 emission fluxes under different irrigation treatments. The emission fluxes of CO2 changed seasonally during the whole growth period of winter wheat and across treatments, first decreasing and then increasing. The fluxes decreased significantly to 22.78–50.49 mg m−2 h−1 120 d after sowing (p < 0.05) from the initial values of 144.06–156.57 mg m−2 h−1. Several peaks in the CO2 emissions were observed after the irrigation events. The highest CO2 emissions occurred at 185 d after planting, with 178.92 mg m−2 h−1 in CK, 161.66 mg m−2 h−1 in T1, 87.91 mg m−2 h−1 in T2, 93.75 mg m−2 h−1 in T3, and 173.37 mg m−2 h−1 in T4.
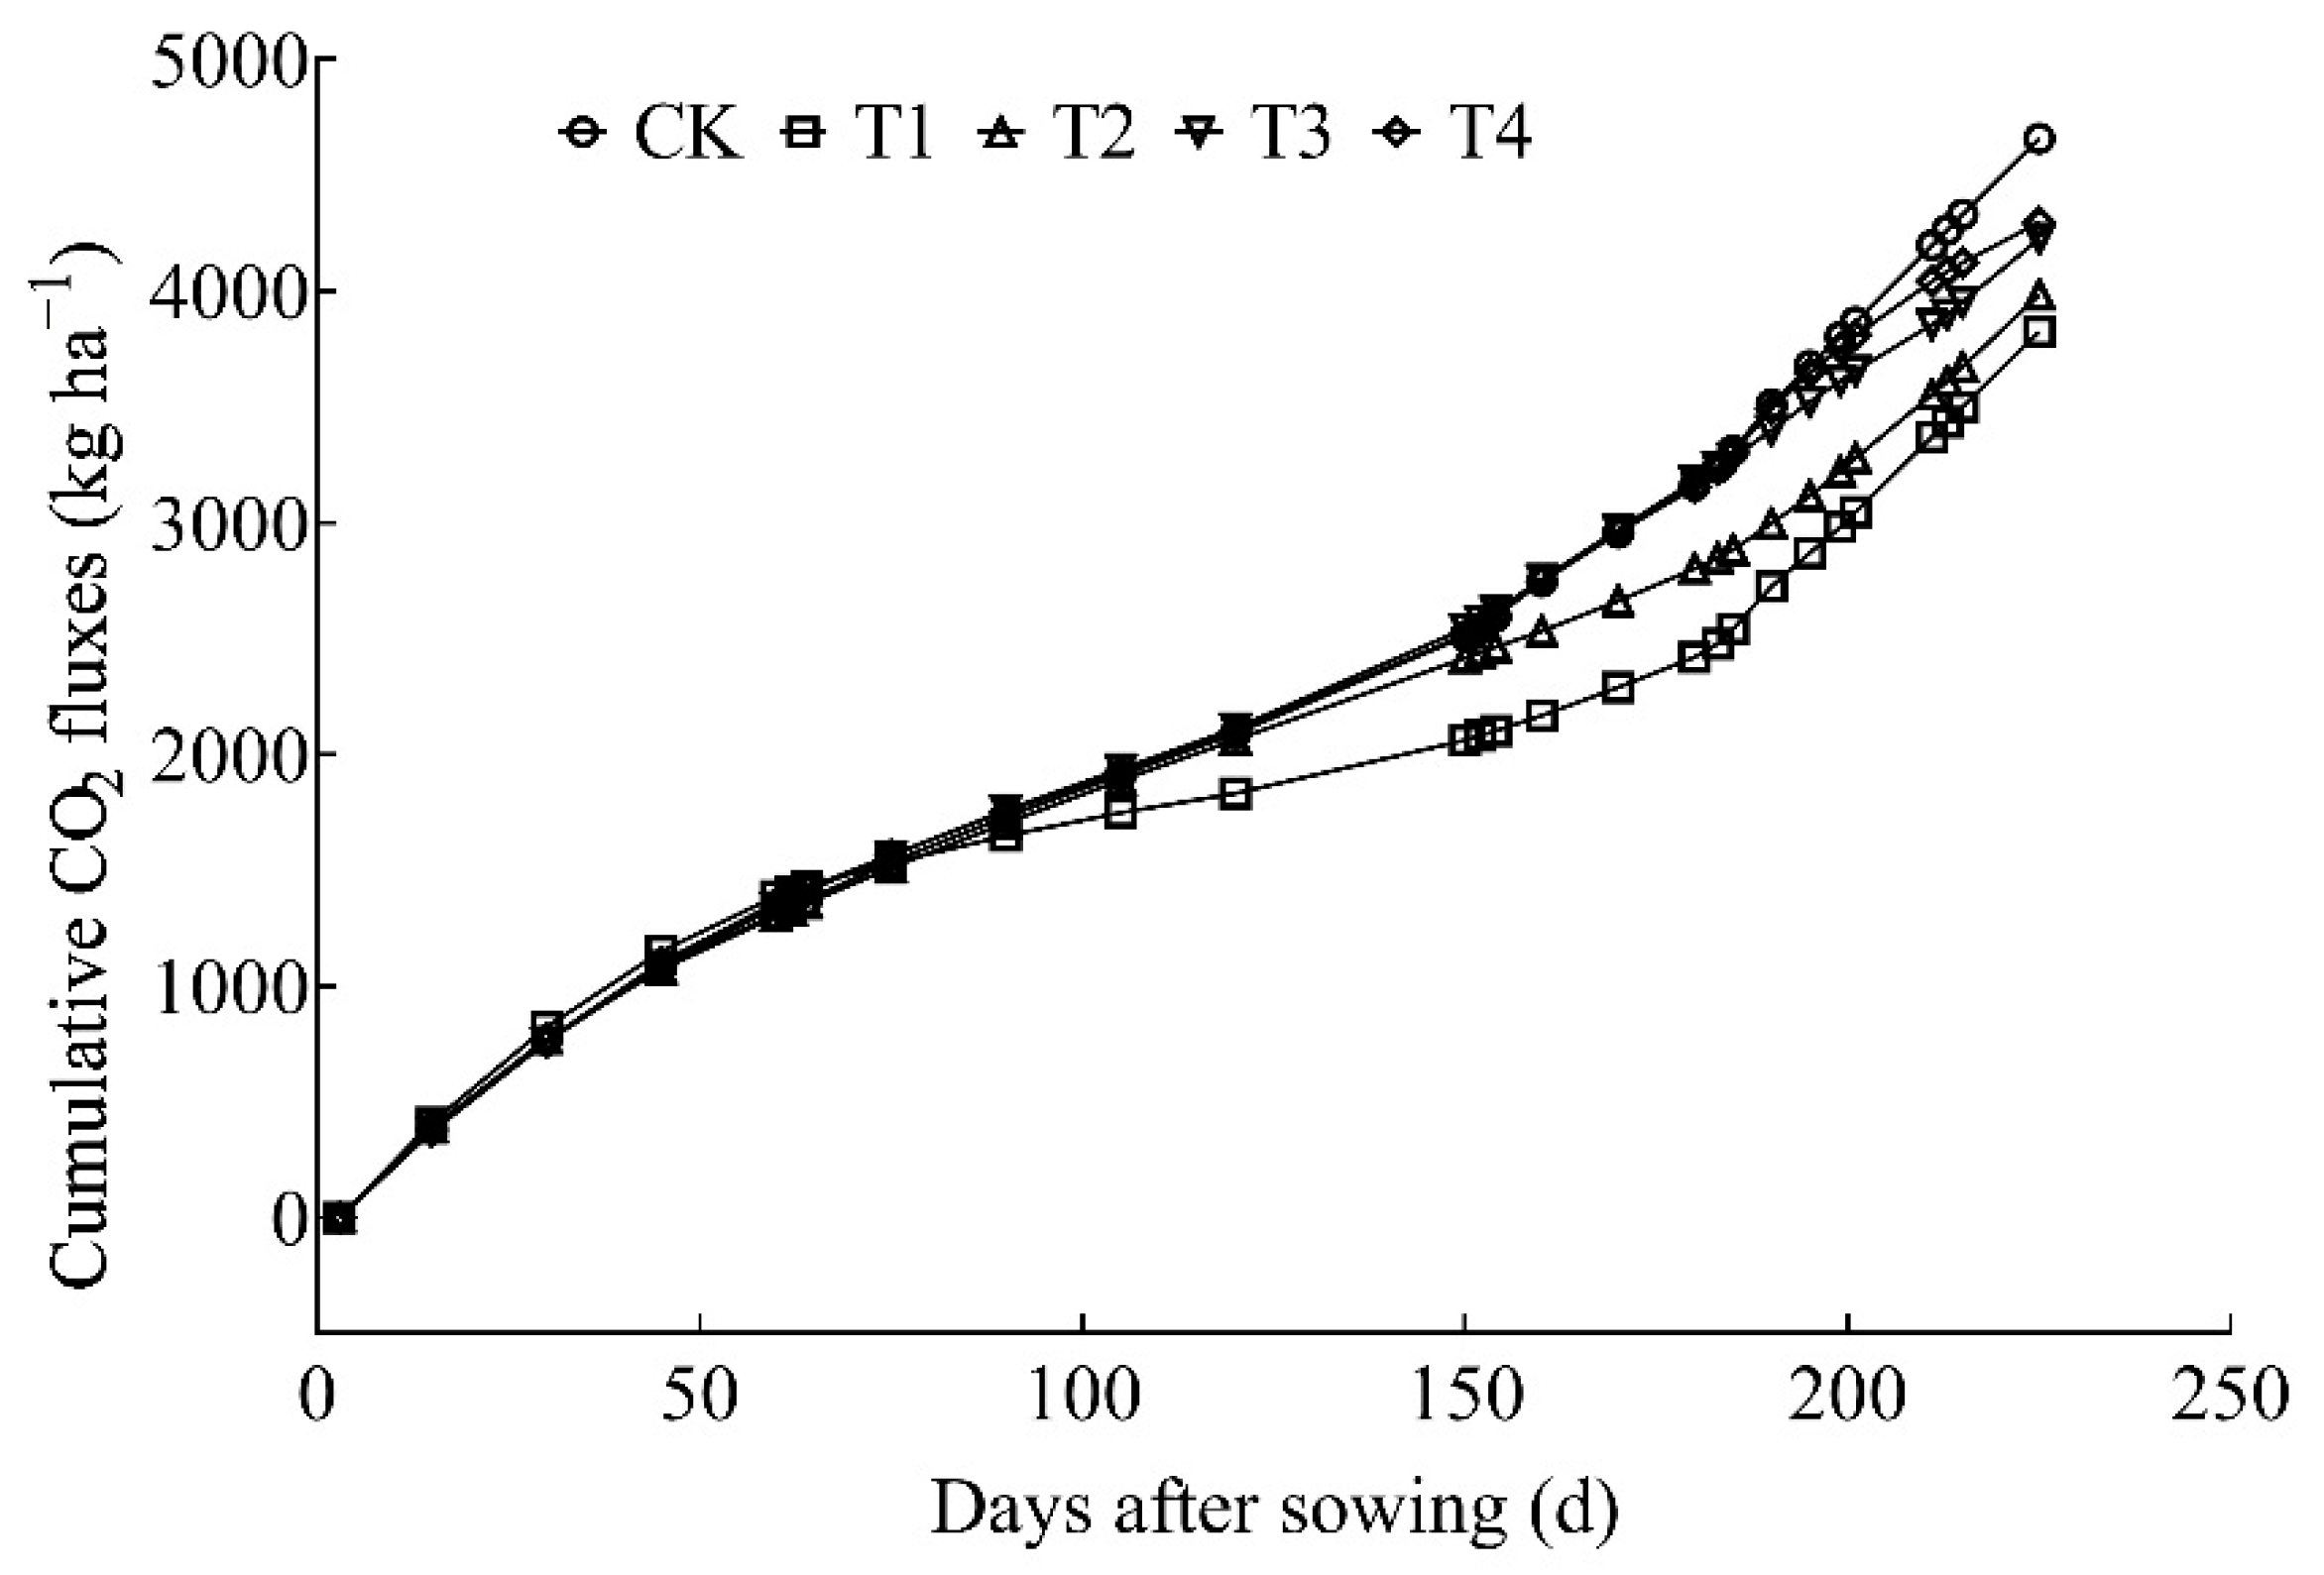
Cumulative emissions of soil CO2 increased gradually with the increase in days after sowing (Figure 3). During the whole growth period of winter wheat, the total CO2 emissions ranged from 3824.93 to 4659.05 kg ha−1 across the treatments (Figure 3). The total CO2 emissions in the different treatments decreased in the following order: CK > T3 > T4 > T2 > T1. Thus, the reductions in the total CO2 emissions were greater when the early growth period was not irrigated than when the late growth period was not irrigated. Over the winter wheat growing season, the cumulative soil CO2 emissions in CK were 17.90% higher than those in T1, 14.47% higher than those in T2, 9.23% higher than those in T3, and 7.75% higher than those in T4.
3.1.2. Seasonal Emission Fluxes and Cumulative Emissions of Soil N2O under Different Irrigation Treatments
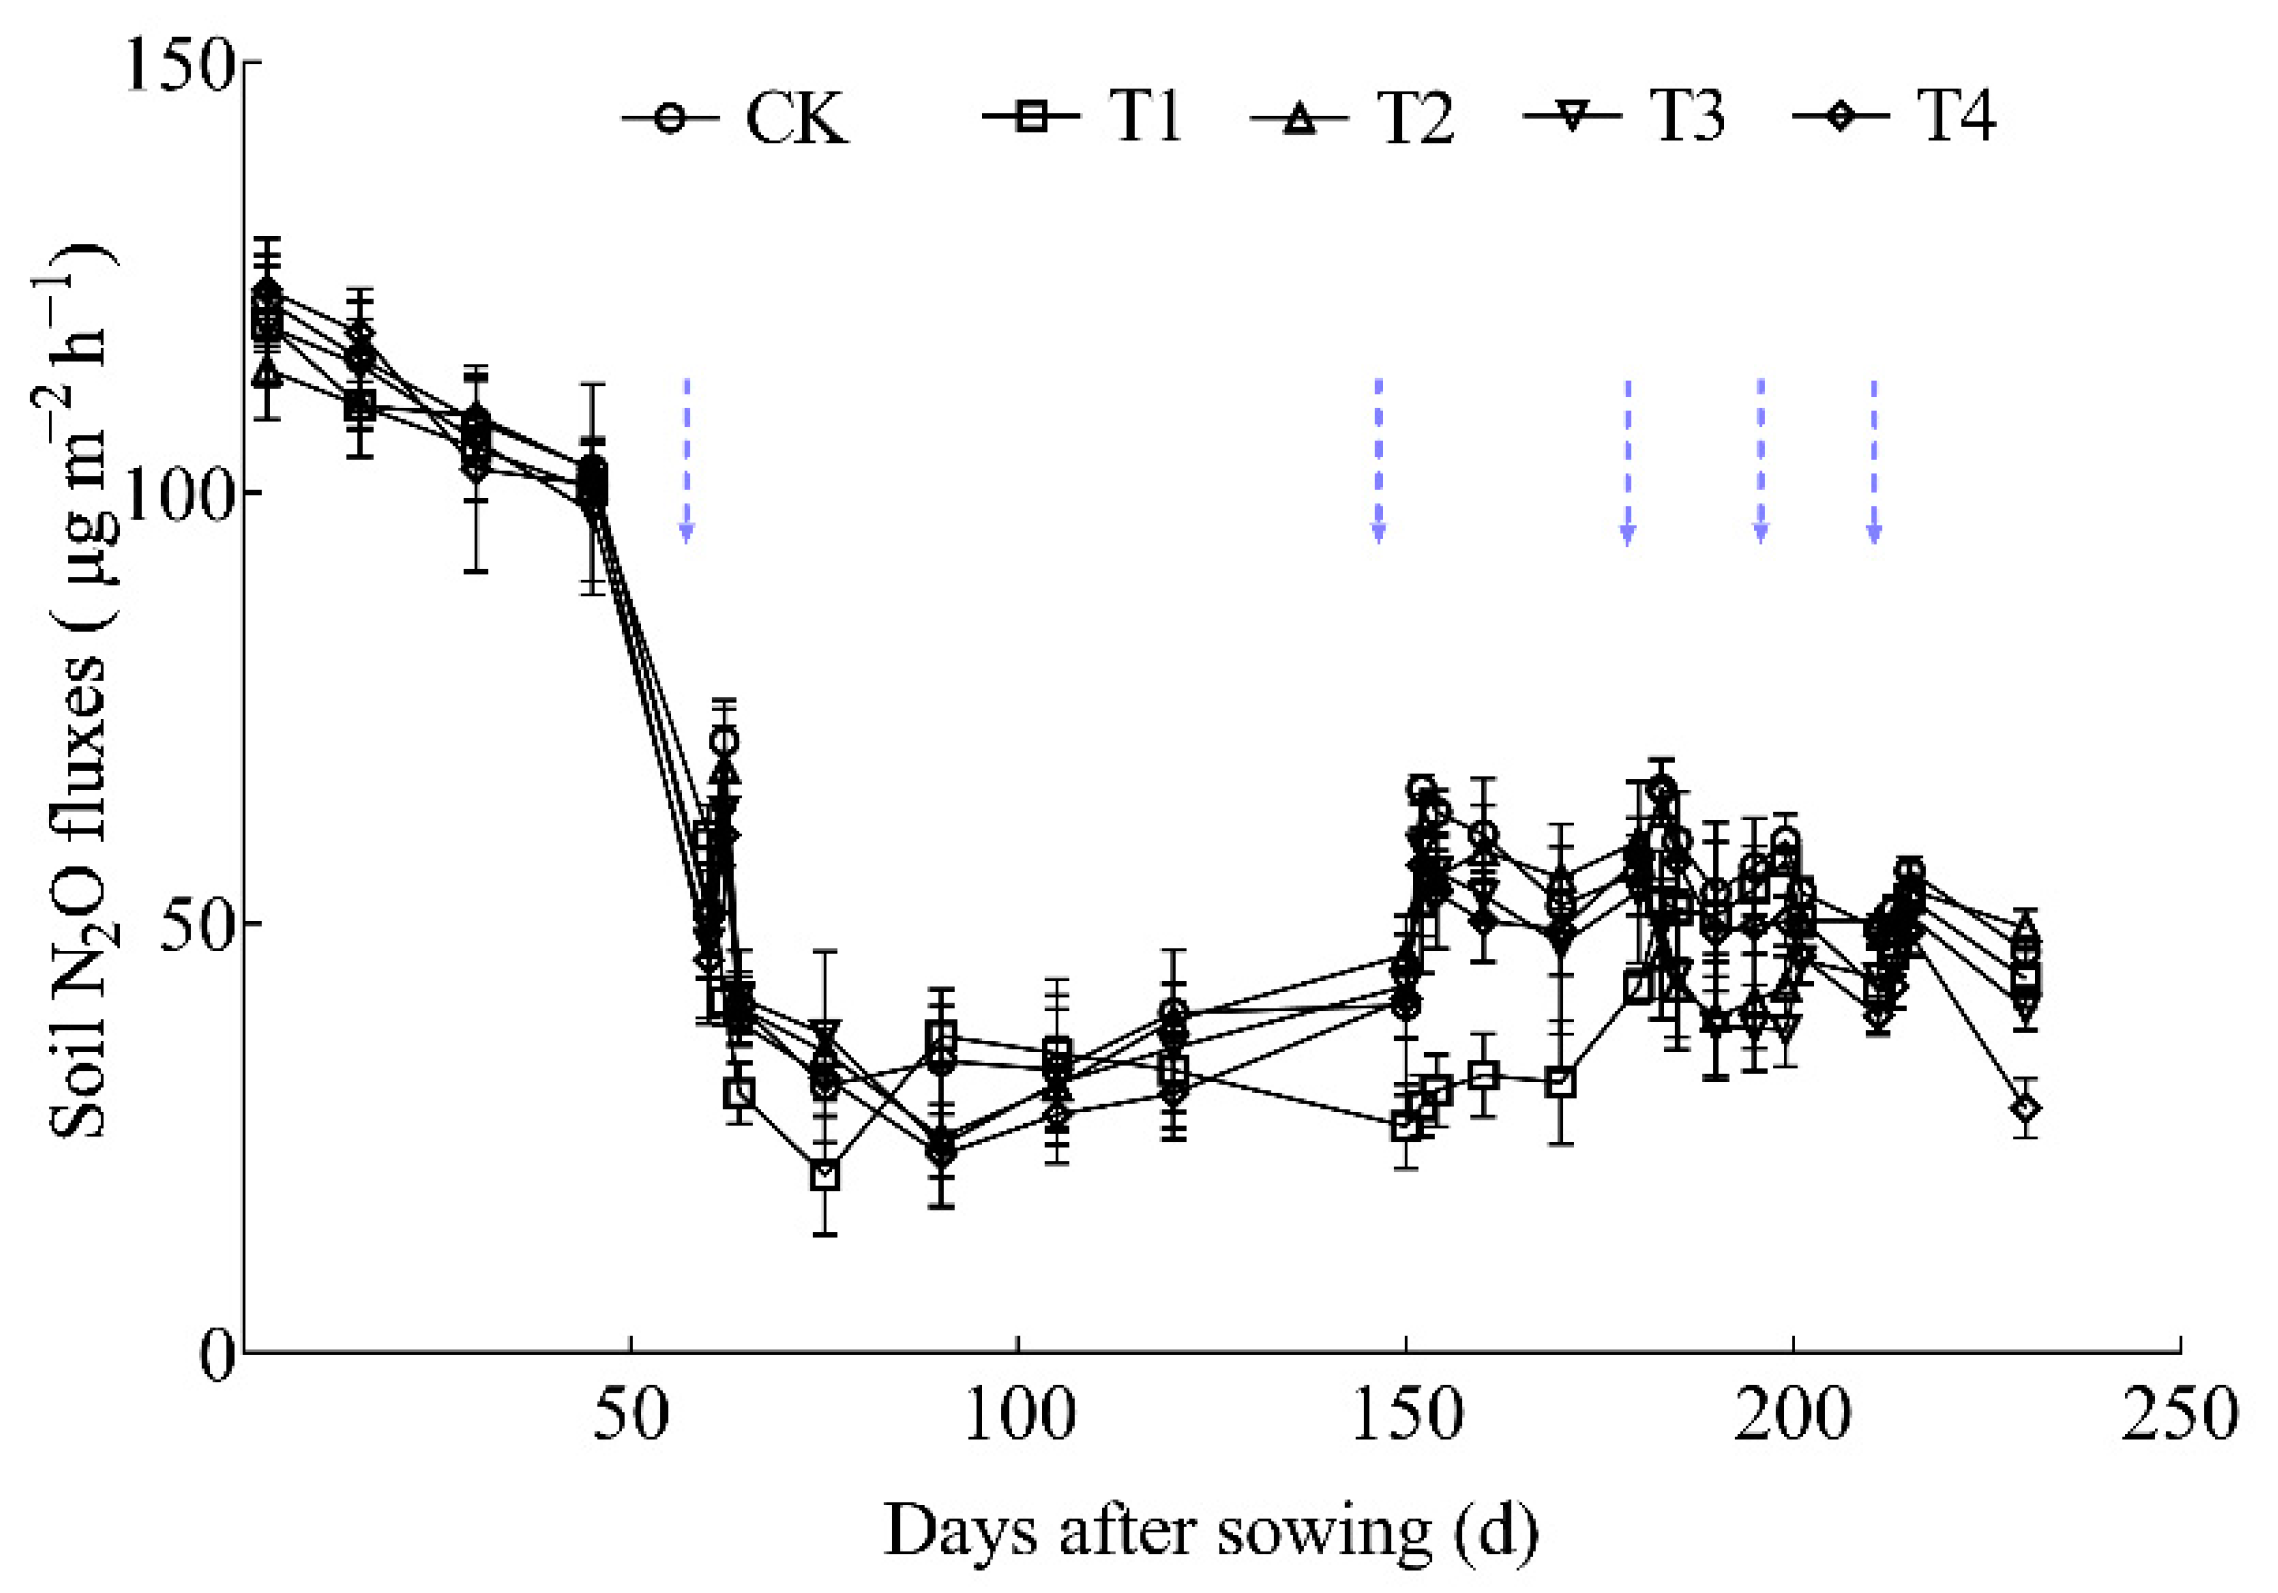
In all irrigation treatments, the N2O emissions showed a consistent seasonal pattern of variation during the winter wheat growing season (Figure 4). The emissions remained relatively high in the early growth stages and then decreased. The fluxes were relatively low from 75 d to 150 d after sowing, fluctuating between 20.69 and 46.31 mg m−2 h−1, but then slowly increased and gradually stabilized 150 d after sowing.
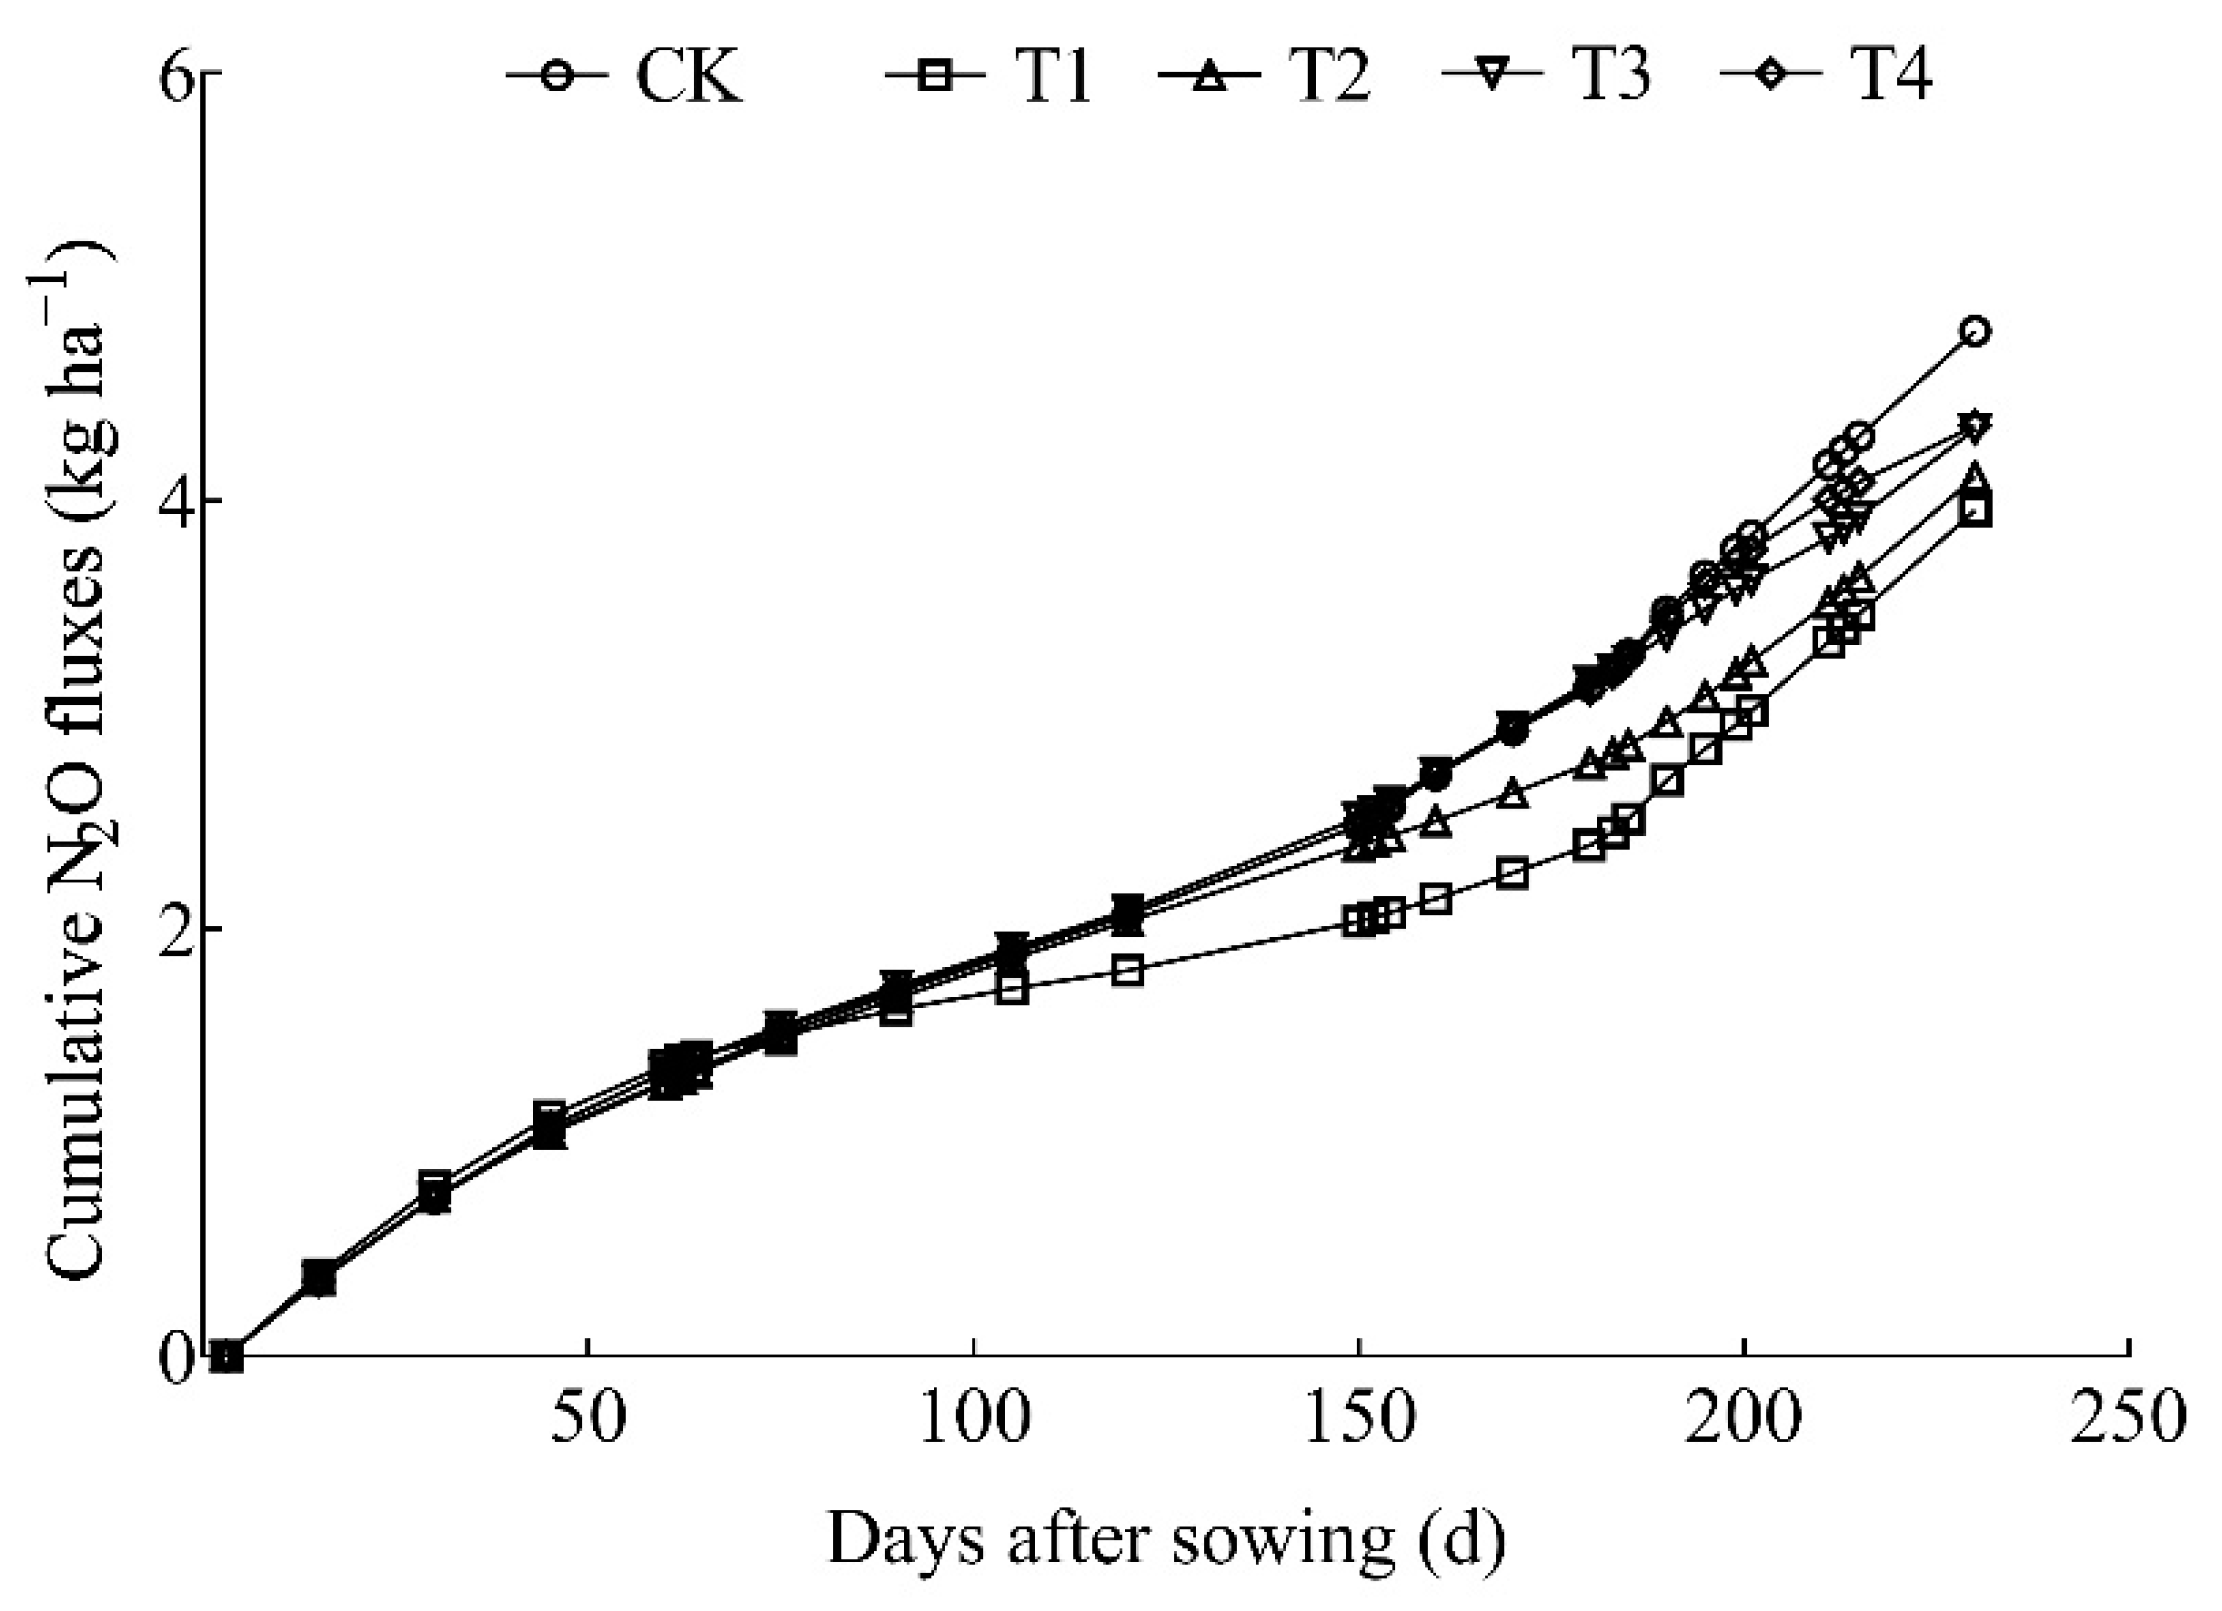
In all the treatments, there were gradual increases in the cumulative soil N2O emissions with the days after sowing (Figure 5). During the whole growth period of winter wheat, across the treatments, the total N2O emissions ranged from 3.96 to 4.79 kg ha−1 (Figure 5). Throughout the winter wheat reproductive period, the highest total N2O emissions were in CK with 4.79 kg ha−1. The total N2O emissions in CK were 17.44% higher than those in T1, 14.23% higher than those in T2, 9.55% higher than those in T3, and 9.24% higher than those in T4 (p < 0.05). Thus, the average N2O emission flux during the whole growth period of winter wheat was lower in the limited irrigation treatments (T1, T2, T3, and T4) than in the fully irrigated CK.
3.2. Effects of Different Irrigation Treatments on Winter Wheat Yield and Grain Protein Content
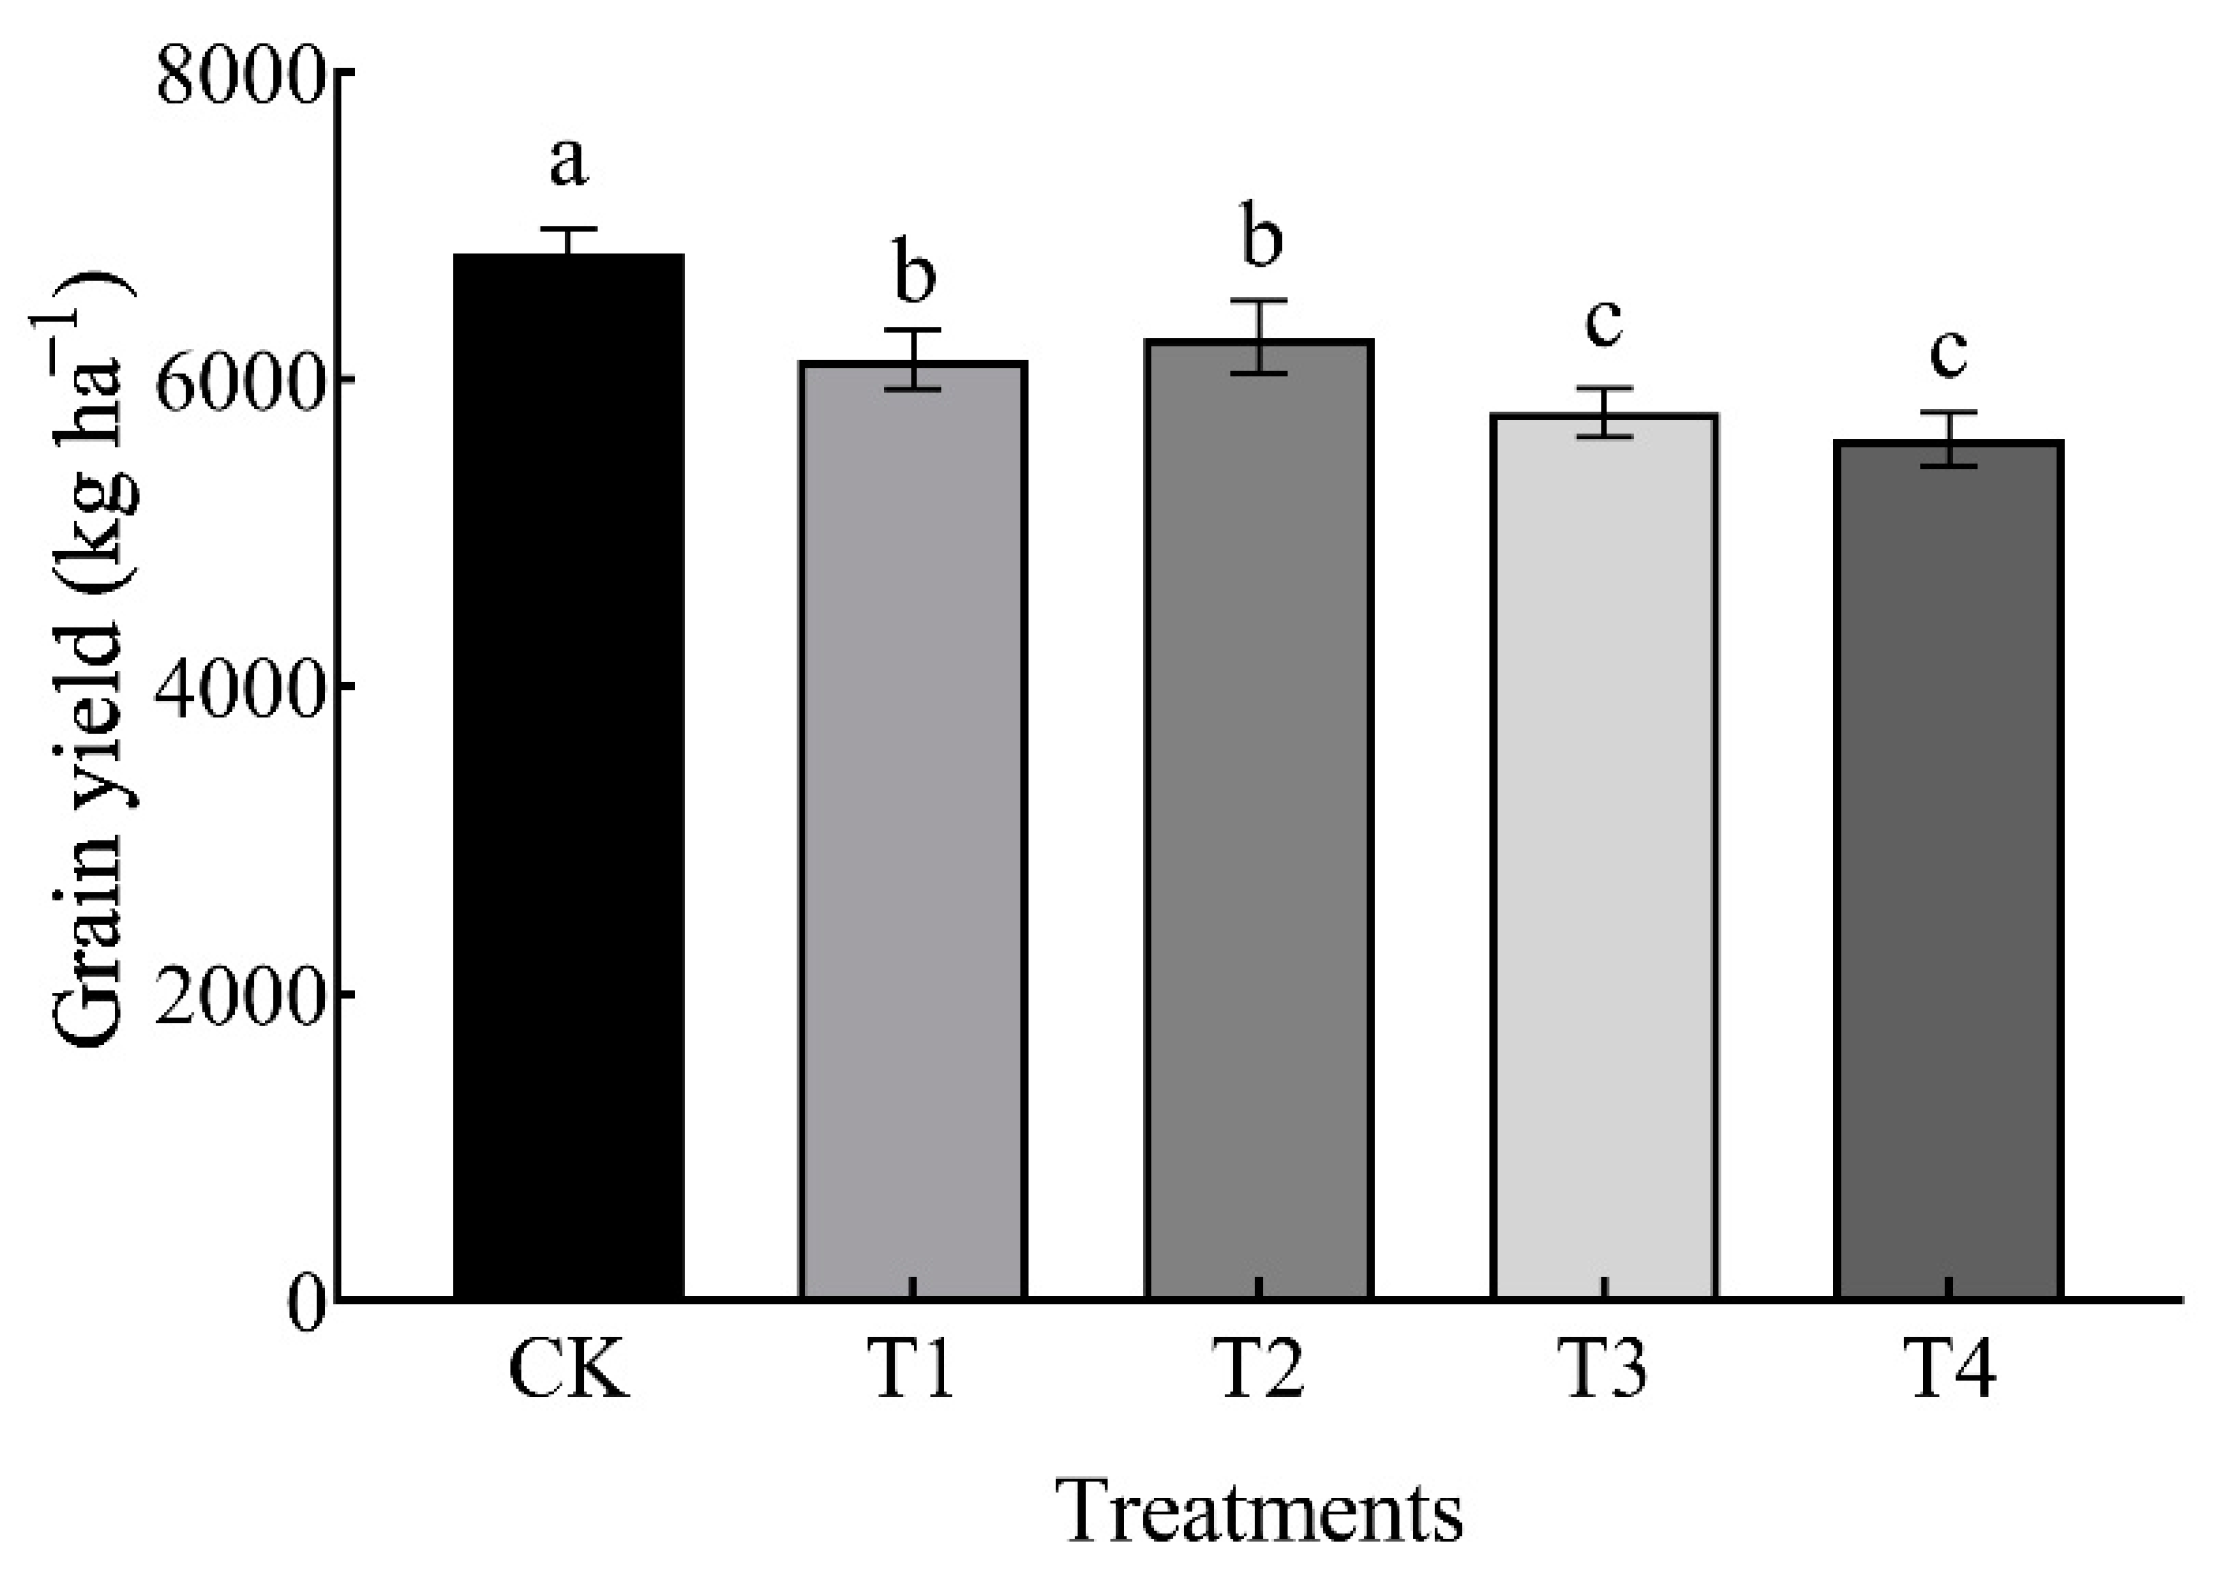
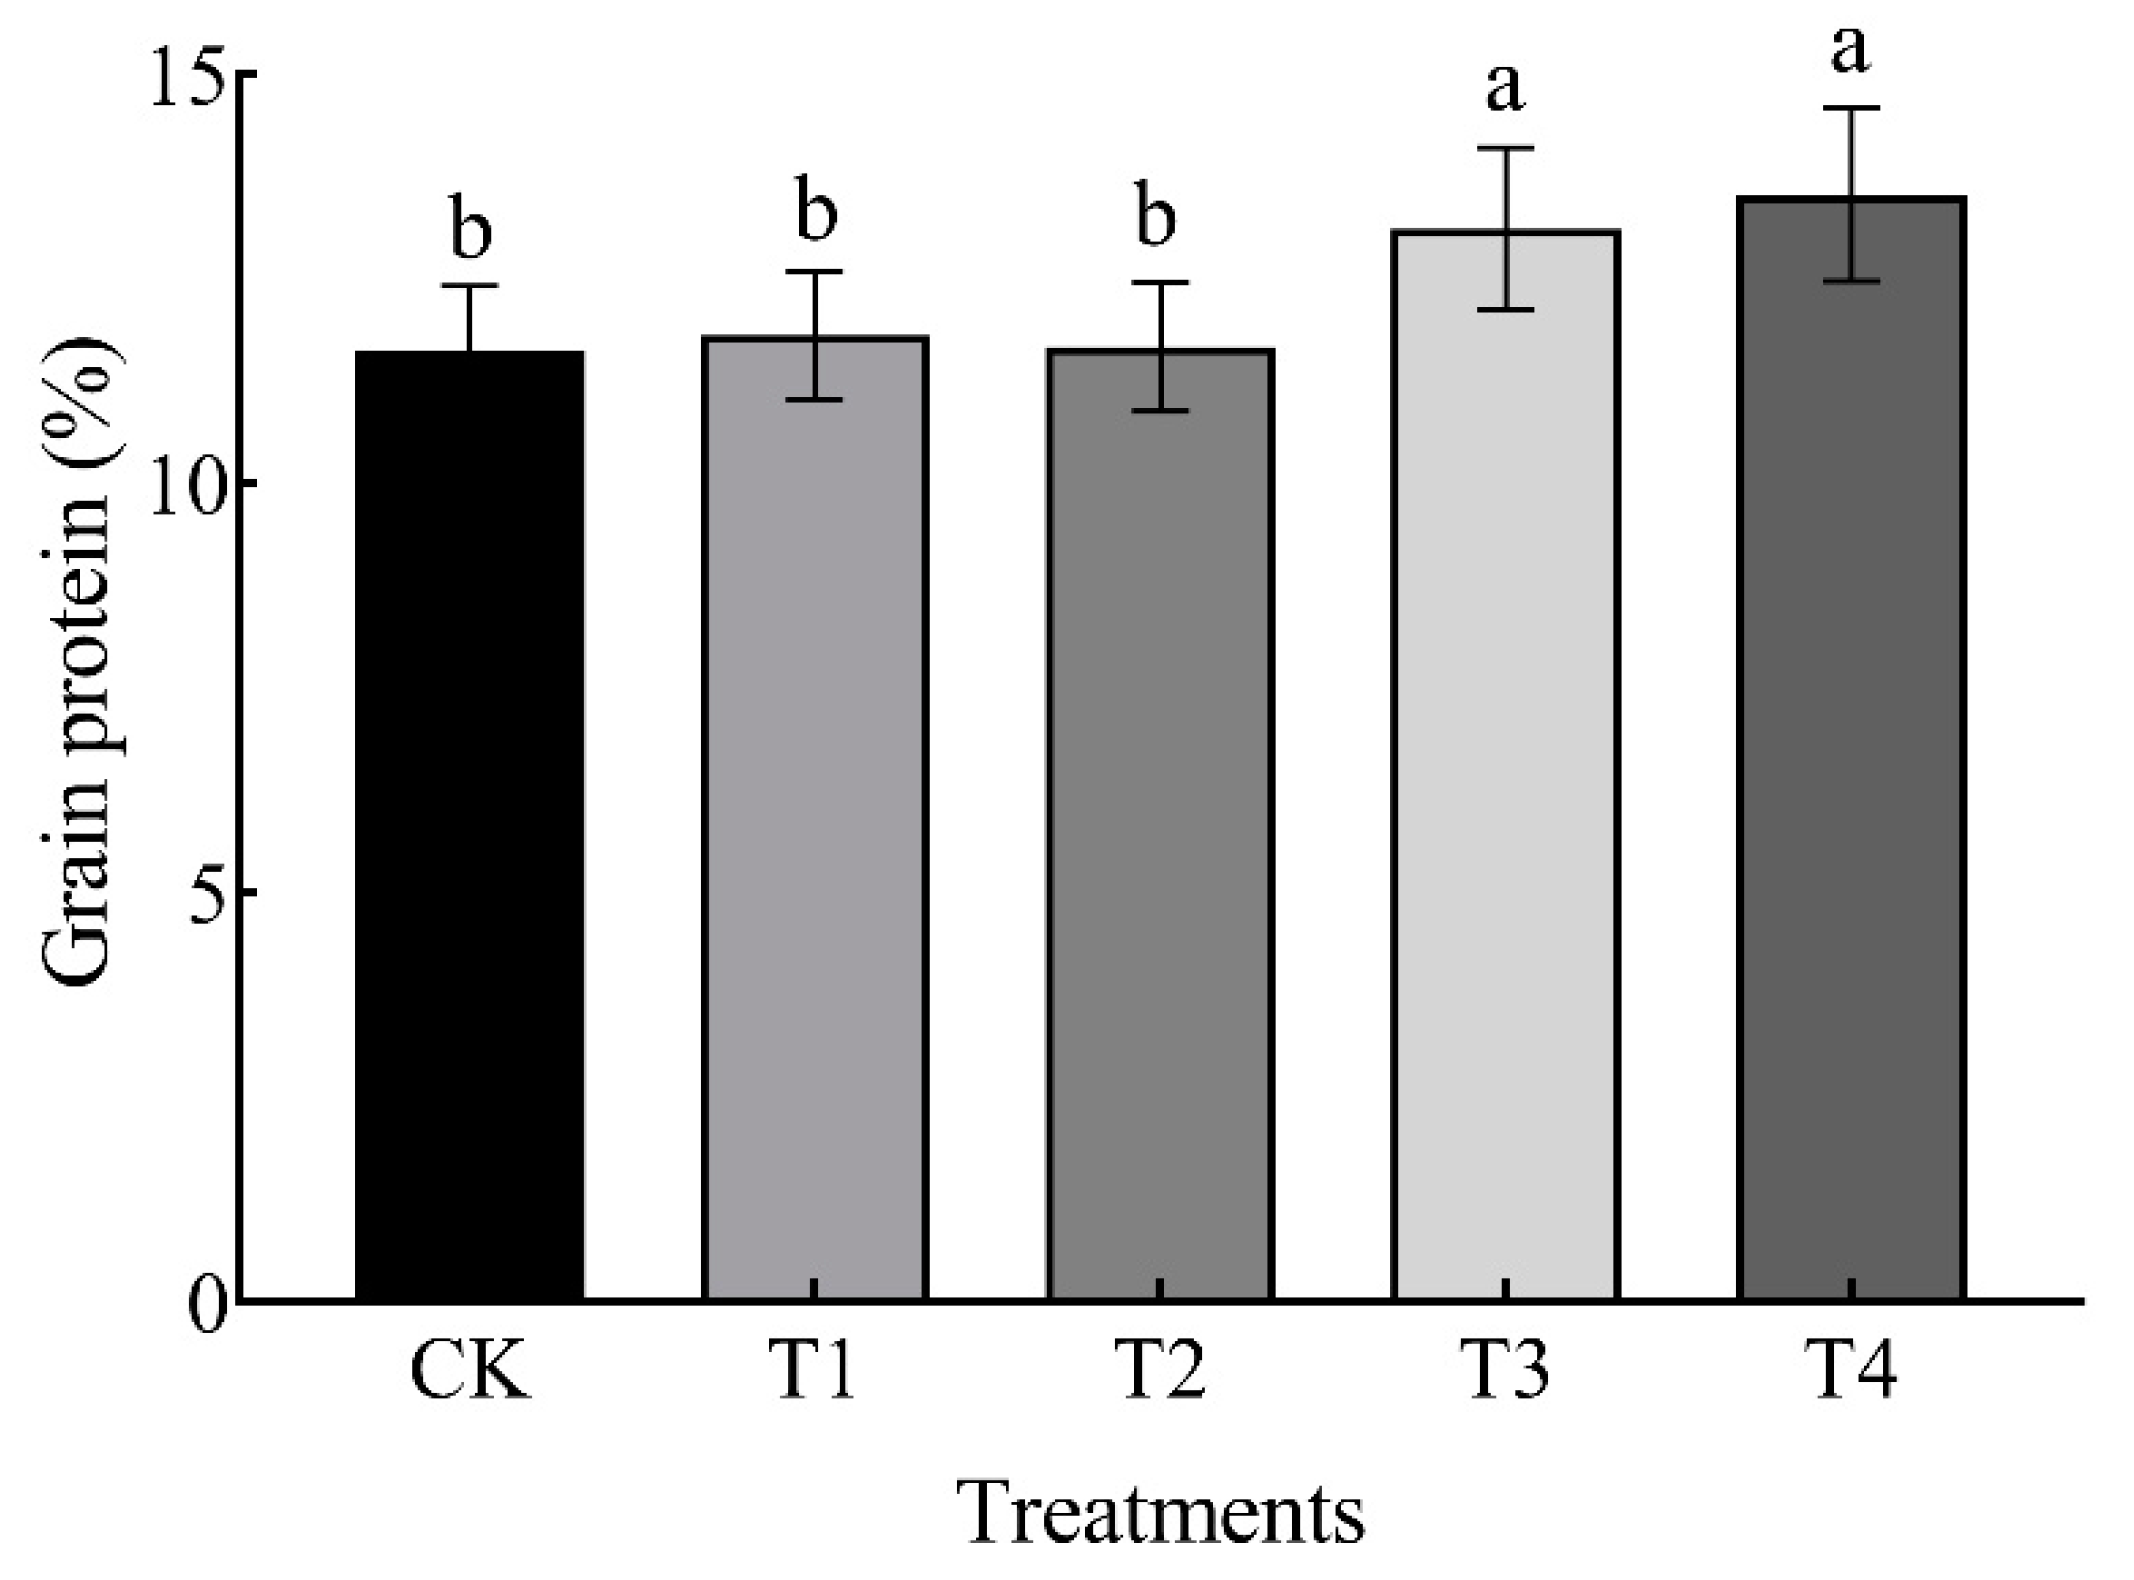
As Figure 6 shows, the average winter wheat yield was between 5610 and 6818 kg ha−1, and there were significant differences among the irrigation treatments. The highest yield was in CK, and the lowest was in T4. The wheat yields in CK, T1, T2, and T3 were 1.22, 1.09, 1.12, and 1.03 times, respectively, that in T4. The protein contents in different treatments decreased in the following order: T4 > T3 > T1 > T2 > CK (Figure 7). The protein contents in T3 and T4 were significantly higher than that in CK, T1, and T2. However, there were no significant differences among CK, T1, and T2 (p < 0.05). The grain protein contents in CK, T1, T2, and T3 were 16.53%, 14.65%, 15.83%, and 3.16% lower, respectively, than that in T4.
3.3. Selection of Optimal Irrigation Level
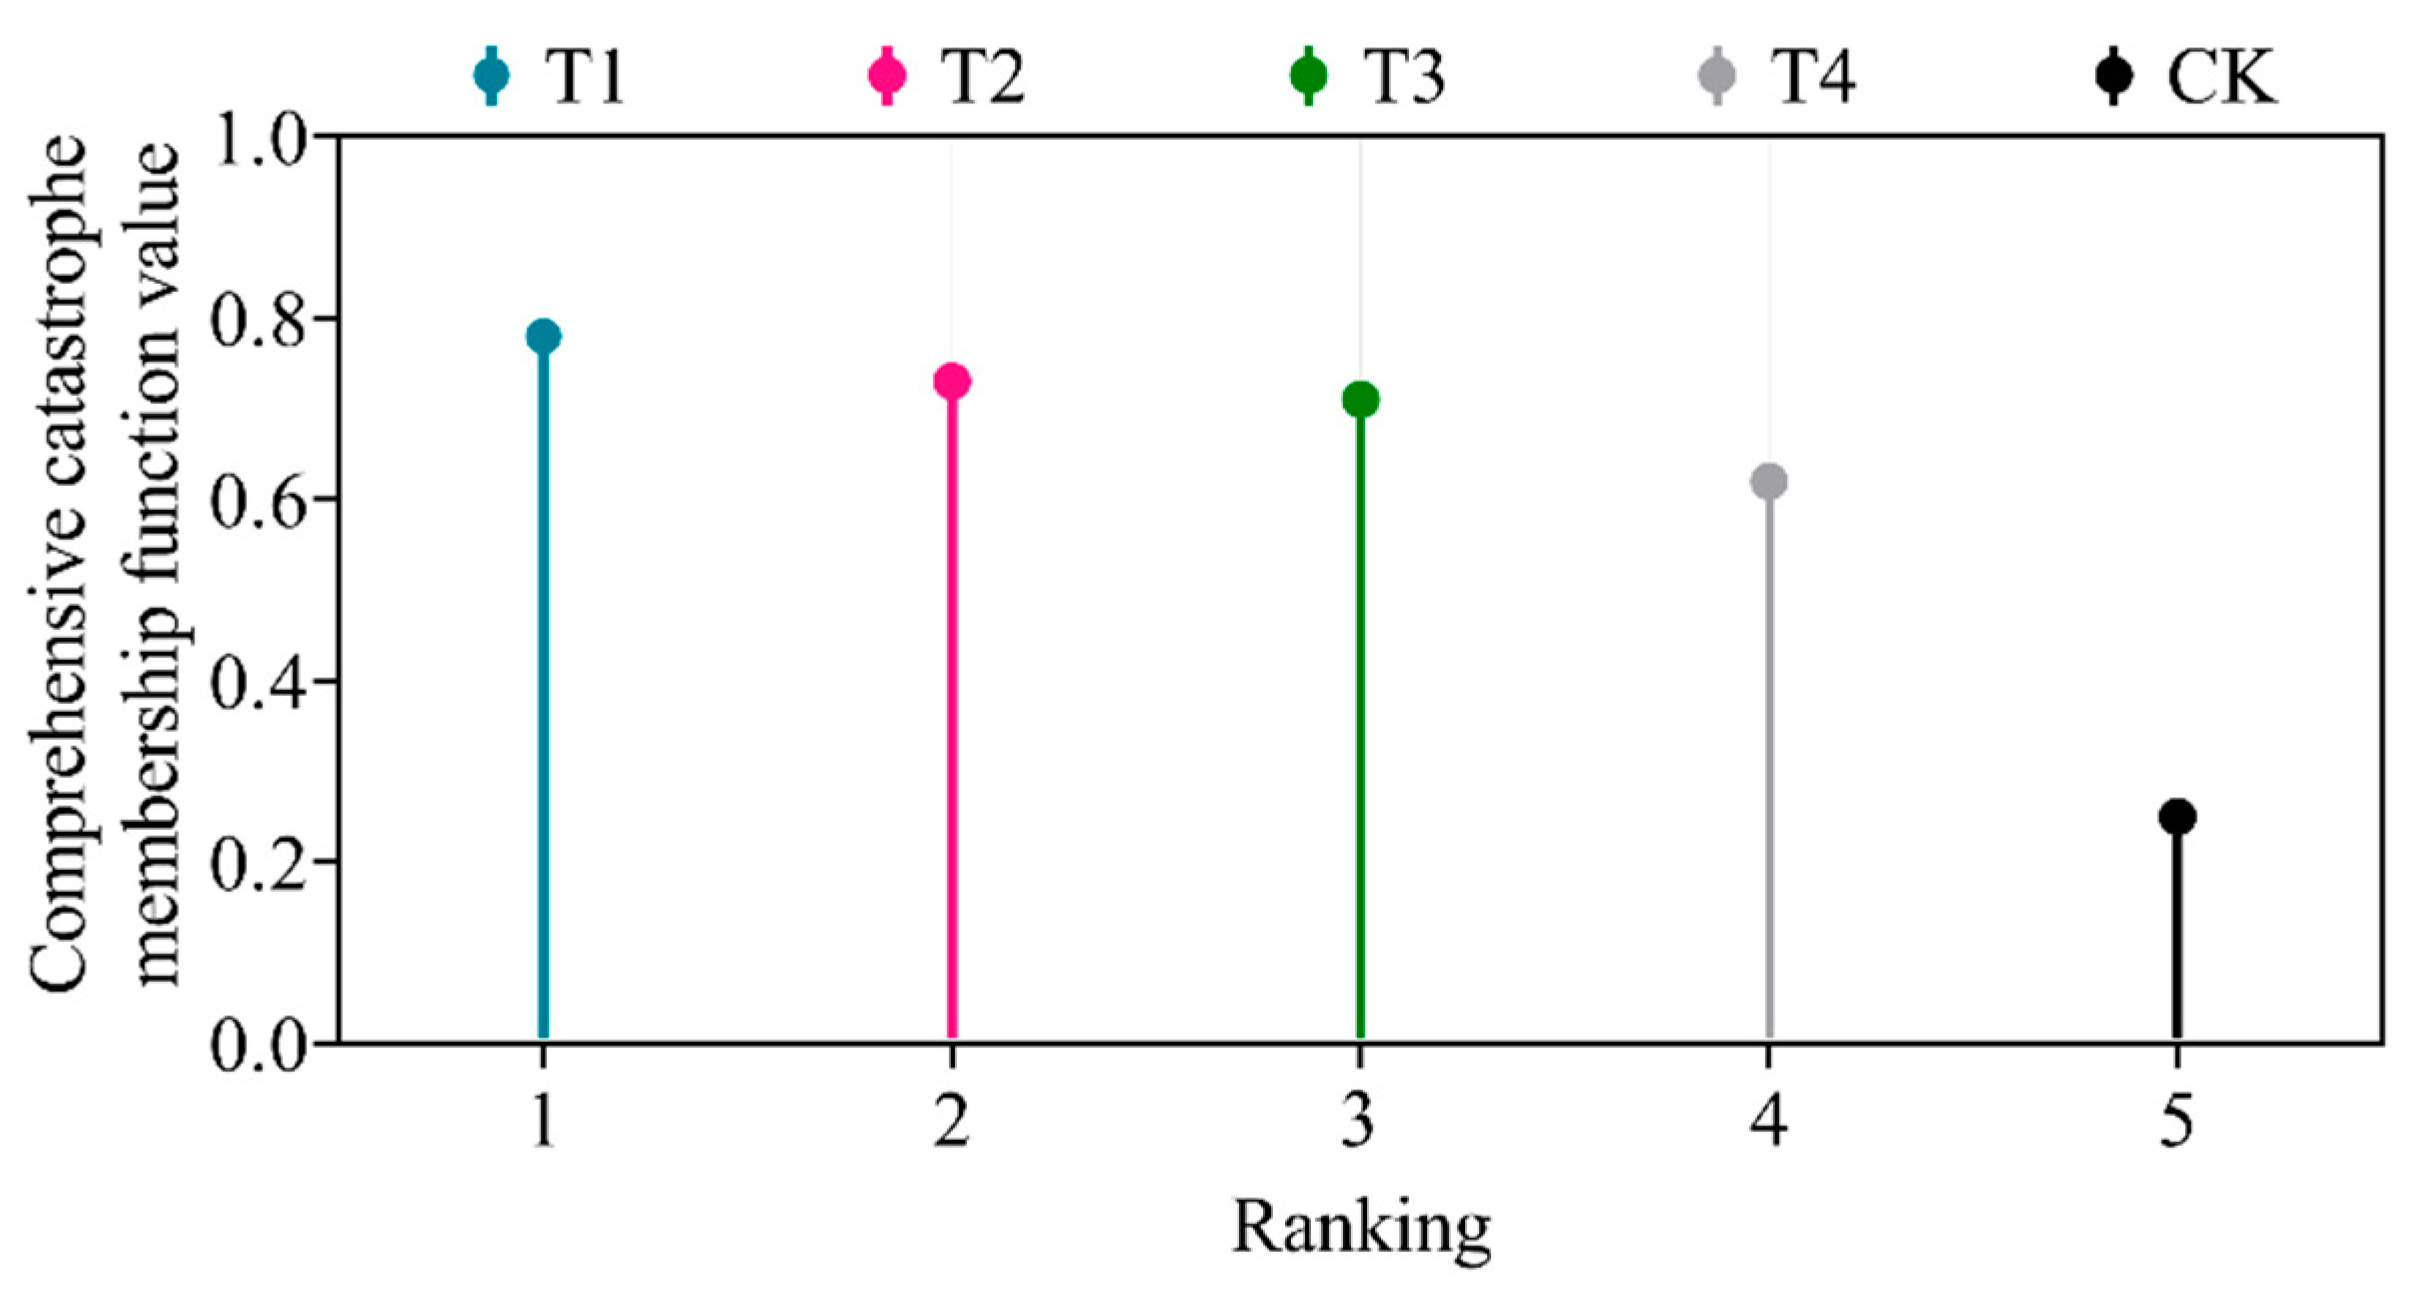
In the comprehensive evaluation of the irrigation treatments (Figure 8), T1 ranked first, with a total mutation membership function value of 0.78, followed by T2 with the second-highest value. The CK treatment (irrigation in all growth stages) had the lowest value of total mutation membership function at 0.25, ranking fifth. Therefore, T1 was the treatment most-suited to maintain the yields and grain quality while reducing GHG emissions.
4. Discussion
Water management is an important factor affecting GHG emissions from wheat fields [8]. Soil moisture can promote or inhibit root growth and affect root respiration, change soil permeability, and affect CO2 diffusion and microbial respiration and, therefore, affect the total production and emissions of soil CO2. The emissions of CO2 in T1, T2, T3, and T4 were lower than those in CK, indicating that water stress significantly affected the CO2 emissions (p < 0.05). The highest emissions in CK, which was irrigated throughout the growth period, were consistent with the results of Liu [26]. A sufficient supply of water favored crop growth and high root respiration and increased soil microbial activity, which led to increases in the total soil respiration and, thus, increase in CO2 emissions [7,8,18]. In this study, the CO2 emission fluxes decreased significantly within 120 d after sowing (p < 0.05), which was likely caused by the rapid decrease in soil temperature and, therefore, microbial activity [7]. The flux of CO2 reached a maximum at the filling stage (approximately 185 d after sowing). This result was likely because of warmer weather and increasing soil temperatures and, with the growth of winter wheat root systems, increases in root metabolism and root exudates that stimulated microbial activity [27,28]. In addition, these conditions could accelerate the mineralization of soil organic matter [7,28], which would also contribute to the higher soil CO2 flux.
Microbial nitrification and denitrification are the primary sources of soil N2O emissions [28,29]. The soil moisture content affects the activity of nitrifying and denitrifying microorganisms and the movement of N2O in soil and diffusion into the atmosphere [18,30]. In this study, N2O emissions were higher in the irrigation treatment (CK) than in the non-irrigation treatments (T1, T2, T3, and T4). Amha [31] reported similar results. Irrigation increases the water content of soil, which decreases the soil permeability, and as a result of oxygen-limited conditions, the N2O production from nitrification and denitrification increases [28]. In the early stage after sowing, the emissions peaked because the relatively high soil moisture and high substrate concentration due to the base fertilizer created favorable conditions for N2O emissions [28,32]. At 150 d after sowing, the soil N2O emission flux increased slowly and then stabilized. The increase might be because increasing the soil temperatures at that time promoted N2O emissions [28,33]. Winter wheat then entered the rapid growth stage, which accelerated the soil fertility decline, and as a result, the N2O emissions remained low, and no further emission peaks were observed.
As the irrigation increased, an increase in the grain yield, with a concomitant decrease in the protein content, was observed [14,34]. Therefore, how to ensure the wheat quality is an important consideration when attempting to increase the wheat yield. The wheat grain yield is related to the biomass at maturity, with a high biomass leading to a high yield [13]. When plants suffer from a water deficit, the leaf extensibility decreases and the initial turgor threshold increases, which limit the leaf growth [35]. Water stress is also not conducive to CO2 diffusion into leaf chloroplasts from the surrounding environment [36], which leads to decreases in the crop photosynthetic rate and accumulation of crop biomass [37] and, ultimately, to a decline in production. The results were similar in this study, and the winter wheat yield in CK without water stress during the growth period was higher than that in the drought treatments. Among the drought treatments, the yields of T1 and T2 were higher than those of T3 and T4. This result might be explained, because under sufficient soil moisture conditions before sowing, irrigation is more critical in key stages, such as heading and filling, than in the early stages. In the late stages, irrigation can achieve higher yields by increasing the number of panicles and grain weight [38,39,40]. Thus, although water stress reduces the crop yield, optimizing the irrigation period can reduce losses. In the arid areas of Northwest China, these results will be important in developing water-saving strategies. The grain quality of wheat is based on the nutritional, milling, and processing quality, with the protein content of grain an important factor [41]. Wang et al. [42] reported that differences in the irrigation management affect soil–plant water transport and the regulation of crop physiology and, as a result, grain quality. Noorka and Silva [43] evaluated the effects of water stress on the wheat grain protein content and showed that, under normal irrigation and water stress, the wheat protein content ranged from 11.20% to 13.92%. In this study, the grain protein content of winter wheat under different irrigation schemes ranged from 11.61% to 13.53%, which was similar to the results of Noorka and Silva [43]. The grain protein contents of winter wheat in T3 and T4 were significantly higher than that in the other treatments (p < 0.05). Compared with water regulation before the heading stage, the grain protein content can also increase significantly with drought stress after the heading stage [14]. In addition, Rezaei et al. [44] found that the grain protein content increased with the decreasing water availability. This study had similar results; that is, the protein content of CK was the lowest. In the absence of water stress, increases in carbohydrate accumulation diluted proteins and led to a decrease in the protein content [42]. However, with water stress during grain filling, the carbon fixation was limited, and because there was less synthesis and accumulation of carbohydrates in the seeds, the proteins were not diluted and the contents increased [45,46].
The catastrophe progression method is used to comprehensively evaluate selected indicators. It reduces the weight of indicators and human subjectivity and can also determine the importance of the indicators themselves, which is more scientific and practical. This method has been widely used in the comprehensive evaluation of agricultural practices [47,48]. In this study with winter wheat, the crop yield and quality and GHG emissions were the indices of the comprehensive evaluation of the effects of the different irrigation treatments. The T1 treatment was ranked first in the comprehensive evaluation, with a total mutation membership function value of 0.78. Therefore, the T1 treatment is recommended as the best irrigation scheme to maintain yields and reduce GHG emissions in winter wheat. The results of this study were obtained under automated rolling rainout shelter conditions, which have some limitations and need to be verified in the field in the future.
5. Conclusions
Different irrigation schemes had significantly different effects on the soil GHG emissions during the whole growth period of winter wheat. With water stress applied at different growth stages of winter wheat in different irrigation treatments, the soil CO2 and N2O emissions decreased in the order CK > T4 > T3 > T2 > T1. Although water stress significantly reduced the crop yield, ensuring irrigation from the jointing to filling stages reduced the yield loss. Thus, the T1 treatment was ranked first in the comprehensive evaluation, with a total mutation membership function value of 0.78. Therefore, we recommend the T1 treatment as the best irrigation management strategy to maintain high yields and grain quality and reduce GHG emissions in winter wheat in the arid and semiarid areas of Northwest China.
Author Contributions
Conceptualization, Y.C. and H.C.; methodology, Y.C. and H.C.; software, Y.C.; validation, H.C.; formal analysis, Y.C.; investigation, H.C.; resources, H.C.; data curation, Y.C.; writing—original draft preparation, Y.C.; writing—review and editing, Y.C.; visualization, H.C.; supervision, H.C.; project administration, H.C.; and funding acquisition, H.C. All authors have read and agreed to the published version of the manuscript.
Funding
Funding for this research was provided in part by the National Key Research and Development Program of China (2016YFC0400201).
Institutional Review Board Statement
Not applicable.
Informed Consent Statement
Not applicable.
Data Availability Statement
Not applicable.
Conflicts of Interest
The authors declare no conflict of interest.
References
- Liu, J.; Feng, H.; He, J.; Chen, H.; Ding, D.; Luo, X.; Dong, Q. Modeling wheat nutritional quality with a modified CERES-wheat model. Eur. J. Agron. 2019, 109, 125901. [Google Scholar] [CrossRef]
- Senapati, N.; Stratonovitch, P.; Paul, M.J.; Semenov, M. Drought tolerance during reproductive development is important for increasing wheat yield potential under climate change in Europe. J. Exp. Bot. 2018, 70, 2549–2560. [Google Scholar] [CrossRef] [PubMed] [Green Version]
- Xu, X.; Zhang, M.; Li, J.; Liu, Z.; Zhao, Z.; Zhang, Y.; Zhou, S.; Wang, Z. Improving water use efficiency and grain yield of winter wheat by optimizing irrigations in the North China Plain. Field Crop. Res. 2018, 221, 219–227. [Google Scholar] [CrossRef]
- Thompson, R.; Martínez-Gaitan, C.; Gallardo, M.; Gimenez, C.; Fernández, M. Identification of irrigation and N management practices that contribute to nitrate leaching loss from an intensive vegetable production system by use of a comprehensive survey. Agric. Water Manag. 2007, 89, 261–274. [Google Scholar] [CrossRef]
- Cuello, J.P.; Hwang, H.Y.; Gutierrez, J.; Kim, S.Y.; Kim, P.J. Impact of plastic film mulching on increasing greenhouse gas emissions in temperate upland soil during maize cultivation. Appl. Soil Ecol. 2015, 91, 48–57. [Google Scholar] [CrossRef]
- Rehmani, M.I.A.; Wei, G.; Hussain, N.; Ding, C.; Li, G.; Liu, Z.; Wang, S.; Ding, Y. Yield and quality responses of two indica rice hybrids to post-anthesis asymmetric day and night open-field warming in lower reaches of Yangtze River delta. Field Crop. Res. 2014, 156, 231–241. [Google Scholar] [CrossRef]
- Wang, C.; Zhao, J.; Feng, Y.; Shang, M.; Bo, X.; Gao, Z.; Chen, F.; Chu, Q. Optimizing tillage method and irrigation schedule for greenhouse gas mitigation, yield improvement, and water conservation in wheat–maize cropping systems. Agric. Water Manag. 2021, 248, 106762. [Google Scholar] [CrossRef]
- Hou, H.; Yang, Y.; Han, Z.; Cai, H.; Li, Z. Deficit irrigation effectively reduces soil carbon dioxide emissions from wheat fields in Northwest China. J. Sci. Food Agric. 2019, 99, 5401–5408. [Google Scholar] [CrossRef]
- Akram, R.; Jabeen, T.; Bukari, M.A.; Wajid, S.A.; Mubeen, M.; Rasul, F.; Hussain, S.; Aurangzaib, M.; Bukhari, M.A.; Hammad, H.M.; et al. Research on Climate Change Issues. In Building Climate Resilience in Agriculture: Theory, Practice and Future Perspective; Jatoi, W.N., Mubeen, M., Ahmad, A., Cheema, M.A., Lin, Z., Hashmi, M.Z., Eds.; Springer International Publishing: Cham, Switzerland, 2021; pp. 255–268. [Google Scholar]
- Ma, D.; Sun, D.; Li, Y.; Wang, C.; Xie, Y.; Guo, T. Effect of nitrogen fertilisation and irrigation on phenolic content, phenolic acid composition, and antioxidant activity of winter wheat grain. J. Sci. Food Agric. 2014, 95, 1039–1046. [Google Scholar] [CrossRef]
- Mehrabi, F.; Sepaskhah, A.R. Partial root zone drying irrigation, planting methods and nitrogen fertilization influence on physiologic and agronomic parameters of winter wheat. Agric. Water Manag. 2019, 223, 105688. [Google Scholar] [CrossRef]
- Yang, M.-D.; Leghari, S.J.; Guan, X.-K.; Ma, S.-C.; Ding, C.-M.; Mei, F.-J.; Wei, L.; Wang, T.-C. Deficit Subsurface Drip Irrigation Improves Water Use Efficiency and Stabilizes Yield by Enhancing Subsoil Water Extraction in Winter Wheat. Front. Plant Sci. 2020, 11, 508. [Google Scholar] [CrossRef] [PubMed]
- Cao, Y.; Cai, H.; Sun, S. Effects of growth-stage-based limited irrigation management on the growth, yields, and radiation utilization efficiency of winter wheat in northwest China. J. Sci. Food Agric. 2021, 101, 5819–5826. [Google Scholar] [CrossRef] [PubMed]
- Flagella, Z.; Giuliani, M.M.; Giuzio, L.; Volpi, C.; Masci, S. Influence of water deficit on durum wheat storage protein composition and technological quality. Eur. J. Agron. 2010, 33, 197–207. [Google Scholar] [CrossRef]
- Chukalla, A.D.; Krol, M.S.; Hoekstra, A.Y. Green and blue water footprint reduction in irrigated agriculture: Effect of irrigation techniques, irrigation strategies and mulching. Hydrol. Earth Syst. Sci. 2015, 19, 4877–4891. [Google Scholar] [CrossRef] [Green Version]
- Chukalla, A.D.; Krol, M.S.; Hoekstra, A.Y. Grey water footprint reduction in irrigated crop production: Effect of nitrogen application rate, nitrogen form, tillage practice and irrigation strategy. Hydrol. Earth Syst. Sci. 2018, 22, 3245–3259. [Google Scholar] [CrossRef] [Green Version]
- Shi, X.; Zhang, X.; Yang, X.; Drury, C.F.; McLaughlin, N.B.; Liang, A.; Fan, R.; Jia, S. Contribution of winter soil respiration to annual soil CO2 emission in a Mollisol under different tillage practices in northeast China. Glob. Biogeochem. Cycles 2012, 26, GB2007. [Google Scholar] [CrossRef]
- Zhong, Y.; Li, J.; Xiong, H. Effect of deficit irrigation on soil CO2 and N2O emissions and winter wheat yield. J. Clean. Prod. 2021, 279, 123718. [Google Scholar] [CrossRef]
- Zhang, B.; Liu, X.; Pan, G.; Zheng, J.; Chi, Z.; Li, L.; Zhang, X.; Zheng, J. Changes in Soil Properties, Yield and Trace Gas Emission from a Paddy after Biochar Amendment in Two Consecutive Rice Growing Cycles. Sci. Agric. Sin. 2012, 45, 4844–4853, (In Chinese, with English Abstract). [Google Scholar]
- Zheng, J.; Fan, J.; Zhang, F.; Guo, J.; Yan, S.; Zhuang, Q.; Cui, N.; Guo, L. Interactive effects of mulching practice and nitrogen rate on grain yield, water productivity, fertilizer use efficiency and greenhouse gas emissions of rainfed summer maize in northwest China. Agric. Water Manag. 2021, 248, 106778. [Google Scholar] [CrossRef]
- Zadoks, J.C.; Chang, T.T.; Konzak, C.F. A decimal code for the growth stages of cereals. Weed Res. 1974, 14, 415–421. [Google Scholar] [CrossRef]
- Han, H.; Yang, W. Influence of uniconazole and plant density on nitrogen content and grain quality in winter wheat in South China. Plant Soil Environ. 2009, 55, 159–166. [Google Scholar] [CrossRef]
- Ahmed, K.; Shahid, S.; Harun, S.B.; Ismail, T.; Nawaz, N.; Shamsudin, S. Assessment of groundwater potential zones in an arid region based on catastrophe theory. Earth Sci. Inform. 2015, 8, 539–549. [Google Scholar] [CrossRef]
- Chen, H.; Zhang, Y.; Liu, H.; Meng, X.; Du, W. Cause analysis and safety evaluation of aluminum powder explosion on the basis of catastrophe theory. J. Loss Prev. Process Ind. 2018, 55, 19–24. [Google Scholar] [CrossRef]
- Zhang, H.; Shi, Y.; Qiu, B. Applying catastrophe progression method to evaluate the service quality of cold chain logistics. Complex Intell. Syst. 2020, 1–15. [Google Scholar] [CrossRef]
- Liu, X.; Wan, S.; Su, B.; Hui, D.; Luo, Y. Response of soil CO2 efflux to water manipulation in a tallgrass prairie ecosystem. Plant Soil 2002, 240, 213–223. [Google Scholar] [CrossRef]
- Wu, Z.; Huang, N.E.; Wallace, J.M.; Smoliak, B.V.; Chen, X. On the time-varying trend in global-mean surface temperature. Clim. Dyn. 2011, 37, 759–773. [Google Scholar] [CrossRef] [Green Version]
- Wang, X.Y.; Cai, H.-J.; Li, L.; Xu, J.-T.; Chen, H. Effects of Water Deficit on Greenhouse Gas Emission in Wheat Field in Different Periods. Environ. Sci. 2019, 40, 2413–2425, (In Chinese, with English Abstract). [Google Scholar]
- Richardson, A.D.; Hollinger, D.Y.; Shoemaker, J.K.; Hughes, H.; Savage, K.; Davidson, E.A. Six years of ecosystem-atmosphere greenhouse gas fluxes measured in a sub-boreal forest. Sci. Data 2019, 6, 117. [Google Scholar] [CrossRef] [Green Version]
- Win, E.P.; Win, K.K.; Bellingrath-Kimura, S.D.; Oo, A.Z. Influence of rice varieties, organic manure and water management on greenhouse gas emissions from paddy rice soils. PLoS ONE 2021, 16, e0253755. [Google Scholar] [CrossRef]
- Amha, Y.; Bohne, H. Denitrification from the horticultural peats: Effects of pH, nitrogen, carbon, and moisture contents. Biol. Fertil. Soils 2011, 47, 293–302. [Google Scholar] [CrossRef]
- Zhang, Z.; Chen, J.; Liu, T.; Cao, C.; Li, C. Effects of nitrogen fertilizer sources and tillage practices on greenhouse gas emissions in paddy fields of central China. Atmos. Environ. 2016, 144, 274–281. [Google Scholar] [CrossRef]
- Wang, J.; Xiong, Z.; Yan, X. Fertilizer-induced emission factors and background emissions of N2O from vegetable fields in China. Atmos. Environ. 2011, 45, 6923–6929. [Google Scholar] [CrossRef]
- Sepaskhah, A.R.; Hosseini, S.N. Effects of Alternate Furrow Irrigation and Nitrogen Application Rates on Yield and Water-and Nitrogen-Use Efficiency of Winter Wheat (Triticum aestivum L.). Plant Prod. Sci. 2008, 11, 250–259. [Google Scholar] [CrossRef]
- Ullah, H.; Santiago-Arenas, R.; Ferdous, Z.; Attia, A.; Datta, A. Improving water use efficiency, nitrogen use efficiency, and radiation use efficiency in field crops under drought stress: A review. Adv. Agron. 2019, 156, 109–157. [Google Scholar]
- Ali, S.; Xu, Y.; Ahmad, I.; Jia, Q.; Ma, X.; Sohail, A.; Manzoor; Arif, M.; Ren, X.; Cai, T.; et al. The ridge-furrow system combined with supplemental irrigation strategies to improves radiation use efficiency and winter wheat productivity in semi-arid regions of China. Agric. Water Manag. 2019, 213, 76–86. [Google Scholar] [CrossRef]
- Jamieson, P.; Martin, R.; Francis, G.; Wilson, D. Drought effects on biomass production and radiation-use efficiency in barley. Field Crop. Res. 1995, 43, 77–86. [Google Scholar] [CrossRef]
- Rajala, A.; Hakala, K.; Mäkelä, P.; Muurinen, S.; Peltonen-Sainio, P. Spring wheat response to timing of water deficit through sink and grain filling capacity. Field Crop. Res. 2009, 114, 263–271. [Google Scholar] [CrossRef]
- Li, C.; Liu, W.Z.; Lin, W.; Han, X.Y.; Zhou, L.; Wang, Y.P. Grain Yield and WUE Responses to Different Soil Water Storage before Sowing and Water Supplies During Growing Period for Winter Wheat in the Loess Tableland. Sci. Agric. Sin. 2017, 50, 3549–3560, (In Chinese, with English Abstract). [Google Scholar]
- Qiu, G.Y.; Wang, L.; He, X.; Zhang, X.; Chen, S.; Chen, J.; Yang, Y. Water use efficiency and evapotranspiration of winter wheat and its response to irrigation regime in the north China plain. Agric. For. Meteorol. 2008, 148, 1848–1859. [Google Scholar] [CrossRef]
- Wieser, H.; Seilmeier, W. The influence of nitrogen fertilisation on quantities and proportions of different protein types in wheat flour. J. Sci. Food Agric. 1998, 76, 49–55. [Google Scholar] [CrossRef]
- Wang, Y.; Frei, M. Stressed food–The impact of abiotic environmental stresses on crop quality. Agric. Ecosyst. Environ. 2011, 141, 271–286. [Google Scholar] [CrossRef]
- Noorka, I.R.; da Silva, J.A.T. Mechanistic insight of water stress induced aggregation in wheat (Triticum aestivum L.) quality: The protein paradigm shift. Not. Sci. Biol. 2012, 4, 32–38. [Google Scholar] [CrossRef] [Green Version]
- Rezaei, M.; Zehtab-Salmasi, S.; Najafi, N.; Ghassemi-Golezani, K.; Jalalikamali, M. Effects of water deficit on nutrient content and grain protein of bread wheat genotypes. J. Food Agric. Environ. 2010, 8, 535–539. [Google Scholar]
- Yamagata, M.; Kouchi, H.; Yoneyama, T. Partitioning and Utilization of Photosynthate Produced at Different Growth Stages after Anthesis in Soybean (Glycine max L. Merr.): Analysis by Long-term 13C-Labelling Experiments. J. Exp. Bot. 1987, 38, 1247–1259. [Google Scholar] [CrossRef]
- Gebbing, T.; Schnyder, H. Pre-Anthesis Reserve Utilization for Protein and Carbohydrate Synthesis in Grains of Wheat. Plant Physiol. 1999, 121, 871–878. [Google Scholar] [CrossRef] [Green Version]
- Su, S.; Zhang, Z.; Xiao, R.; Jiang, Z.; Chen, T.; Zhang, L.; Wu, J. Geospatial assessment of agroecosystem health: Development of an integrated index based on catastrophe theory. Stoch. Environ. Res. Risk Assess. 2012, 26, 321–334. [Google Scholar] [CrossRef]
- Ionescu, R.V.; Zlati, M.L.; Antohi, V.M.; Stanciu, S. Modelling EU agriculture’s regional disparities under the national accounting system’s approach. The impact of the new economic and environmental challenges. Econ. Res.-Ekon. Istraživanja 2020, 34, 902–928. [Google Scholar] [CrossRef]
Figure 1.
Main steps in the catastrophe progression method (a) and evaluation indices of irrigation treatments used in the catastrophe progression method (b).
Figure 1.
Main steps in the catastrophe progression method (a) and evaluation indices of irrigation treatments used in the catastrophe progression method (b).

Figure 2.
Changes in soil CO2 fluxes (mg m−2 h−1) under different irrigation treatments during a winter wheat growing season. The blue arrows denote irrigation; vertical bars represent standard errors (SE, n = 3). Different lowercase letters show that the mean values are significant based on LSD multiple range tests at p < 0.05.

Figure 3.
Cumulative soil CO2 emissions (kg ha−1) under different irrigation treatments during a winter wheat growing season.
Figure 3.
Cumulative soil CO2 emissions (kg ha−1) under different irrigation treatments during a winter wheat growing season.

Figure 4.
Changes in the soil N2O fluxes (µg m−2 h−1) under different irrigation treatments during a winter wheat growing season. The blue arrows denote irrigation.
Figure 4.
Changes in the soil N2O fluxes (µg m−2 h−1) under different irrigation treatments during a winter wheat growing season. The blue arrows denote irrigation.

Figure 5.
Cumulative soil N2O emissions (kg ha−1) under different irrigation treatments during a winter wheat growing season.
Figure 5.
Cumulative soil N2O emissions (kg ha−1) under different irrigation treatments during a winter wheat growing season.

Figure 6.
Winter wheat grain yield (kg ha−1) under different irrigation regimes; vertical bars represent standard errors (SE, n = 3). Different lowercase letters show that the mean values are significant based on LSD multiple range tests at p < 0.05.
Figure 6.
Winter wheat grain yield (kg ha−1) under different irrigation regimes; vertical bars represent standard errors (SE, n = 3). Different lowercase letters show that the mean values are significant based on LSD multiple range tests at p < 0.05.

Figure 7.
Winter wheat grain protein content (%) under different irrigation regimes; vertical bars represent standard errors (SE, n = 3). Different lowercase letters show that the mean values are significant based on LSD multiple range tests at p < 0.05.
Figure 7.
Winter wheat grain protein content (%) under different irrigation regimes; vertical bars represent standard errors (SE, n = 3). Different lowercase letters show that the mean values are significant based on LSD multiple range tests at p < 0.05.

Figure 8.
Comprehensive evaluation results of each irrigation treatment.


Table 1.
Normalization formulas for catastrophe theory.
| Name | Control Variable | State Variable | Normalization Formula |
|---|---|---|---|
| Cusp model | 2 | 1 | xa = a1/2 and xb = b1/3 |
Note: x is the state variable, and a and b are control variables.
Publisher’s Note: MDPI stays neutral with regard to jurisdictional claims in published maps and institutional affiliations. |
© 2022 by the authors. Licensee MDPI, Basel, Switzerland. This article is an open access article distributed under the terms and conditions of the Creative Commons Attribution (CC BY) license (https://creativecommons.org/licenses/by/4.0/).
Share and Cite
MDPI and ACS Style
Cao, Y.; Cai, H. Effects of Growth Stage-Based Limited Irrigation Management on Soil CO2 and N2O Emissions, Winter Wheat Yield and Nutritional Quality. Agronomy 2022, 12, 952. https://0-doi-org.brum.beds.ac.uk/10.3390/agronomy12040952
AMA Style
Cao Y, Cai H. Effects of Growth Stage-Based Limited Irrigation Management on Soil CO2 and N2O Emissions, Winter Wheat Yield and Nutritional Quality. Agronomy. 2022; 12(4):952. https://0-doi-org.brum.beds.ac.uk/10.3390/agronomy12040952
Chicago/Turabian StyleCao, Yuxin, and Huanjie Cai. 2022. "Effects of Growth Stage-Based Limited Irrigation Management on Soil CO2 and N2O Emissions, Winter Wheat Yield and Nutritional Quality" Agronomy 12, no. 4: 952. https://0-doi-org.brum.beds.ac.uk/10.3390/agronomy12040952
Note that from the first issue of 2016, this journal uses article numbers instead of page numbers. See further details here.