Article

Morphophysiological Responses of Two Cool-Season Turfgrasses with Different Shade Tolerances

1
College of Horticulture and Landscaping, Northeast Agricultural University, Harbin 150000, China
2
College of Animal Science and Technology, Northeast Agricultural University, Harbin 150000, China
*
Authors to whom correspondence should be addressed.
These authors contributed equally to this work.
Submission received: 30 March 2022 / Revised: 12 April 2022 / Accepted: 14 April 2022 / Published: 15 April 2022

Abstract

:
Understanding the differences in cool-season turfgrass responses to shade is critical for future turfgrass management and breeding for improved shade tolerance. The purpose of this study was to evaluate the shade-tolerance mechanisms of two cool-season turfgrass species in terms of turf performance, growth, and physiological characteristics. Two turfgrass species, namely, ’SupraNova’ (Poa. supina Schrad.) and ‘Lark’ (Lolium perenne L.), were subjected to 0 (CK, unshaded), 35% (LS), 70% (MS), and 92% (HS) shade, respectively. Compared with ‘Lark’, ‘SupraNova’ showed better turf quality (TQ) and turf color intensity (TCI) under shade. The total length and surface area of the roots of ‘Lark’ gradually decreased as the shade increased, while those of ‘SupraNova’ increased and then decreased with increasing shade. The chlorophyll fluorescence photochemical quenching coefficient (qP), electron transport rate (ETR), and maximum quantum yield of primary photosystem II (PSII) photochemistry (Fv/Fm) decreased significantly under HS; however, these decreases were more significant in ‘Lark’ than in ‘SupraNova’. The leaf reflectance of the two turfgrasses under shade was lower than that under CK, but the leaf reflectance of ‘Lark’ was higher than that of ‘SupraNova’ in the visible light band. The normalized difference vegetation index (NDVI) of the two grasses first decreased and then increased. The NDVI of ‘Lark’ under shade was slightly higher than that under CK. ‘SupraNova’ showed strong tolerance on the basis of malondialdehyde (MDA), hydrogen peroxide (H2O2), superoxide anion (O2·), and ascorbic acid (AsA) contents and superoxide dismutase (SOD), peroxidase (POD), and catalase (CAT) activity. The MDA, H2O2, O2·, and AsA contents and SOD, POD, and CAT activity (which represent indicators) changed the most under MS. Taken together, the results indicated that the adaptability of ‘SupraNova’ to shade was better than that of ‘Lark’.

1. Introduction

Light is a signal factor for plant morphogenesis and can induce, promote, and regulate plant growth, development, and differentiation [1]. Plant components are extremely sensitive to changes in light conditions, and their morphological characteristics as well as nutrient uptake rates can change to adapt to different light environments [2]. Throughout their long-term evolution, plants have developed appropriate countermeasures to cope with changes in light conditions [3]. When plants are shaded, their morphology and physiology can change to increase the ability to collect and absorb more light, while reducing any potential harm [4]. Turf quality (TQ) and turf color intensity (TCI) are the first indicators of a plant’s ability to adapt to shaded conditions [5].
Roots can synthesize plant hormones, organic acids, and amino acids and transmit stress signals that in turn can induce the opening and closing of stomata [6]. In maize (Zea mays L.), disrupted light treatment increased the formation of fine roots and specific root length [7]. Moderate light is generally favorable for photosynthesis and promotes root development through the delivery of photosynthesis products to the roots [8]. Studying the characteristics of turfgrass root systems is helpful for revealing the morphological and physiological mechanisms through which turfgrasses adapt to different stresses and provides a foundation for increased turf production.
The light energy absorbed by plants is mainly consumed through photosynthetic electron transfer, chlorophyll fluorescence, and heat dissipation, among other processes [9]. Chlorophyll fluorescence is closely related to various processes in the photosynthetic reaction and reflects the photosynthesis ability and efficiency of plants [10]. Therefore, studying chlorophyll fluorescence is an effective way to study plant photosynthesis [11]. The maximum quantum yield of primary photosystem II (PSII) photochemistry (Fv/Fm) usually reflects the potential maximum photochemical efficiency of a plant and the maximum light energy conversion rate of the PSII reaction center [12]. Although the chlorophyll fluorescence parameters of different plants respond differently to different light intensities, the value of Fv/Fm decreases as the degree of shade increases, as has been shown in soybean (Glycine max L.) [13]. Shade has also been shown to reduce the value of Fv/Fm of bryophytes and Camellia japonica L. [14,15]. The photochemical quenching coefficient (qP) reflects the amount of open PSII reaction centers and the electron share of light energy absorbed by the photosynthetic pigments [16]. The electron transfer rate (ETR) is closely related to the net photosynthetic rate of plants [17]. Shade can actually reduce the value of the ETR in oak (Quercus palustris Münchh.) [18]. At present, research on the fluorescence parameters and photosynthetic characteristics of different turfgrasses has mainly focused on the effects of nitrogen fertilizer application, heavy metal ions, drought stress, and waterlogging, but there are few studies on the effects of shade [17]. Thus, it is particularly important to explore the changes in fluorescence parameters and photosynthetic characteristics of turfgrasses under shade conditions.
Many researchers have used the various characteristics of vegetation spectral emissivity under environmental stress to study the impact of pollutants on plant physiology and ecology, and indirectly infer the scope and intensity of specific environmental stress. The advantage of this method is that it can be applied for rapid and large-area real-time dynamic monitoring [19]. In this paper, the hyperspectral response characteristics of leaves of two turfgrass species under shade stress were studied by means of hyperspectral remote sensing technology, and the spectral response modes of the two turfgrass species under shade stress were explored to provide a basis for the different shade tolerances of the two species.
Osmotic regulation of plant cells is an important metabolic regulatory mechanism in plants [20]. One of the mechanisms by which plants respond to changes in their environment is through changes in soluble protein (SP), soluble sugar (SS), and free proline (Pro) contents [21]. When plants face stressful environments, the contents of SP and SS can shift such that the osmotic pressure in the plant cells is maintained; both of these compounds are key products of plant carbon metabolism, as has been confirmed in wheat (Triticum aestivum L.) [22]. Plants accumulate osmotic solutes (SS and SP) in response to drought to increase the amount of aqueous solution in cells, lower the osmotic potential to enable water absorption, maintain cell turgor, and ensure cell development and metabolism [23]. SSs serve two important functions in plants: they act as photosynthesis products for plant growth and development and as osmotic regulators to the balance osmotic potential of cells [24]. Pro is a component of plant proteins and usually exists in a free state in plants [25]. When plants are subjected to different environmental stresses, Pro accumulates in large quantities to regulate the osmotic pressure in the cytoplasm of cells, thereby maintaining normal plant growth [26]. The physiological foundations of Lolium shade tolerance were studied in Eucalyptus grandis forests with various canopy densities, and it was discovered that as canopy density increased, the content of Pro decreased gradually [27].
Under shade conditions, the balance of the enzymatic system in plants is affected, and excess reactive oxygen species (ROS) produced in the cells aggravate peroxidation of the cell membrane. In response to this, plants employ enzymatic and nonenzymatic antioxidant defense systems to remove excess ROS and protect their photosynthetic components and cell membranes from injury, as has been shown in rye (Secale cereale L.) [28]. Nonenzymatic antioxidants such as reduced ascorbic acid (AsA) are utilized to scavenge harmful substances such as free radicals, peroxides, and ROS. Likewise, antioxidant enzymes constitute one of the main means by which plants cope with environmental stresses [29]. Among these, superoxide dismutase (SOD), peroxidase (POD), and catalase (CAT) are the main enzymes composing the plant protection and defense system. SOD is the first line of defense of the antioxidant system. SOD can remove superoxide anions (O2·), which are damaging to plants. CAT mainly removes excess hydrogen peroxide (H2O2) in plants, and POD can help prevent the toxic effects of H2O2 and of phenols and amines on plants [30]. Under shade conditions, the interaction between these enzymes can ensure the normal operation of the plant antioxidant defense mechanism [31].
Malondialdehyde (MDA) is a typical product of plant membrane peroxidation, and its content can indicate the degree of membrane damage. Some enzyme-catalyzed processes and the auto-oxidation process of certain biological substances can produce O2·, H2O2, and others. Studies have shown that shade can significantly reduce the O2· content in plants, but there is currently no strong agreement on these effects [32]. Research regarding the antioxidant system and active oxygen of turfgrasses under shade conditions has been adequately addressed, but comparative research between cool-season turfgrasses under shade is still relatively rare. The current study aimed to explore this research gap.
It is unclear how cool-season turfgrasses react to shade in terms of plant morphological and physiological responses and turf performance. Therefore, the purpose of this study was to investigate the effects of turfgrass shade on two turfgrass species that have differential tolerances to shade, i.e., the strongly light-tolerant ‘SupraNova’ (Poa. supina Schrad.), and the weakly light-tolerant ‘Lark’ (Lolium perenne L.) (Ref. [33]), on turf performance and their morphological and physiological responses.

2. Materials and Methods

2.1. Plant Materials and Cultivation

Two cool-season turfgrass species, namely, ‘SupraNova’ (Poa. supina Schrad.) and ‘Lark’ (Lolium perenne L.), were selected as test materials. ‘SupraNova’ is a European-bred cultivar with a high shade-tolerance ability, provided by British Seed Houses, London, UK; in contrast to ‘SupraNova’, ‘Lark’ is a weakly shade-tolerant cultivar, which was provided by Topgreen Turf Company in Beijing, China. This study involved two experiments. A pot experiment was carried out at the Northeast Agricultural University Horticulture Station in Harbin, Heilongjiang Province, Northeast China (45°43′ N, 126°43′ E). Sod of each species was collected from turfgrass plots at the Horticulture Research Center of Northeast Agricultural University. For each species, 30 plants were cultivated in polyvinyl chloride (PVC) pots (15 cm diameter and 20 cm height) filled with black loam soil (16.8 g·kg −1 of organic matter and a pH of 7.0). The two turfgrass species were mowed as needed to maintain a height at 4.5 cm and were irrigated with 1000 mL·pot −1 of water every week. During the experiment, the average minimum and maximum air temperatures in the greenhouse were 25.6 °C and 19.8 °C, respectively. Both turfgrasses were subjected to a relative humidity of 60% and 13 h of illumination (1425 ± 59 μmol m −2·s −1) per day. Two months after planting, a gradient of shade was applied to the two turfgrass species. This study used a completely randomized design with four different levels of shade treatments. Each species was replicated 4 times in each treatment. The shade treatments were as follows: (1) CK (the control treatment, which involved a normal light treatment without shade); (2) LS (35% shade treatment resulting from covering the pots with a single layer of a shade net); (3) MS (70% shade treatment resulting from covering the pots with two layers of a shade net); and (4) HS (92% shade treatment resulting from covering the pots with three layers of a shade net). The shade treatments were applied on 21 June 2021 and stayed until 4 August 2021, when the experiment came to an end. The light intensity was measured with a light meter (Spectrum 3413F, Sullivan County, NH, USA). There were 4 pots per species at each shade level, with 20 plants in each pot, for a total of 32 pots.
The field test was conducted at the Horticulture Research Center of Northeast Agricultural University, Harbin (45°43′ N, 126°43′ E). There were 4 replicates for each treatment, and the plot area was 1 × 1 m2. The turfgrass in the plots was collected from 2-year-old turfgrass plots. A randomized block design was applied to all the plots. According to the greenhouse test results, LS, which was most suitable for turfgrass growth, was selected for determining the spectral data, and the experiment was carried out on 6 August 2021. Canopy spectra were measured for both species at 15 d under CK and LS.

2.2. Turf Quality (TQ) and Turf Color Intensity (TCI)

Turf quality (TQ) and turf color intensity (TCI) were determined as previously described [17,34]. A rating system of 1–9 was used for these, with 1 indicating very poor color and uniformity, 9 indicating excellent (deepest and best) color and uniformity, and 6 indicating the lowest permissible values for medium color and uniformity.

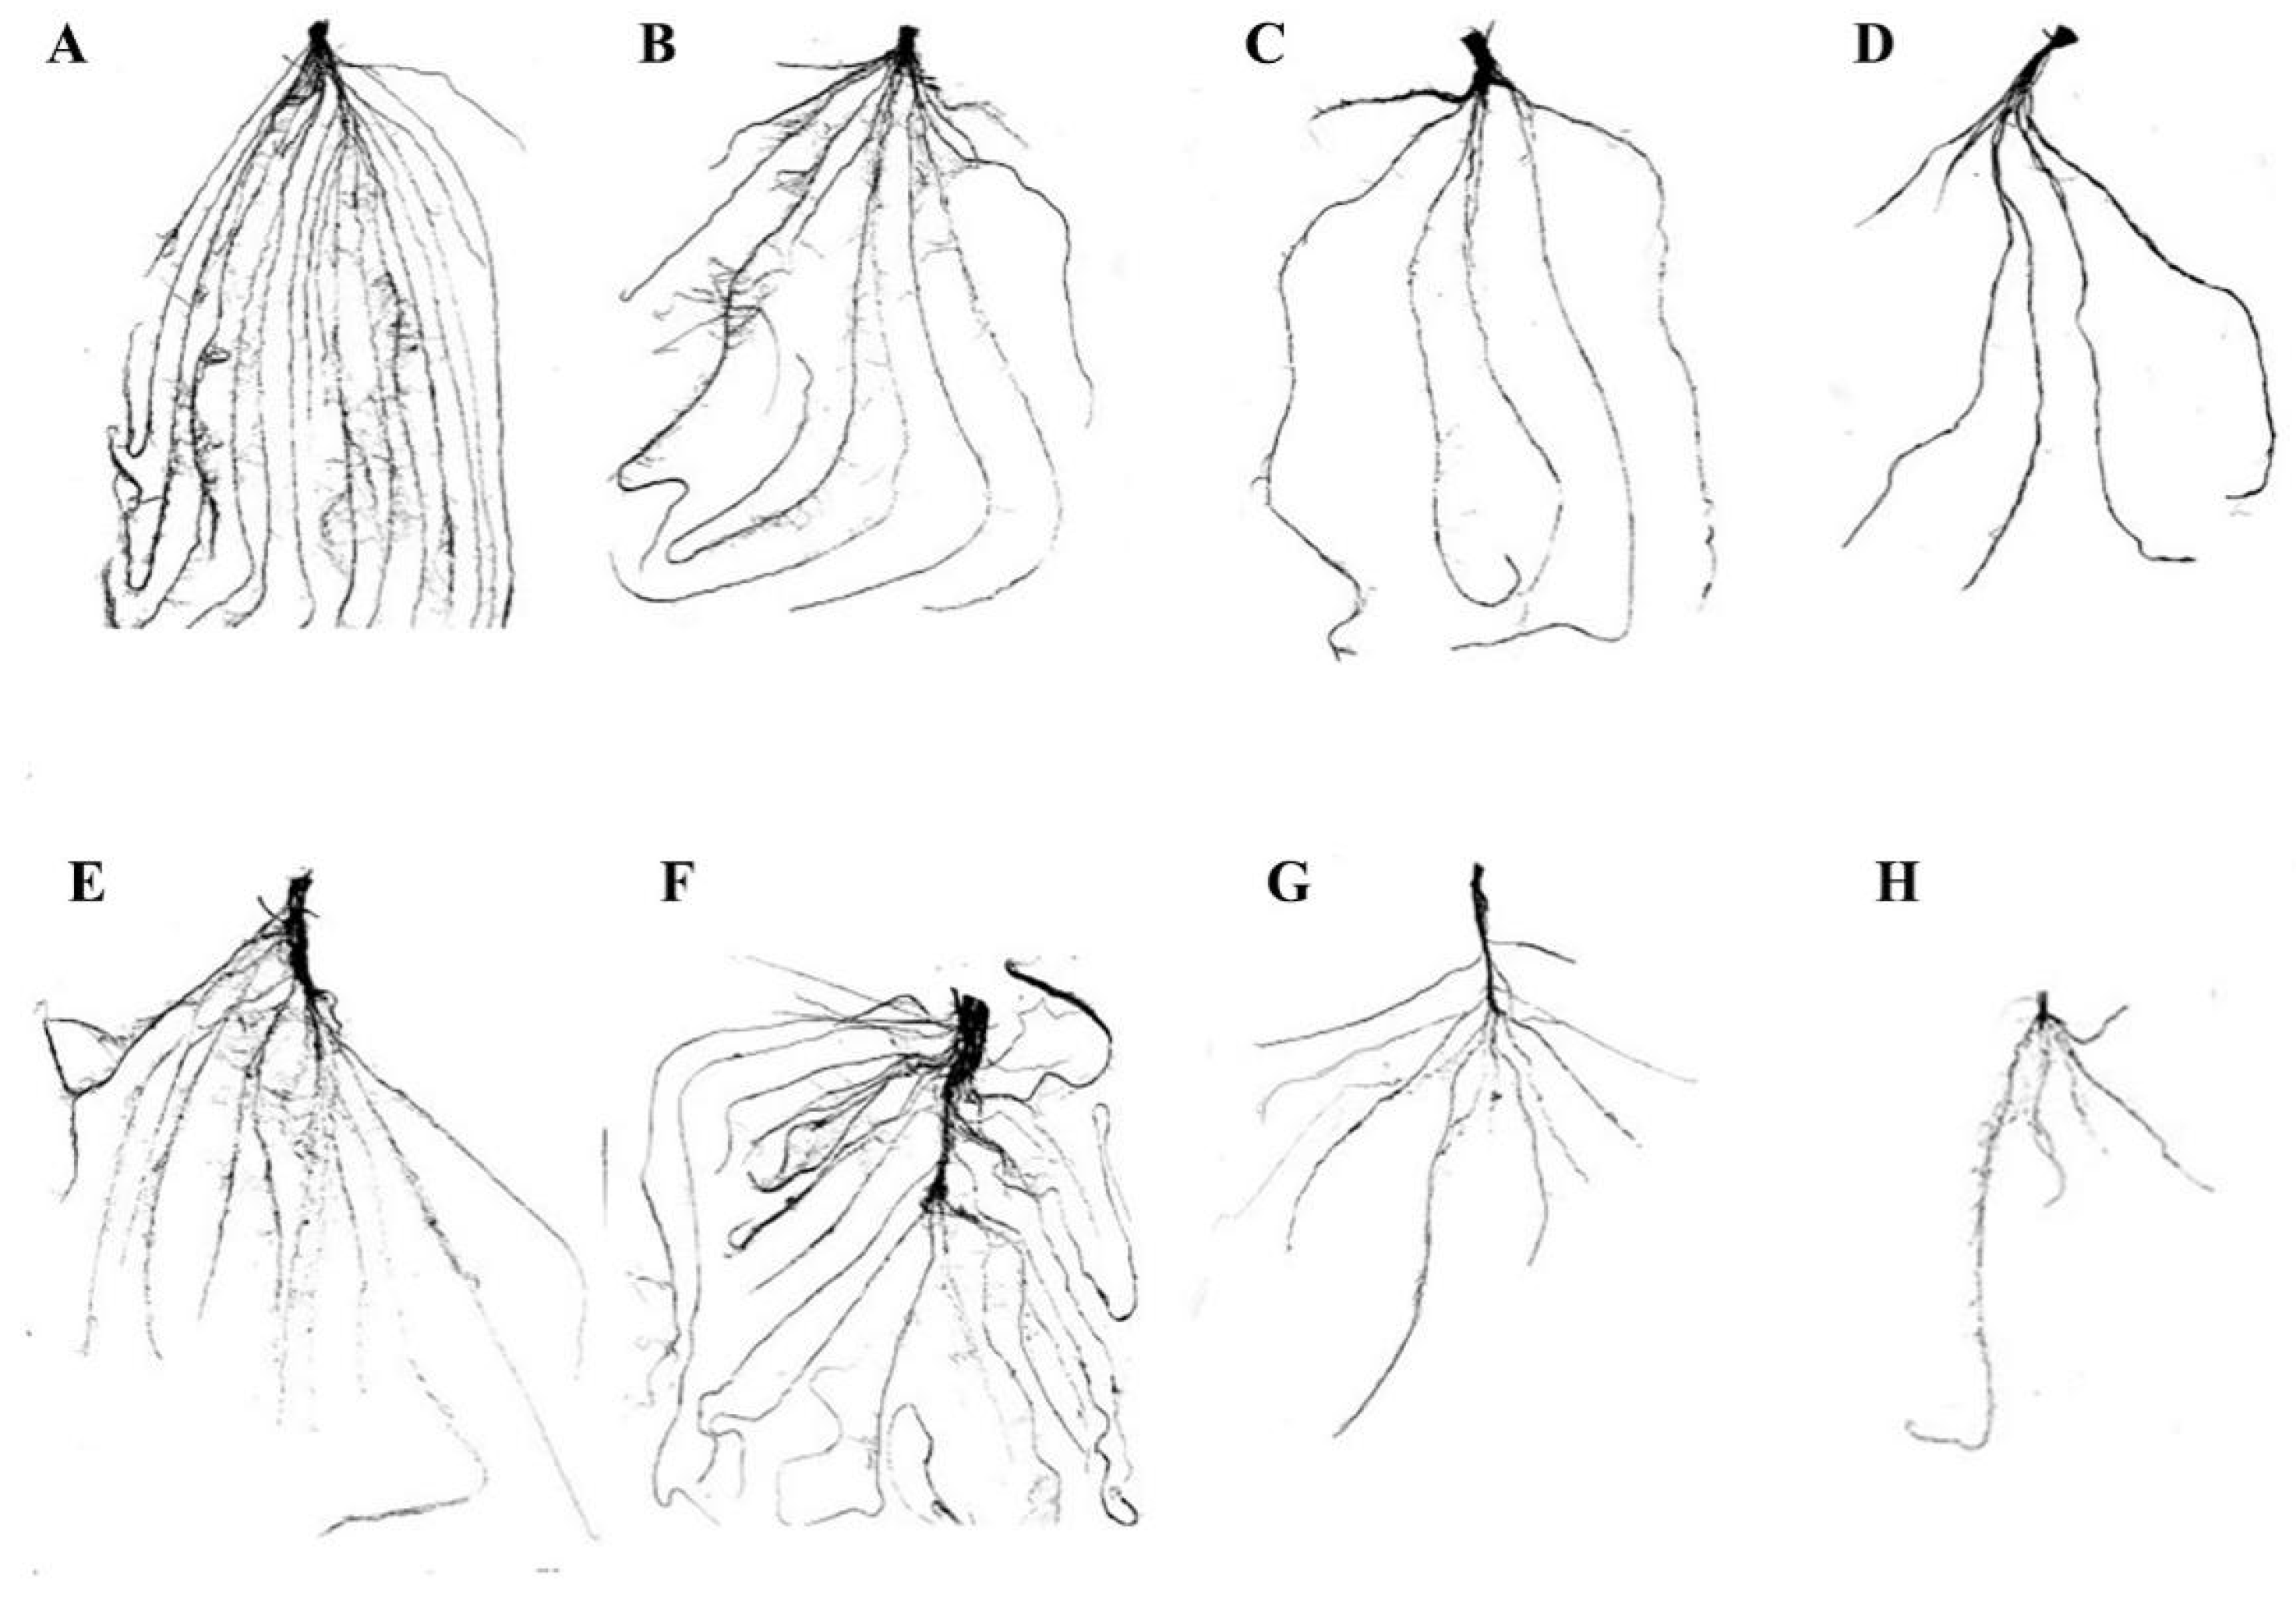
2.3. Root Morphology

After 45 d of shade treatment, 4 plants of each test material were randomly selected from each pot under each shade gradient, and the root morphology was determined. After washing with distilled water, the plant roots were cut with an alcohol-sterilized blade, and the roots were carefully placed on the glass plate of a root scanner (LA-S Series Plant Root Analyzer, Beijing, China), which was used to scan the roots and obtain the average value of length and surface area.

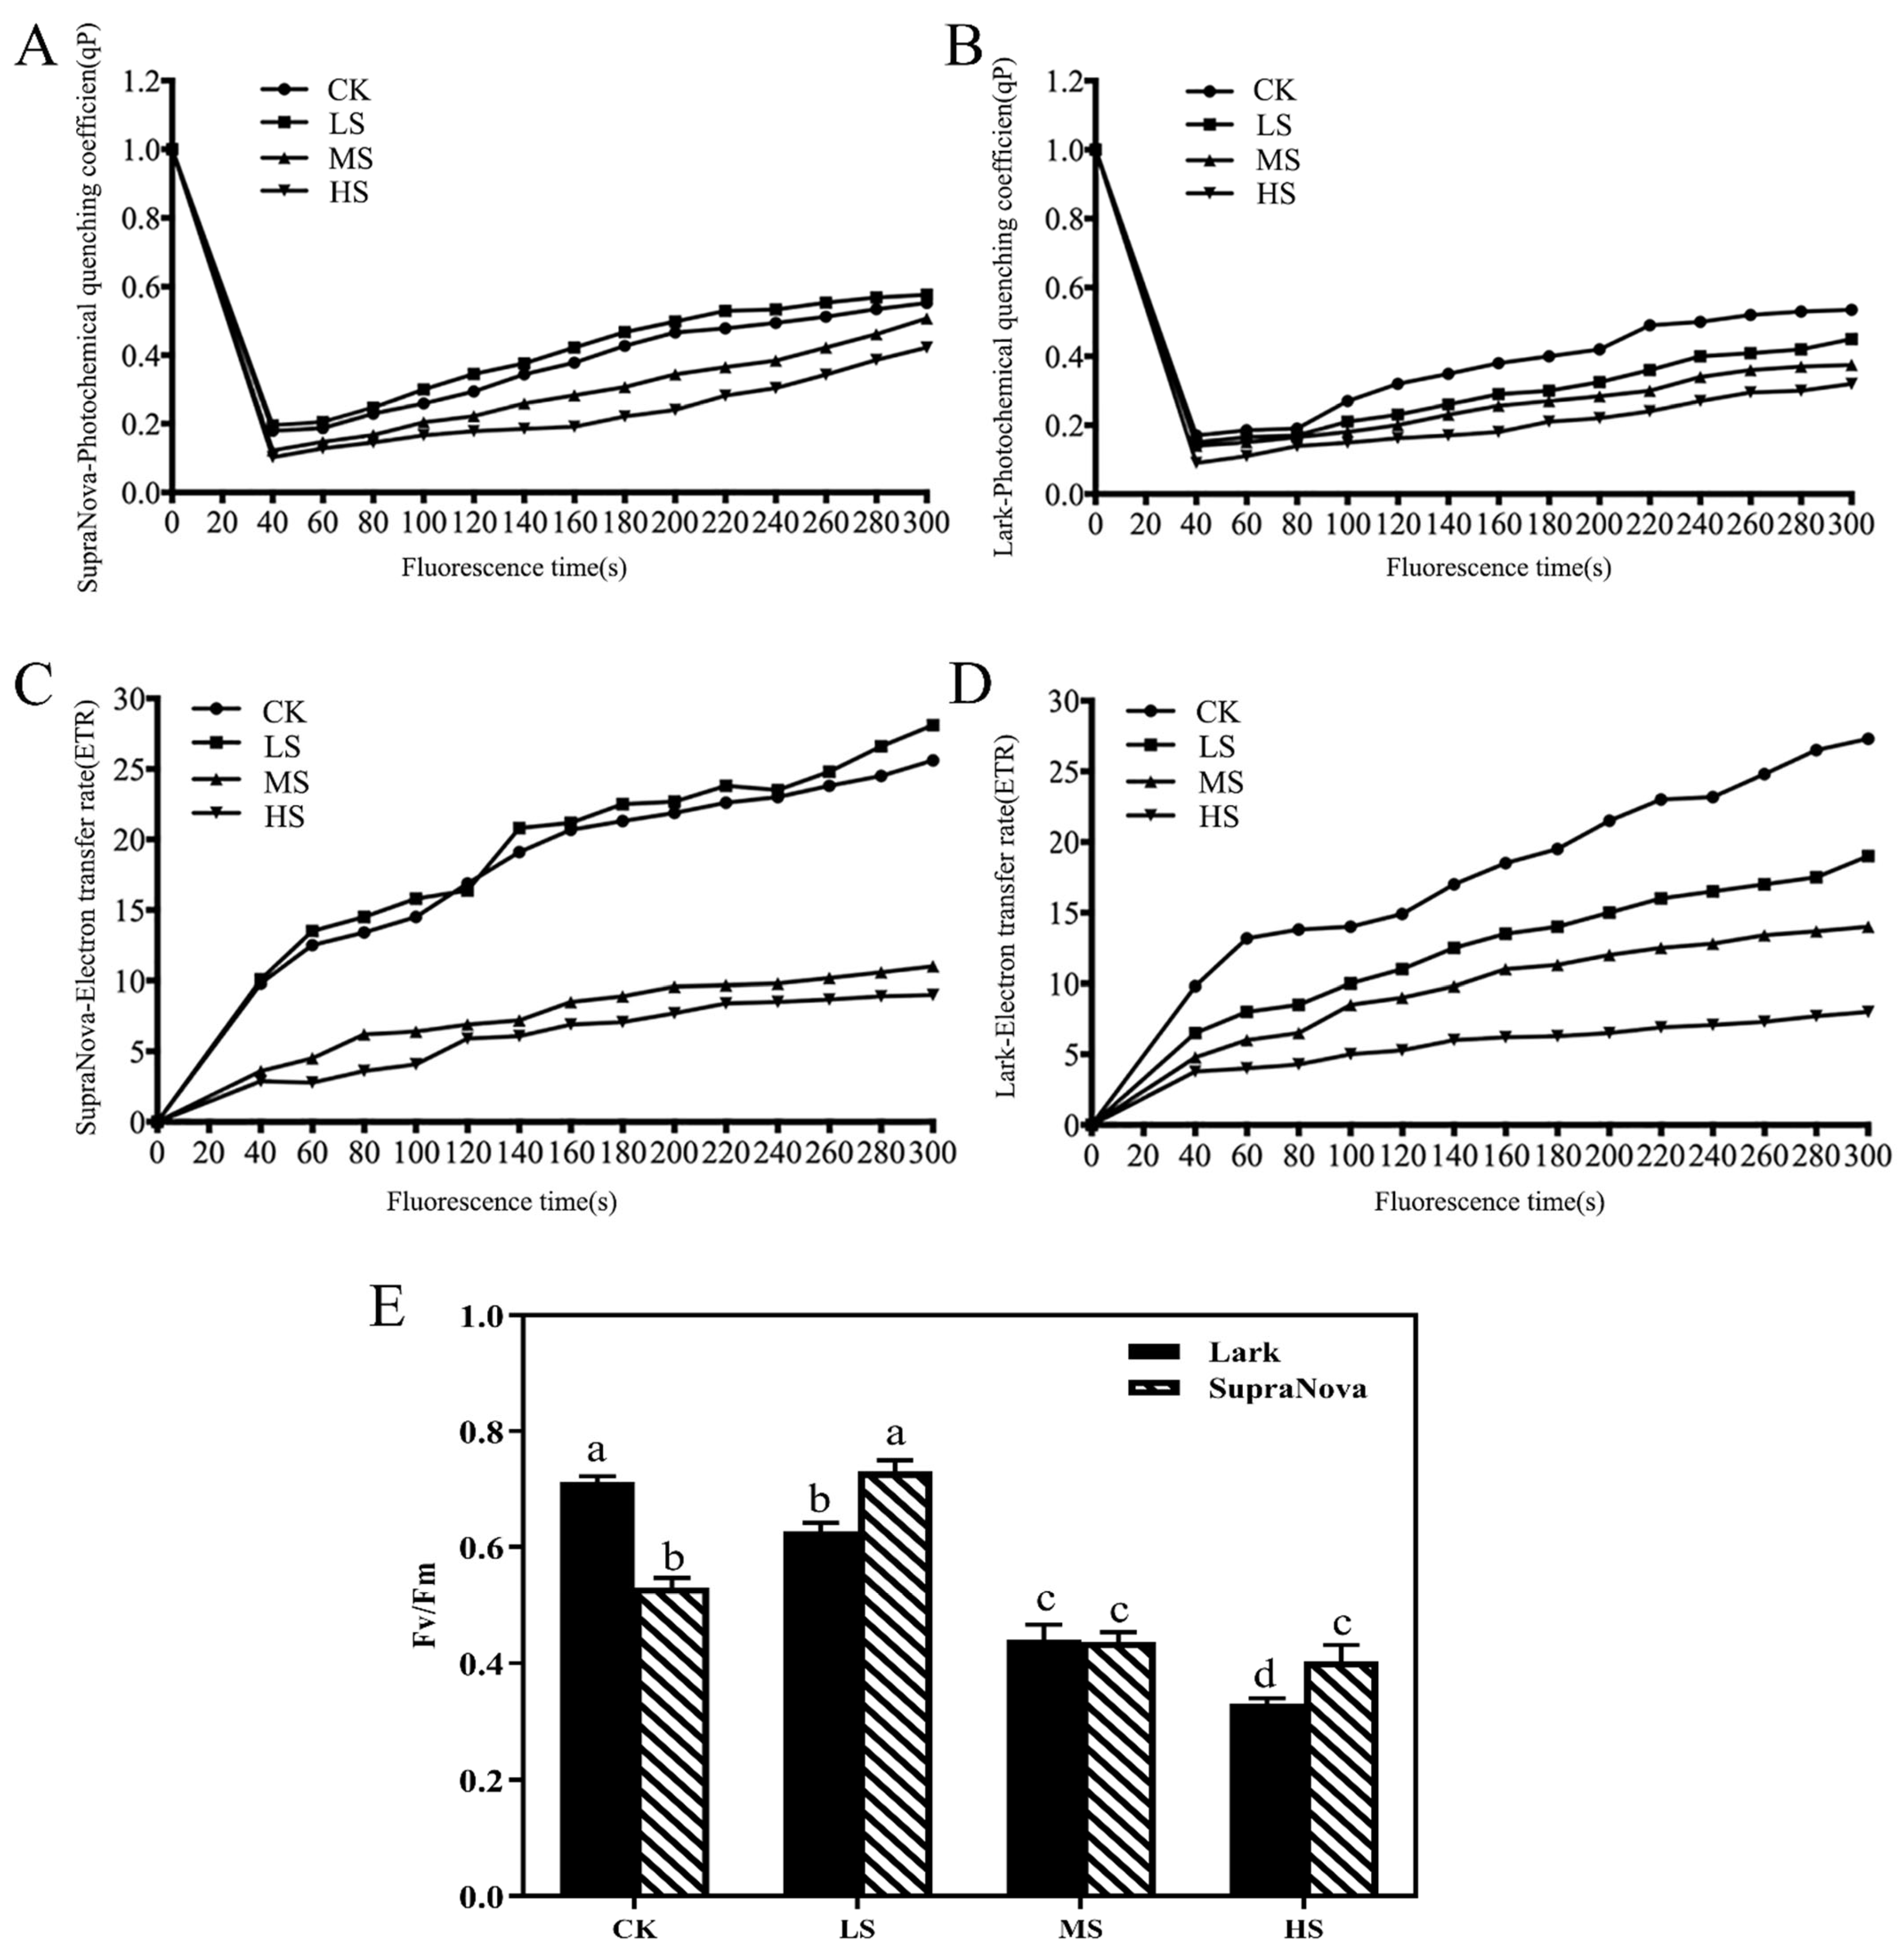
2.4. Chlorophyl a Fluorescence

The chlorophyll fluorescence imaging system (IMAGING-PAM, Nuremberg, Germany) was used to determine the chlorophyll fluorescence parameters of 4 randomly selected leaves for each species. After 45 d of shade treatment, 4 pots from each shade gradient of each species were collected. After 30 min of dark treatment, the plants were placed on the chlorophyll fluorescence imaging system instrument to measure the photochemical quenching coefficient (qP), electron transfer efficiency (ETR), and maximum quantum yield of primary PSII photochemistry (Fv/Fm).

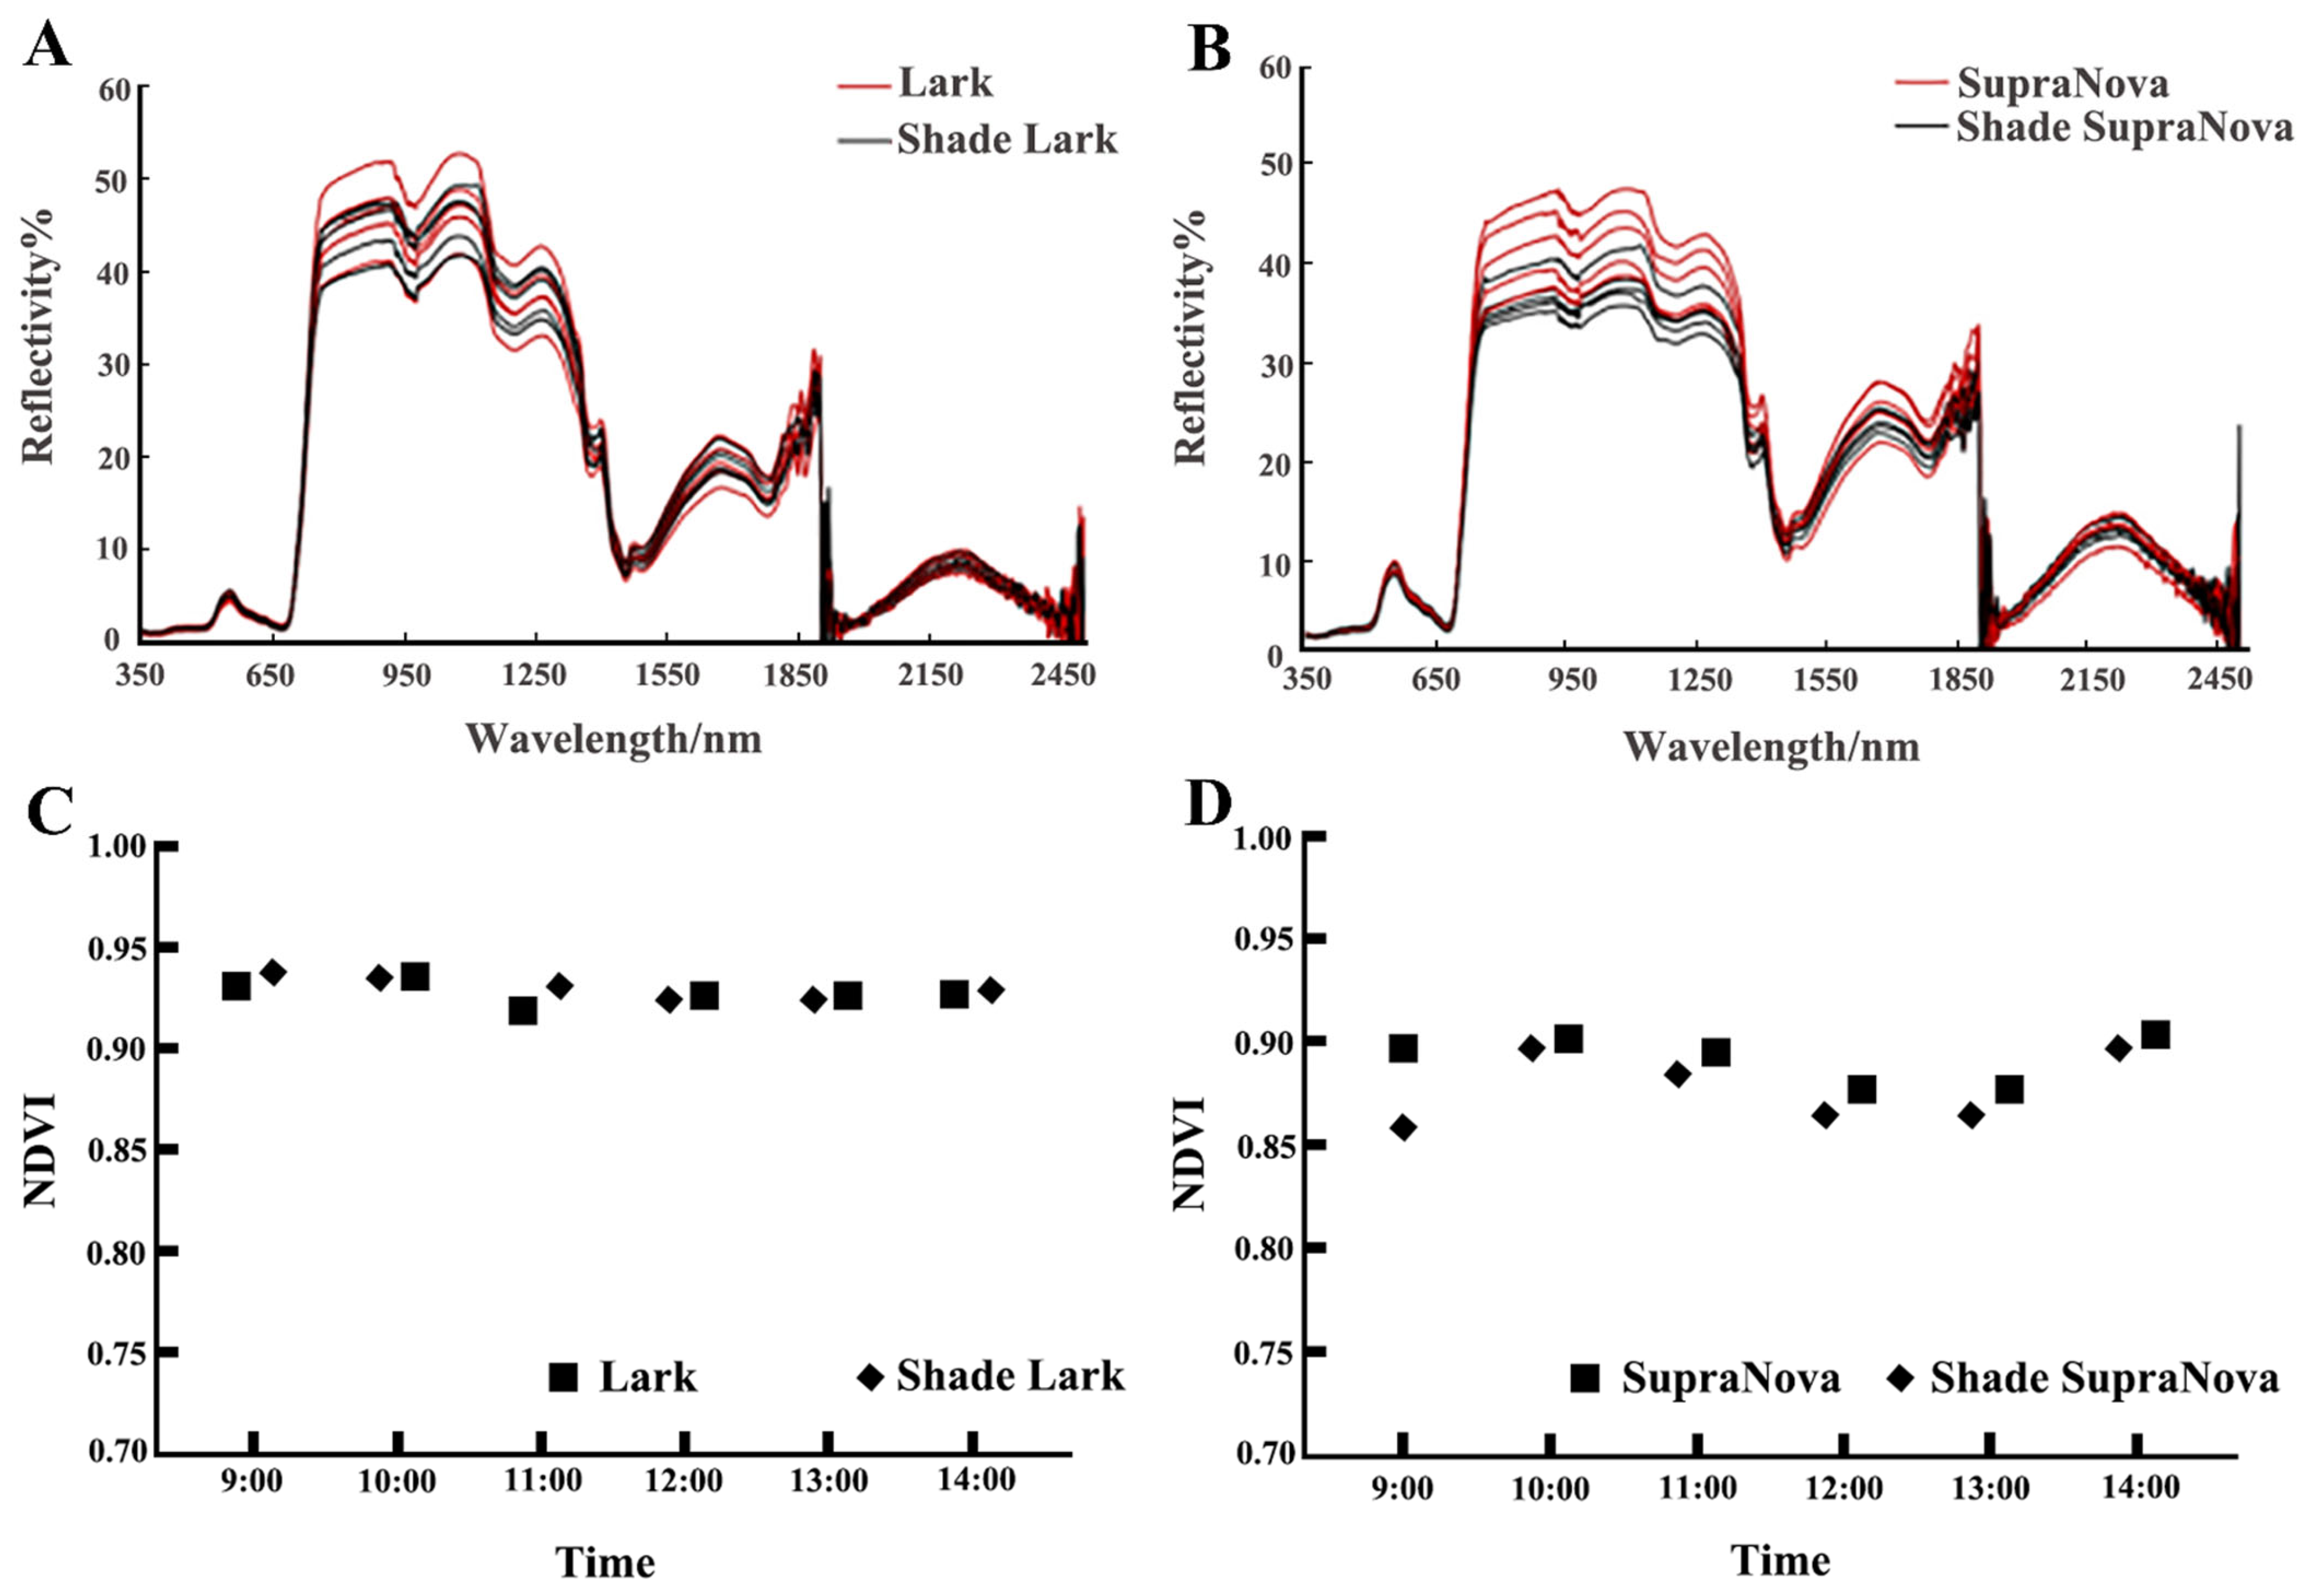
2.5. Spectral Determination

The canopy spectra of the two species were measured under CK and LS (ASD Field-Spec handheld meter, Sichuan, China). The spectrometer was operated every hour from 9:00 to 14:00 and was oriented vertically downward at a height of 1 m from the turf. A white board was used for calibration before each measurement. During each test, the target was sampled 10 times, with the average value used.

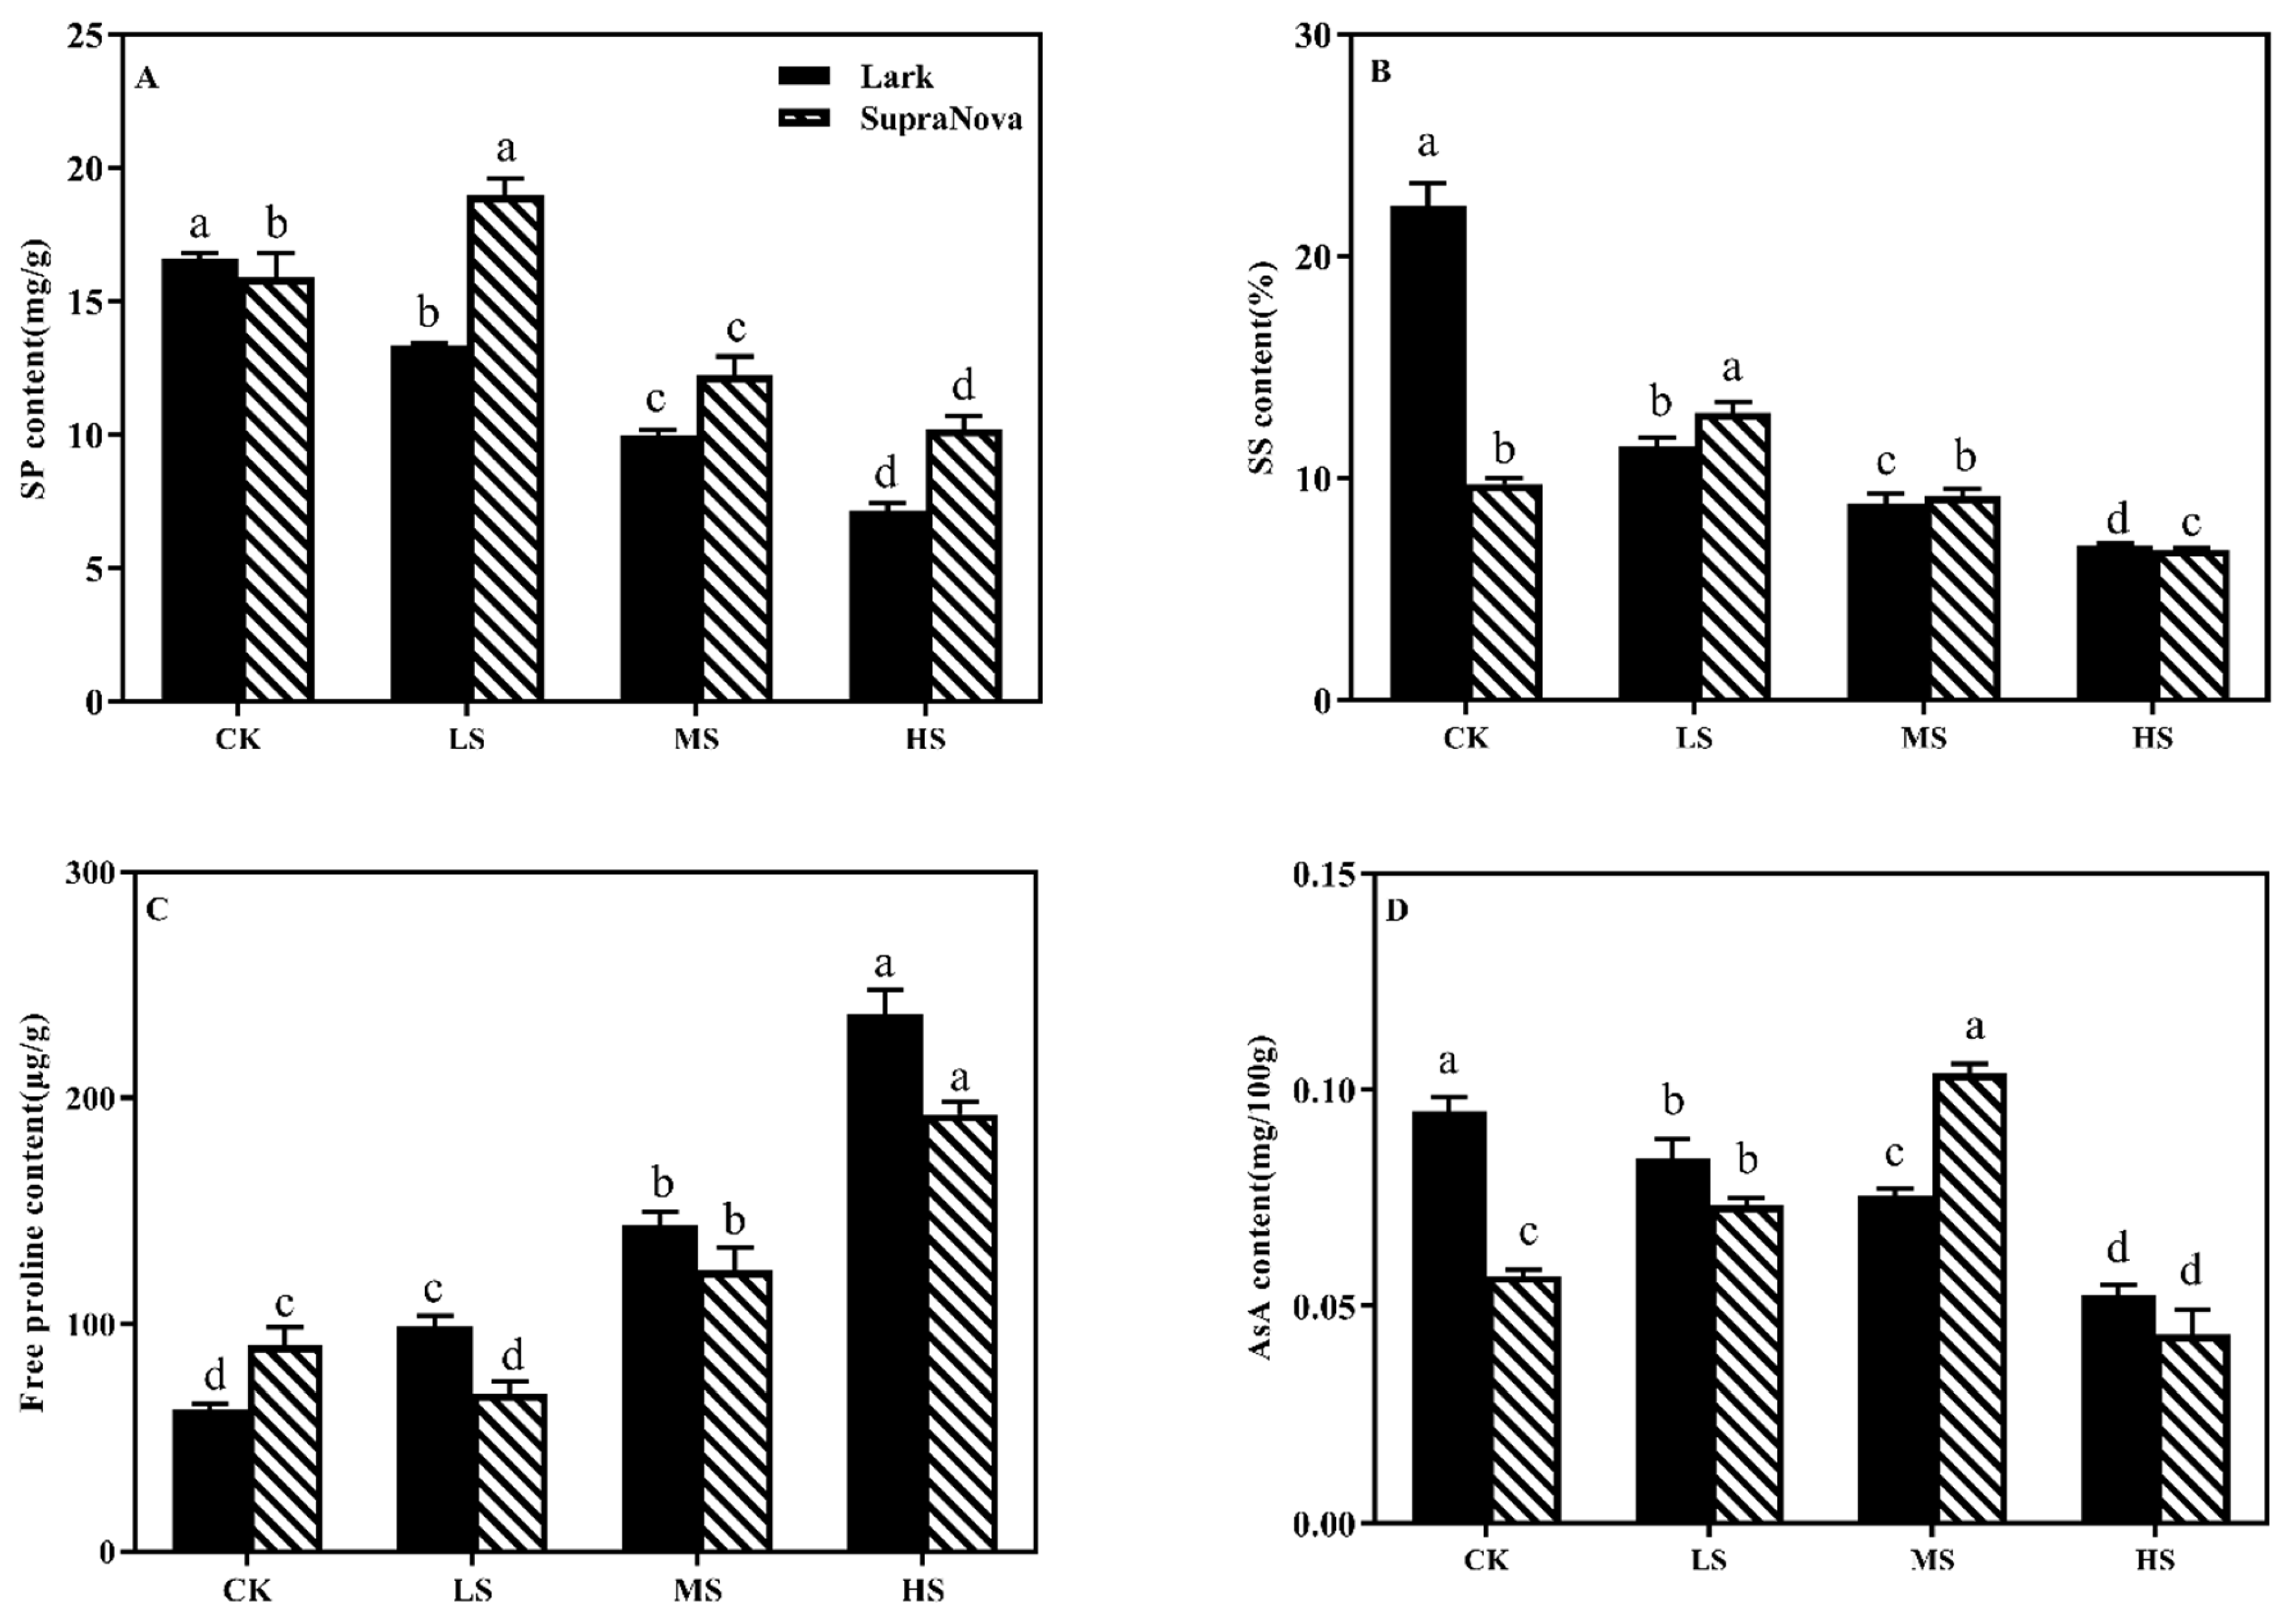
2.6. Physiological Enzyme Assay

The SP content was determined by the Coomassie brilliant blue method [35]. Briefly, 320 μL of supernatant was transferred to an enzyme label plate (FEP-101-896, Jet Biofit Company, Chengdu, China), with 4 replications included, and the absorbance was measured at 595 nm (BioTek Epoch, Hudson, MA, USA). The SS content was determined by the anthrone colorimetry method [35]. Each time, 320 μL of supernatant was drawn (4 replications were included), and the absorbance was measured at 630 nm. Determination of Pro content was performed using the sulfosalicylic acid method [36]. Fresh leaves (0.5 g) were ground in 10 mL of 3% sulfosalicylic acid and then centrifuged for 10 min. The supernatant (2 mL) was added to 3 mL of freshly prepared acid-ninhydrin solution and 2 mL of glacial acetic acid. The mixture was subsequently incubated at 90 °C for 1 h and placed in an ice bath to stop the reaction. Then, 5 mL of toluene was added to the extraction mixture and incubated for 20 min at 25 °C to separate the toluene and water. Finally, the toluene phase was collected to measure the absorbance at 520 nm. The AsA content was determined using the spectrophotometric method [37]. Each time 320 μL of the mixture was removed (4 replications were included), and the absorbance was measured at 534 nm.
The MDA content was determined by the thiobarbituric acid method [35]. First, 0.1 g of fresh leaves was ground in the presence of 1 mL of 10% (w/v) trichloroacetic acid (TCA) and then centrifuged at 12,000× g at 4 °C for 20 min; then, the supernatant was collected. Next, 2 mL of the supernatant and 2 mL of 0.6% thiobarbituric acid (TBA) were mixed together, and the mixture was then heated at 95 °C for 30 min, quickly cooled, and then centrifuged at 10,000× g for 10 min. Then, 320 μL of the supernatant was removed to measure the absorbance at 450 nm, 532 nm, and 600 nm to calculate the MDA content. The H2O2 content was determined using the spectrophotometric method [38]. Here, 320 μL of the mixture was removed (separately, 4 replications), and then the absorbance was measured at 415 nm. The O2· content was determined using the hydroxylamine oxidation method [39]. Fresh leaves (0.5 g) were homogenized at 5–10 °C using 2 mL of 50 mM phosphate extraction buffer (pH 7.8) in an ice-cold mortar. The mixture was subsequently centrifuged at 12,000× g for 15 min at 4 °C to collect the supernatant for quantification of O2·. Each time, 320 μL of the mixture was removed (4 replications were included), and the absorbance was measured at 530 nm.
Determination of SOD activity was performed by using the nitroblue tetrazolium (NBT) photochemical reduction method [40]. Each time, 320 μL of the mixture was removed (4 replications were included), and the absorbance was measured at 560 nm. The guaiacol method was used to determine the POD activity [41]; for this, 320 μL of the mixture (4 replications) was removed, after which the absorbance at 470 nm was measured every 60 s. The CAT activity was determined by the ultraviolet absorption method [41]; for this, 320 μL of the mixture (4 replications) was removed, and the absorbance at 240 nm was measured every 60 s. The activities of all the physiological enzymes were measured for fresh leaves, which were randomly sampled from different levels of the two species (4 replications were included).

2.7. Data Analysis

The data were analyzed using SPSS v10.0 software (SPSS, Inc., Chicago, IL, USA). Two-way ANOVA was used to examine the combined effects of species and shade stress, while one-way ANOVA was used to examine the effects of species and shade alone. The mean values were compared via the least significant difference test at the 0.05 probability level. Figures were constructed using GraphPad Prism v9.00 (GraphPad Company, San Diego, CA, USA).

3. Results

3.1. Turf Quality (TQ) and Turf Color Intensity (TCI)

According to the ANOVA results, the interaction effect of species × shade (p < 0.05) on TQ and TCI was significant. Shade significantly affected the TQ and TCI of the two species (Table 1). For ‘SupraNova’, proper shade increased the TQ and TCI. The TQ and TCI of the two species were the highest under the LS treatment, although these values were not different from those observed under the control. This showed that ‘SupraNova’ had a certain degree of adaptability to LS. For ‘Lark’, all the shade treatments reduced the TCI compared to that of the control, and the MS and HS treatments reduced the TQ. With the prolongation of shade and the increase in shade intensity, the difference in intolerance of the two species to shade was extremely significant. After 15 d, the TQ and TCI values of both ‘Lark’ and ‘SupraNova’ were lower than 6 under the HS treatment. After a month of shade, under the MS and HS treatments, ‘SupraNova’ and ‘Lark’ gradually turned yellow and even died. With increasing shade time, the height of the two species showed an increasing trend, but the growth rate generally showed a decreasing trend.

3.2. Root Morphological Analysis

ANOVA revealed that the interaction effect of species × shade (p < 0.05) on changes in root length and root surface area was significant. The root system of ‘Lark’ was more developed under CK and was longer than that of ‘SupraNova’, although the root system of ‘SupraNova’ had more fibrous roots (Figure 1). With increasing shade intensity, the root length and root surface area of ‘Lark’ always showed a decreasing trend, but the root length and root surface area of ‘SupraNova’ increased under LS but declined under MS and HS. Shade treatment had a significant effect on the root morphology of the two turfgrass species (Table 2). In terms of total root length, the effect of shade on ‘Lark’ was markedly significant, and the total root length decreased by 73.4% compared with that of CK. The total root length of ‘SupraNova’ increased by 33.9% under LS compared to CK, then began to decrease under MS, decreasing by 65.1% compared to that under LS. The root surface area of ‘Lark’ was significantly lower under shade treatment than under CK. As the shade intensity increased, the root surface area of ‘SupraNova’ increased and then decreased.

3.3. Response of Chlorophyll a Fluorescence to Shade

The qP value under shade treatment was lower than that under CK for ‘Lark’, although the change trend was different between the two species (Figure 2A,B). The qP value of ‘Lark’ showed a significant gradual decline as the intensity of shade increased. Compared with that under CK, the ETR value of ‘Lark’ under shade was lower (Figure 2C,D). However, the ETR value of ‘SupraNova’ showed a trend of increasing and then decreasing with increasing shade intensity, which was the same as the change trend of the qP. Under CK, the Fv/Fm of ‘Lark’ was higher than that of ‘SupraNova’ (Figure 2E). However, as the shade intensity increased, LS increased the Fv/Fm value of ‘SupraNova’, and this value was higher than that of ‘Lark’ under LS. The Fv/Fm of the two species decreased under MS and HS, but the degree of decline was different. Compared with CK, the declines in Fv/Fm under HS of ‘Lark’ and ‘SupraNova’ were 47.6% and 35.6%, respectively.

3.4. Response of the Daily Spectral Variation to Shade

The reflectance of the leaves in ‘Lark’ and ‘SupraNova’ was lower in the shade than in normal light, and the reflectance of ‘Lark’ was higher in the visible light band than that of ‘SupraNova’ (Figure 3A,B). The normalized difference vegetation index (NDVI) of the two turfgrass species has a comparable changing trend, decreasing and then rising. The NDVI of ‘Lark’ was slightly higher in the shade than in CK (Figure 3C,D).

3.5. Physiological Responses to Shade

3.5.1. SP, SS, Pro, and AsA Content
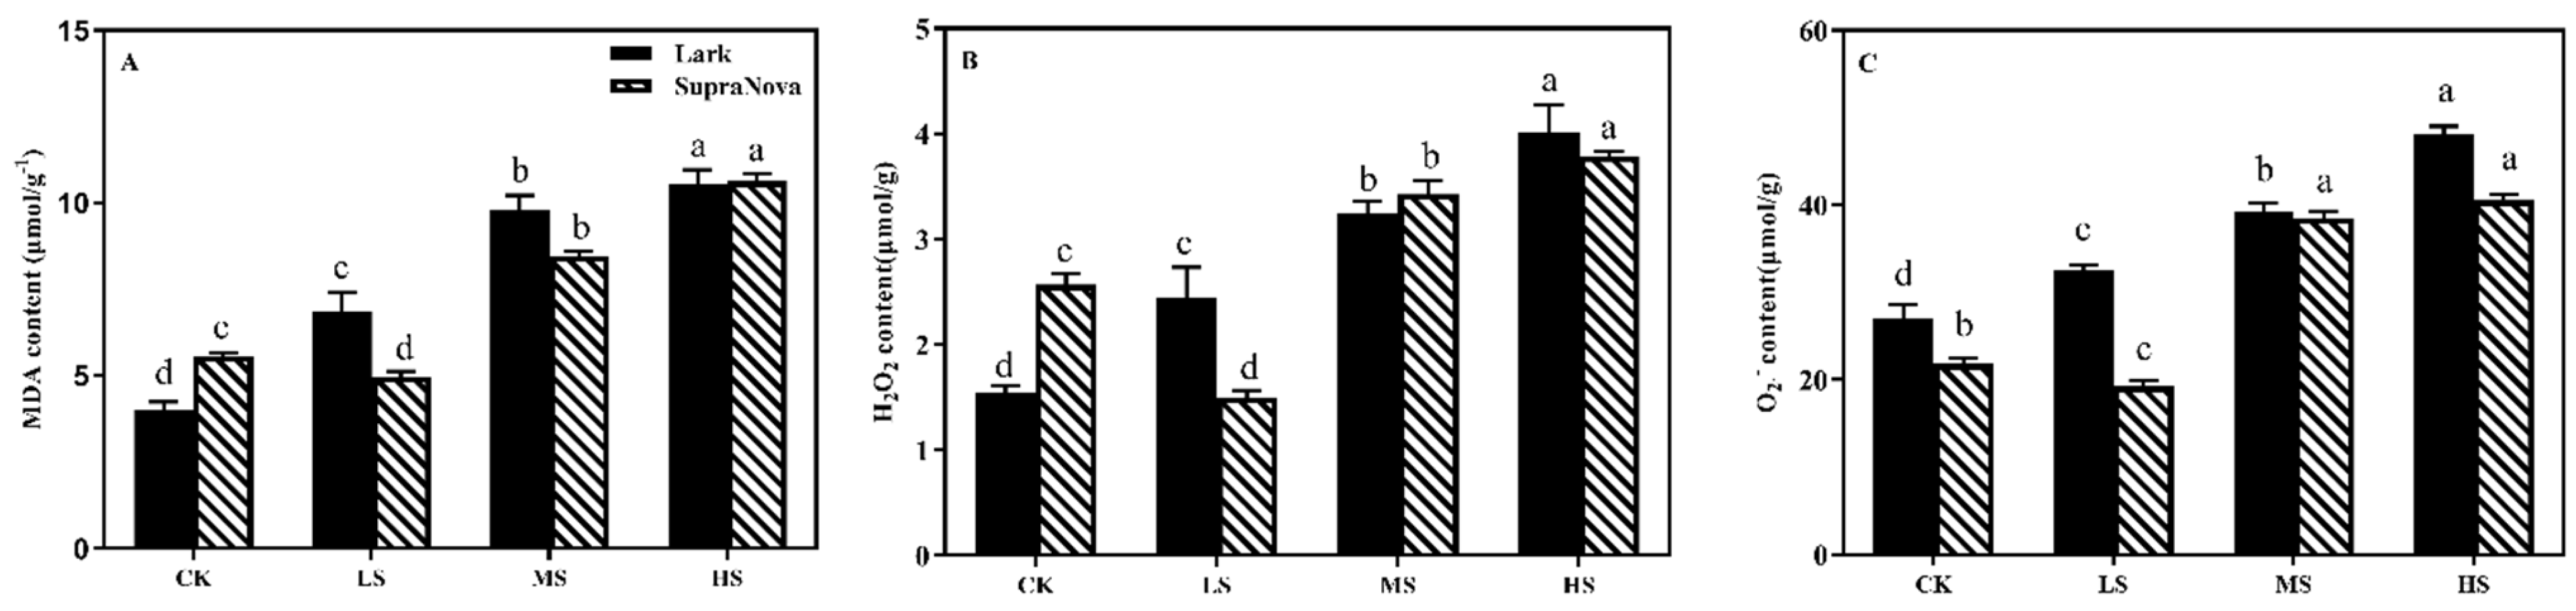
Compared with that under CK, the SP content of ‘Lark’ under HS presented the most significant decrease—57% (Figure 4A). The SP content of ‘SupraNova’ reached a maximum value under LS, which increased by 22.9% compared with that under CK, and then decreased with increasing shade intensity. Compared with that under LS, the SP content of ‘SupraNova’ under CK was reduced by 46.2%.
Under CK, the SS content of ‘Lark’ was higher than that of ‘SupraNova’ (Figure 4B). With the increase in shade intensity, the SS accumulation in ‘Lark’ gradually decreased, reaching the lowest value under HS, and the difference between treatments was significant. ‘Lark’ presented the largest decline under HS compared with CK—a decrease of 67.4%. With the increase in shade intensity, the SS content of ‘SupraNova’ showed a trend of increasing first and then decreasing, with the lowest value occurring under LS. Compared with that under CK, the ‘SupraNova’ SS content under LS increased by 0.3-fold. In response to the HS treatment, the SS content of ‘SupraNova’ decreased by 30.2%.
The Pro content of ‘Lark’ increased as the degree of shade increased, reaching the maximum value under HS; this value was significantly higher than that under the other treatments (Figure 4C). The Pro content of ‘Lark’ increased by 2.8-fold under HS compared with CK. ‘SupraNova’ showed a trend of decreasing first and then increasing with increasing shade intensity, with the lower value occurring under LS. The Pro content of ‘SupraNova’ was reduced by 23.4% under LS compared with CK. Compared with that under LS, the Pro content of ‘SupraNova’ under HS increased by 1.8-fold.
As the degree of shade increased, the AsA content of ‘SupraNova’ increased and then decreased (Figure 4D). The AsA content in ‘SupraNova’ peaked under MS, which was equal to an increase of 0.7-fold compared with that under CK, and then began to decline under HS, which was equal to a decrease of 60.0% compared with that under MS. With increasing shade intensity, the AsA content of ‘Lark’ continued to decline, and decreased by 50.0% under HS.

3.5.2. MDA, H2O2, and O2· Contents

The MDA content of ‘Lark’ continued to increase compared with that under CK, and under HS increased by 1.6-fold (Figure 5A). For ‘SupraNova’, as the degree of shade increased, the MDA content decreased and then increased, with the lowest value occurring under LS. The MDA content of ‘SupraNova’ decreased by 10.8% under LS compared with CK. In addition, the MDA content of ‘SupraNova’ under HS increased by 1.1-fold compared with that under LS.
The H2O2 content of ‘SupraNova’ decreased under LS, but when the shade intensity continued to increase, the H2O2 content increased, and under LS it decreased to the lowest value recorded; compared with that under CK, the decrease was 64.5% (Figure 5B). When the shade intensity increased to HS, the H2O2 content of ‘SupraNova’ increased by 1.5-fold compared with that under LS. The H2O2 content of ‘Lark’ increased as the degree of shade increased, eventually increasing by 1.6-fold compared with that of CK.
With the increasing shade intensity, the O2· content of SupraNova under LS decreased (Figure 5C). The O2· content of ‘SupraNova’ decreased by 11.8% compared with that of CK, but as the degree of shade continued to increase, the O2· content increased, peaking when the shade intensity increased to HS. The O2· content of ‘SupraNova’ increased by 1.1-fold under HS compared with LS. The O2· content of ‘Lark’ increased with increasing degree of shade, and ultimately increased by 78.5% under HS compared to CK.

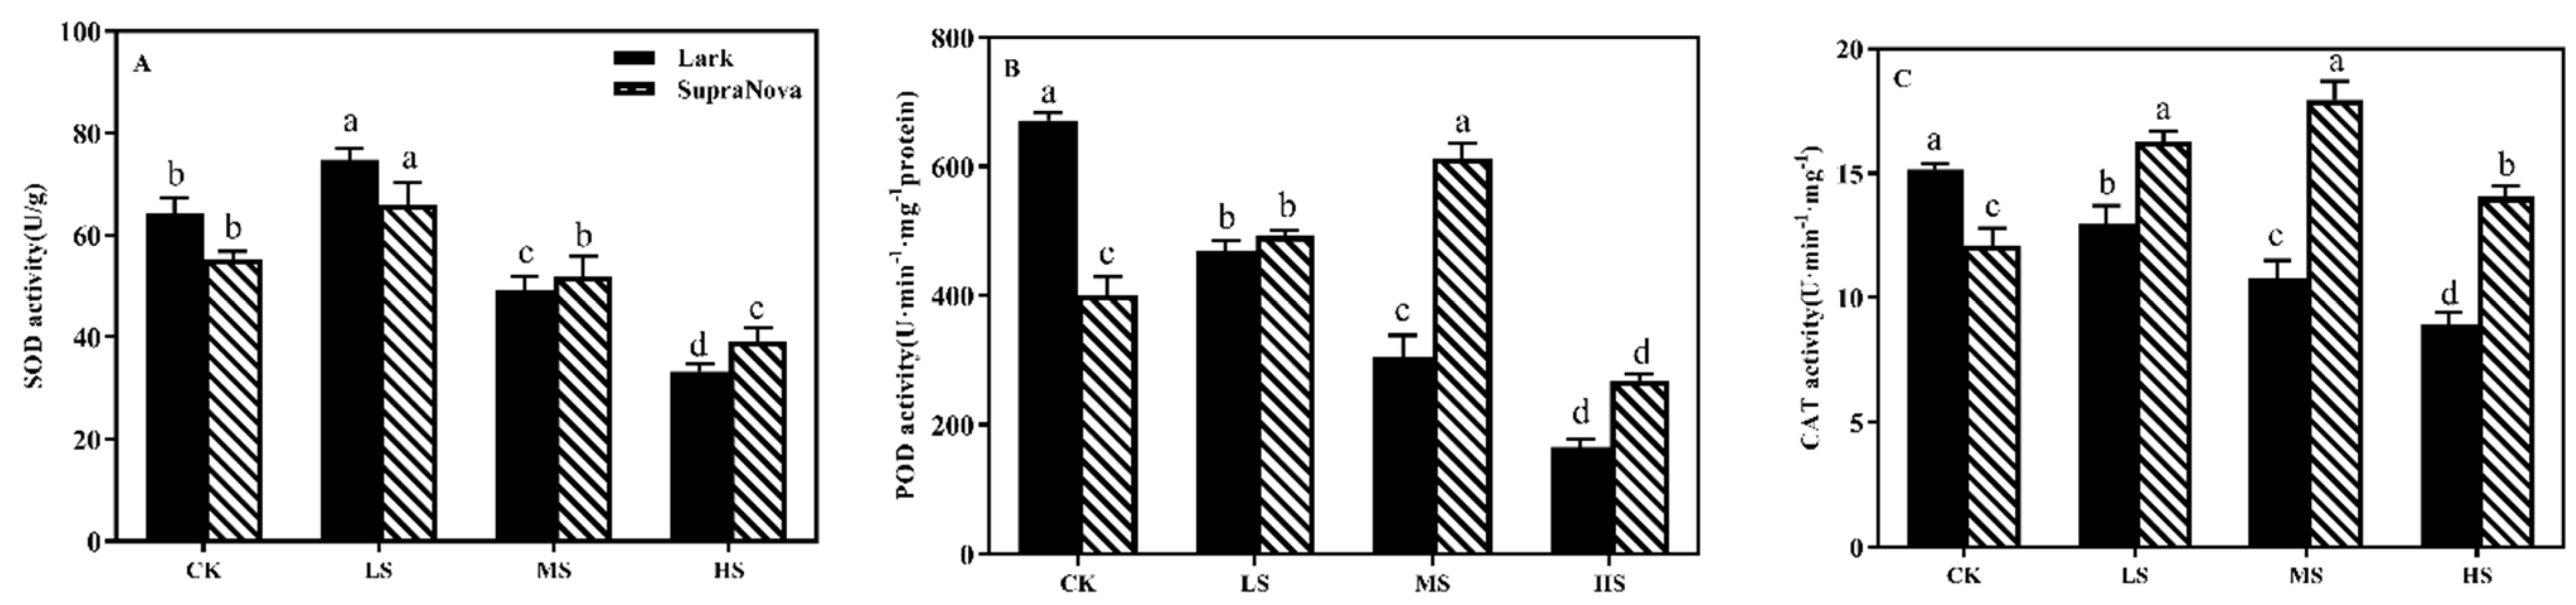
3.5.3. SOD, POD, and CAT Activity

The SOD activity of ‘Lark’ and ‘SupraNova’ showed an upward trend under LS (Figure 6A), but the rates of increase were different. The highest rate of increase in SOD activity of ‘SupraNova’ was 19.5%, compared with that of CK, and the rate of increase of ‘Lark’ was 16.3%. The SOD activity of both turfgrass species began to decrease under MS.
The POD activity of ‘SupraNova’ increased and then decreased sharply as the shade intensity increased, peaking under MS and increasing by 52.7% compared to that under CK (Figure 6B). The POD activity of ‘Lark’ decreased sharply with increasing shade intensity, and the downward trend was particularly obvious, with a final decrease of 75.3% compared with that of CK.
The CAT activity of ‘SupraNova’ increased and then decreased, and the difference between treatments was significant (Figure 6C). Compared with that under CK, the CAT activity of ‘SupraNova’ under MS increased by 48.4%, and it decreased by 19.2% under HS compared with MS. ‘Lark’ showed a continuous downward trend as the degree of shade increased, which was 41.3% lower than that of CK.

4. Discussion

Light is the most important factor regulating plant growth [42]. Plant growth requires a suitable light intensity, and light intensity that is too high or too low can inhibit plant growth [43]. The adaptability of plants to shaded environments is first reflected in the appearance of plants [5]. The results of this study showed that different shade treatments had a significant impact on the TQ and TCI of turfgrasses (Table 1). In the same period, under different light intensities, the adaptability of the two turfgrass species was different. As the shade intensity increased, the TQ and TCI of ‘SupraNova’ turf increased significantly and then decreased significantly. The main reason may be that the light intensity of CK had a photoinhibitory effect on the turfgrasses. LS was more suitable for the turfgrasses [17]. LS caused the leaves to be slender, the turfgrasses to grow vigorously, and the greenness of turfgrass to intensify, thereby improving the texture, color, uniformity, and density of the turf. Finally, the TQ and TCI of the turfgrasses increased. With a gradual increase in shade, the TQ and TCI of ‘Lark’ decreased significantly. Between the two turfgrass species used in this study, ‘Lark’ is not shade-tolerant. Shade reduces the light intensity, which can in turn inhibit the growth of turf and reduce the color, uniformity, and density; the TQ and TCI of the turf are ultimately reduced [44].
Light first regulates the development of the aerial parts and then regulates the growth and development of the roots. With increasing shade, the total root length and root surface area of ‘SupraNova’ increased and then decreased (Table 2). This may have occurred because moderate shade improved the efficiency of photosynthesis, resulting in accumulation of photosynthesis products and promotion of root development. However, light that is too strong or too weak is unfavorable for plant photosynthesis, resulting in poor root development. The total root length and root surface area of ‘Lark’ continued to decline with increasing shade intensity, indicating that shade had a negative impact on the photosynthesis of the two species, reducing the accumulation of photosynthesis products. To obtain more light energy, plants allocate most of these products to their aboveground parts, which is unfavorable to the development of roots [45].
Shade affects the chlorophyll a fluorescence parameters of plants [46]. For ‘Lark’, shade significantly reduced the qP, which showed that shade decreased the electron transport activity of PSII reaction centers (Figure 2A,B). Medium shade may enhance the adaptability of plant components to shade environments, but heavy shade inhibits this efficiency and activity [10,47]. Full light and high-intensity shade had a photoinhibitory effect on both turfgrass species, inactivating PSII or damaging the photosynthetic machinery. Light shade promoted the activity of the photosystems, reduced photoinhibition, and increased photochemical efficiency [48]. The value of Fv/Fm was unchanged under nonstress conditions and decreased only under conditions of photoinhibition. The ETR reflects the apparent electron transfer efficiency under a given light intensity, and its value decreases when plants are stressed [49]. In this experiment, the ETR values of ‘Lark’ under shade were lower than that of CK, while ‘SupraNova’ showed a trend of rising and then falling (Figure 2C,D). The results showed that full light and high-intensity shade had a photoinhibitory effect on the two species and inactivated PSII or damaged the photosynthetic machinery. LS promoted the activity of the PSII system, reduced photoinhibition, and increased photochemical efficiency. The Fv/Fm values of ‘Lark’ under the shade treatments were lower than that under CK, and with increasing shade intensity, the stress effect gradually increased (Figure 2E). These results showed that when ‘Lark’ was under shade, its PSII activity was harmed, which in turn affected photosynthesis.
The spectral reflectance of ‘SupraNova’ under CK was higher than that under the shade treatments (Figure 3B). This may have occurred because the chlorophyll levels of ‘SupraNova’ under the shade treatments were higher and because the green color was deeper, so the reflectance was lower. The results also showed that shade increased the spectral reflectance of ‘SupraNova’ in the near-infrared band (750–1000 nm), prevented damage to the cell structure of leaves caused by strong light, and reduced leaf senescence. ‘Lark’ is different from ‘SupraNova’ in that the leaf texture of the former is glossy and leathery (Figure 3A). As such, Lark could not be evaluated on the basis of leaf color alone. This may be due to the best leaf quality and most intense glossiness occurring under CK and may be due to shade affecting normal plant development, resulting in poor leaf glossiness and poor texture; this, in turn, would result in higher reflectance under CK than under shade treatments, which can affect the production and accumulation of primary and secondary metabolites of plants [50]. The reason for this phenomenon may be that, under shade stress, plants increase photosynthesis to adapt to the lower amount of light to reduce the leaf area index.
SS, SP, and Pro function in maintaining stomatal opening, cell turgor, and cell growth and in protecting enzyme activity [51]. In this experiment, the contents of SS and SP in ‘SupraNova’ showed a trend of increasing and then decreasing with increasing shade intensity (Figure 4A,B). Pro can be converted into various small molecule organic solutes when plants are under stress, thereby increasing cytosolic concentrations, reducing osmotic potential, and maintaining cell turgor and normal cell function. In this experiment, the Pro content of ‘SupraNova’ decreased and then increased with increasing shade intensity (Figure 4C). AsA is an antioxidant that acts as an electron donor in the reaction of PSII and scavenges active oxygen [52,53]. It has been shown that shade can induce the production of ROS, regulate gene expression, increase the activity of antioxidant enzymes, and increase the synthesis of AsA [54], thereby enhancing the ability of the two substances to cooperate to remove ROS; however, shade that is too intense can disrupt plant growth and development [55].
Under shade conditions, a large number of ROS are produced in plant cells, which increases the oxidation of unsaturated fatty acids of membrane lipids, leading to the production of the peroxidation product MDA [56]. In this study, the changes in MDA content of the two turfgrass species were different (Figure 5A). O2· is an oxygen-containing free radical, and when plants are exposed to external stimuli, O2· accumulates in cells [57]. This may be because, for plants, light that is too intense or too weak can stress plants, which increases the amount of active oxygen in the plant and reduces the activity of the antioxidant enzyme system, which is caused by the inability to quench excess active oxygen in time [58].
As the degree of shade increased, the SOD activity decreased (Figure 6A). A possible reason is that the plants’ ability to resist stress was limited, and the degree of shade exceeded the upper limit of the plants’ tolerance, resulting in a decrease in SOD activity. The stress resistance of plants can be judged via POD activity [59]. In this experiment, the activity of POD in ‘SupraNova’ increased and then decreased with increasing shade intensity, and that in ‘Lark’ continued to decrease (Figure 6B). One reason may be that within the tolerance range of plants, the increase in active oxygen caused by shade stress activates the defense mechanism in the plants and induces an increase in the activity of antioxidant enzymes in the cells, which then eliminates excess ROS in cells and reduce the damage experienced by plants; however, the tolerance range of plants has a certain threshold [60]. This study showed that with increasing shade intensity, the CAT activity of ‘SupraNova’ increased and then decreased, while the CAT activity of ‘Lark’ continued to decrease (Figure 6C). When subjected to shade stress, the enzyme activity in plants can increase through self-regulation to reduce damage; thus, ‘SupraNova’ has a strong ability to regulate and adapt to moderate shade.

5. Conclusions

Based on the results of this study, the TQ, TCI, and morphological and physiological responses of ‘SupraNova’ and ‘Lark’ were affected by shade, and there were considerable differences between the two turfgrass species. Under shade conditions, the morphological and physiological attributes of both ‘SupraNova’ and ‘Lark’ decreased, yet the reductions were more pronounced for ‘Lark’. Since the LS treatment had a positive effect on turfgrass performance and the morphological and physiological responses of ‘SupraNova’, this shade intensity could be used to present excellent conditions for turfgrass cultivation and management. These findings may provide new insights into the process of plant shade tolerance, as well as strategies for increasing the genetic mechanism underlying the shade tolerance and of cool-season turfgrasses in future research.

Author Contributions

L.D. and L.X. designed the experiments and wrote the paper; X.S., S.S. and Z.G. performed the experiments and revised the paper; X.Z., L.L., L.C. and Z.T. analyzed the data and wrote the paper; F.X. and Y.C. designed the experiments and revised the paper. All authors have read and agreed to the published version of the manuscript.

Funding

This research was funded by the National Natural Science Foundation of China (No. 31971772; 32001407; 31772354) and Postdoctoral Program of Heilongjiang Province (LBH-Z21009). The funders had no role in study design, data collection and analysis, decision to publish, or preparation of the manuscript.

Informed Consent Statement

Informed consent was obtained from all subjects involved in the study.

Data Availability Statement

Not applicable.

Acknowledgments

We thank the editor and reviewers for helpful comments.

Conflicts of Interest

The authors declare no conflict of interest.

References

  1. Rafiullah, A.; Tariq, M.; Khan, F.; Shah, A.; Fahad, S.; Wahid, F.; Ali, J.; Adnan, M.; Ahmad, M.; Irfan, M.; et al. Effect of micronutrients foliar supplementation on the production and eminence of plum (Prunus domestica L.). Qual. Assur. Saf. Crop. Foods 2020, 12, 32–40. [Google Scholar] [CrossRef]
  2. Thomason, W.; Battaglia, M. Early defoliation effects on corn plant stands and grain yield. Agron. J. 2020, 112, 5024–5032. [Google Scholar] [CrossRef]
  3. Sun, X.; Zheng, Q.; Xiong, L.; Xie, F.; Li, X.; Li, Y.; Zhang, L.; Saud, S.; Guo, Z.; Yan, Y.; et al. Nitrogen assimilation and gene regulation of two Kentucky bluegrass cultivars differing in response to nitrate supply. Sci. Hortic. 2021, 288, 110315. [Google Scholar] [CrossRef]
  4. Rezaei-Chiyaneh, E.; Mahdavikia, H.; Battaglia, M.L.; Thomason, W.E.; Caruso, G. Intercropping and fertilizer type impact seed productivity and secondary metabolites of dragon’s head and fenugreek. Sci. Hortic. 2021, 287, 110277. [Google Scholar] [CrossRef]
  5. Dias, A.N.; Siqueira-Silva, A.I.; Souza, J.P.; Kuki, K.N.; Pereira, E.G. Acclimation responses of macaw palm seedlings to contrasting light environments. Sci. Rep. 2018, 8, 15300. [Google Scholar] [CrossRef] [PubMed]
  6. Batool, A.; Cheng, Z.-G.; Akram, N.A.; Lv, G.-C.; Xiong, J.-L.; Zhu, Y.; Ashraf, M.; Xiong, Y.-C. Partial and full root-zone drought stresses account for differentiate root-sourced signal and yield formation in primitive wheat. Plant Methods 2019, 15, 75. [Google Scholar] [CrossRef] [Green Version]
  7. Zhou, T.; Wang, L.; Li, S.; Gao, Y.; Du, Y.; Zhao, L.; Liu, W.; Yang, W. Interactions Between Light Intensity and Phosphorus Nutrition Affect the P Uptake Capacity of Maize and Soybean Seedling in a Low Light Intensity Area. Front. Plant Sci. 2019, 10, 183. [Google Scholar] [CrossRef]
  8. Wang, J.; Li, Y.; Niu, W. Deficit Alternate Drip Irrigation Increased Root-Soil-Plant Interaction, Tomato Yield, and Quality. Int. J. Environ. Res. Public Health 2020, 17, 781. [Google Scholar] [CrossRef] [Green Version]
  9. Santos, M.D.O.; Coelho, L.S.; Carvalho, G.R.; Botelho, C.E.; Torres, L.F.; Vilela, D.J.M.; Andrade, A.C.; Silva, V.A. Photochemical efficiency correlated with candidate gene expression promote coffee drought tolerance. Sci. Rep. 2021, 11, 7436. [Google Scholar] [CrossRef]
  10. Sallam, A.; Alqudah, A.M.; Dawood, M.F.; Baenziger, P.S.; Börner, A. Drought Stress Tolerance in Wheat and Barley: Advances in Physiology, Breeding and Genetics Research. Int. J. Mol. Sci. 2019, 20, 3137. [Google Scholar] [CrossRef] [Green Version]
  11. Liangju, W.; Qi, L.; Wang, L.J. ALA Pretreatment Improves Waterlogging Tolerance of Fig Plants. PLoS ONE 2016, 11, e0147202. [Google Scholar] [CrossRef]
  12. Niu, Y.-F.; Wang, X.; Hu, D.-X.; Balamurugan, S.; Li, D.-W.; Yang, W.-D.; Liu, J.-S.; Li, H.-Y. Molecular characterization of a glycerol-3-phosphate acyltransferase reveals key features essential for triacylglycerol production in Phaeodactylum tricornutum. Biotechnol. Biofuels 2016, 9, 60. [Google Scholar] [CrossRef] [PubMed] [Green Version]
  13. Feng, L.; Raza, M.A.; Li, Z.; Chen, Y.; Bin Khalid, M.H.; Du, J.; Liu, W.; Wu, X.; Song, C.; Yu, L.; et al. The Influence of Light Intensity and Leaf Movement on Photosynthesis Characteristics and Carbon Balance of Soybean. Front. Plant Sci. 2019, 9, 1952. [Google Scholar] [CrossRef] [PubMed]
  14. Soriano, G.; Del-Castillo-Alonso, M.Á.; Monforte, L.; Núñez-Olivera, E.; Martínez-Abaigar, J. Acclimation of Bryophytes to Sun Conditions, in Comparison to Shade Conditions, Is Influenced by Both Photosynthetic and Ultraviolet Radiations. Front. Plant Sci. 2019, 10, 998. [Google Scholar] [CrossRef] [PubMed] [Green Version]
  15. Liu, C.; Guo, X.; Wang, K.; Sun, Y.; Li, W.; Liu, Q.; Liu, Q. Nitrogen deposition does not alleviate the adverse effects of shade on Camellia japonica (Naidong) seedlings. PLoS ONE 2018, 13, e0201896. [Google Scholar] [CrossRef] [Green Version]
  16. Ajmi, A.; Vázquez, S.; Morales, F.; Chaari, A.; El-Jendoubi, H.; Abadía, A.; Larbi, A. Prolonged artificial shade affects morphological, anatomical, biochemical and ecophysiological behavior of young olive trees (cv. Arbosana). Sci. Hortic. 2018, 241, 275–284. [Google Scholar] [CrossRef]
  17. Xie, F.; Shi, Z.; Zhang, G.; Zhang, C.; Sun, X.; Yan, Y.; Zhao, W.; Guo, Z.; Zhang, L.; Fahad, S.; et al. Quantitative leaf anatomy and photophysiology systems of C3 and C4 turfgrasses in response to shading. Sci. Hortic. 2020, 274, 109674. [Google Scholar] [CrossRef]
  18. Kitao, M.; Kitaoka, S.; Harayama, H.; Tobita, H.; Agathokleous, E.; Utsugi, H. Canopy nitrogen distribution is optimized to prevent photoinhibition throughout the canopy during sun flecks. Sci. Rep. 2018, 8, 503. [Google Scholar] [CrossRef]
  19. Jiang, J.B.; Chen, Y.H.; Huang, W.J. Using hyperspectral derivative index to monitor winter wheat disease. Guang Pu Xue Yu Guang Pu Fen Xi Guang Pu 2007, 27, 2475–2479. [Google Scholar] [CrossRef]
  20. Seleiman, M.F.; Aslam, M.T.; Alhammad, B.A.; Hassan, M.U.; Maqbool, R.; Chattha, M.U.; Khan, I.; Gitari, H.I.; Uslu, O.S.; Roy, R.; et al. Salinity Stress in Wheat: Effects, Mechanisms and Management Strategies. Phyton Int. J. Exp. Bot. 2021, 91, 667. [Google Scholar] [CrossRef]
  21. Batool, T.; Ali, S.; Seleiman, M.F.; Naveed, N.H.; Ali, A.; Ahmed, K.; Abid, M.; Rizwan, M.; Shahid, M.R.; Alotaibi, M.; et al. Plant growth promoting rhizobacteria alleviates drought stress in potato in response to suppressive oxidative stress and antioxidant enzymes activities. Sci. Rep. 2020, 10, 16975. [Google Scholar] [CrossRef] [PubMed]
  22. Zhang, W.; Wang, J.; Huang, Z.; Mi, L.; Xu, K.; Wu, J.; Fan, Y.; Ma, S.; Jiang, D. Effects of Low Temperature at Booting Stage on Sucrose Metabolism and Endogenous Hormone Contents in Winter Wheat Spikelet. Front. Plant Sci. 2019, 10, 498. [Google Scholar] [CrossRef] [PubMed]
  23. Morgan, J.M. Osmoregulation and Water Stress in Higher Plants. Annu. Rev. Plant Physiol. 1984, 35, 299–319. [Google Scholar] [CrossRef]
  24. Chen, P.; Liu, P.; Zhang, Q.; Bu, C.; Lu, C.; Srivastava, S.; Zhang, D.; Song, Y. Gene Coexpression Network Analysis Indicates that Hub Genes Related to Photosynthesis and Starch Synthesis Modulate Salt Stress Tolerance in Ulmus pumila. Int. J. Mol. Sci. 2021, 22, 4410. [Google Scholar] [CrossRef] [PubMed]
  25. Zhang, X.; Liu, L.; Chen, B.; Qin, Z.; Xiaoning, Z.; Zhang, Y.; Yao, R.; Liu, H.; Yang, H. Progress in Understanding the Physiological and Molecular Responses of Populus to Salt Stress. Int. J. Mol. Sci. 2019, 20, 1312. [Google Scholar] [CrossRef] [PubMed] [Green Version]
  26. Vasilakoglou, I.; Dhima, K.; Giannakoula, A.; Dordas, C.; Skiada, V.; Papadopoulou, K. Carbon Assimilation, Isotope Discrimination, Proline and Lipid Peroxidation Contribution to Barley (Hordeum vulgare) Salinity Tolerance. Plants 2021, 10, 299. [Google Scholar] [CrossRef]
  27. Liu, C.; Hu, T.X.; Liu, W.T.; Zhang, L.; Shuai, W.; Tang, T.Y.; Li, Q. Physiological bases of herbages shade-tolerance in Eucalyptus grandis and herbage inter-cultivated system. Chin. J. Appl. Ecol. 2008, 19, 1911–1916. [Google Scholar]
  28. De Sousa, A.; AbdElgawad, H.; Han, A.; Teixeira, J.; Matos, M.; Fidalgo, F. Oxidative Metabolism of Rye (Secale cereale L.) after Short Term Exposure to Aluminum: Uncovering the Glutathione–Ascorbate Redox Network. Front. Plant Sci. 2016, 7, 685. [Google Scholar] [CrossRef]
  29. Mittler, R. Oxidative stress, antioxidants and stress tolerance. Trends Plant Sci. 2002, 7, 405–410. [Google Scholar] [CrossRef]
  30. Smirnoff, N. The role of active oxygen in the response of plants to water deficit and desiccation. New Phytol. 1993, 125, 27–58. [Google Scholar] [CrossRef]
  31. Sano, S.; Takemoto, T.; Ogihara, A.; Suzuki, K.; Masumura, T.; Satoh, S.; Takano, K.; Mimura, Y.; Morita, S. Stress Responses of Shade-Treated Tea Leaves to High Light Exposure after Removal of Shading. Plants 2020, 9, 302. [Google Scholar] [CrossRef] [PubMed] [Green Version]
  32. Bali, S.; Kaur, P.; Jamwal, V.L.; Gandhi, S.G.; Sharma, A.; Ohri, P.; Bhardwaj, R.; Ali, M.A.; Ahmad, P. Seed Priming with Jasmonic Acid Counteracts Root Knot Nematode Infection in Tomato by Modulating the Activity and Expression of Antioxidative Enzymes. Biomolecules 2020, 10, 98. [Google Scholar] [CrossRef] [PubMed] [Green Version]
  33. Turgeon, A.J. Turfgrass Management, 8th ed.; Pearson Prentice Hall Press: Hoboken, NJ, USA, 2008. [Google Scholar]
  34. Chen, Y.; Pettersen, T.; Kvalbein, A.; Aamlid, T.S. Playing quality, growth rate, thatch accumulation and tolerance to moss and annual bluegrass invasion as influenced by irrigation strategies on red fescue putting greens. J. Agron. Crop Sci. 2018, 204, 185–195. [Google Scholar] [CrossRef] [Green Version]
  35. Yu, L.; Pei, J.; Zhao, Y.; Wang, S. Physiological Changes of Bamboo (Fargesia yunnanensis) Shoots During Storage and the Related Cold Storage Mechanisms. Front. Plant Sci. 2021, 12, 731977. [Google Scholar] [CrossRef]
  36. Du, J.; Shen, T.; Xiong, Q.; Zhu, C.; Peng, X.; He, X.; Fu, J.; Ouyang, L.; Bian, J.; Hu, L.; et al. Combined proteomics, metabolomics and physiological analyses of rice growth and grain yield with heavy nitrogen application before and after drought. BMC Plant Biol. 2020, 20, 556. [Google Scholar] [CrossRef]
  37. Guo, Y.; Gao, Z.; Li, L.; Wang, Y.; Zhao, H.; Hu, M.; Li, M.; Zhang, Z. Effect of controlled atmospheres with varying O2/CO2 levels on the postharvest senescence and quality of broccoli (Brassica oleracea L. var. italica) florets. Eur. Food Res. Technol. 2013, 237, 943–950. [Google Scholar] [CrossRef]
  38. Ahanger, M.A.; Alyemeni, M.N.; Wijaya, L.; Alamri, S.A.; Alam, P.; Ashraf, M.; Ahmad, P. Potential of exogenously sourced kinetin in protecting Solanum lycopersicum from NaCl-induced oxidative stress through up-regulation of the antioxidant system, ascorbate-glutathione cycle and glyoxalase system. PLoS ONE 2018, 13, e0202175. [Google Scholar] [CrossRef]
  39. Wang, W.-R.; Liang, J.-H.; Wang, G.-F.; Sun, M.-X.; Peng, F.-T.; Xiao, Y.-S. Overexpression of PpSnRK1α in tomato enhanced salt tolerance by regulating ABA signaling pathway and reactive oxygen metabolism. BMC Plant Biol. 2020, 20, 128. [Google Scholar] [CrossRef]
  40. Giannopolotis, C.N.; Ries, S.K. Superoxide dismutases: I. Occurrence in higher plants. Plant Physiol. 1977, 59, 309–314. [Google Scholar] [CrossRef]
  41. Tian, M.; Gu, Q.; Zhu, M. The involvement of hydrogen peroxide and antioxidant enzymes in the process of shoot organogenesis of strawberry callus. Plant Sci. 2003, 165, 701–707. [Google Scholar] [CrossRef]
  42. Ye, S.; Shao, Q.; Xu, M.; Li, S.; Wu, M.; Tan, X.; Su, L. Effects of Light Quality on Morphology, Enzyme Activities, and Bioactive Compound Contents in Anoectochilus roxburghii. Front. Plant Sci. 2017, 8, 857. [Google Scholar] [CrossRef] [PubMed] [Green Version]
  43. Garg, A.; Bordoloi, S.; Ganesan, S.P.; Sekharan, S.; Sahoo, L. A relook into plant wilting: Observational evidence based on unsaturated soil–plant-photosynthesis interaction. Sci. Rep. 2020, 10, 22064. [Google Scholar] [CrossRef] [PubMed]
  44. Villanova, I.R.; Martínez-García, J.F. Plant Responses to Vegetation Proximity: A Whole Life Avoiding Shade. Front. Plant Sci. 2016, 7, 236. [Google Scholar] [CrossRef] [Green Version]
  45. Hochholdinger, F.; Marcon, C.; Baldauf, J.A.; Yu, P.; Frey, F.P. Proteomics of Maize Root Development. Front. Plant Sci. 2018, 9, 143. [Google Scholar] [CrossRef] [PubMed] [Green Version]
  46. Xiao, Y.; Wu, X.; Sun, M.; Peng, F. Hydrogen Sulfide Alleviates Waterlogging-Induced Damage in Peach Seedlings via Enhancing Antioxidative System and Inhibiting Ethylene Synthesis. Front. Plant Sci. 2020, 11, 696. [Google Scholar] [CrossRef]
  47. Elkins, C.; Van Iersel, M.W. Longer Photoperiods with the Same Daily Light Integral Increase Daily Electron Transport through Photosystem II in Lettuce. Plants 2020, 9, 1172. [Google Scholar] [CrossRef]
  48. Mo, Y.; Wang, Y.; Yang, R.; Zheng, J.; Liu, C.; Li, H.; Ma, J.; Zhang, Y.; Wei, C.; Zhang, X. Regulation of Plant Growth, Photosynthesis, Antioxidation and Osmosis by an Arbuscular Mycorrhizal Fungus in Watermelon Seedlings under Well-Watered and Drought Conditions. Front. Plant Sci. 2016, 7, 644. [Google Scholar] [CrossRef] [Green Version]
  49. Han, Z.; Wei, X.; Wan, D.; He, W.; Wang, X.; Xiong, Y. Effect of Molybdenum on Plant Physiology and Cadmium Uptake and Translocation in Rape (Brassica napus L.) under Different Levels of Cadmium Stress. Int. J. Environ. Res. Public Health 2020, 17, 2355. [Google Scholar] [CrossRef] [Green Version]
  50. Pan, J.; Chen, H.; Guo, B.; Liu, C. Understanding the molecular mechanisms underlying the effects of light intensity on flavonoid production by RNA-seq analysis in Epimedium pseudowushanense B.L.Guo. PLoS ONE 2017, 12, e0182348. [Google Scholar] [CrossRef] [Green Version]
  51. Yang, L.; Lai, L.; Zhou, J.; Li, Q.; Yi, S.; Sun, Q.; Zheng, Y. Changes in levels of enzymes and osmotic adjustment compounds in key species and their relevance to vegetation succession in abandoned croplands of a semiarid sandy region. Ecol. Evol. 2020, 10, 2269–2280. [Google Scholar] [CrossRef] [Green Version]
  52. Khan, A.; Numan, M.; Khan, A.L.; Lee, I.-J.; Imran, M.; Asaf, S.; Al-Harrasi, A. Melatonin: Awakening the Defense Mechanisms during Plant Oxidative Stress. Plants 2020, 9, 407. [Google Scholar] [CrossRef] [PubMed] [Green Version]
  53. Ma, X.; Song, L.; Yu, W.; Hu, Y.; Liu, Y.; Wu, J.; Ying, Y. Growth, physiological, and biochemical responses of Camptotheca acuminata seedlings to different light environments. Front. Plant Sci. 2015, 6, 321. [Google Scholar] [CrossRef] [PubMed] [Green Version]
  54. Li, Y.; Schellhorn, H.E. Can ageing-related degenerative diseases be ameliorated through administration of vitamin C at pharmacological levels? Med. Hypotheses 2007, 68, 1315–1317. [Google Scholar] [CrossRef] [PubMed]
  55. Munir, S.; Mumtaz, M.A.; Ahiakpa, J.K.; Liu, G.; Chen, W.; Zhou, G.; Zheng, W.; Ye, Z.; Zhang, Y. Genome-wide analysis of Myo-inositol oxygenase gene family in tomato reveals their involvement in ascorbic acid accumulation. BMC Genom. 2020, 21, 284. [Google Scholar] [CrossRef] [PubMed] [Green Version]
  56. Tian, X.; Xie, J.; Yu, J. Physiological and transcriptomic responses of Lanzhou Lily (Lilium davidii, var. unicolor) to cold stress. PLoS ONE 2020, 15, e0227921. [Google Scholar] [CrossRef] [PubMed]
  57. Bao, G.; Tang, W.; An, Q.; Liu, Y.; Tian, J.; Zhao, N.; Zhu, S. Physiological effects of the combined stresses of freezing-thawing, acid precipitation and deicing salt on alfalfa seedlings. BMC Plant Biol. 2020, 20, 204. [Google Scholar] [CrossRef]
  58. Tyburski, J.; Dunajska, K.; Tretyn, A. Reactive oxygen species localization in roots of Arabidopsis thaliana seedlings grown under phosphate deficiency. Plant Growth Regul. 2010, 59, 27–36. [Google Scholar] [CrossRef]
  59. Li, Y.; Qin, T.; Wei, C.; Sun, J.; Dong, T.; Zhou, R.; Chen, Q.; Wang, Q. Using Transcriptome Analysis to Screen for Key Genes and Pathways Related to Cytoplasmic Male Sterility in Cotton (Gossypium hirsutum L.). Int. J. Mol. Sci. 2019, 20, 5120. [Google Scholar] [CrossRef] [Green Version]
  60. El-Beltagi, H.S.; Mohamed, H.I.; Sofy, M.R. Role of Ascorbic acid, Glutathione and Proline Applied as Singly or in Sequence Combination in Improving Chickpea Plant through Physiological Change and Antioxidant Defense under Different Levels of Irrigation Intervals. Molecules 2020, 25, 1702. [Google Scholar] [CrossRef] [Green Version]
Figure 1. Root morphology of the two species under different shade treatments. Notes: (AD) correspond to ‘Lark’ under CK, LS, MS, and HS, respectively, and (EH) correspond to ‘SupraNova’ under CK, LS, MS and HS, respectively. CK = unshaded; LS = 35% shaded; MS = 70% shaded; HS = 92% shaded.
Agronomy 12 00959 g001
Figure 2. Changes in chlorophyll fluorescence of two turfgrass species. Notes: (A,B) correspond to the qP of two turfgrass species; (C,D) correspond to the ETR of the two turfgrass species; and (E) corresponds to the Fv/Fm value of the two turfgrass species. The lowercase letters denote significant differences (p < 0.05) for the same species. The total number of replicates used for this experiment was four. CK = unshaded; LS = 35% shaded; MS = 70% shaded; HS = 92% shaded.
Agronomy 12 00959 g002
Figure 3. Diurnal variation in the spectrum (A,B) and normalized difference vegetation index (NDVI) diurnal variation (C,D) of the two species.
Agronomy 12 00959 g003
Figure 4. SP, SS, Pro, and AsA contents of two species under different shade treatments (AD). The lowercase letters denote significant differences (p < 0.05) for the same species. CK = unshaded; LS = 35% shaded; MS = 70% shaded; HS = 92% shaded. The black box represents the species ‘Lark’ and the striped box represents the species ‘SupraNova’.
Agronomy 12 00959 g004
Figure 5. MDA, H2O2, and O2· contents of two species under different shade treatments (AC). The lowercase letters denote significant differences (p < 0.05) for the same species. CK = unshaded; LS = 35% shaded; MS = 70% shaded; HS = 92% shaded. The black box represents the species ‘Lark’ and the striped box represents the species ‘SupraNova’.
Agronomy 12 00959 g005
Figure 6. SOD, POD, and CAT activities of two species under different shade treatments (AC). The lowercase letters denote significant differences (p < 0.05) for the same species. CK = unshaded; LS = 35% shaded; MS = 70% shaded; HS = 92% shaded. The black box represents the species ‘Lark’ and the striped box represents the species ‘SupraNova’.
Agronomy 12 00959 g006
Table 1. Effects of shade on turf quality (TQ) and turf color intensity (TCI) of two turfgrass species.
SpeciesShading Level (%)15D30D45D
TCITQTCITQTCITQ
SupraNovaCK7.1 a7.6 a7.3 a7.5 a7.1 a7.6 a
LS8.1 a8.6 a7.8 a7.8 a7.5 a7.7 a
MS6.0 b7.2 a3.2 c3.5 c2.1 d2.8 d
HS4.8 b4.4 b2.2 d3.0 c1.3 d1.7 d
LarkCK8.3 a8.0 a9.0 a8.2 a9.0 a8.2 a
LS6.2 b7.2 a4.7 b3.5 c3.5 c4.2 b
MS4.6 b4.7 b2.7 d3.2 c1.5 d2.3 d
HS2.7 d3.1 c2.5 d1.7 d1.3 d1.7 d
Note: The lowercase letters represent significant differences (p < 0.05) for the same species. CK = unshaded; LS = 35% shaded; MS = 70% shaded; HS = 92% shaded.
Table 2. Effects of shade on root morphology of two turfgrass species.
SpeciesShading Level (%)Root Length (cm)Root Surface Area (cm2)
SupraNovaCK401.8 ± 5.2 b52.8 ± 3.4 b
LS675.0 ± 8.7 a70.7 ± 2.4 a
MS222.5 ± 3.2 c41.8 ± 4.2 c
HS103.5 ± 7.4 d24.7 ± 1.2 d
LarkCK1162.4 ± 17.5 a111.2 ± 7.3 a
LS512.9 ± 6.8 b52.5 ± 4.8 b
MS354.8 ± 3.4 c56.2 ± 4.5 b
HS309.3 ± 4.3 d53.6 ± 1.4 b
Note: The data are shown as the means ± S.E.s (n = 4). The lowercase letters denote significant differences (p < 0.05) for the same species. CK = unshaded; LS = 35% shaded; MS = 70% shaded; HS = 92% shaded.
Publisher’s Note: MDPI stays neutral with regard to jurisdictional claims in published maps and institutional affiliations.

