
Genotypic Variation for Salt Tolerance within and between ‘Alamo’ and ‘Kanlow’ Switchgrass (Panicum virgatum L.) Cultivars


112 Plant Biotechnology Building, Department of Plant Sciences, University of Tennessee, Knoxville, TN 37996-4500, USA
*
Author to whom correspondence should be addressed.
Agronomy 2022, 12(4), 973; https://0-doi-org.brum.beds.ac.uk/10.3390/agronomy12040973
Submission received: 29 March 2022
/
Revised: 15 April 2022
/
Accepted: 15 April 2022
/
Published: 18 April 2022
Abstract
:Switchgrass tolerates nutrient and water limitations; however, high salt concentrations may inhibit its production. Therefore, the salt tolerance potential of switchgrass needs to be enhanced for economic production. The objective of this study was to determine the differences within and between two lowland cultivars of switchgrass for growth, stomatal morphology, photosynthetic pigments content, and mineral traits. A greenhouse study was conducted on 18 sublines, derived from the cultivars Alamo (A) and Kanlow (K), plus a salt-tolerant and sensitivity check (20 genotypes). A split-plot randomized complete block design was used with three replications per treatment (0, 5, 10, and 20 dS m−1 NaCl). High salt concentrations (10 and 20 dS m−1 NaCl) reduced shoot biomass, stem diameter, and plant height up to 21, 11, and 16%, respectively, compared to the control for all genotypes (p < 0.05). Chlorophyll a and adaxial stomata width were moderately correlated with growth traits under saline conditions (r = 0.49 to 0.56, p < 0.05). The sublines 12A-227, TN13006-04, 12A-259, 12K-247, and TN13009-08 had better growth and accumulated less salt in shoot biomass than both checks. These results indicate that differences exist within and between the Alamo and Kanlow sublines, and it is possible to breed improved cultivars with increased salt tolerance.
1. Introduction
Switchgrass (Panicum virgatum L.) is a model herbaceous bioenergy and bioproduct crop in the USA. It is a native, perennial, warm-season grass, with broad adaptability that tolerates nutrient and water limitations and grows suitably in marginal lands without competing with major food crops [1]. About 11% of the total land in the USA is identified as marginal land with the potential for renewable plant-based product development, including crops such as switchgrass [2]. However, some locations, with >4 dS m−1 or >4 electric conductivity (EC) salt concentrations, can be prohibitive for economic switchgrass production [3,4,5]. Saline soils, where plant uptake of water and nutrients is limited, result in low biomass yield [6,7,8]. Therefore, for increasing the possibility of exploiting switchgrass for bioproduct production in marginal lands, its salt tolerance potentials need to be enhanced.
Salinity can lead to water and nutrient imbalances within plant systems that affect the physiological and biochemical processes and ultimately inhibit growth and development [9,10]. High concentrations of Na+ and Cl− ions in plant cells can lower the substrate water potentials that limit water and nutrient uptake [11]. Reductions in seed germination, seedling emergence, seedling growth, and yield of switchgrass have been reported in response to salinity [4,12]. The reduction in growth under saline conditions has been primarily found in the shoots, rather than in the roots [11]. A relative decrease in leaf area, number of tillers, plant height, and stem diameter were also observed when plants were exposed to high salt concentrations [13,14,15].
Reduction in total dry matter yield under salt stress has been associated with a reduced stomatal conductance and photosynthetic rate [9]. The increased salt concentration in stomatal guard cells affects photosynthetic activity by reducing stomatal conductance, thus restricting the availability of CO2 for photosynthesis [16]. The rate of stomatal conductance is influenced by stomatal anatomy, e.g., the density and size of stomata [6,12]. High abaxial stomata density was observed in switchgrass when the salt concentration was increased up to 200 mM [6]. An increase in adaxial and abaxial stomata size, in response to high salinity, has been found in switchgrass and prairie cordgrass (Spartina pectinata Link) [12]. Plants exhibit a trade-off strategy between stomatal density and stomatal size, whereby leaves with higher stomatal density tend to have smaller stomata [17]. Plants also respond to salinity through non-stomatal inhibition of photosynthesis, due to the reduction of the chlorophyll content of leaves [18,19]. Higher leaf Na+ concentrations, or low tolerance of the accumulated Na+, can increase the rate of senescence or decrease in chlorophyll content of older leaves [16]. Changes in the biomass yield of switchgrass grown under different levels of salinity have been associated with changes in photosynthetic rate, stomatal conductance, and chlorophyll content [10,18,20].
High salt concentrations limit water uptake from soil and interfere with the uptake of minerals [21]. The mineral composition of biomass in saline soil differs considerably from those grown in non-saline conditions. Excessive concentration of Na+ in cell walls can lead to osmotic stress and can ultimately cause cell death [16]. The ratio of K+ and Na+ in plant tissues changes with increased concentrations of Na+ in the cytosol [8]. Zhuo et al. [22] found that high salt concentrations in soil increased the accumulation of Na+ and Ca2+ and reduced the content of K+ in the biomass ash of switchgrass. Under saline conditions with high Na+, K+ concentration in the leaves decreases through the osmotic adjustment to protect plants from salt stress [15]. At high salinity levels, the accumulation of Na+ and K+ in switchgrass (‘Cave-In-Rock’) root and shoot biomass was increased; however, the uptake of Ca2+ and Mg2+ was lowered, resulting in salt toxicity [12]. Cordero et al. [6] found that the uptake of Mg2+ by switchgrass (‘Alamo’) leaves was higher than stems and roots, and its accumulation was significantly lowered in 300 mM salt concentration.
Lowland switchgrass, including Alamo and Kanlow, exhibited significant differences, in terms of growth parameters, photosynthetic traits, and stomatal conductance, when exposed to salt [6,18,23]. Nayak et al. [24] identified that two accessions of lowland switchgrass, EG 1104–1 and EG 1104–2, have a high level of salinity tolerance, based on visual observation, for salt injury. However, their study [24] did not explore the underlying biological mechanism for salt tolerance. Therefore, the study’s objectives reported herein are to: (i) determine salt tolerance differences among sublines derived from the cultivars Alamo and Kanlow against EG 1104–2 as a salt-tolerant check, and (ii) determine the mechanisms of salt tolerance in terms of growth, stomatal morphology, photosynthetic pigments content, and mineral composition traits. The evaluated sublines exhibited high biomass yield potential across locations and years using low inputs for their production [25] and could possess favorable traits for production in marginal soil conditions, including saline soils. Identifying mechanisms of salt tolerance in Alamo and Kanlow sublines will be useful for the selection of cross combinations to further characterize and identify the genomic regions associated with salt tolerance.
2. Materials and Methods
2.1. Plant Materials, Growth Conditions, and Experimental Treatments
Biomass yield screening of 10 Alamo- and Kanlow-derived F1s in simulated sward planting conditions exhibited significant yield heterosis in those families [25]. Eighteen parental lines of those 10 families (in four families, one parent is common in each of the two families) were selected, based on the high biomass yield in the region. To examine the response of the parents to salinity, 18 parent genotypes, along with two checks for salt tolerance and sensitivity, were evaluated for growth, stomatal morphology, photosynthetic pigments content, and mineral acquisition parameters. The water content (%) of the shoot and root biomass of the genotypes was also evaluated at the time of harvest. The 18 parent genotypes were sublines derived from the cultivars, i.e., Alamo (10 sublines) and Kanlow (8 sublines) [26]. The salt-tolerant (EG1104-02) and sensitivity (PI 315723-1) checks used in this study were identified through a greenhouse screening of several genotypes for salt tolerance by Nayak et al. [24]. Plants were screened under four different salt treatments in a greenhouse located at the University of Tennessee, Knoxville, TN (35.94° N and 83.94° W), for six weeks in June–July 2020 (Table 1). Seeds of Alamo and Kanlow were obtained from USDA Germplasm Resources Information Network (GRIN). Plants were grown with a temperature regime of 30 + 1/18 + 1 °C (day/night), 12 h photoperiod with supplemental light (LED, 400–700 nm), and 70% relative humidity.
Single ramets were planted at a depth of 3 cm in small containers (18 cm height, 7 cm diameter), filled with Premier pro-mix BX with 75–85% sphagnum peat moss (Premier Tech, Rivière-du-Loup, QC, Canada) two months before starting the treatments. Plants were fertilized with Plantex 20–20–20 Classic (Master Plant-Prod Inc., Brampton, Ont, Canada), containing 20% total nitrogen (nitrate, ammoniacal, and urea), 8.7% P2O5, and 1.6% K2O, at planting. Plants were watered uniformly with tap water to maintain good growth. When a plant reached the three-leaf stage, other tillers were thinned and maintained one plant per container, and salt treatments were applied. The experiment was designed in a split-plot randomized complete block design, with three replications per treatment, in which salt treatments were classified as main plots and genotypes as sub-plots. Plants were exposed to four salt treatments, including 0 (no salt added or control), 5, 10 and 20 dS m−1 NaCl (Catalog # S25542; Fisher ScientificTM, Waltham, MA, USA). The saline solution was prepared by following a process similar to Sun et al. [10]. Salt concentration was confirmed using electrical conductivity (EC) meter (CDH-93, Omega Engineering Inc., Norwalk, CT, USA). To achieve 5 (EC05 or 50 mM), 10 (EC10 or 100 mM), and 20 (EC20 or 200 mM) dS m−1 salt concentrations, 2.7, 5.5, and 10.9 mg NaCl were mixed with 1 mL of distilled water. A total of five salt treatments were applied once a week until the fifth week. Plants were watered with tap water (240 µS cm−1 solutes present) every other day (except when salt treatments were applied), totaling ten applications until the fifth week. For the first two weeks of the experiment, plants were watered with 25 mL of tap water or salt solution (based on treatments) per application. To avoid drought stress at the advanced growth stage, the application amount of the water or salt solution was increased to 60 mL starting the third week of applications. Applications were ceased one week before harvesting biomass. On average, 16 mL of water leached at each application of water or salt solutions. The leachate water was collected at three different times of salt applications, 7-, 21-, and 28-days after the experiment, and analyzed for mineral content. Stomatal morphology, chlorophyll (Chl) a and b, and carotenoid content (Car) were measured a week before harvesting biomass.
2.2. Assessment of Growth Traits, Shoot and Root Water Content, Stomatal Morphology, and Photosynthetic Pigments Content
Plant growth traits, including plant height (cm), stem diameter (cm), and leaf area (cm2), were measured after five weeks of salt treatments and one week before harvesting biomass. Plant height was measured from the base of the plant to the top of the panicle. Stem diameter was measured with a 0 to 150 mm vernier caliper scale. Leaf length and width of three leaves were measured and leaf area was calculated. Three values of leaf area were averaged to compute mean values. Shoot biomass and root biomass were measured after harvesting plants. Shoot biomass was harvested from the base of the plants (aerial mass). After harvesting shoot biomass, roots (belowground mass) were separated from the soil and collected in a 200 mL beaker. The roots were rinsed carefully using a fine mesh strainer. When the roots were visibly free of soil, the washed roots were surface dried by blotting with a paper towel and spreading on greenhouse benches for 30 min. Moisture at harvest was determined by measuring the fresh weight (FW) of the sample, drying the sample in an oven (Fischer Scientific, Atlanta, GA, USA) at 50 °C for 120 h, and reweighing to determine the dry weight (DW). The percent of moisture in shoots and roots was determined as 100 × (FW–DW/FW) [27]. Shoot biomass and root biomass were estimated (in g) on a dry weight basis.
The number of stomata (stomatal density) and stomatal size (length and width) were recorded on both the adaxial and abaxial leaf surfaces. An epidermal layer of a leaf from each plant was excised, following the process described by Cordero et al. [6]. Transparent nail polish was placed over an approximately 1.0 cm × 0.5 cm leaf surface area, excluding the midrib. A transparent tape was used on the top of the nail polish after it was dry. The tape easily peeled off (without any pressure) the nail polish, along with the epidermal layer from the leaf surface. The excised tape with the nail polish surface prints was placed on a microscope slide and observed under an EVOSTM M7000 microscope (Fisher ScientificTM, Waltham, MA, USA). Stomata images were taken using the microscope’s imaging system. The stomatal density was measured in a 0.09 mm2 leaf area. The length and width of three stomata, observed within a 0.09 mm2 leaf area, were measured manually in µm, based on the scale-bar and grid in the image for each plant sample. The stomatal area (µm2) was derived from the stomatal length and width measurements in both the adaxial and abaxial leaf surfaces.
Photosynthetic pigments, including Chl a and b, as well as Car, were measured on the fully expanded leaves collected from each plant, after five weeks of salt treatment and one week before harvesting shoot biomass. The leaves were stored at −62 C until further processing. For Chl and Car extraction, a 2.0 mL vial containing a 10 mg leaf sample was soaked in 1 mL dimethyl sulfoxide (DMSO) and (CH3)2 SO (Fischer Scientific, Atlanta, GA, USA) and incubated at room temperature (21 °C) for 24 h [28]. After incubating, 200 µL of the extract was transferred to a microplate for absorbance analysis. The absorbance of leaf Chl and Car concentrations was determined by using a Synergy H1 microplate reader (serial number 180511F, BioTek®, Winooski, VT, USA) in mg kg−1. The plate reader was set with wavelengths of 200 to 700 nm, spectral bandwidth of 5 nm, wavelength accuracy of +2 nm, and wavelength setting repeatability of +0.2 nm. It was calibrated to zero absorbance using a blank of pure DMSO. The absorbance of both the sample and blank was measured at 470 (Chl a), 645 (Chl b), and 663 (Car) nm wavelengths, and the calculation of each pigment was performed according to Richardson et al. [28]. Total Chl content was computed as the sum of Chl a and Chl b.
2.3. Assessment of Mineral Content
Dried aboveground biomass was analyzed for mineral content, according to a process described by Barickman et al. [29], with slight modifications. Plant tissues were ground using a cyclone sample mill (UDY Corporation, Fort Collins, CO, USA) to pass through a 1 mm screen. Approximately 0.50 g of each powdered dry tissue sample was combined with 10 mL of 70% HNO3 and digested in a microwave digestion unit (Ethos, Milestone Inc., Shelton, CT, USA). Mineral content was analyzed using an inductively coupled plasma mass spectrometer (ICP-MS; Agilent Technologies, Inc., Wilmington, DE, USA). The instrument was optimized daily for accurate estimation. Macro- and micro-nutrients, including Na+, Ca2+, Mg2+, and K+, were analyzed in the sample tissue (as mg g−1) on a dry weight basis. Na+/K+ and Na+/Mg2+ ratios were estimated using the estimates of Na+, K+, and Mg2+.
2.4. Statistical Analyses
The data for growth traits, shoot and root water content, stomatal traits, photosynthetic pigments content, and mineral traits were analyzed using a mixed-effects model in JMP Pro 15 (SAS Institute, Cary, NC, USA), where the genotypes and salt treatments were considered fixed effects, with replication as a random effect. Variance components were estimated using the restricted maximum likelihood method. The genotypes and salt treatments interaction effect across the treatments were analyzed for each trait, considering four salt treatments, including the control, EC05, EC10, and EC20. The Tukey–Kramer HSD method was used to differentiate salt treatments and Student’s t-test (pairwise mean comparison) was performed to compare the genotypes (p < 0.05). Due to a large number of missing data (dead plants and not enough biomass samples to process) in the EC20 treatment, the interaction effect for mineral content was computed considering three treatments, including the control, EC05, and EC10. The traits were evaluated into the control (no salt applied) and saline groups, based on the difference between the traits in the control and high salt concentrations (EC10 and/or EC20) (p < 0.05). The trait values across EC10 and EC20 were pooled if no significant difference was observed. Due to dead plants and not enough biomass samples, resulting from the higher salinity treatment in EC20, only EC10 was considered as a high salt concentration group for the analysis of mineral composition traits.
The traits with a significant genotype, treatment, or interaction effects, identified through the ANOVA, were considered for determining the relationship between the traits. The association of growth, shoot water content, stomatal traits, photosynthetic pigments content, and mineral traits were identified in the control and saline groups using Pearson correlation coefficient in JMP Pro 15 (p < 0.05).
3. Results
3.1. Effect of Genotypes and Treatments
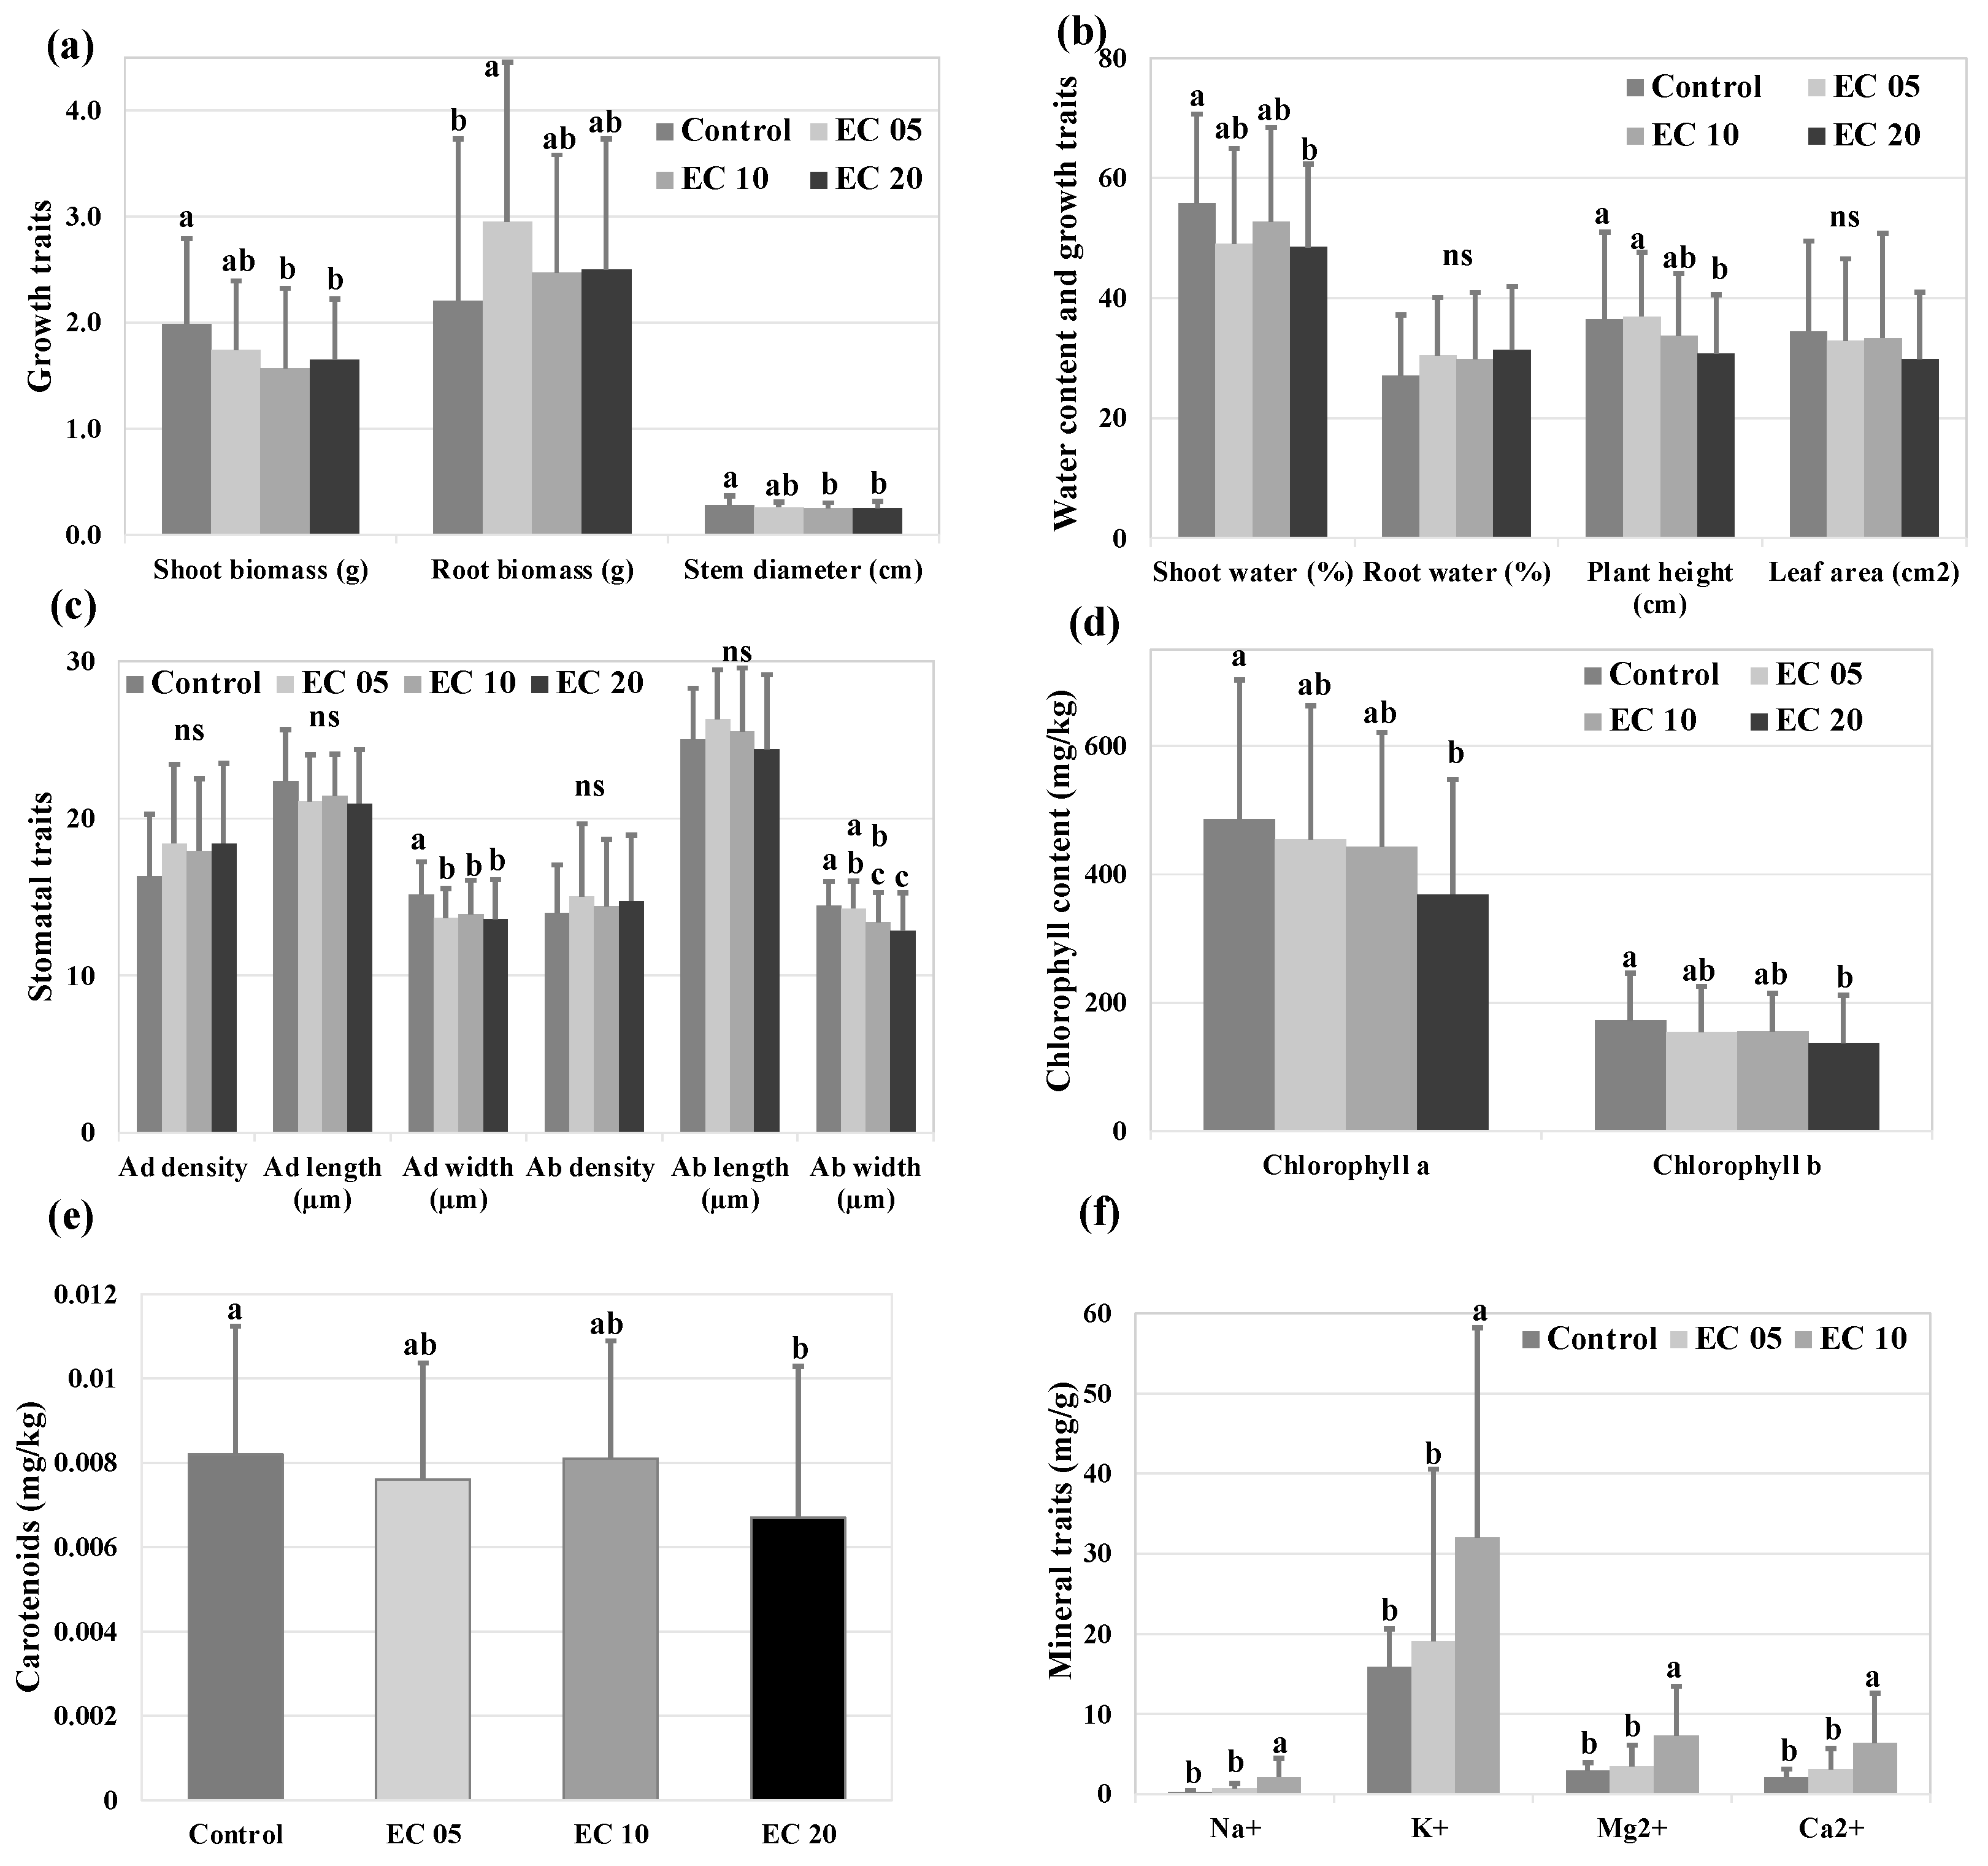
The Alamo and Kanlow genotypes differed in mean biomass yield, stomatal, photosynthetic, and mineral composition traits (p < 0.05, Table 2). The main effects of genotype and salt treatments were significant for most of the traits (Table 2). Shoot biomass and stem diameter were lowered by 21% and 11% in EC10 and 17% and 11% in EC20, whereas root biomass was higher by 33% in the EC05 than in the control (p < 0.05) (Figure 1a). A significant decrease in shoot water content (13%), plant height (16%), and stomata size (10 to 15%) was observed in EC20 than in the control (Figure 1b,c). The accumulation of photosynthetic pigments content, including Chl and Car, were lowered (18% to 24%) in EC20, as compared to the control (p < 0.05) (Figure 1d,e). Plants exposed to high salt concentration (EC10) accumulated more salts in their tissues, as compared to the plants exposed to the control and low salt concentration (EC05) (Figure 1f).
The genotype and salt treatments interaction effects were significant for shoot biomass, S/R biomass, stem diameter, plant height, Na+, K+, Mg2+, and Ca2+ (Table 2). Because the results obtained for the traits evaluated in the control were significantly different from the traits evaluated in high salt concentrations (EC10 and EC20) (Figure 1), the traits were analyzed separately into two groups, control and saline (EC10 and/or EC20) (Figure 2, Figure 3 and Figure 4). For the growth and stomatal traits, the saline group includes the combined EC10 and EC20 treatments for the shoot water, plant height, and photosynthetic pigments; the group includes only EC20 treatment, and, for the mineral traits, it includes only EC10 treatment.
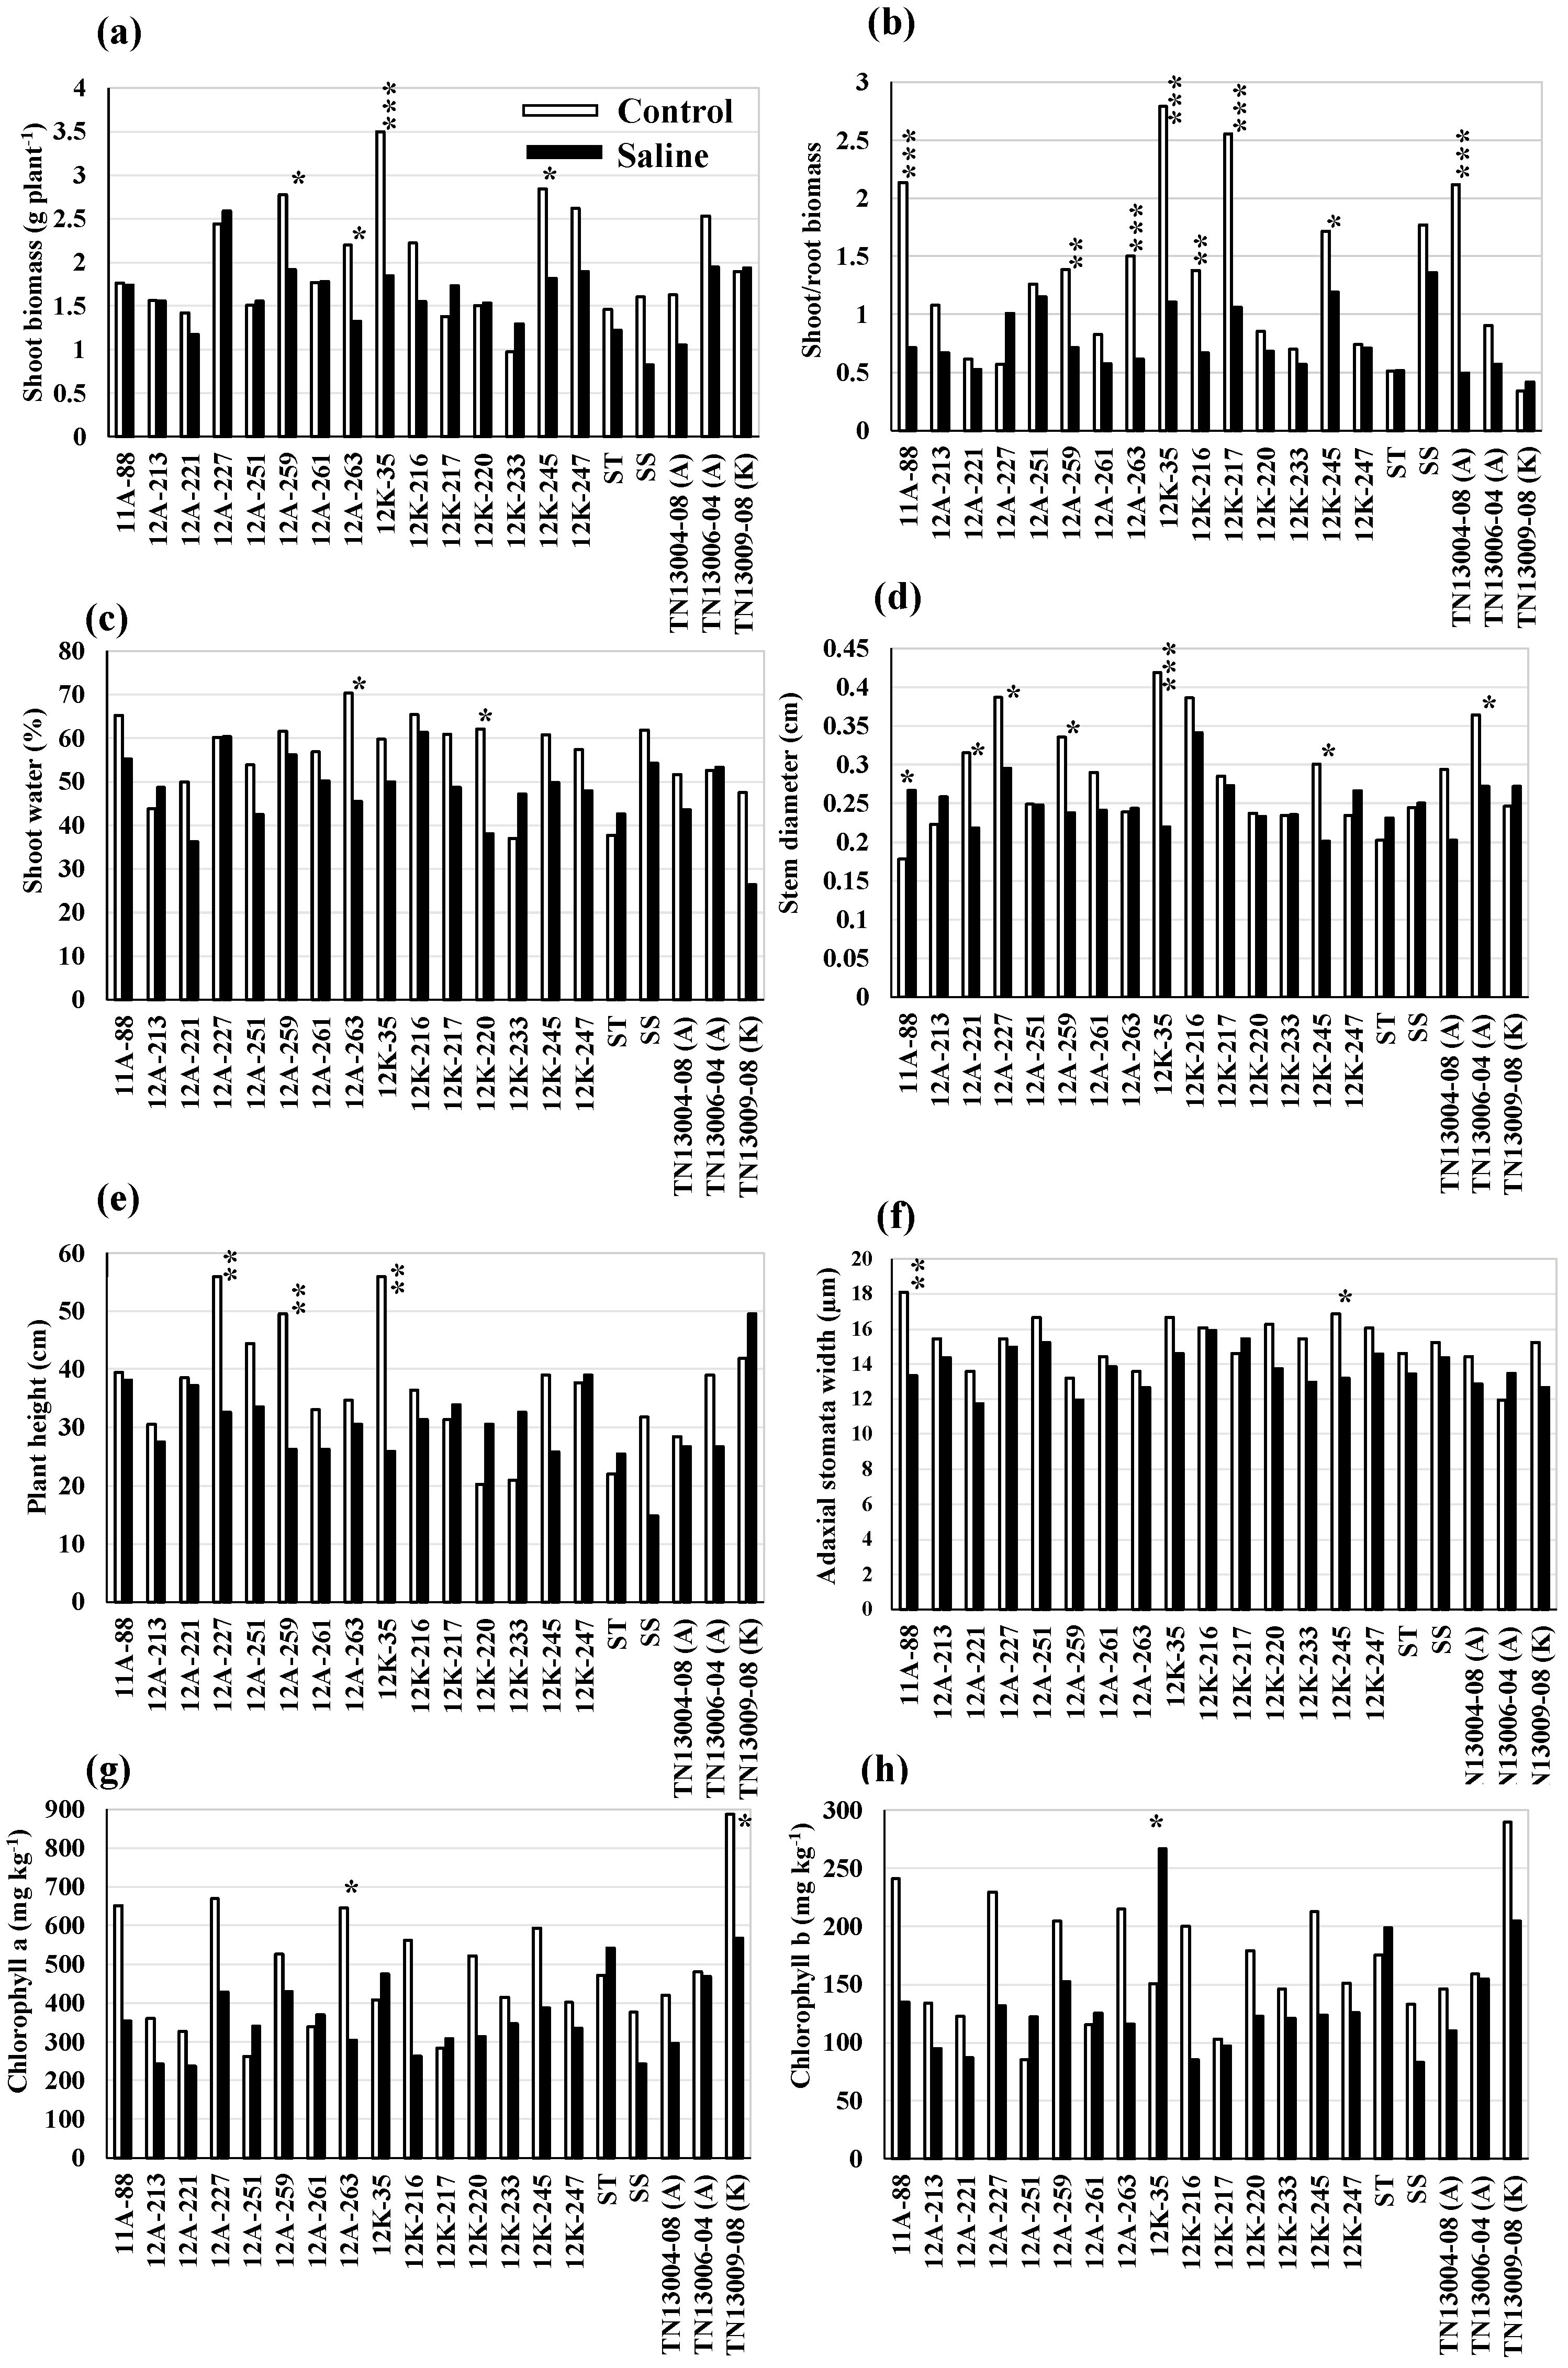
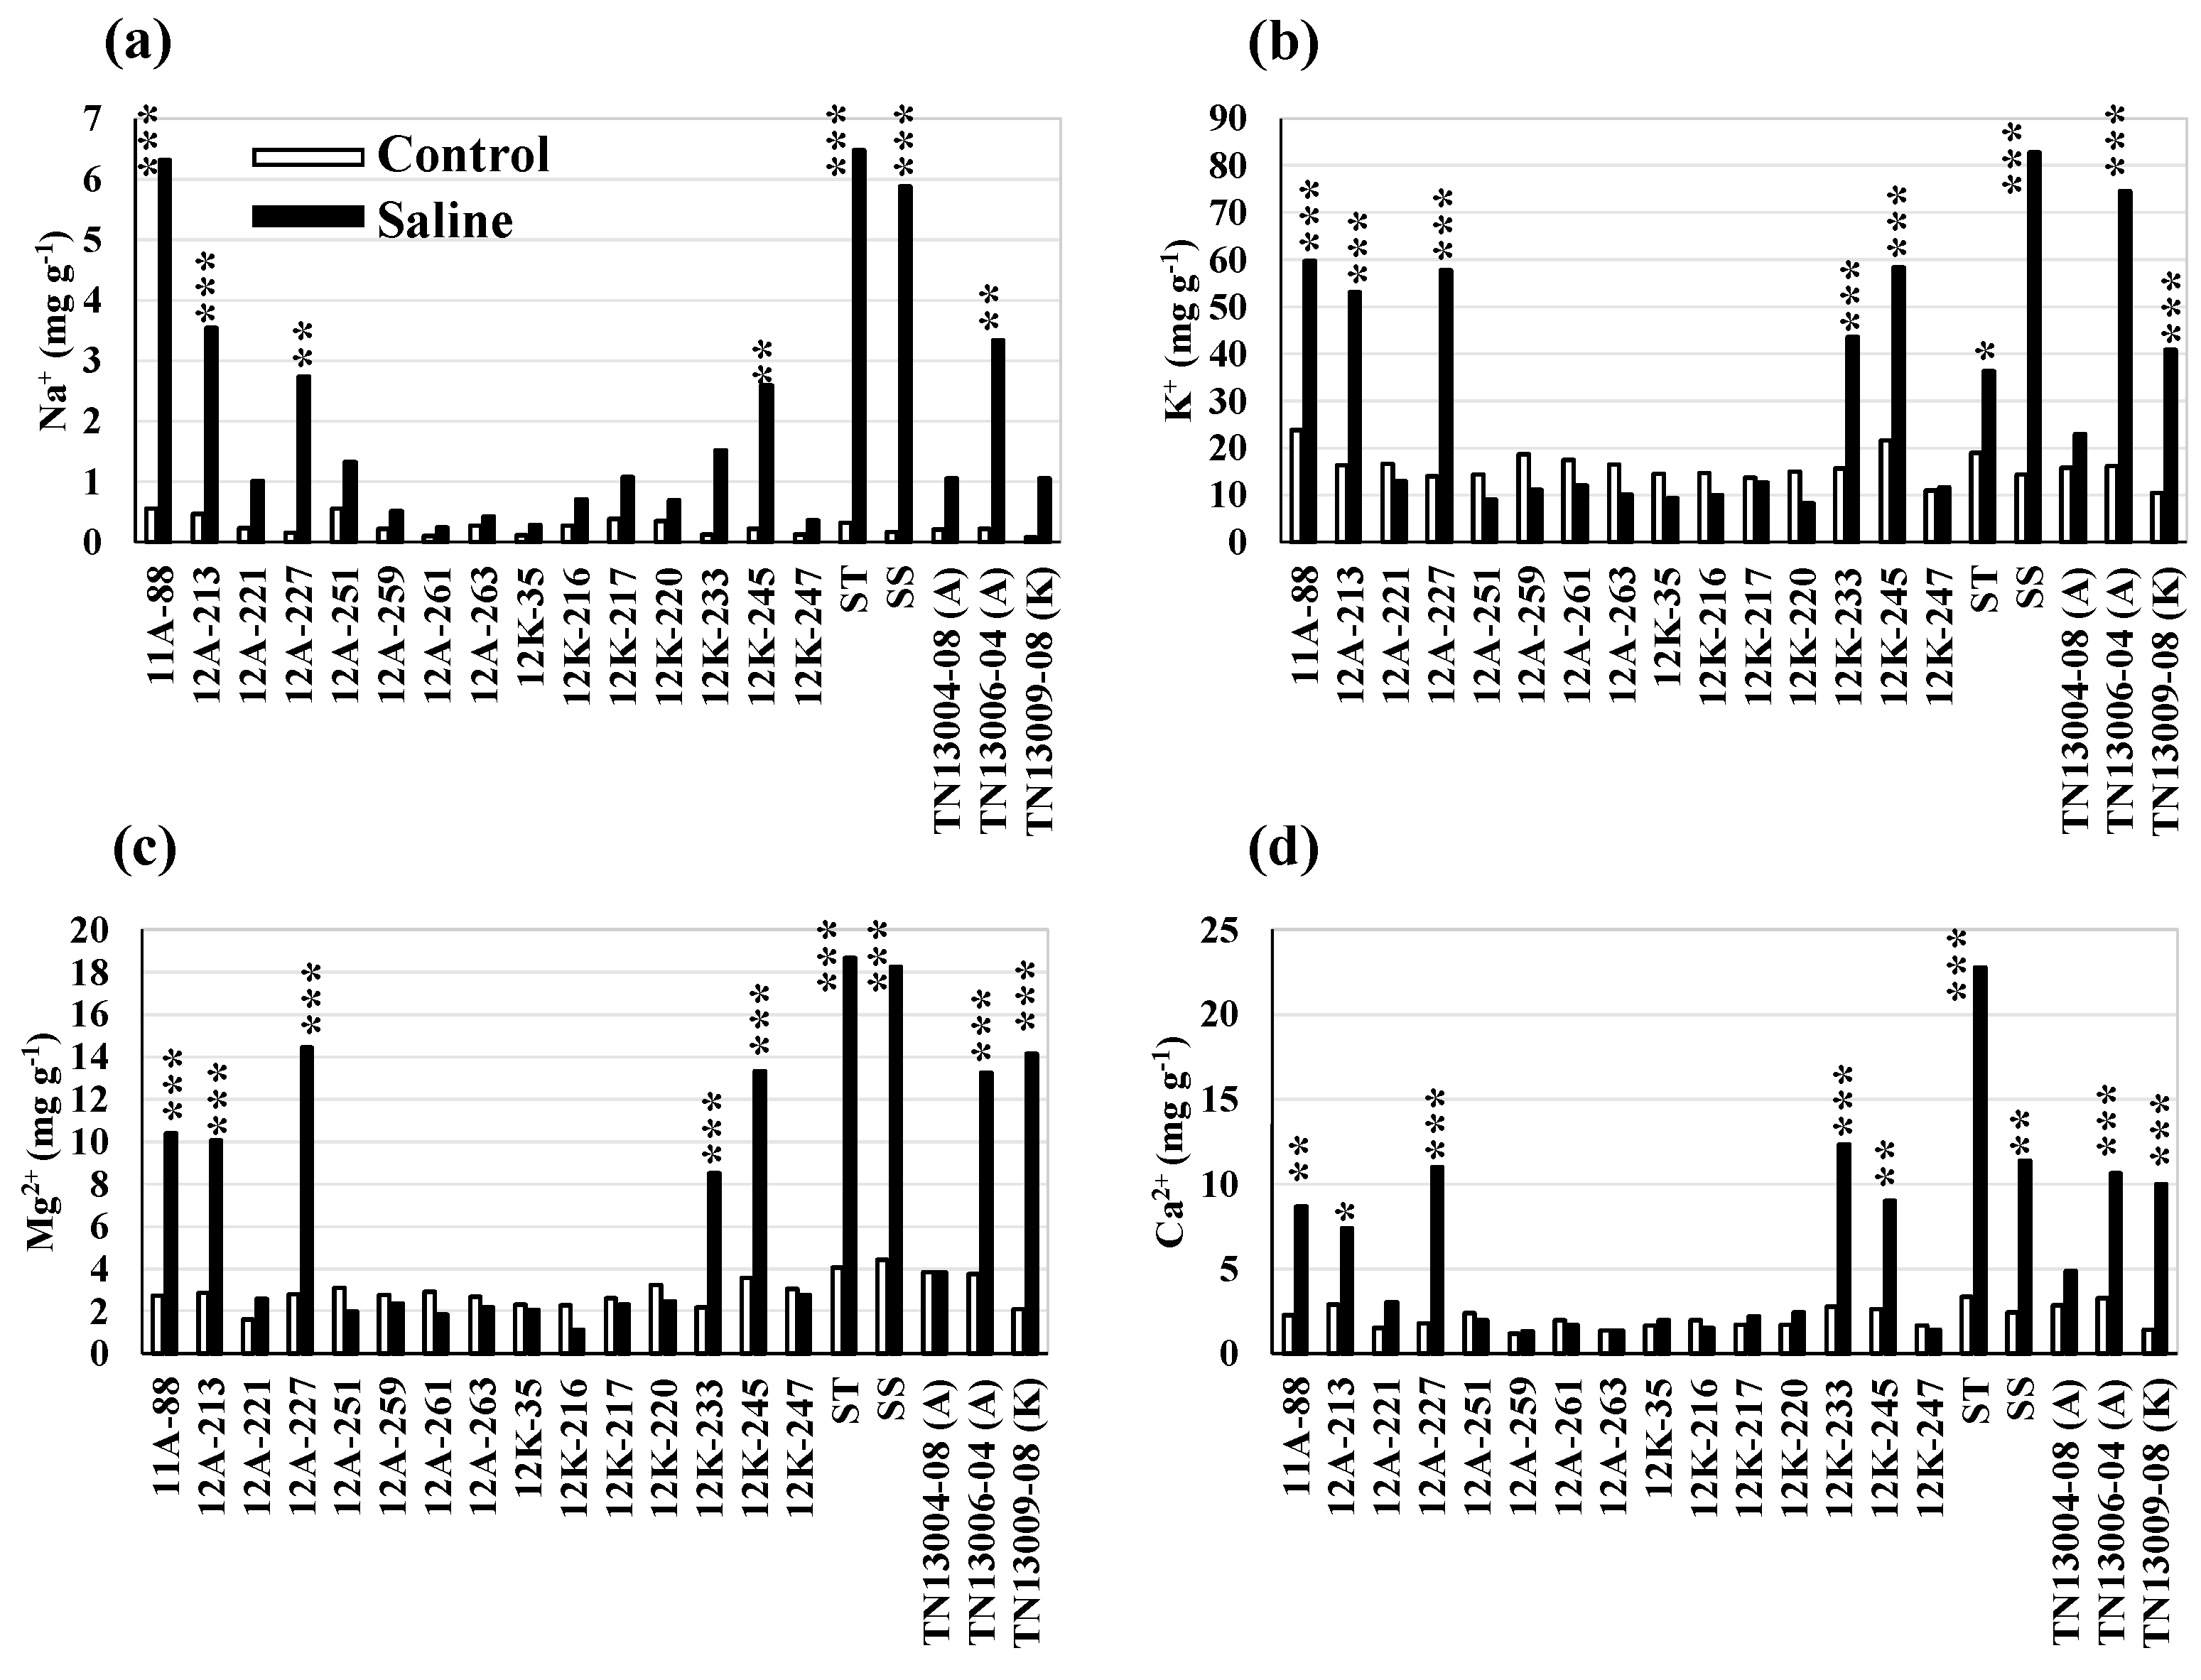
Within the genotype, variation exists for growth, stomatal, photosynthetic, and mineral traits in the control and salt treatments (p < 0.05) (Figure 2). Some of the evaluated genotypes were more sensitive to high salt concentrations (EC10 and EC20) than the others. The shoot biomass yield and S/R biomass of the genotypes, including 12A-259, 12A-263, 12K-35, and 12K-245, were significantly reduced in the saline condition, as compared to the control (Figure 2a,b). Among the genotypes, the saline treatment reduced both the stem diameter and plant height of 12A-259 and 12K-35 (p < 0.05) (Figure 2d,e). However, a high accumulation of Chl b was observed in 12K-35 in the saline treatment, rather than in the control (Figure 2h). The significant reduction in shoot water and Chl a in 12A-263 (Figure 2c,g) and stem diameter and adaxial stomata width in 12K-245 (Figure 2d,f) were observed in the saline treatment, as compared to the control. In addition, the genotype 12K-245 accumulated higher Na+, K+, Mg2+, and Ca2+ in the saline condition than the control (Figure 3a–d). The accumulation of Na+, K+, Mg2+, and Ca2+ in 12A-213, ST check (EG1104-02), SS check (PI 315723-1), and 12K-233 were higher in saline treatment than in the control (Figure 3a–d); however, no significant change in growth, stomatal, and photosynthetic traits were observed, due to high salt concentrations.
Twenty genotypes were differentiated for growth, shoot water content, stomatal traits, photosynthetic pigments content, and mineral traits in the saline treatment using Student’s t-test. Among the 20 genotypes, the genotypes 12A-227, 12A-259, 12K-247, TN13006-04 (A), and TN13009-08 (K) had a higher shoot biomass yield (average yield, 2.1 g plant−1) than the ST (1.2 g) and salt-sensitive (SS, 0.8 g) checks in high salt concentrations (combined EC10 and EC20) (p < 0.05) (Figure 2a). In addition, the genotypes (12A-227, 12A-259, 12K-247, TN13006-04, and TN13009-08) had higher S/R biomass (33%), shoot water (14%), stem diameter (16%), and plant height (37%) than the ST check (EG1104-02) (Figure 2). A small increase (7%) in adaxial stomata width was found in the genotypes, 12A-227, 12K-247, and TN13006-04 (A), and an increase in Chl (up to 5%) was observed in TN13009-08 (K), as compared to the ST check (Figure 2f–h). The genotypes also accumulated less Na+ (−75%) and high K+ (8%) than the ST check (Figure 3). Therefore, the genotypes 12A-227, 12A-259, 12K-247, TN13006-04 (A), and TN13009-08 (K), which were high-performing and accumulating less Na+ and higher K+ in the saline treatment in our study, were identified as salt-tolerant genotypes.
3.2. Relationships between and among the Traits
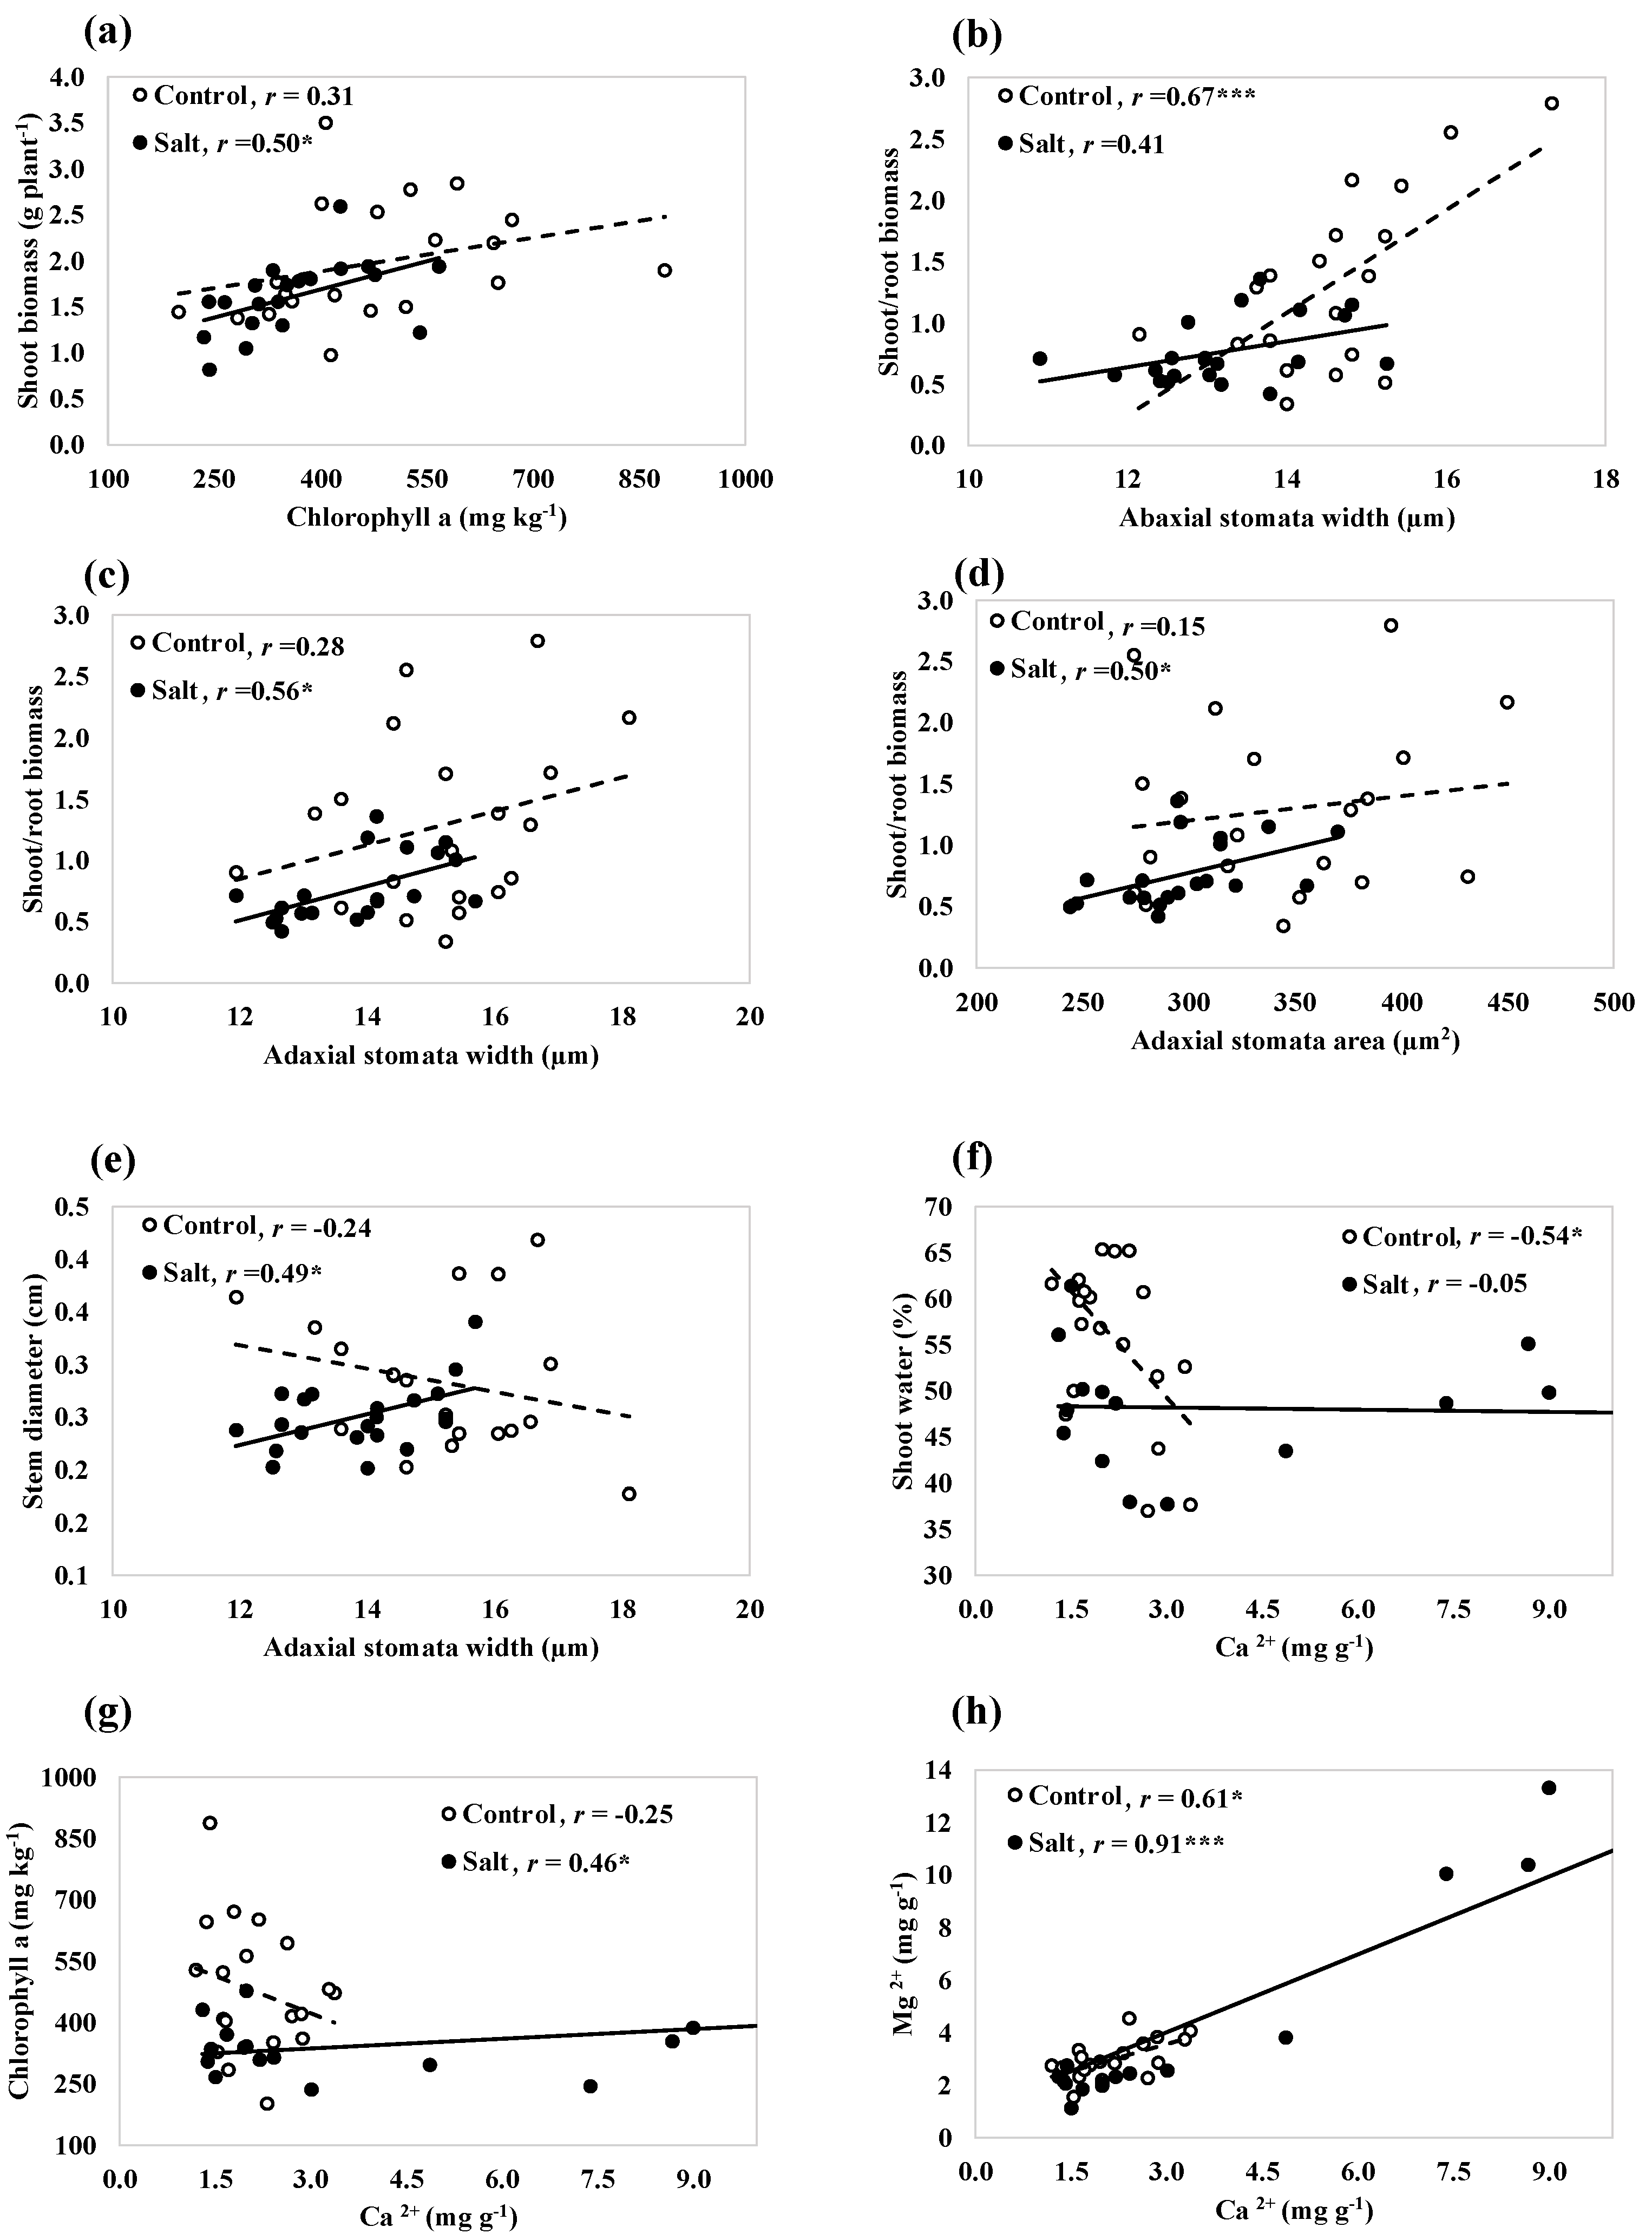
A significant correlation was found between growth, shoot water content, stomatal, photosynthetic, and mineral traits in the control and saline treatments (Figure 4). Chlorophyll a contributed positively to the shoot biomass yield in the saline treatment (Figure 4a). Genotypes with larger abaxial stomata width were associated with the increase in S/R biomass in the control treatment (Figure 4b), whereas genotypes with large adaxial stomata width exhibited high S/R biomass and big stems in the saline treatment (Figure 4c,e). During unstressed or in the control condition, a negative correlation was observed between Ca2+ and shoot water content (Figure 4f). In the saline condition, higher Ca2+ concentration was associated with the higher accumulation of Chl a content (Figure 4g). With increasing the concentrations of Ca2+, the concentrations of Mg2+ increased in both the control and saline conditions (Figure 4h).
3.3. Solute Concentrations in the Leachate Water
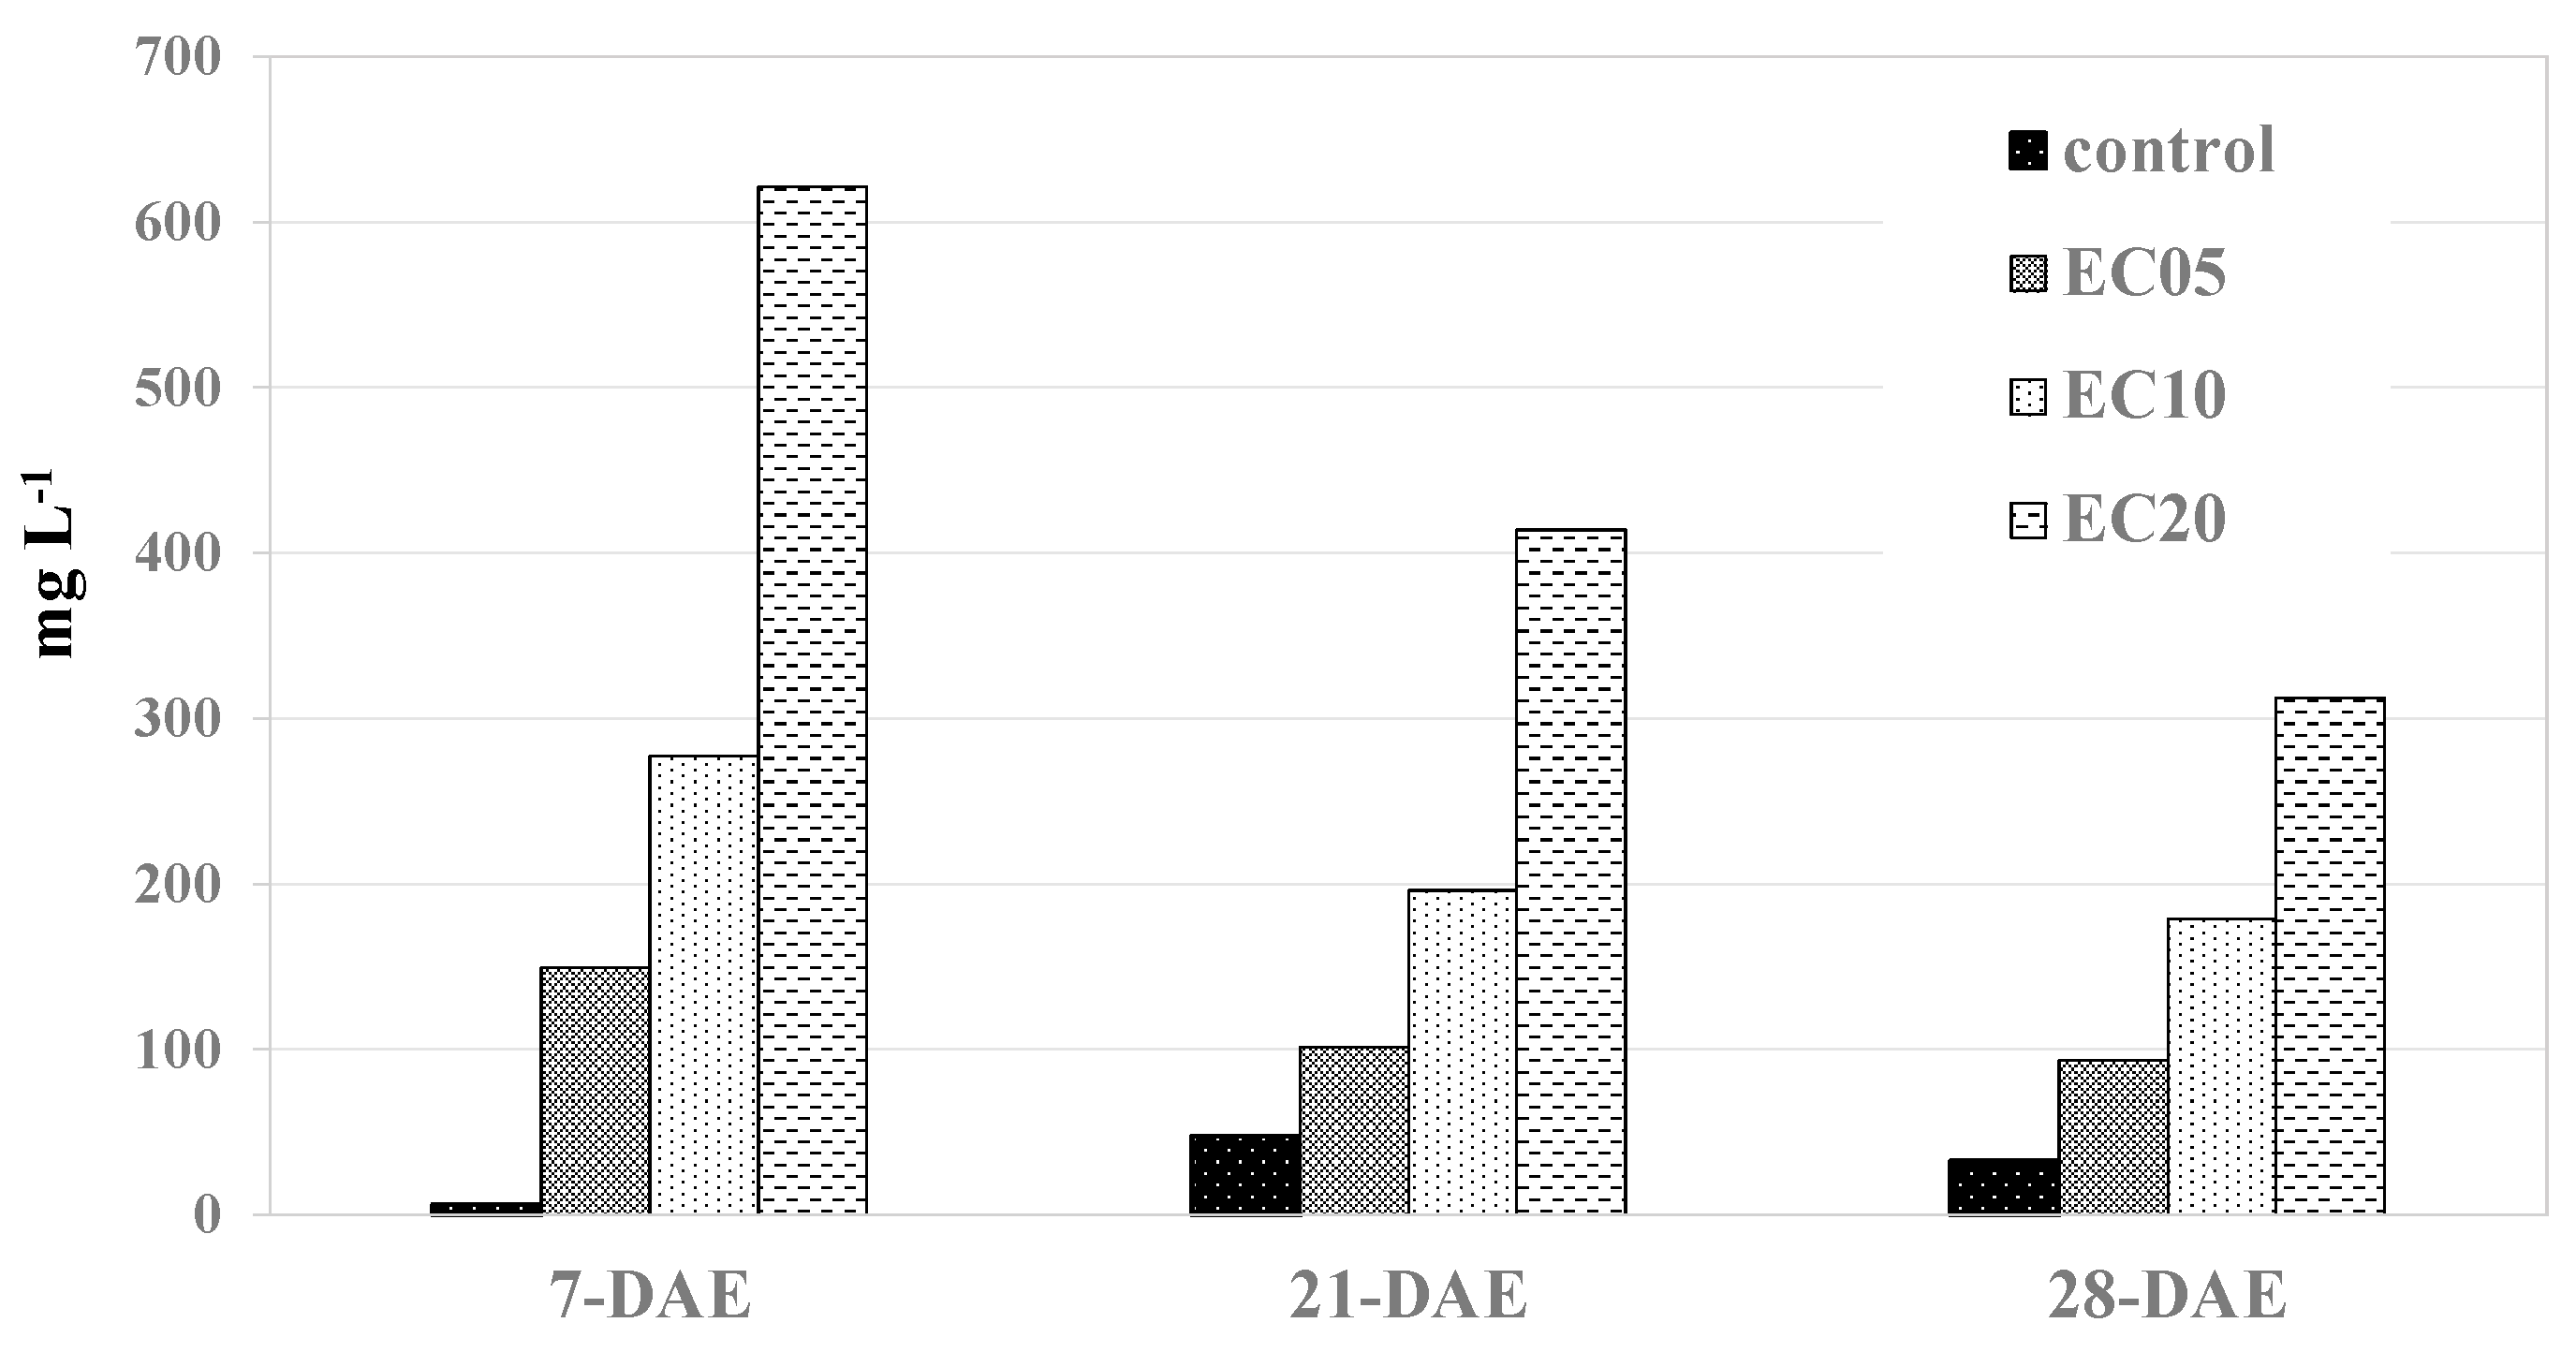
With the application of the first salt treatment, or seven days after the experiment (DAE), the average solute content in the leachate water was 6, 149, 278, and 621 mg L−1 in the control, EC05, EC10, and EC20 treatments, which was higher than the greenhouse water (3 mg L−1) (Figure 5). The solute concentration in the leachate water increased from 7 to 21 DAE in the control treatment, and it decreased from 21 to 28 DAE. However, the solute concentrations decreased from 7 to 28 DAE in the EC05, EC10, and EC20 treatments. Decreased solute concentrations in the leachate water at the later stage of the experiment could be due to the formation of a thin layer of solutes on the surface of the soil, and sensitivity to application of solutes decreased with decreasing soil macro-porosity [30].
4. Discussion
The results from this study demonstrated that, when switchgrass plants were exposed to moderate to high salinity (EC10 and EC20), shoot biomass yield, S/R biomass, stem diameter, and plant height were significantly lowered, as compared to the control plants. Cordero et al. [6] have found that salinity leads to a serious threat to switchgrass growth, causing a reduction in shoot weight, root weight, leaf area, relative water content, photosynthesis, and stomatal conductance. Reduction in shoot water content was also observed in saline conditions, compared to control in our study, which could be associated with the salt stress-causing water deficit in cells. Previous studies have shown that the cell water deficit (osmotic stress) affects the stomatal aperture [6,10,12]. The stomatal size, including the adaxial and abaxial stomata width and adaxial stomata area, was significantly reduced with increasing salt concentrations in this study. Another study has found a reduction in guard cell size was associated with a higher accumulation of salts in the guard cells [16].
An increase in stomata size is associated with growth traits in our study. According to the Pearson correlation, a high S/R biomass was associated with large abaxial stomata width in the control treatment. In contrast to the control treatment, high S/R biomass was associated with large adaxial stomata width in the salt treatment. Flexas et al. [31] demonstrated that large stomata have a significant effect on maintaining good water potential and gas exchange, which could have consequently increased S/R biomass in our study. The differential effect of abaxial and adaxial stomata, under salt treatments in our study, shows that stomata are sensitive to stress. Wang et al. [32] found abaxial stomata are more sensitive to environmental factors than adaxial stomata.
The Chl and Car content were significantly reduced in the salt treatment (EC20), as compared to the control. It is supported by another study in which a considerable reduction in Chl content was found in high salinity conditions [33]. Higher Chl a content was observed in high shoot biomass yielding genotypes in the saline conditions in our study. Liu et al. [18] found that higher Chl content is associated with higher photosynthesis in switchgrass populations.
We observed that a higher accumulation of Chl a and larger adaxial stomata width positively affect the growth traits in saline conditions. Cui et al. [34] found that the Chl content of lowland switchgrass is high during vegetative and elongation stages, and it starts to degrade at the later stage of the growth. Reduction in Chl content is associated with leaf senescence, which adversely affects the biomass yield of perennial ryegrass (Lolium perenne L.) [35]. The plants evaluated in our study were at the vegetative stage. However, early leaf senescence, initiated through salt stress, could have reduced Chl content in some genotypes, which may have resulted in a moderate positive correlation between Chl a and shoot biomass yield in our study. In our study, high salt (Na+) concentration was associated with high Ca2+ accumulation. Photosynthesis is a complex biochemical process in which Ca2+ plays an important role in the transcription and translation of chloroplast genes during stress [36]. Ca2+ helps to protect the photosynthetic system through severe photoinhibition by improving the xanthophyll cycle [7]. Therefore, Ca2+ could have played an important role in improving the performance of some genotypes under the saline condition in our study. Furthermore, a moderate positive correlation of adaxial stomata width with S/R biomass and stem diameter in the saline condition in our study indicates larger stomatal size could be a beneficial trait in the studied genotypes.
The magnitude of salt tolerance varied substantially with genotypes. Most of the high-performing (salt-tolerant) genotypes identified through this study had higher shoot biomass, S/R biomass, stem diameter, plant height, low Na+, and high K+ in saline conditions. Among the salt-tolerant genotypes, the genotypes 12A-259 and 12K-247 accumulated fewer solutes (Na+, Mg2+, and Ca2+) in saline conditions than other genotypes. The higher performance and lower effect of salinity on these genotypes might be associated with its ability to exclude salt absorption at the root level [6]. The remaining three salt-tolerant genotypes 12A-227, TN13006-04, and TN13009-08 accumulated high Na+, K+, Mg2+, and Ca2+ in the saline condition. Rodrigues et al. [37] found higher accumulation of K+ avoids Na+ toxicity and improves photosynthesis by inhibiting Na+ uptake and its transport to the shoots. The compartmentalization of excess salts in vacuoles and osmotic adjustment by accumulating compatible solutes might have contributed to increased salinity tolerances on these genotypes. Munns [7] and Kim et al. [12] found that plants developed mechanisms to tolerate salt stress by translocating adsorbed salts in salt glands or vacuoles and protecting plants from salt injury. Shrestha et al. [25] found that most of the genotypes that were higher-performing in the current study had a biomass yield higher than the average of the genotypes evaluated in the field across two locations and two years. In addition, most of the genotypes that were poor-performing in the current study had biomass yields below the average.
The genotypes 11A-88 and PI315723-1 (SS check) accumulated higher Na+, and the EG1104-02 (ST check) accumulated higher Na+, Mg2+, and Ca2+ than other genotypes under saline conditions. The Mg2+ and Ca2+ concentrations in the cytoplasm increase with increasing salinity to detoxify the salt effect by regulating ionic homeostasis (cation balance) [6,38]. The accumulation of higher Mg2+ and Ca2+ could have led to a mechanism to protect the photosystem, resulting in the higher Chl content in the ST check in our study. Cordero et al. [6] found that reductions in the absorption of the essential cations, including Mg2+ and Ca2+, resulted in higher concentrations of Na+ in Kanlow and Trailblazer. Krieger and Weis [39] have demonstrated that Ca2+ is an essential regulatory cofactor for protecting PSII by regulating a delicate redox balance against both the over-reduction and over-oxidation of light. The ST check could have utilized its energy in the salt protection mechanism (reducing the load of high Na+) at the expense of growth, producing less shoot biomass. Asrar et al. [33] found that salt-stressed plants distribute a higher assimilated carbon to energy and maintenance, rather than the development of plant parts. High salt concentrations in 11A-88 and SS check were accompanied by a higher accumulation of K+ in saline conditions. Wu et al. [40] found that salt-tolerant genotypes of wheat and barley accumulate more K+ in the leaves. It supports our results, in which, genotypes (11A-88 and SS) with high K+ levels could maintain proper water balance in shoots. However, the higher absorption of salts in their tissues could have damaged photosystems by accumulating reactive oxygen species, thus impairing their performance [41]. The fast accumulation of salt in the soil induces stomatal closure to conserve water and reduce photosynthesis [42].
The selection of high salinity tolerance genotypes is crucial for improving genotypes’ performance in saline environments. The genotypes evaluated in this study produced high biomass using low nutrients and water, when assessed across the locations and years in another study [25]. This study demonstrates that the genotypes derived from two lowland switchgrass cultivars exhibit variations for salt tolerance within and between cultivars, differ with mechanisms of salinity tolerance, and can thrive well in marginal environments with tested saline conditions. The high-performing (salt-tolerant) genotypes (12A-227, TN13006-04, 12A-259, 12K-247, and TN13009-08), with high shoot biomass yield in the saline environment, allow for breeding salinity tolerant cultivars in the future. Both salt-tolerant and -sensitive switchgrass genotypes can be valuable resources for future genetic studies, by which genes conferring salt tolerance can be identified and incorporated into a breeding program.
Author Contributions
Conceptualization and methodology, F.A., C.S. and S.L.S., writing—original draft preparation, investigation, and formal analysis, S.L.S.; writing—review and editing, F.A. and C.S.; resources, supervision, visualization, project administration, and funding acquisition, F.A. All authors have read and agreed to the published version of the manuscript.
Funding
This research was supported by the University of Tennessee, Institute of Agriculture, Knoxville, TN, USA.
Institutional Review Board Statement
Not applicable.
Informed Consent Statement
Not applicable.
Data Availability Statement
Not applicable.
Acknowledgments
The authors are thankful to UTK Genomics Hub lab for letting to use the EVOS microscope for measuring stomata and Synergy H1 microplate reader for photosynthetic pigments content in leaves. Thanks to several undergraduate students for technical assistance.
Conflicts of Interest
The authors declare no conflict of interest.
References
- Sanderson, M.A.; Adler, P.R.; Boateng, A.A.; Casler, M.D.; Sarath, G. Switchgrass as a biofuels feedstock in the USA. Can. J. Plant Sci. 2006, 86, 1315–1325. [Google Scholar] [CrossRef]
- Milbrandt, A.R.; Heimiller, D.M.; Perry, A.D.; Field, C.B. Renewable energy potential on marginal lands in the United States. Renew. Sust. Energ. Rev. 2014, 29, 473–481. [Google Scholar] [CrossRef]
- Anderson, E.K.; Voigt, T.B.; Kim, S.; Lee, D.K. Determining effects of sodicity and salinity on switchgrass and prairie cordgrass germination and plant growth. Ind. Crops Prod. 2015, 64, 79–87. [Google Scholar] [CrossRef]
- Dkhili, M.; Anderson, B. Salt effects on seedling growth of switchgrass and big bluestem. In Proceedings of the Twelfth North American Prairie Conference, Cedar Falls, IA, USA, 5–9 August 1990. [Google Scholar]
- Schmer, M.R.; Xue, Q.; Hendrickson, J.R. Salinity effects on perennial, warm-season (C4) grass germination adapted to the northern Great Plains. Can. J. Plant Sci. 2012, 92, 873–881. [Google Scholar] [CrossRef]
- Cordero, Á.; Garmendia, I.; Osborne, B.A. Interspecific variations in the growth, water relations and photosynthetic responses of switchgrass genotypes to salinity targets salt exclusion for maximising bioenergy production. Agriculture 2019, 9, 205. [Google Scholar] [CrossRef] [Green Version]
- Munns, R. Comparative physiology of salt and water stress. Plant Cell Environ. 2002, 25, 239–250. [Google Scholar] [CrossRef]
- Parida, A.K.; Das, A.B. Salt tolerance and salinity effects on plants: A review. Ecotox. Environ. Saf. 2005, 60, 324–349. [Google Scholar] [CrossRef]
- Sánchez, E.; Gil, S.; Azcón-Bieto, J.; Nogués, S. The response of Arundo donax L. (C3) and Panicum virgatum (C4) to different stresses. Biomass Bioenerg. 2016, 85, 335–345. [Google Scholar] [CrossRef]
- Sun, Y.; Niu, G.; Ganjegunte, G.; Wu, Y. Salt tolerance of six switchgrass cultivars. Agriculture 2018, 8, 66. [Google Scholar] [CrossRef] [Green Version]
- Richter, J.A.; Erban, A.; Kopka, J.; Zörb, C. Metabolic contribution to salt stress in two maize hybrids with contrasting resistance. Plant Sci. 2015, 233, 107–115. [Google Scholar] [CrossRef]
- Kim, S.; Rayburn, A.L.; Voigt, T.; Parrish, A.; Lee, D.K. Salinity effects on germination and plant growth of prairie cordgrass and switchgrass. Bioenerg. Res. 2012, 5, 225–235. [Google Scholar] [CrossRef]
- Cramer, G.R. Differential effects of salinity on leaf elongation kinetics of three grass species. Plant Soil 2003, 253, 233–244. [Google Scholar] [CrossRef]
- Huang, Y.; Guan, C.; Liu, Y.; Chen, B.; Yuan, S.; Cui, X.; Zhang, Y.; Yang, F. Enhanced growth performance and salinity tolerance in transgenic switchgrass via overexpressing vacuolar Na+ (K+)/H+ antiporter gene (PvNHX1). Front. Plant Sci. 2017, 8, 458. [Google Scholar] [CrossRef] [Green Version]
- Wang, Y.; Sun, Y.; Niu, G.; Deng, C.; Wang, Y.; Gardea-Torresdey, J. Growth, gas exchange, and mineral nutrients of ornamental grasses irrigated with saline water. HortScience 2019, 54, 1840. [Google Scholar] [CrossRef] [Green Version]
- Munns, R.; Tester, M. Mechanisms of salinity tolerance. Annu. Rev. Plant Biol. 2008, 59, 651–681. [Google Scholar] [CrossRef] [Green Version]
- Zhu, J.; Yu, Q.; Xu, C.; Li, J.; Qin, G. Rapid estimation of stomatal density and stomatal area of plant leaves based on object-oriented classification and its ecological trade-off strategy analysis. Forests 2018, 9, 616. [Google Scholar] [CrossRef] [Green Version]
- Liu, Y.; Zhang, X.; Miao, J.; Huang, L.; Frazier, T.; Zhao, B. Evaluation of salinity tolerance and genetic diversity of thirty-three switchgrass (Panicum virgatum) populations. Bioenerg. Res. 2014, 7, 1329–1342. [Google Scholar] [CrossRef]
- Mohamed, I.A.A.; Shalby, N.; Bai, C.; Qin, M.; Agami, R.A.; Jie, K.; Wang, B.; Zhou, G. Stomatal and photosynthetic traits are associated with investigating sodium chloride tolerance of Brassica napus L. cultivars. Plants 2020, 9, 62. [Google Scholar] [CrossRef] [Green Version]
- Hu, G.; Liu, Y.; Zhang, X.; Yao, F.; Huang, Y.; Ervin, E.H.; Zhao, B. Physiological evaluation of alkali-salt tolerance of thirty switchgrass (Panicum virgatum) lines. PLoS ONE 2015, 10, e0125305. [Google Scholar] [CrossRef] [Green Version]
- Manchanda, G.; Garg, N. Salinity and its effects on the functional biology of legumes. Acta Physiol. Plant 2008, 30, 595–618. [Google Scholar] [CrossRef]
- Zhuo, Y.; Zhang, Y.; Xie, G.; Xiong, S. Effects of salt stress on biomass and ash composition of switchgrass (Panicum virgatum). Acta Agric. Scand. Sect. B Soil Plant Sci. 2015, 65, 300–309. [Google Scholar] [CrossRef]
- Kim, J.; Liu, Y.; Zhang, X.; Zhao, B.; Childs, K.L. Analysis of salt-induced physiological and proline changes in 46 switchgrass (Panicum virgatum) lines indicates multiple response modes. Plant Physiol. Bioch. 2016, 105, 203–212. [Google Scholar] [CrossRef] [PubMed] [Green Version]
- Nayak, S.; Bhandari, H.; Pantalone, V.; Saha, M.C.; Ali, S.; Sams, C. Genomic regions associated with salinity tolerance in lowland switchgrass. Crop Sci. 2021, 61, 4022–4037. [Google Scholar] [CrossRef]
- Shrestha, S.L.; Bhandari, H.S.; Allen, F.L.; Tobias, C.M.; Nayak, S.; Goddard, K.; Senseman, S.A. Heterosis for biomass yield and other traits in ‘alamo’בkanlow’ switchgrass populations. Crop Sci. 2021, 61, 4066–4080. [Google Scholar] [CrossRef]
- Bhandari, H.S.; Nayak, S.; Dalid, C.O.; Sykes, V.R. Biomass yield heterosis in lowland switchgrass. Crop Sci. 2017, 57, 2015–2023. [Google Scholar] [CrossRef]
- Jiang, Y.; Yao, Y.; Wang, Y. Physiological response, cell wall components, and gene expression of switchgrass under short-term drought stress and recovery. Crop Sci. 2012, 52, 2718–2727. [Google Scholar] [CrossRef]
- Richardson, A.D.; Duigan, S.P.; Berlyn, G.P. An evaluation of noninvasive methods to estimate foliar chlorophyll content. New Phytol. 2002, 153, 185–194. [Google Scholar] [CrossRef] [Green Version]
- Barickman, T.C.; Thomas, E.H.; Wheeler, J.R.; Sams, C.E. Elevated levels of potassium in greenhouse-grown red romaine lettuce impacts mineral nutrient and soluble sugar concentrations. HortScience 2016, 51, 504–509. [Google Scholar] [CrossRef] [Green Version]
- Kluitenberg, G.; Horton, R. Effect of solute application method on preferential transport of solutes in soil. Geoderma 1990, 46, 283–297. [Google Scholar] [CrossRef]
- Flexas, J.; Bota, J.; Escalona, J.M.; Sampol, B.; Medrano, H. Effects of drought on photosynthesis in grapevines under field conditions: An evaluation of stomatal and mesophyll limitations. Funct. Plant Biol. 2002, 29, 461–471. [Google Scholar] [CrossRef] [Green Version]
- Wang, X.Q.; Wu, W.H.; Assmann, S.M. Differential responses of abaxial and adaxial guard cells of broad bean to abscisic acid and calcium. Plant physiol. 1998, 118, 1421–1429. [Google Scholar] [CrossRef] [Green Version]
- Asrar, H.; Hussain, T.; Hadi, S.M.S.; Gul, B.; Nielsen, B.L.; Khan, M.A. Salinity induced changes in light harvesting and carbon assimilating complexes of Desmostachya bipinnata (L.) Staph. Environ. Exp. Bot. 2017, 135, 86–95. [Google Scholar] [CrossRef]
- Cui, X.; Cen, H.; Guan, C.; Tian, D.; Liu, H.; Zhang, Y. Photosynthesis capacity diversified by leaf structural and physiological regulation between upland and lowland switchgrass in different growth stages. Funct. Plant Biol. 2019, 47, 38–49. [Google Scholar] [CrossRef]
- Xu, B.; Li, H.; Li, Y.; Yu, G.; Zhang, J.; Huang, B. Characterization and transcriptional regulation of chlorophyll b reductase gene non-yellow coloring 1 associated with leaf senescence in perennial ryegrass (Lolium perenne L.). Environ. Exp. Bot. 2018, 149, 43–50. [Google Scholar] [CrossRef]
- Yang, S.; Wang, F.; Guo, F.; Meng, J.J.; Li, X.G.; Dong, S.T.; Wan, S.B. Exogenous calcium alleviates photoinhibition of PSII by improving the xanthophyll cycle in peanut (Arachis hypogaea) leaves during heat stress under high irradiance. PLoS ONE 2013, 8, e71214. [Google Scholar] [CrossRef] [Green Version]
- Rodrigues, C.R.F.; Silva, E.N.; Ferreira-Silva, S.L.; Voigt, E.L.; Viégas, R.A.; Silveira, J.A.G. High K+ supply avoids Na+ toxicity and improves photosynthesis by allowing favorable K+: Na+ ratios through the inhibition of Na+ uptake and transport to the shoots of Jatropha curcas plants. J. Plant Nutr. Soil Sci. 2013, 176, 157–164. [Google Scholar] [CrossRef]
- Kim, B.G.; Waadt, R.; Cheong, Y.H.; Pandey, G.K.; Dominguez-Solis, J.R.; Schültke, S.; Lee, S.C.; Kudla, J.; Luan, S. The calcium sensor CBL10 mediates salt tolerance by regulating ion homeostasis in Arabidopsis. Plant J. 2007, 52, 473–484. [Google Scholar] [CrossRef]
- Krieger, A.; Weis, E. The role of calcium in the pH-dependent control of photosystem II. Photosynth. Res. 1993, 37, 117–130. [Google Scholar] [CrossRef]
- Wu, H.; Shabala, L.; Barry, K.; Zhou, M.; Shabala, S. Ability of leaf mesophyll to retain potassium correlates with salinity tolerance in wheat and barley. Physiol. Plant. 2013, 149, 515–527. [Google Scholar] [CrossRef]
- Koyro, H.-W.; Hussain, T.; Huchzermeyer, B.; Khan, M.A. Photosynthetic and growth responses of a perennial halophytic grass Panicum turgidum to increasing NaCl concentrations. Environ. Exp. Bot. 2013, 91, 22–29. [Google Scholar] [CrossRef]
- Chen, T.W.; Kahlen, K.; Stützel, H. Disentangling the contributions of osmotic and ionic effects of salinity on stomatal, mesophyll, biochemical and light limitations to photosynthesis. Plant Cell Environ. 2015, 38, 1528–1542. [Google Scholar] [CrossRef] [PubMed]
Figure 1.
Variation across the control, EC05, EC10, and EC20 treatments for growth traits (a,b), shoot and root water content (b), stomatal traits (c), and photosynthetic pigments content (d,e), as well as across the control, EC05, and EC10 treatments for mineral traits (f). Ad, adaxial stomata; Ab, abaxial stomata. The different letter indicates a significant difference and ‘ns’ indicates no difference in salt treatments at p < 0.05, based on the Tukey–Kramer HSD method. The standard deviations are shown by the error bars.

Figure 2.
Variation in growth traits and shoot water content (a–e), stomatal (f), and chlorophyll (g,h) traits of 20 genotypes in control and saline treatments. The saline treatment includes combined EC10 and EC20 treatments for most growth (a,b,d) and all stomatal traits and only EC20 treatment for the plant height, shoot water, and chlorophyll traits. ‘A and K’ denote selections from cultivars Alamo and Kanlow; ST, salt-tolerant check EG1104-02; SS, salt-sensitive check PI 315723-1. *, **, and *** indicate significant differences of each of the genotypes in control versus salt treatments at p < 0.05, p < 0.01, and p < 0.001, respectively, based on a pairwise t-test.

Figure 3.
Variation in mineral composition traits (a–d) of 20 genotypes in control and saline (EC10) treatments. The saline treatment includes only EC10 treatment for the mineral traits. ‘A and K’ denote selections from cultivars Alamo and Kanlow; ST, salt-tolerant check EG1104-02; SS, salt-sensitive check PI 315723-1. *, ** and *** indicate significant differences of each of the genotypes in control versus salt treatments at p < 0.05, p < 0.01, and p < 0.001, respectively, based on a pairwise t-test.

Figure 4.
Correlation between growth, shoot water content, stomatal, photosynthetic, and mineral traits across 20 switchgrass genotypes, evaluated under control and saline treatments (a–h). The saline treatment includes combined EC10 and EC20 treatments for shoot biomass, the ratio of the shoot and root biomass, stem diameter, adaxial stomata width, adaxial stomata area, and abaxial stomata width, with only the EC20 treatment for shoot water and chlorophyll a and only the EC10 treatment for Mg2+ and Ca2+. * and *** indicate correlation coefficient (r) values significant at p < 0.05 and p < 0.001 levels of significance.

Figure 5.
Amount of minerals leached in control, EC05, EC10, and EC20 treatments in 7, 21, and 28 days after the experiment (DAE) in a greenhouse.
Figure 5.
Amount of minerals leached in control, EC05, EC10, and EC20 treatments in 7, 21, and 28 days after the experiment (DAE) in a greenhouse.


Table 1.
Eighteen switchgrass genotypes, along with two checks, screened for salt tolerance in the greenhouse at the University of Tennessee, Knoxville.
Table 1.
Eighteen switchgrass genotypes, along with two checks, screened for salt tolerance in the greenhouse at the University of Tennessee, Knoxville.
| Source | Genotype |
|---|---|
| Alamo (A) a | 11A-88, 12A-213, 12A-221, 12A-227, 12A-251, 12A-259, 12A-261, 12A-263, TN13004-08 (A), TN13006-04 (A) |
| Kanlow (K) b | 12K-216, 12K-217, 12K-220, 12K-247, 12K-35, 12K-245, 11K-233, TN13009-08 (K) |
| Salt tolerant check (ST) | EG1104-02 |
| Salt sensitive check (SS) | PI 315723-1 |
a A denotes single plant selection from cultivar Alamo; b K denotes single plant selection from cultivar Kanlow; Alamo and Kanlow were received from USDA GRIN. Salt tolerant and sensitive checks were obtained from Nayak et al. [24].
Table 2.
Sources of variation (SOV) and F ratios of growth traits, shoot and root water content, stomatal traits, photosynthetic pigments content, and mineral traits, evaluated across the salt treatments a in a greenhouse environment.
Table 2.
Sources of variation (SOV) and F ratios of growth traits, shoot and root water content, stomatal traits, photosynthetic pigments content, and mineral traits, evaluated across the salt treatments a in a greenhouse environment.
| SOV | df b | F Ratios | |||||||||
|---|---|---|---|---|---|---|---|---|---|---|---|
| Shoot Biomass | Root Biomass | Shoot/Root Biomass | Shoot Water c | Root Water d | Stem Diameter | Plant Height | Leaf Area | Adaxial Stomata Density | Adaxial Stomata Length | ||
| Genotype (G) | 19 | 5.46 *** | 7.68 *** | 10.27 *** | 5.65 *** | 3.20 *** | 2.32 ** | 1.78 * | 2.15 ** | 2.35 ** | 1.10 |
| Salt Treatment (SaTr) | 3 | 5.53 ** | 5.43 ** | 38.81 *** | 5.08 ** | 1.83 | 4.30 ** | 4.68 ** | 1.07 | 3.29 * | 2.97 * |
| G × SaTr | 57 | 1.50 * | 1.40 | 2.99 *** | 1.13 | 0.70 | 1.87 ** | 1.50 * | 1.02 | 1.02 | 1.22 |
| Adaxial stomata width | Adaxial stomata area | Abaxial stomata density | Abaxial stomata length | Abaxial stomata width | Abaxial stomata area | Chl § a | Chl b | Total Chl | Car † | ||
| G | 19 | 2.24 ** | 1.56 | 1.89 * | 2.58 *** | 2.79 *** | 2.95 *** | 4.42 *** | 4.40 *** | 4.42 *** | 4.76 *** |
| SaTr | 3 | 8.32 *** | 6.61 *** | 1.20 | 2.59 | 12.18 *** | 5.77 ** | 4.81 ** | 3.31 * | 3.47 * | 4.48 ** |
| G × SaTr | 57 | 0.87 | 0.96 | 1.41 | 0.67 | 1.35 | 0.94 | 1.08 | 1.04 | 1.08 | 0.99 |
| Na+ | K+ | Mg2+ | Ca2+ | Na+/K+ ratio | Na+/Mg2+ ratio | ||||||
| G | 19 | 6.42 *** | 4.65 *** | 9.93 *** | 6.64 *** | 3.69 *** | 3.74 *** | ||||
| SaTr | 2 | 59.84 *** | 16.99 *** | 64.68 *** | 38.29 *** | 33.31 *** | 23.26 *** | ||||
| G × SaTr | 38 | 4.60 *** | 2.68 *** | 6.47 *** | 3.93 *** | 1.26 | 0.81 | ||||
a control, EC05, EC10, and EC20 treatments for growth traits, shoot and root water content, stomatal traits, and photosynthetic pigments content; control, EC05, and EC10 treatments for mineral traits; b df, degree of freedom; c shoot water, the moisture content of aboveground biomass at harvest; d root water, the moisture content of belowground biomass at harvest; § chlorophyll content; † carotenoid content. * p < 0.05, ** p < 0.01, and *** p < 0.001 level of significance, respectively.
Publisher’s Note: MDPI stays neutral with regard to jurisdictional claims in published maps and institutional affiliations. |
© 2022 by the authors. Licensee MDPI, Basel, Switzerland. This article is an open access article distributed under the terms and conditions of the Creative Commons Attribution (CC BY) license (https://creativecommons.org/licenses/by/4.0/).
Share and Cite
MDPI and ACS Style
Shrestha, S.L.; Sams, C.; Allen, F. Genotypic Variation for Salt Tolerance within and between ‘Alamo’ and ‘Kanlow’ Switchgrass (Panicum virgatum L.) Cultivars. Agronomy 2022, 12, 973. https://0-doi-org.brum.beds.ac.uk/10.3390/agronomy12040973
AMA Style
Shrestha SL, Sams C, Allen F. Genotypic Variation for Salt Tolerance within and between ‘Alamo’ and ‘Kanlow’ Switchgrass (Panicum virgatum L.) Cultivars. Agronomy. 2022; 12(4):973. https://0-doi-org.brum.beds.ac.uk/10.3390/agronomy12040973
Chicago/Turabian StyleShrestha, Surya L., Carl Sams, and Fred Allen. 2022. "Genotypic Variation for Salt Tolerance within and between ‘Alamo’ and ‘Kanlow’ Switchgrass (Panicum virgatum L.) Cultivars" Agronomy 12, no. 4: 973. https://0-doi-org.brum.beds.ac.uk/10.3390/agronomy12040973
Note that from the first issue of 2016, this journal uses article numbers instead of page numbers. See further details here.