Article

Overexpression of CgbHLH001, a Positive Regulator to Adversity, Enhances the Photosynthetic Capacity of Maize Seedlings under Drought Stress

1
Xinjiang Key Laboratory of Biological Resources and Genetic Engineering, College of Life Science and Technology, Xinjiang University, Urumqi 830017, China
2
JoinHope Seed Industry Co., Ltd., Changji 831199, China
*
Authors to whom correspondence should be addressed.
Submission received: 9 April 2022 / Revised: 7 May 2022 / Accepted: 9 May 2022 / Published: 10 May 2022
(This article belongs to the Topic Plant Breeding, Genetics and Genomics)

Abstract

:
Drought is a major environmental factor limiting crop productivity. Photosynthesis is very sensitive to drought. Basic helix-loop-helix (bHLH) transcription factors (TFs) are important in response to abiotic stress. However, their functions remain unclear. Herein, we generated CgbHLH001 (a TF gene from halophyte Chenopodium glaucum)-overexpressed (OE) and ZmbHLH-RNA interference (Ri) maize lines to investigate their photosynthesis-associated indexes under drought conditions. The photosynthetic capacity was increased in OE lines under drought stress compared with that in non-transgenic (NT) and Ri plants. A greater root biomass, higher root/shoot ratio, and a relatively lower leaf area reduction ratio was also observed in OE plants. Compared to NT and Ri plants, OE lines showed a higher chlorophyll content and net photosynthetic rate and better chlorophyll fluorescence parameters under drought conditions. Fructose and glucose contents were also significantly elevated in OE lines. Moreover, under stressful conditions, CgbHLH001 overexpression increased the expression of genes related to photosynthesis. Transcriptomic data showed that many differentially expressed genes were enriched in the photosynthetic system in OE and Ri plants under drought conditions and were prone to being upregulated under drought stress in OE plants. Therefore, our results suggest that CgbHLH001 improves photosynthetic efficiency under drought stress and confers drought tolerance in maize seedlings.

1. Introduction

Due to the groundwater depletion and global warming, drought stress has become increasingly prevalent and severe worldwide [1], which has a large effect on agricultural production [2]. So far, more than 1/5 of tropical and subtropical areas suitable for maize growth are suffering from drought stress [3], which can cause approximately a 20–30% reduction in the annual maize yield [4]. To cope with drought, plants have evolved multiple elaborate mechanisms at the morphological, physiological, biochemical, and molecular biological levels [5]. Many transcription factors (TFs) have been reported with functions in improvement of stress tolerance in crops [6]; among them, the basic helix-loop-helix (bHLH) TF can confer abiotic stress tolerance in transgenic plants [7,8]. However, the underlying mechanism still needs to be elucidated.
Maize (Zea mays L.) is grown worldwide as an important cereal and industrial crop and is expected to be the most abundant cereal in the future because of its high yielding potential [9]. Maize is a typical C4 plant of the NADP-ME (nicotinamide adenine dinucleotide phosphate-malic enzyme) type [10]. Compared with the C3 pathway, the C4 photosynthetic pathway can suppress the oxygenase activity of Rubisco, thereby reducing the photorespiration process and increasing carbon assimilation efficiency [11,12]. Therefore, C4 plants achieve higher production by preventing the loss of approximately 40% of their efficiency consumed by photorespiration [13]. Furthermore, when adapting to dry climates, C4 plants outperform C3 plants because they utilize less water per fixed CO2 [14]. However, maize is sensitive to drought stress, particularly during the seedling stage [15,16], which may result in poor seedling establishment and retarded plant development, eventually leading to significant yield losses [17,18].
Photosynthesis is one of the most important metabolic processes which generates more than 90% of crop biomass [19]. It also plays a key role in stabilizing plant performance under drought stress [20]. Photosynthetic efficiency and gas exchange are sensitive to water deficit [21]. When plants are subjected to moderate drought stress, stomatal closure is a major limitation to photosynthesis [22]. However, stomatal closure can mitigate the excessive reduction in water potential in the crop [23]. Therefore, maintaining a relatively higher photosynthetic capability (or moderate stomatal aperture) may balance between plant drought tolerance and yield [24,25]. For example, overexpression of heat shock transcription factor A9 (encoded by HSFA9), protein D1 of photosystem II reaction center (encoded by ZmpsbA), nuclear factor Y subunit B7 (encoded by PdNF-YB7) in Arabidopsis, and an A. thaliana B-box gene (BBX29) in sugarcane enhance water deficit tolerance by protecting or increasing photosynthetic capabilities [26,27,28,29]. However, responses of the photosynthetic pathway to drought stress are complicated, and different physiological, biochemical, and molecular processes remain to be clarified.
In our previous study, we found that overexpression of CgbHLH001 (a bHLH transcription factor from an annual halophyte Chenopodium glaucum) in maize improved drought tolerance at the seedling stage, and CgbHLH001-overexpressed transgenic lines showed no growth penalty in field cultivation [30]. To further explore the performance of CgbHLH001 overexpression in photosynthesis in maize seedlings, we investigated the following aspects: (1) The photosynthetic capabilities in CgbHLH001-overexpressed maize lines under drought conditions and (2) effects of CgbHLH001 overexpression on photosynthesis-related gene expression based on transcriptomic data. These explorations may aid in our understanding of functions of CgbHLH001 TF in photosynthesis and drought tolerance.

2. Materials and Methods

2.1. Cultivation of Maize Transgenic Lines and Treatments

The CgbHLH001 open reading frame (792 bp; GenBank accession no. MT797813) and predicted RNA interference fragment (318 bp) were cloned into the plant expression vector pCAMBIA3301. Transgenic maize lines were generated by the Agrobacterium-mediated transformation method in our previous work [30]. The CgbHLH001-overexpressed (OE) lines were selected with a high expression level of CgbHLH001, and the bHLH-RNA interference (Ri) lines with a low expression level of ZmbHLHs (having higher similarity with CgbHLH001). Two CgbHLH001-overexpressed maize lines (OE3 and OE12) and two bHLH-RNA interference maize lines (Ri33 and Ri37) of the T3 generation and non-transgenic (NT) maize cultivar Z31 were used in this study. Mature intact seeds were sown in pots (7 × 7 × 7.5 cm, one seed in each pot) containing soil mix (peat soil: vermiculite, 2:1 (v/v)) and cultivated indoors (26–28 °C, 25–40% relative humidity, 14 h/10 h (day/night) photoperiod with 200–220 μmol m−2s−1 light intensity) and watered to field capacity with 1/2 Hoagland solution at a 3-day interval throughout the growth period unless otherwise specified. When the third leaf (from the plant base) was fully expanded, uniform plants were used for natural drought and plant growth tests; when the fourth leaf was fully expanded, other tests were performed. Before assays could be done, all transgenic plants were screened using PCR. A completely randomized design was used in the experiment with two treatments: drought and control. These treatments were carried out indoors (as described above). Three replicates were used for each treatment. Ten plants at least in each transgenic line and NT were arranged for every replicate.
For plant growth under natural drought, maize seedlings with a fully expanded third leaf (about 15-day-old) were exposed to natural drought conditions (withholding water) for 8 days and sampled to determine the biomass, and the fourth leaf was used to measure the leaf area. Fresh weight of shoots was measured immediately after cutting the aboveground plant parts, and that of roots was determined after being washed and blotted dry. Shoots and roots were dried in a forced-air drying oven at 105 °C for 20 min and then incubated at 70 °C for four days to obtain the dry weight. Root/shoot ratio = root fresh weight/shoot fresh weight. Leaf area was measured as follows: leaf area = leaf length × maximum leaf width × 0.75 [31]. Plant height was measured from the soil surface to the collar of the first fully expanded leaf at the top of the maize seedlings.
For analyses of other physiological parameters and photosynthesis responsive gene expression, maize seedlings (about 24-day-old) were treated with 1/2 Hoagland solution containing 15% (w/v) polyethylene glycol (PEG) 6000 (Beijing Solarbio Science & Technology Co., Ltd., Beijing, China) for 48 h and normally-watered seedlings were used as the control. The first fully expanded leaves from the top of seedlings were sampled and immediately frozen in liquid nitrogen for further analysis.

2.2. Total RNA Isolation from Maize Seedlings

Total RNA was isolated with the first fully expanded leaves from the top of the seedlings (0.06 g) using a Plant RNA Kit (Cat. R6827; OMEGA, NY, USA) and following the manufacturer’s instructions. After digestion with RNase-free DNase I (Takara, Shiga, Japan), RNA integrity was checked using agarose gel electrophoresis and concentrations were determined using a Nanodrop® ND-1000 UV spectrophotometer (Thermo Fisher Scientific, Waltham, MA, USA).

2.3. RNA-Sequencing Analysis

Young leaves of 24-day-old maize seedlings were used for RNA sequencing (RNA-seq). High-quality RNA was used (RNA integrity number (RIN) ≥ 8.0, OD260/280 ≥ 1.9 and OD260/230 ≥ 1.5). RNA-seq was performed using the Illumina HiSeq 2000 platform by Biomarker Technologies Co., Ltd. (Beijing, China). Three independent biological replicates containing eight seedlings each were sequenced. After filtering the raw data obtained via sequencing using FastQC v0.10.1 software (Baraham Institute, Cambridge, UK) (http://www.bioinformatics.bbsrc.ac.uk/projects/fastqc/) (accessed on 26 January 2022), all clean reads were aligned to the maize inbred B73 reference genome (Zm-B73-REFERENCE-NAM-5.0, https://0-www-ncbi-nlm-nih-gov.brum.beds.ac.uk/assembly/GCF_902167145.1) (accessed on 18 February 2022) using Hisat2 v2.0.4 software (JHU, Baltimore, USA) (http://0-ccb-jhu-edu.brum.beds.ac.uk/software/hisat2/index.shtml) (accessed on 18 February 2022). Then, mapped reads were assembled and merged using StringTie v1.3.4d software (JHU, Baltimore, MD, USA) (https://0-ccb-jhu-edu.brum.beds.ac.uk/software/stringtie/index.shtml) (accessed on 18 February 2022). Differentially expressed genes (DEGs) were identified using DEseq software (false discovery rate (FDR) <0.05 and fold change ≥1.5) [32]. Gene Ontology (GO) enrichment analysis of DEGs was implemented via the GOseq R packages v3.10.1 based on Wallenius non-central hyper-geometric distribution. Gene function was annotated using six primary databases: National Center for Biotechnology Information (NCBI), non-redundant protein sequences (NR), Kyoto Encyclopedia of Genes and Genomes (KEGG), manually annotated and commented protein sequence (Swiss-Prot), protein family (Pfam) and Gene Ontology (GO). Raw data in the present study were submitted to NCBI (http://0-www-ncbi-nlm-nih-gov.brum.beds.ac.uk/Traces/sra) (accessed on 28 April 2022) and the BioProject accession number is PRJNA833573.

2.4. Quantitative Real-Time Polymerase Chain Reaction (qRT-PCR) Analysis

Total RNA (2.0 μg) was reversely transcribed into cDNA using M-MLV (Cat. 2641A, Takara) according to the manufacturer’s instructions. qRT-PCR analyses were conducted using a PerfectStartTM Green qPCR SuperMix kit (TransGen, Beijing, China) on the QuantStudio Real-Time PCR System (ABI, Los Angeles, CA, USA). Primers used are listed in Table S1. The maize β-actin gene (J01238.1) was used to calibrate the data as an internal reference. PCR consisted of an initial denaturation step at 95 °C for 2 min, followed by 40 cycles of 95 °C for 15 s and 60 °C for 30 s. The quantification method (2−∆∆Ct) [33] was used to calculate the relative expression levels, and variations were estimated using three biological replicates with two technical replicates each.

2.5. Measurement of Physiological Parameters

2.5.1. Determination of Photosynthetic Pigments

Young leaves (0.15 g) of 24-day-old maize seedlings were treated using 95% ethanol, according to the method described by Djangaopa et al. [34]. The absorbance of the supernatant (200 µL) was recorded at 649 and 665 nm against 95% (v/v) ethanol as a blank to determine the chlorophyll a (Chl a) and chlorophyll b (Chl b) contents. The chlorophyll relative value (SPAD) was measured using a hand-held SPAD (soil plant analyzer development) −502 Plus chlorophyll meter (Konica Minolta Inc., Tokyo, Japan).

2.5.2. Measurements of Gas Exchange Parameters and Chlorophyll Fluorescence

Gas exchange parameters, such as net photosynthetic rate (Pn), transpiration rate (Tr), stomatal conductance (Gs), and internal CO2 concentration (Ci), were measured using a portable LI-6400XT gas analyzer equipped with a fluorescence chamber (LI-CoR Inc., Lincoln, NE, USA). Measurements were performed in the middle part of the youngest leaves (first fully expanded leaves from the top of plants) by avoiding the main leaf vein from 10:00 to 13:30 local time (Sixth East zone). The device parameters were set as airflow 400 μmol s−1, photosynthetically active radiation 1000 μmol photons m−2 s−1, the ambient temperature was 27 °C, and the relative humidity was 30%. After the leaves were acclimated to these conditions and reached a steady-state, gas exchange parameters were measured. Water use efficiency (WUE) was calculated as the ratio of Pn to Tr. Chlorophyll fluorescence was monitored using the LI-6400XT photosynthesis system (LI-COR, Biosciences, Lincoln, NE, USA) following the manufacturer’s protocol. Seedlings were kept in the dark for more than 40 min to determine minimum (F0) and maximum (Fm) fluorescence. The effective PSII quantum yield (ΦPSII) was calculated according to the formula ΦPSII = (Fm′ − Ft)/Fm′ [35], where Fm′ represents the maximal fluorescence yield in a pulse of saturating light and Ft is defined as the measured fluorescence yield at the given time. The electron transport rate (ETR) of PSII was determined using a modified method described by Schreiber et al. [36]: ETR = PPFD × ΦPSII × 0.5 × 0.85, where PPFD is defined as the photosynthetic photon flux density. Photochemical quenching (qP) and non-photochemical quenching (NPQ) were calculated according to Sujatha et al. [37] and Schreiber [38], respectively: qP = (Fm′ − Ft)/(Fm′ − F0) and NPQ = (Fm − Fm′)/Fm′.

2.5.3. Carbohydrate Fractions

The first fully expanded leaves (0.1 g) from the top of plants were sampled and ground into homogenates in extraction buffer under ice-cold conditions, which were then measured according to the manufacturer’s protocols of the assay kits (Cat. BC0700 (starch), BC2460 (sucrose), BC2450 (fructose), and BC2500 (glucose); Beijing Solarbio Science & Technology Co., Ltd., Beijing, China). Absorbances of starch, sucrose, fructose, and glucose were measured at 620, 480, 480, and 505 nm, respectively.

2.5.4. Activity of Photosynthetic Enzymes

To determine the activity of photosynthetic enzymes ((phosphoenolpyruvate carboxylase (PEPC, EC 4.1.1.31), NADP-malic dehydrogenase (NADP-MDH, EC 1.1.1.37), NADP-malic enzyme (NADP-ME, EC 1.1.1.40), ribulose-1, 5-bisphosphate carboxylase/oxygenase (Rubisco, EC 4.1.1.39), and pyruvate orthophosphate dikinase (PPDK, EC 2.7.9.1)), the first fully expanded leaves (0.2 g) from the top of plants were homogenized using a mortar pestle under ice-cold conditions. After the homogenized slurry was centrifuged for 15 min at 8000× g, the absorbance values of the supernatant were measured to determine the activity of photosynthetic enzymes, as described by the assay kits (Cat. BC2190 (PEPCase), BC1050 (NADP-MDH), BC1120 (NADP-ME), Beijing Solarbio Science & Technology Co., Ltd.; Cat. AKPL001U-2 (RuBPCase), Beijing Boxbio Science & Technology Co., Ltd.; Cat. PPDK-2-Y (PPDK); Suzhou Comin Biotechnology Co., Ltd., Jiangsu, China). Results are expressed as unit mg−1 protein. The soluble protein content was estimated according to the Bradford method [39].

2.6. Statistical Analysis

Statistical analyses were performed using Microsoft Excel 2010 (Microsoft Corporation, Redmont, WA, USA) and SPSS 22 (SPSS Inc., Chicago, IL, USA). One-way analysis of variance was used to test the significance of main effects. Significant differences were determined using Tukey’s multiple comparison test at a significance level of 0.05.

3. Results

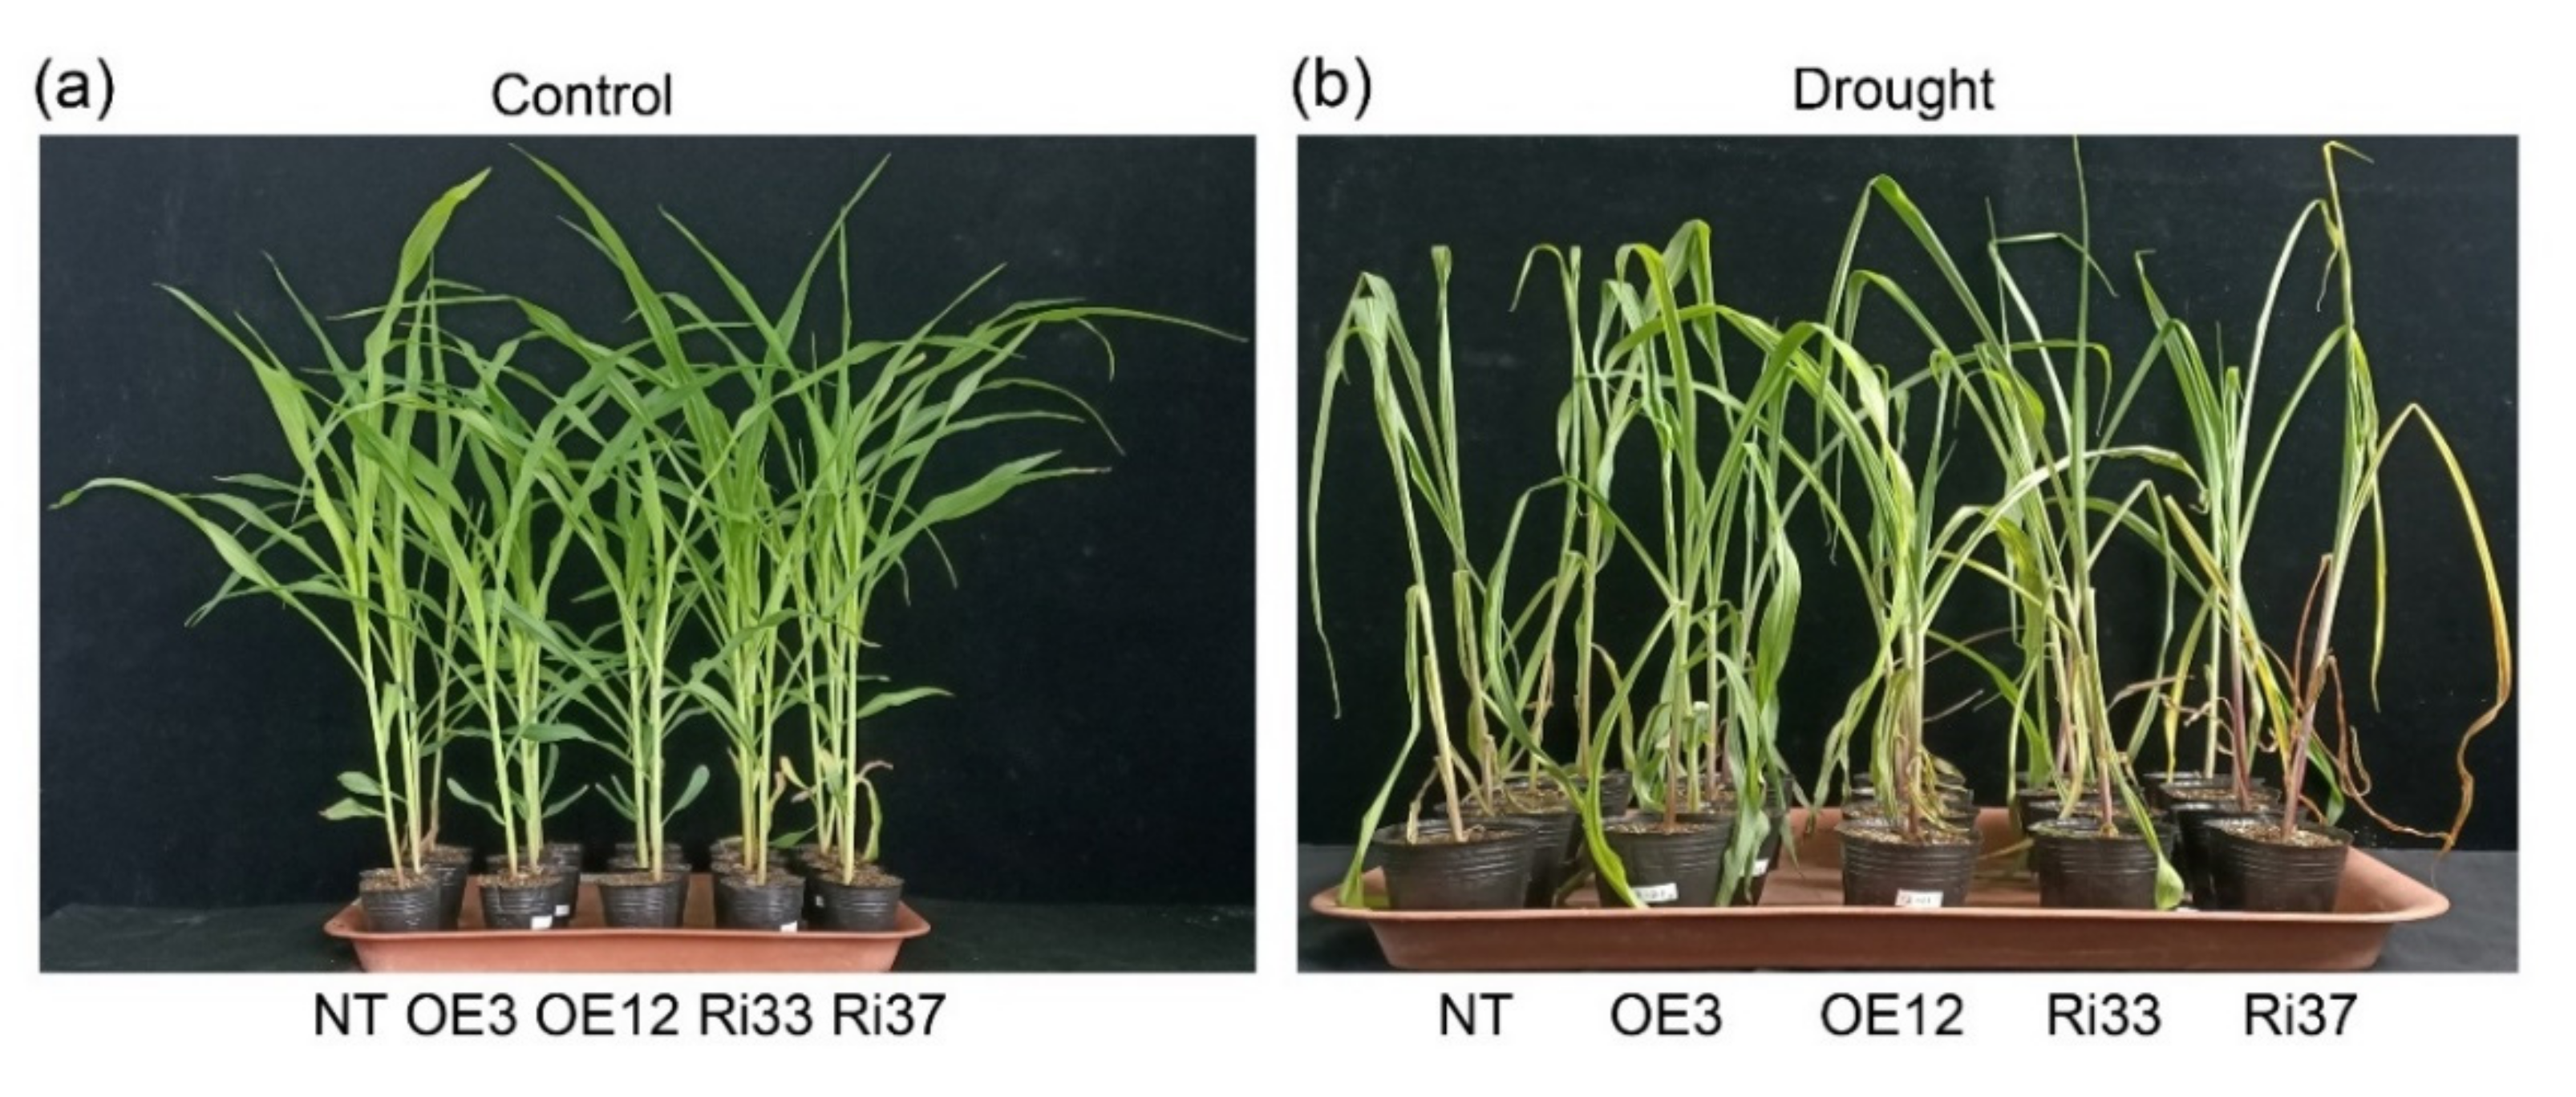
3.1. Overexpression of CgbHLH001 Increased the Root Biomass and Relieved the Reduction of Leaf Area under Drought Stress

To investigate the phenotypic traits of transgenic maize lines responding to water deficit, T3 transgenic lines and NT plants were subjected to natural drought treatment for 8 days at the three-leaf stage. Transgenic and NT plants grew normally under control conditions (Figure 1a). After withholding water for 8 days, leaves of all plants wilted; however, OE lines exhibited fewer leaf-rolling symptoms (Figure 1b). Phenotypic traits had no significant differences in the fresh and dry biomass of shoots between transgenic and NT plants under drought stress conditions (Table 1). However, the drought treatment had a significant effect on roots. Root biomass was significantly higher in OE lines than that in NT plants, and the biomass of Ri lines was similar to that of NT plants. Therefore, the root/shoot ratio was higher in OE lines. In addition, the leaf area of OE lines was significantly lower than that of NT and Ri plants, but after drought treatment, leaf areas of NT, OE3, OE12, Ri33, and Ri37 decreased by 16.15, 5.86, 8.20, 16.59, and 14.14%, respectively. Based on these results, the height of the OE lines was lower than that of NT and Ri plants, indicating that OE plants were much stronger.

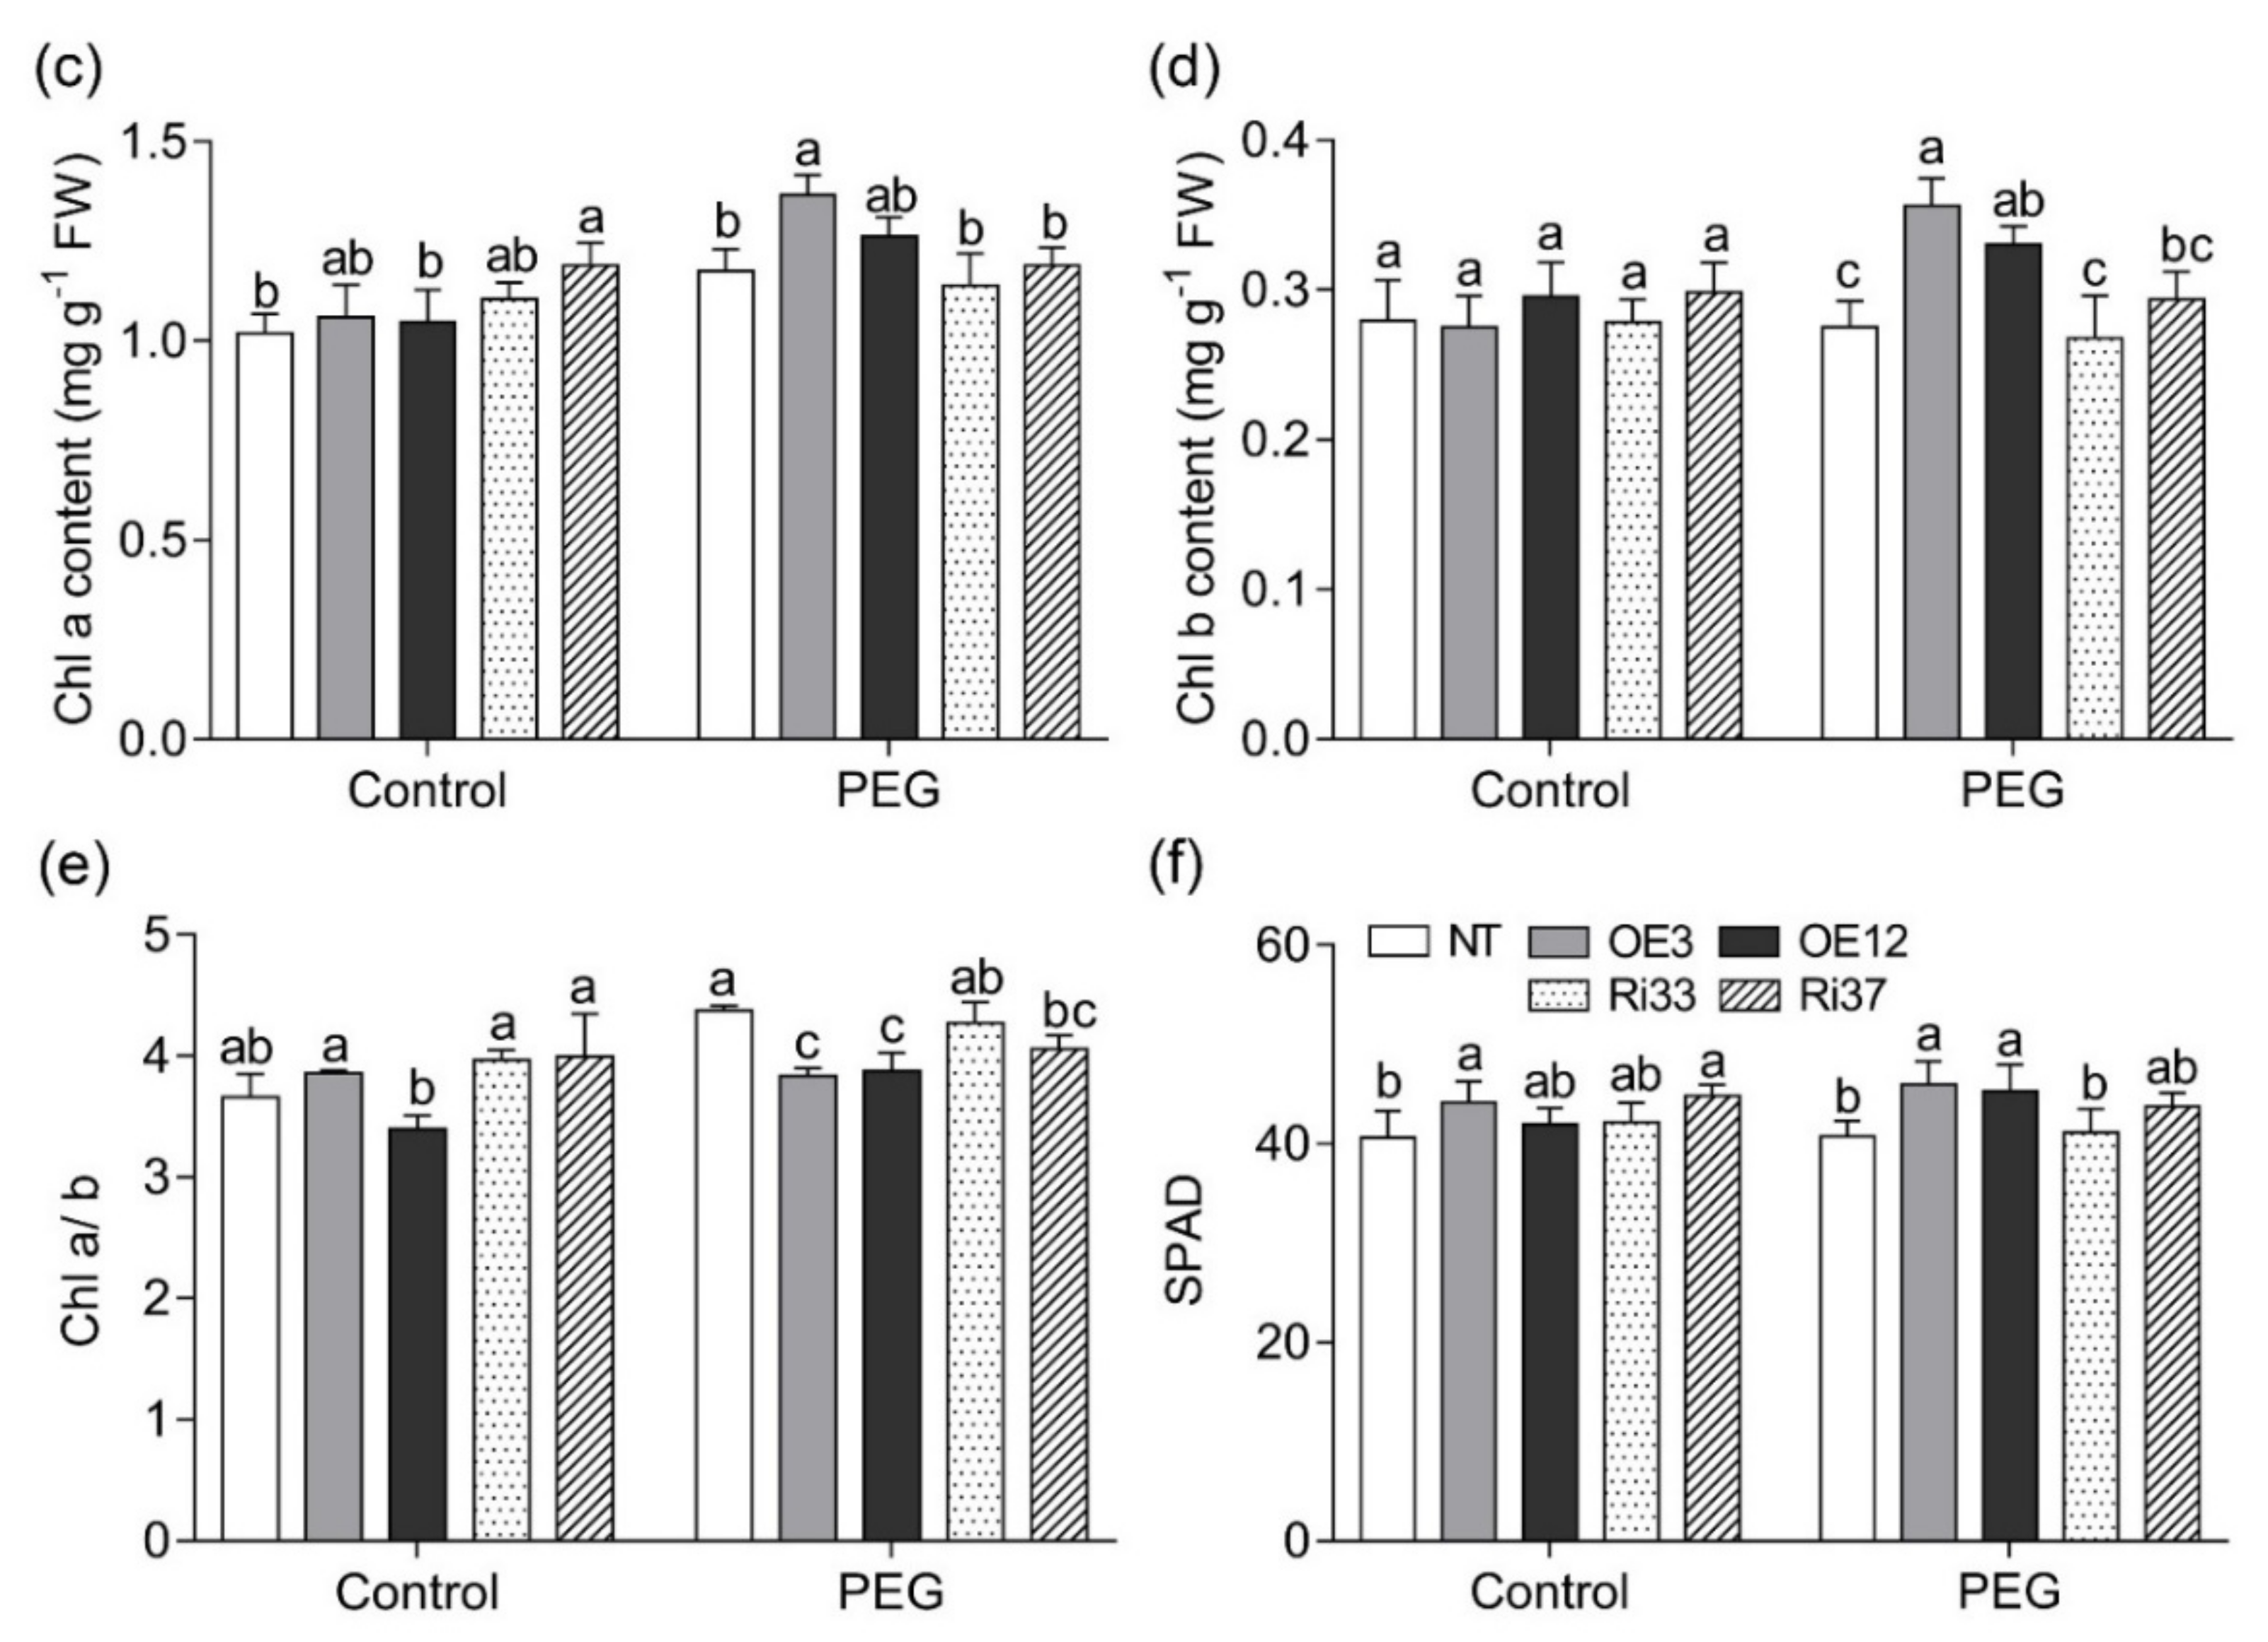
3.2. Overexpression of CgbHLH001 Increased Chlorophyll Accumulation under Drought Stress

Under non-stressed conditions, contents of Chl a, Chl b, and Chl a/b were similar in transgenic and NT lines (except for Chl a of Ri37). When subjected to short-term drought treatment, contents of Chl a and Chl b were not significantly varied between Ri and NT plants. However, OE lines exhibited higher contents than those of NT plants, especially OE3 (Figure 1c,d). In contrast, the Chl a/b ratio was significantly lower (Figure 1e). We measured SPAD values because of the positive correlation between SPAD readings and leaf chlorophyll concentrations [40]. The SPAD readings revealed a similar pattern to the chlorophyll content after drought treatment (Figure 1f).

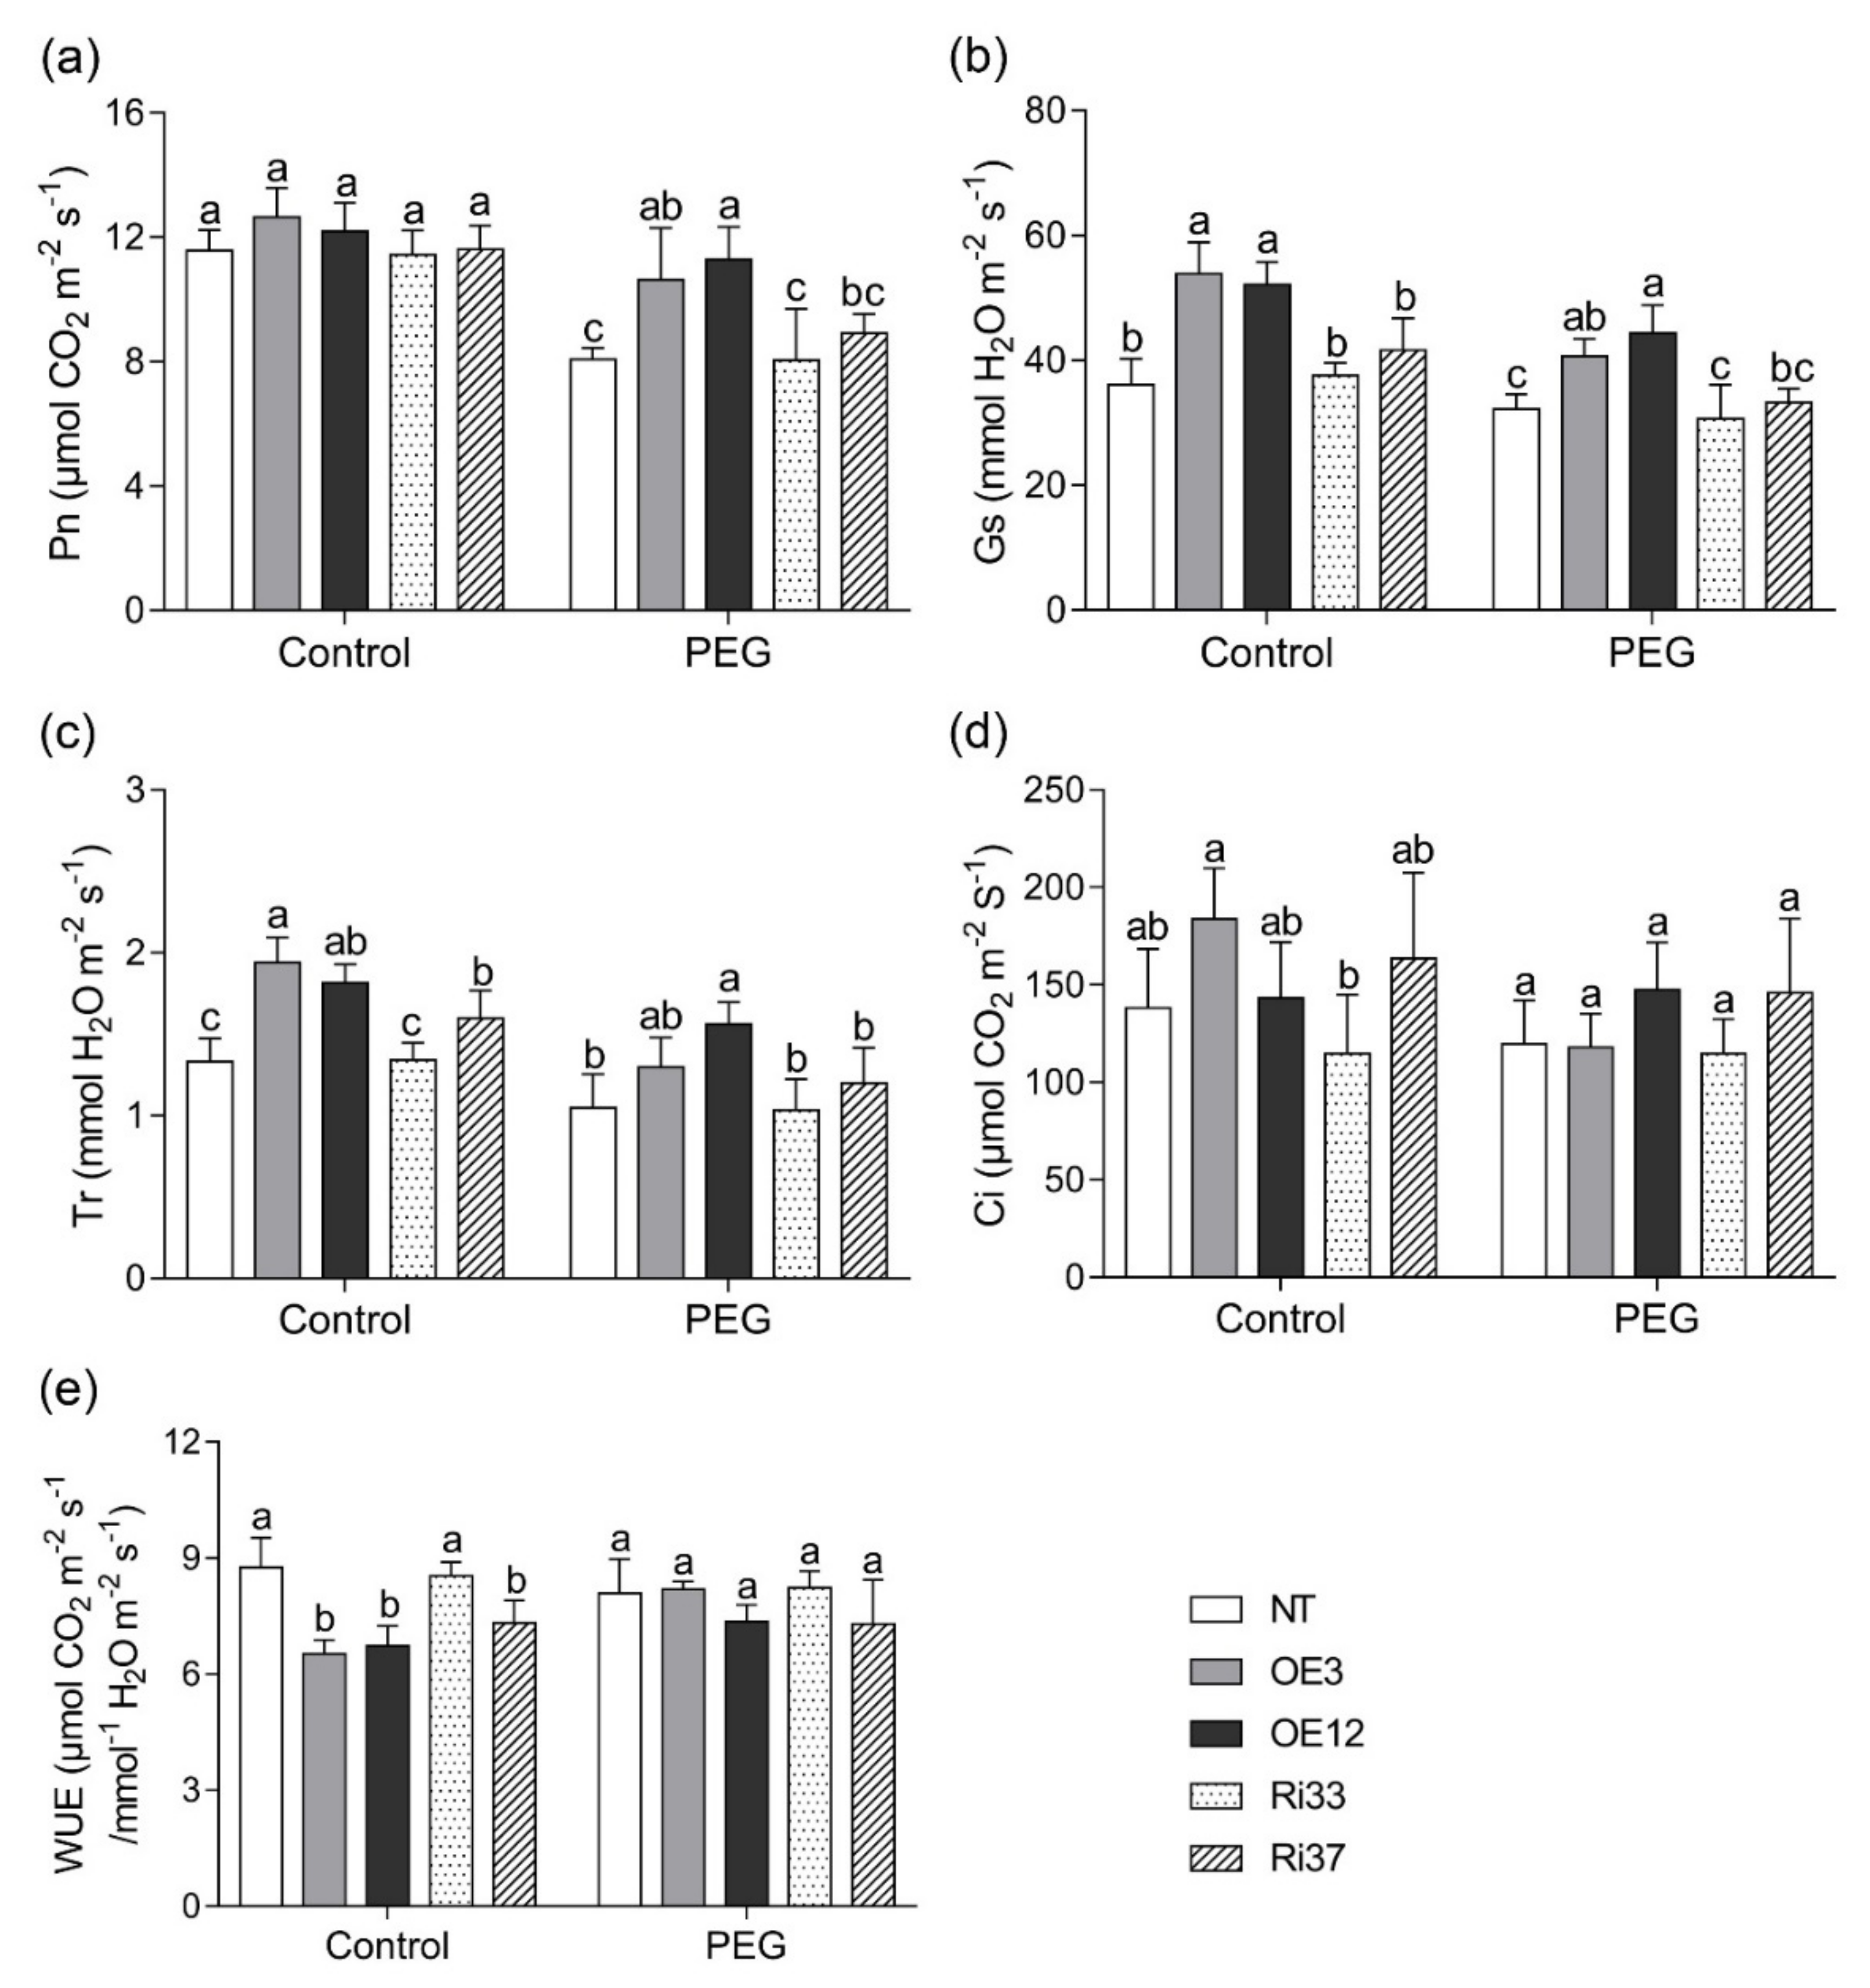
3.3. Overexpression of CgbHLH001 Promoted Photosynthetic Rate under Drought Stress

When subjected to short-term drought treatment, plants demonstrated a decrease in Pn, Gs, Tr, and Ci values. Compared with NT plants, there was no significant difference in Pn in transgenic plants under normal conditions. Under drought stress, OE lines showed a significant increase compared with that of NT and Ri plants, and no significant difference was observed between NT and Ri plants (Figure 2a). OE lines exhibited higher Gs and Tr under normal and stress conditions than those of NT plants. NT and Ri plants before or after stress treatment were not significantly varied (except for Tr in Ri37) (Figure 2b,c). There was no difference in Ci among different lines (Figure 2d). WUE was significantly lower in OE lines than in NT plants. Drought treatment increased WUE in OE lines and decreased in NT and Ri plants (Figure 2e).

3.4. Overexpression of CgbHLH001 Increased Chlorophyll Fluorescence under Drought Stress

A reduction in ΦPSII, ETR, and qP was observed under drought stress compared with those of untreated control plants. Conversely, the NPQ was increased. Under non-stressed conditions, four chlorophyll fluorescence parameters showed no significant differences between transgenic lines and NT plants and between NT and Ri plants under drought stress (Figure 3a–d). However, ΦPSII was significantly higher in OE lines than that in NT and Ri plants under drought stress (Figure 3a). ETR and qP levels were also relatively higher in OE lines than in NT plants (Figure 3b,c). NPQ was lower in OE lines than in NT plants under drought stress (Figure 3d). The values of Fv/Fm (maximum PSII quantum yield) in all plants were 0.76–0.78 regardless of treatment conditions (data not shown).

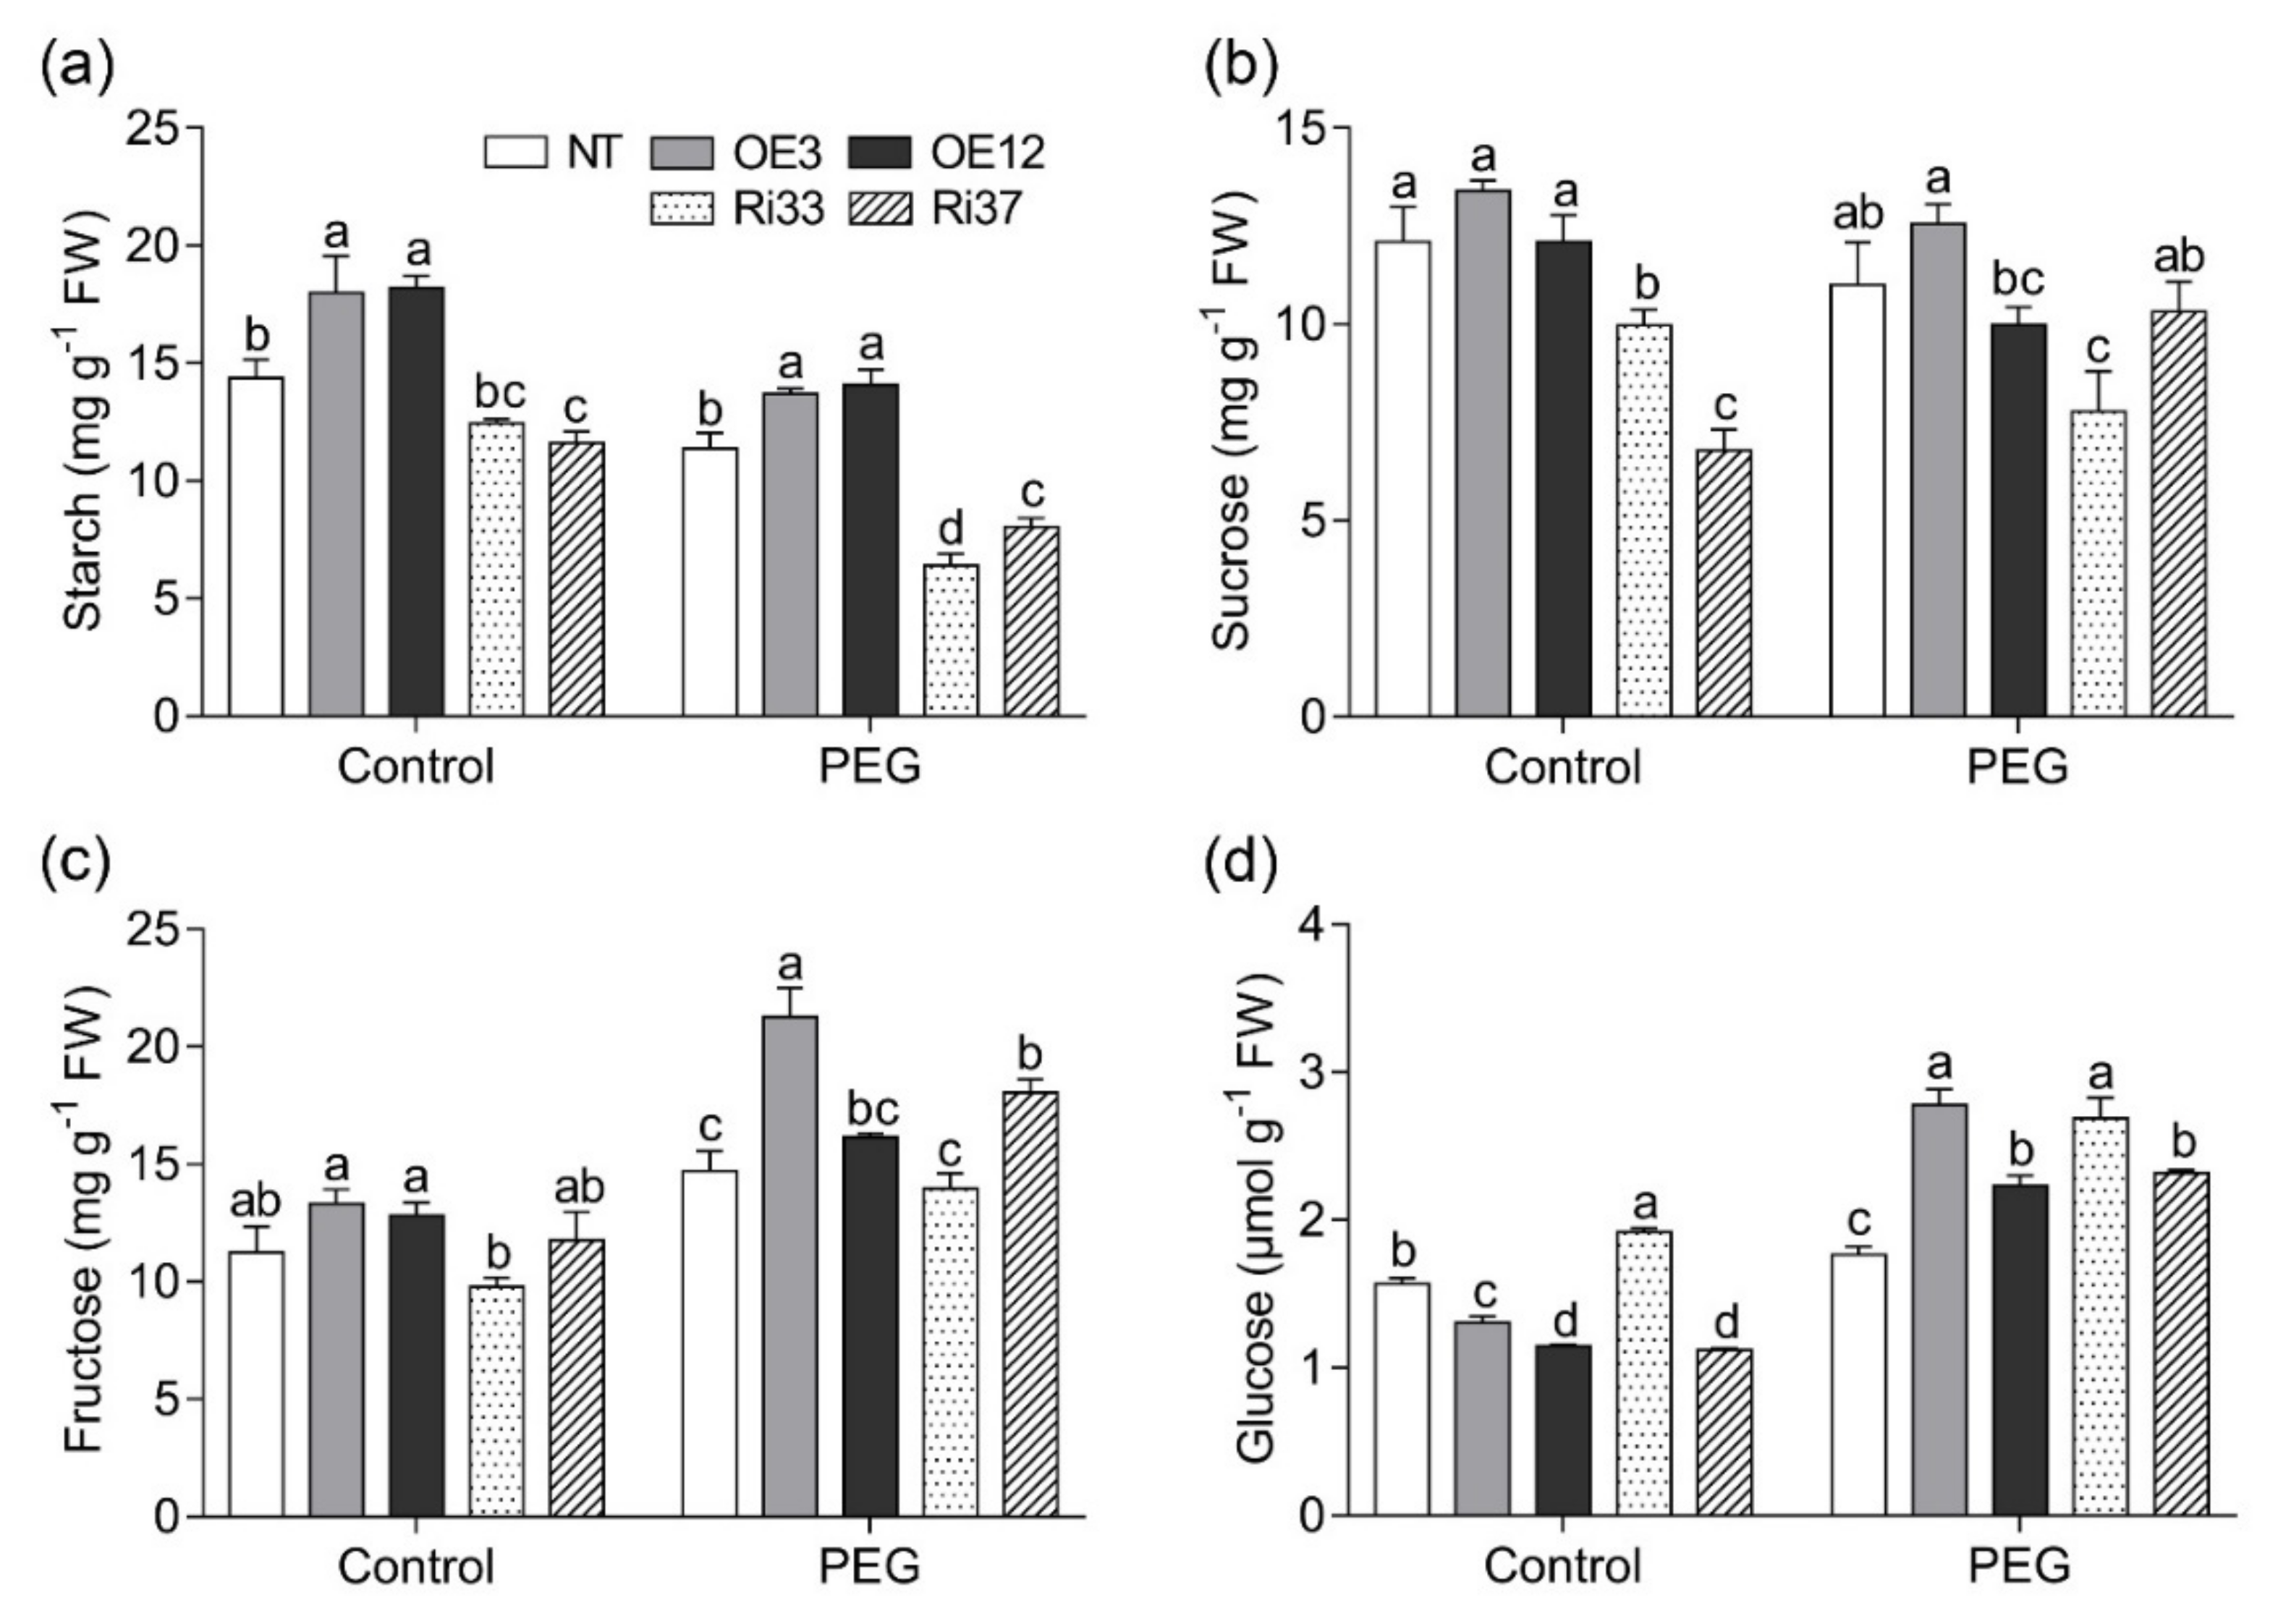
3.5. Overexpression of CgbHLH001 Positively Regulated Sugar Metabolism under Drought Stress

Under normal conditions, the starch content in OE lines was significantly higher compared with that of NT plants (Figure 4a). Conversely, glucose levels were significantly lower in OE lines (Figure 4d); however, sucrose and fructose contents were similar between two OE lines (Figure 4b,c). When subjected to PEG treatment, the starch and sucrose contents showed a similar pattern to that under control conditions (Figure 4a,b). However, the fructose and glucose levels were significantly higher in OE plants than in NT plants (except for fructose in OE12) (Figure 4c,d). Carbohydrate contents (except for glucose) in Ri33 plants were lower than those in NT plants under control and stressful conditions. However, most of the parameters in Ri37 plants were significantly lower than those in NT plants under normal conditions but increased markedly under drought stress.

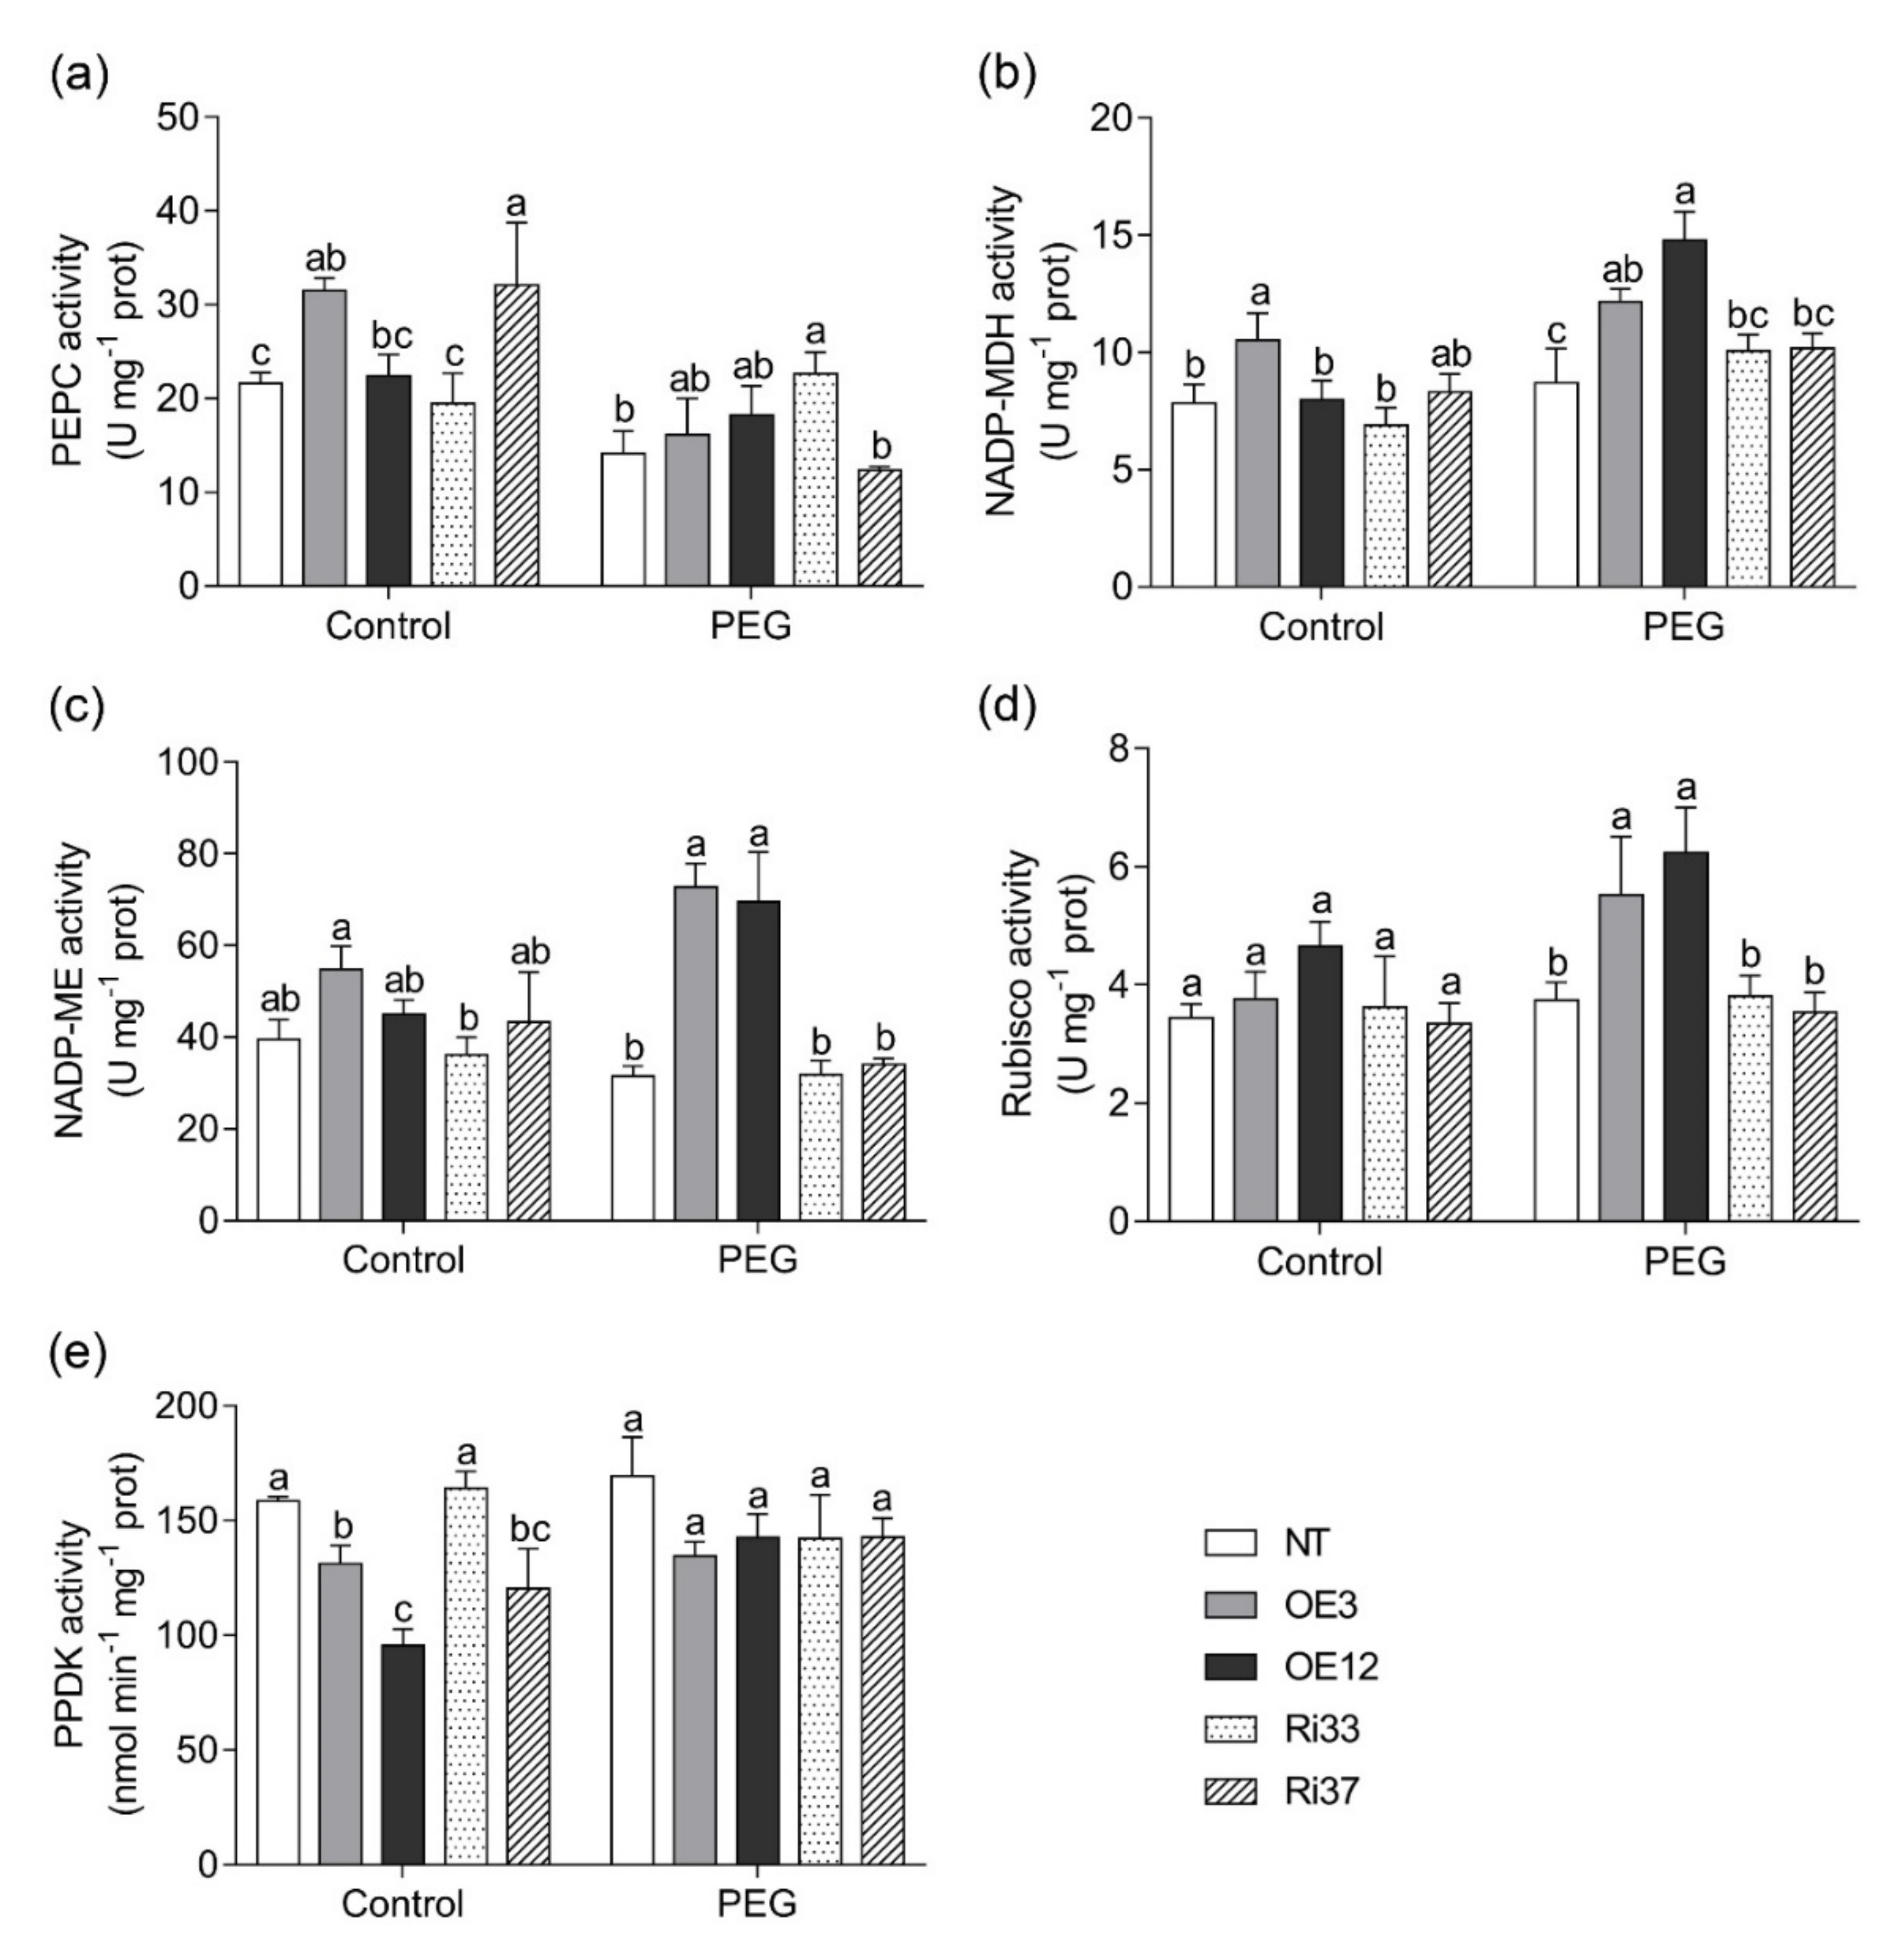
3.6. Overexpression of CgbHLH001 Increased Activities of Photosynthetic Enzymes under Drought Stress

PEPC activity was higher in OE lines than in NT plants under normal conditions or PEG treatment, although decreased upon stress (Figure 5a). NADP-MDH, NADP-ME, and Rubisco activities showed no significant difference between transgenic lines and NT plants (except for NADP-MDH in OE3) under normal conditions (Figure 5b–d). However, when subjected to short-term PEG treatment, the activity of three photosynthetic enzymes were significantly increased in OE lines compared with that of NT and Ri plants, and no significant difference was observed between NT and Ri plants (Figure 5b–d). PPDK activity was much lower in OE lines compared with that of NT plants both under normal or stress conditions, but that of OE lines showed an increase, especially OE12, after PEG treatment (Figure 5e).

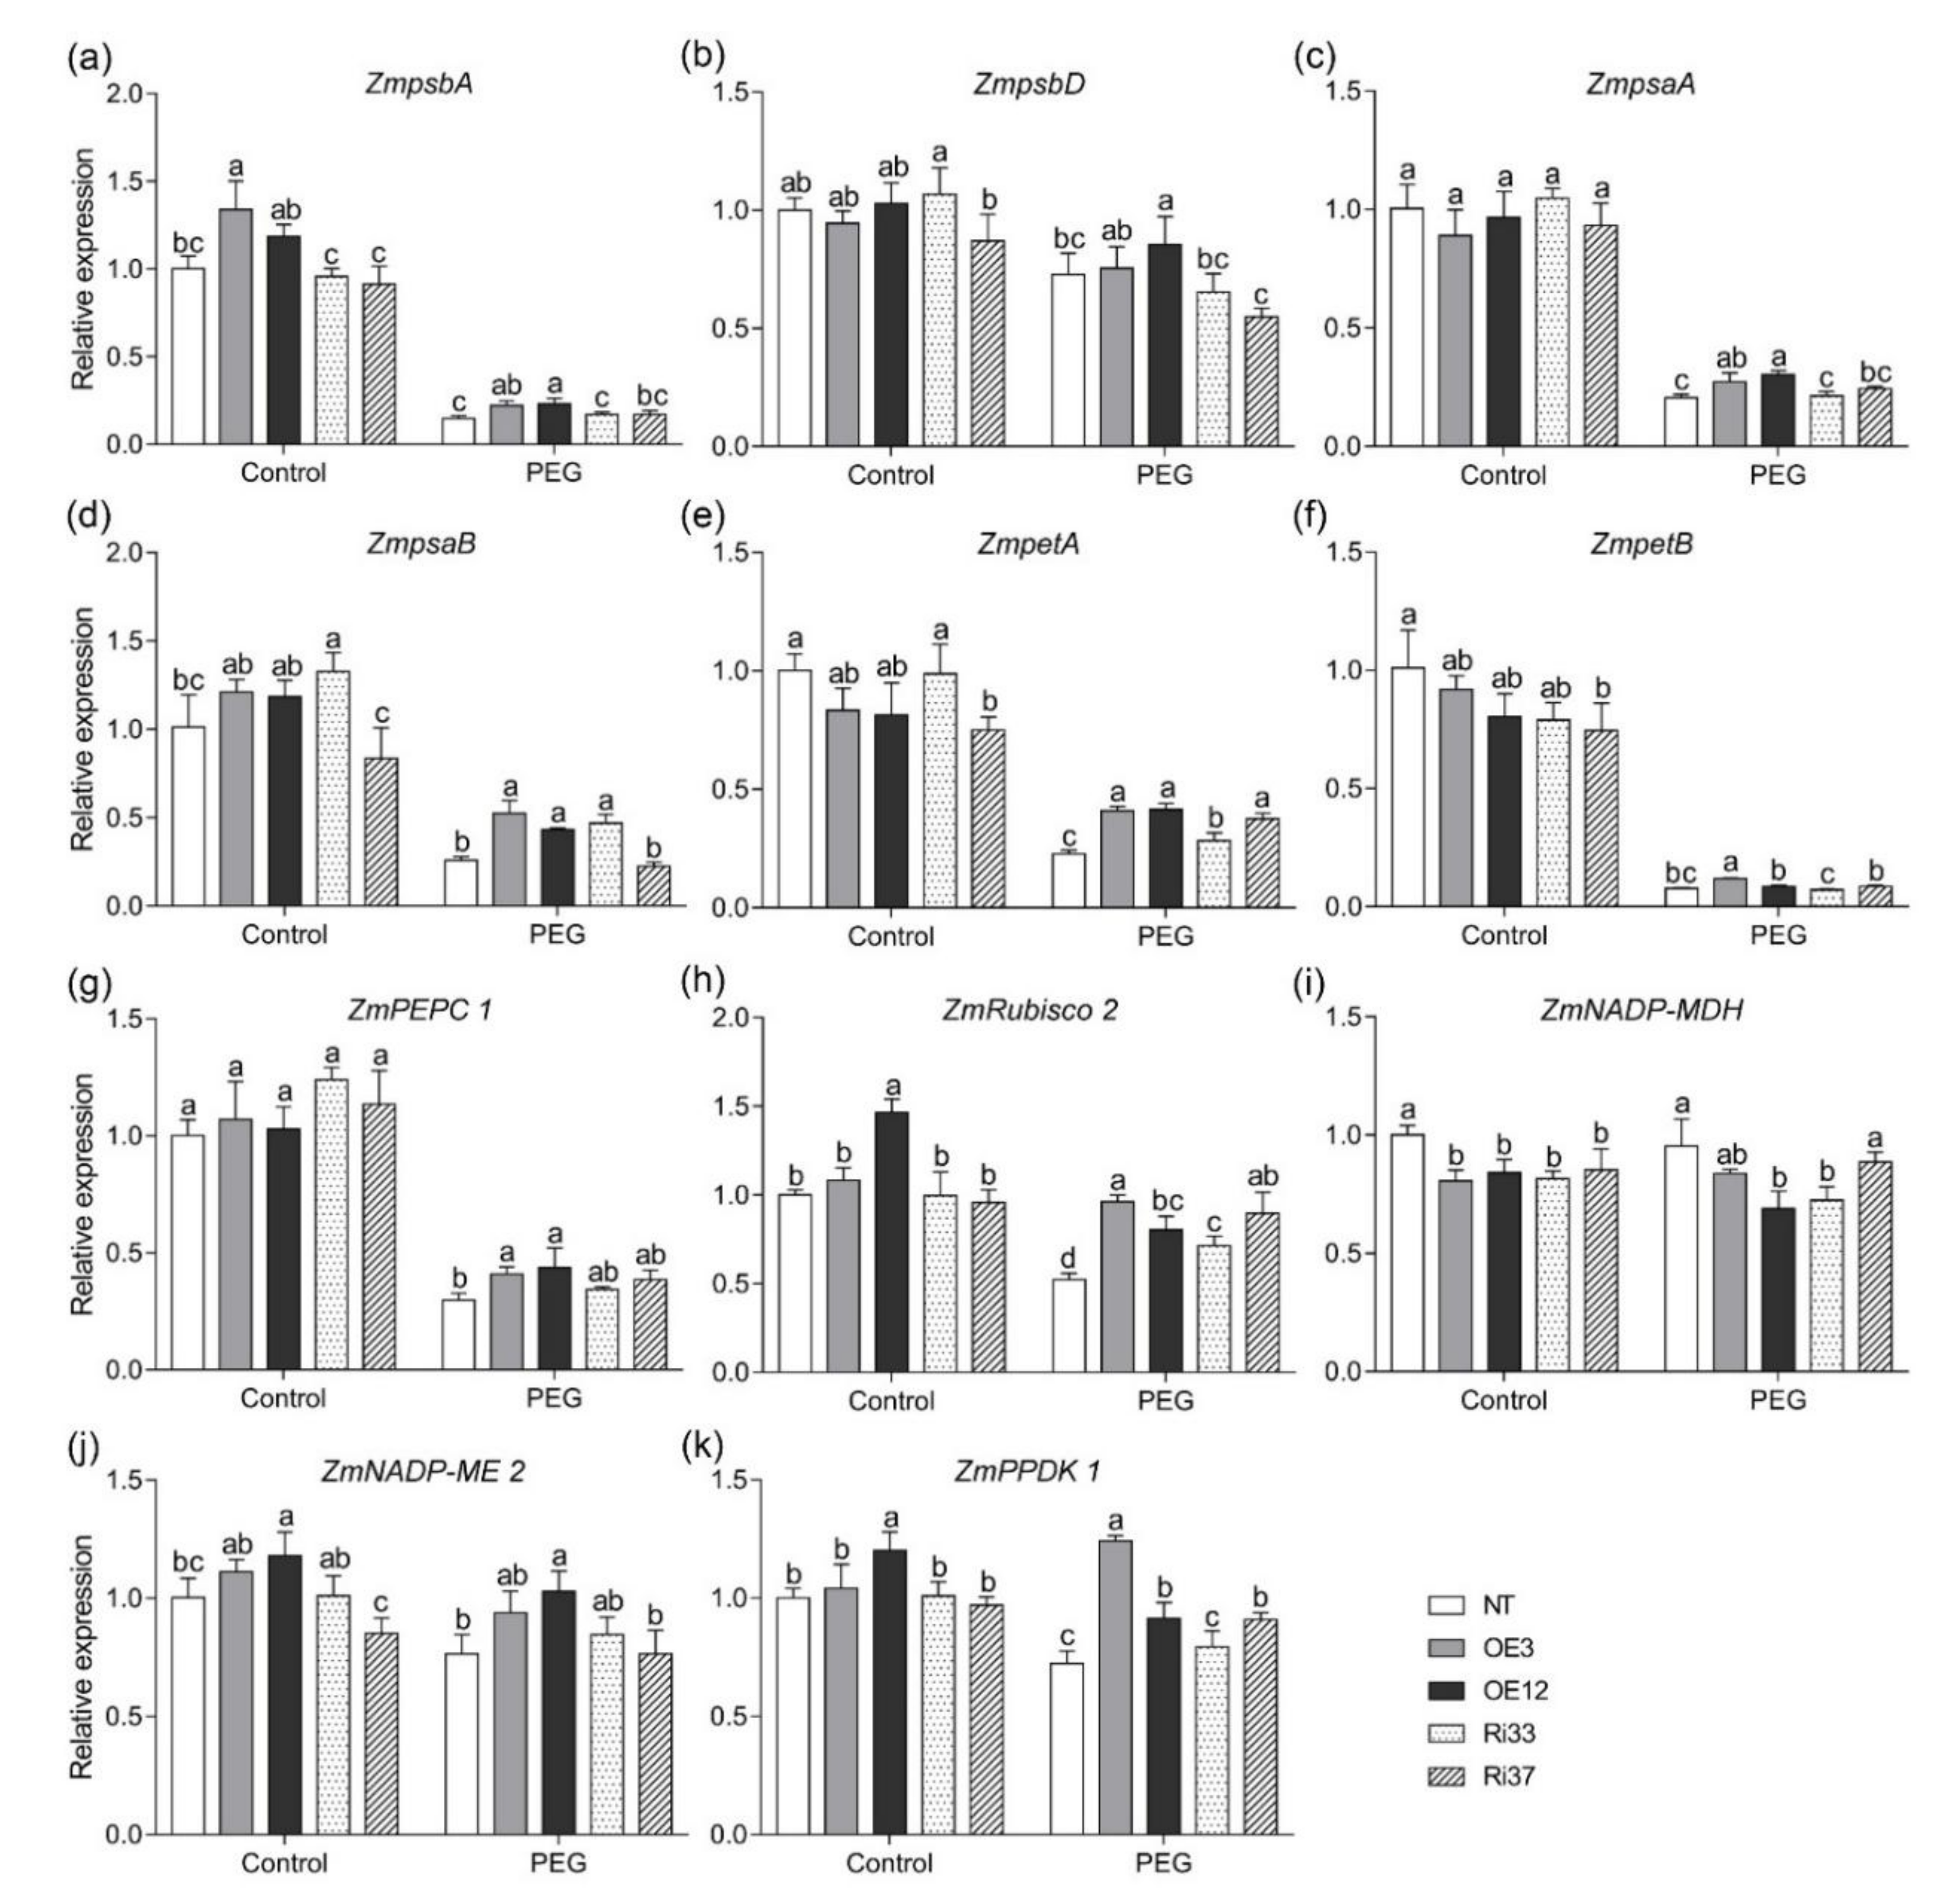
3.7. CgbHLH001 Positively Regulated the Expressions of Multiple Photosynthesis-Related Genes

To gain further insights into the potential mechanism of CgbHLH001 response to drought stress, the expression patterns of 11 photosynthesis-related genes were studied using qRT-PCR detection. These included six genes involved in the photosynthetic electron transport chain, ZmpsbA (encoding the PSII D1 protein), ZmpsbD (encoding the PSII D2 protein), ZmpsaA (encoding the PSI P700 apoprotein A1), ZmpsaB (encoding the PSI P700 apoprotein A2), ZmpetA (encoding the apocytochrome f precursor), and ZmpetB (encoding the cytochrome b6), and the other five key genes in the C4 photosynthetic pathway, including ZmPEPC, ZmRubisco, ZmNADP-MDH, ZmNADP-ME, and ZmPPDK. After PEG treatment, the expression of six genes involved in the photosynthetic electron transport chain was significantly increased in OE lines compared with that in NT plants, except for ZmpsbD in OE3 and ZmpetB in OE12 (Figure 6a–f); between Ri plants and NT plants, their expressions were similar, except for ZmpsaB (in Ri33) and ZmpetA. Four genes related to C4 photosynthetic enzymes—ZmPEPC, ZmRubisco, ZmNADP-ME, and ZmPPDK (except for ZmNADP-MDH)—were upregulated in OE lines compared with that of NT plants (Figure 6g,h,j,k), and there was no significant difference between NT and Ri plants, except for ZmRubisco. The ZmNADP-MDH was downregulated in all transgenic lines compared with NT plants under control or drought stress conditions (Figure 6i).

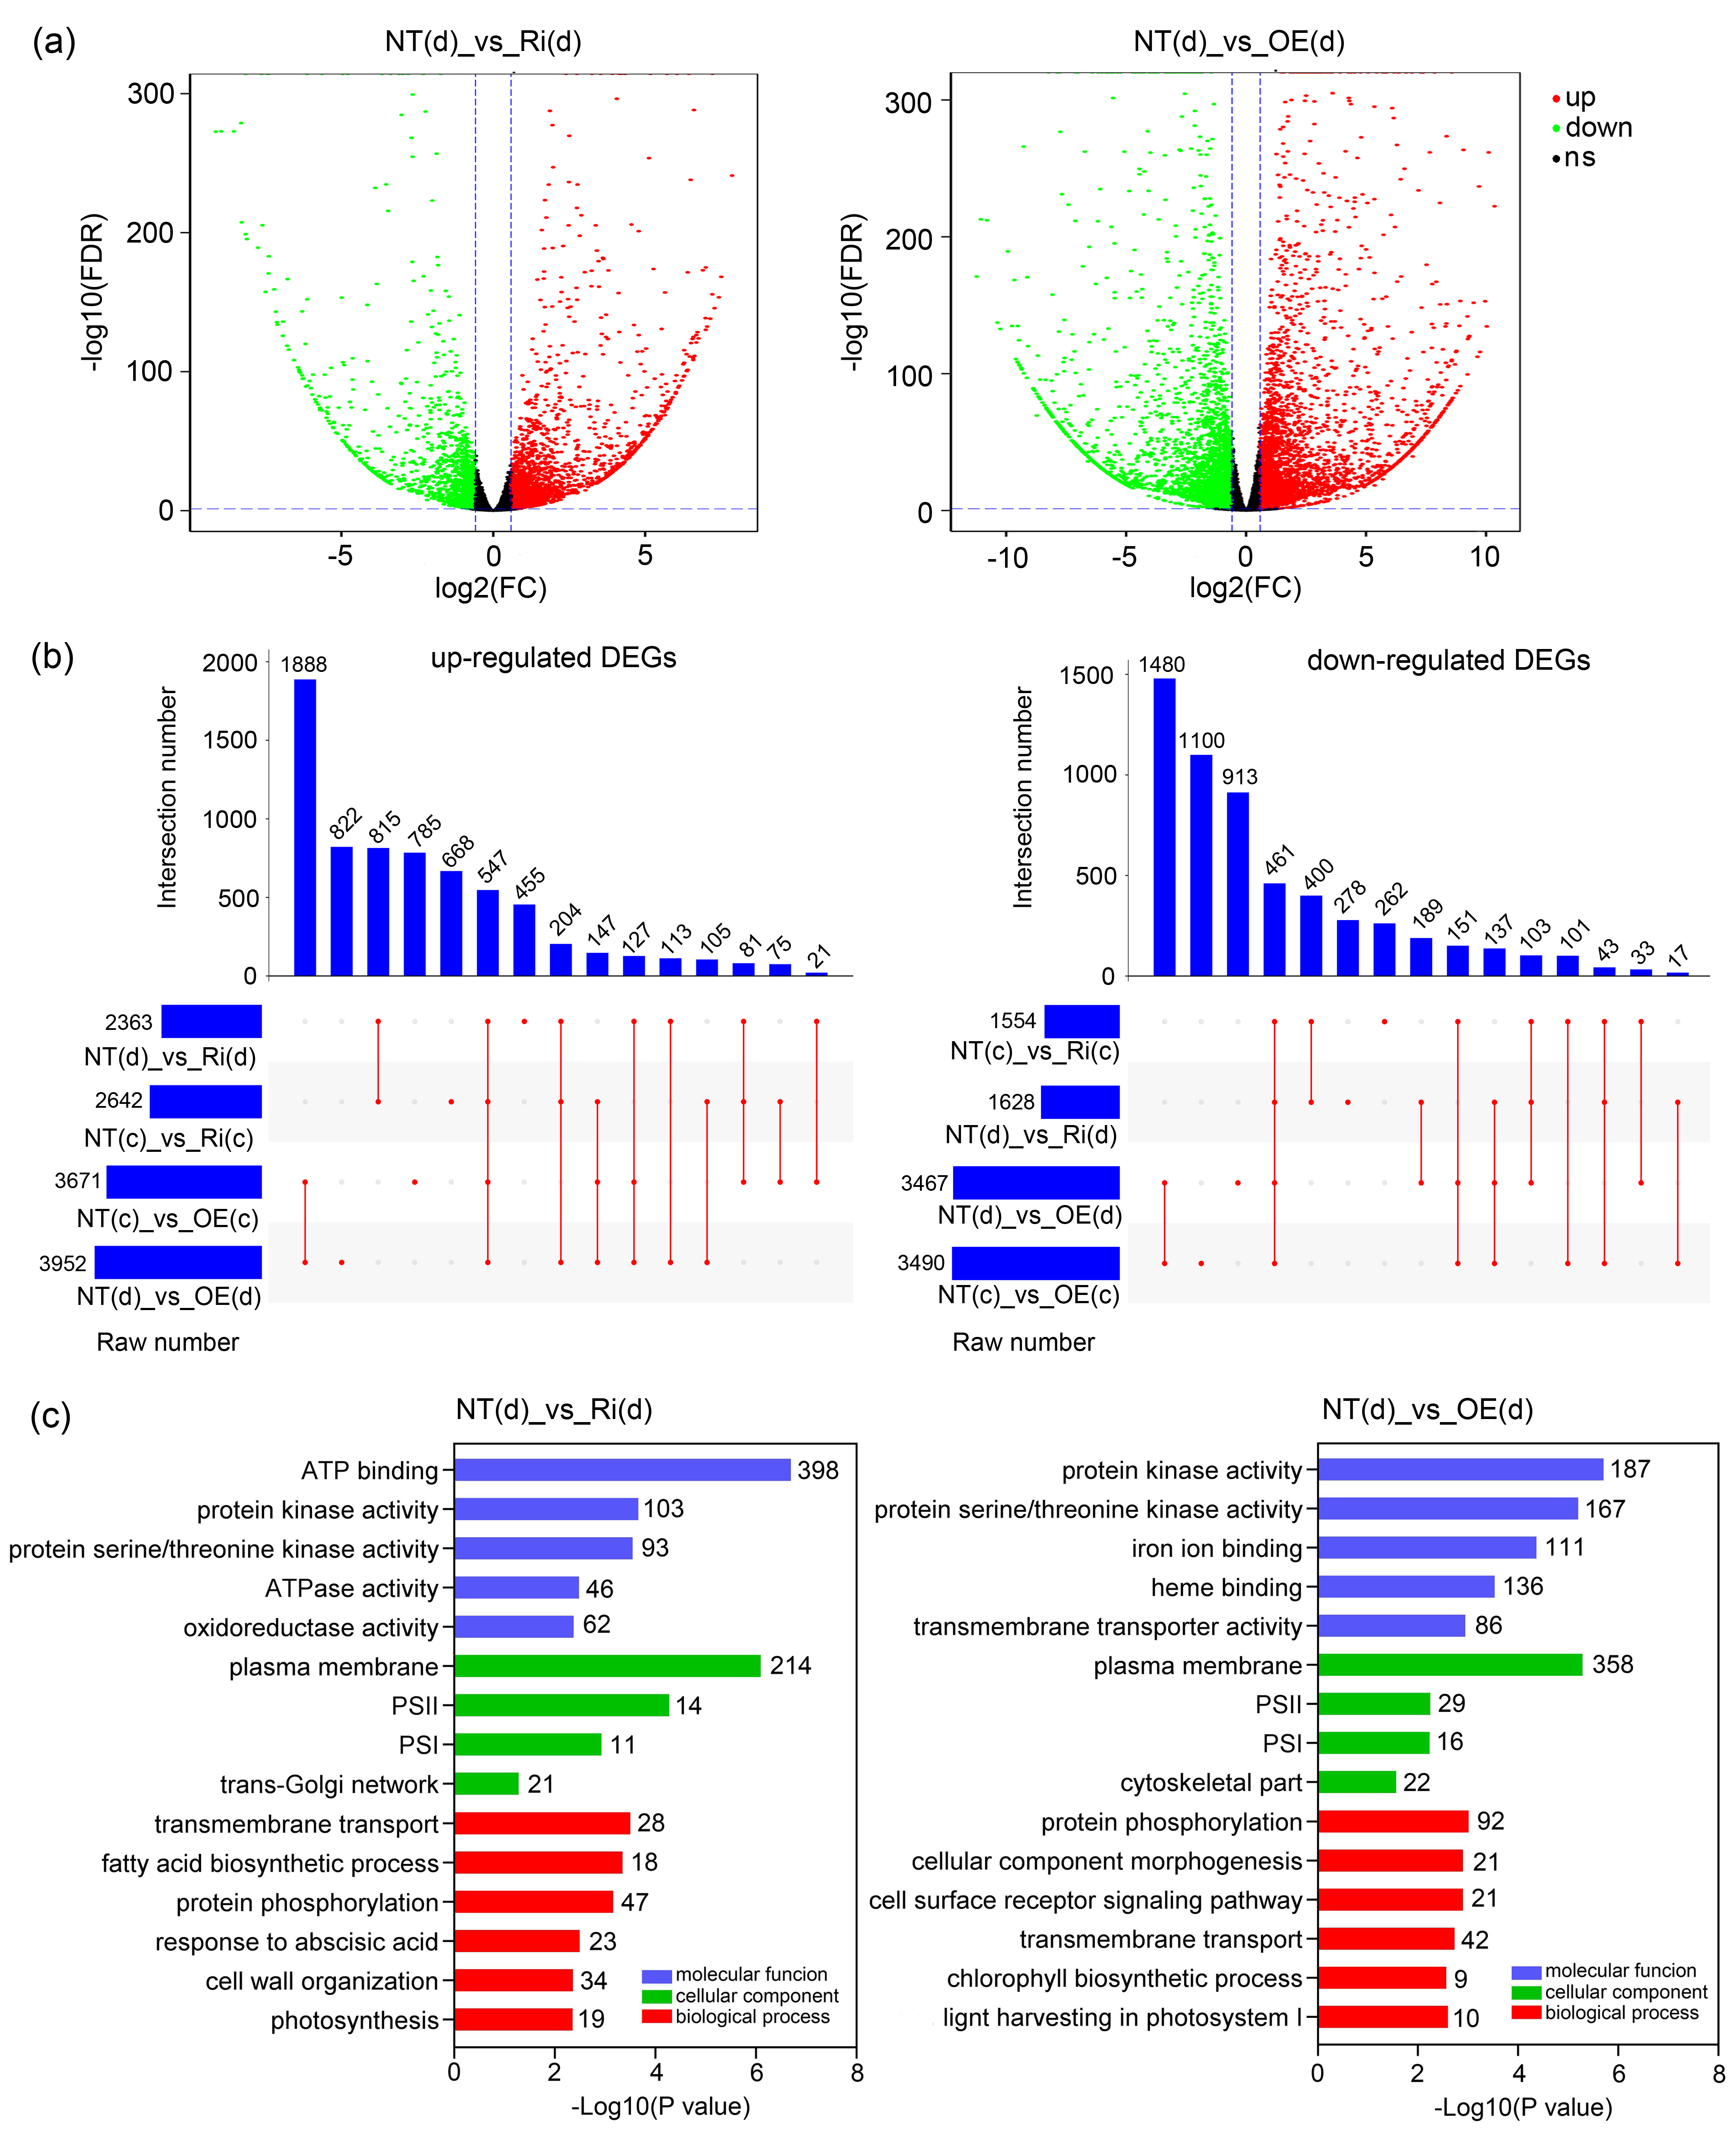
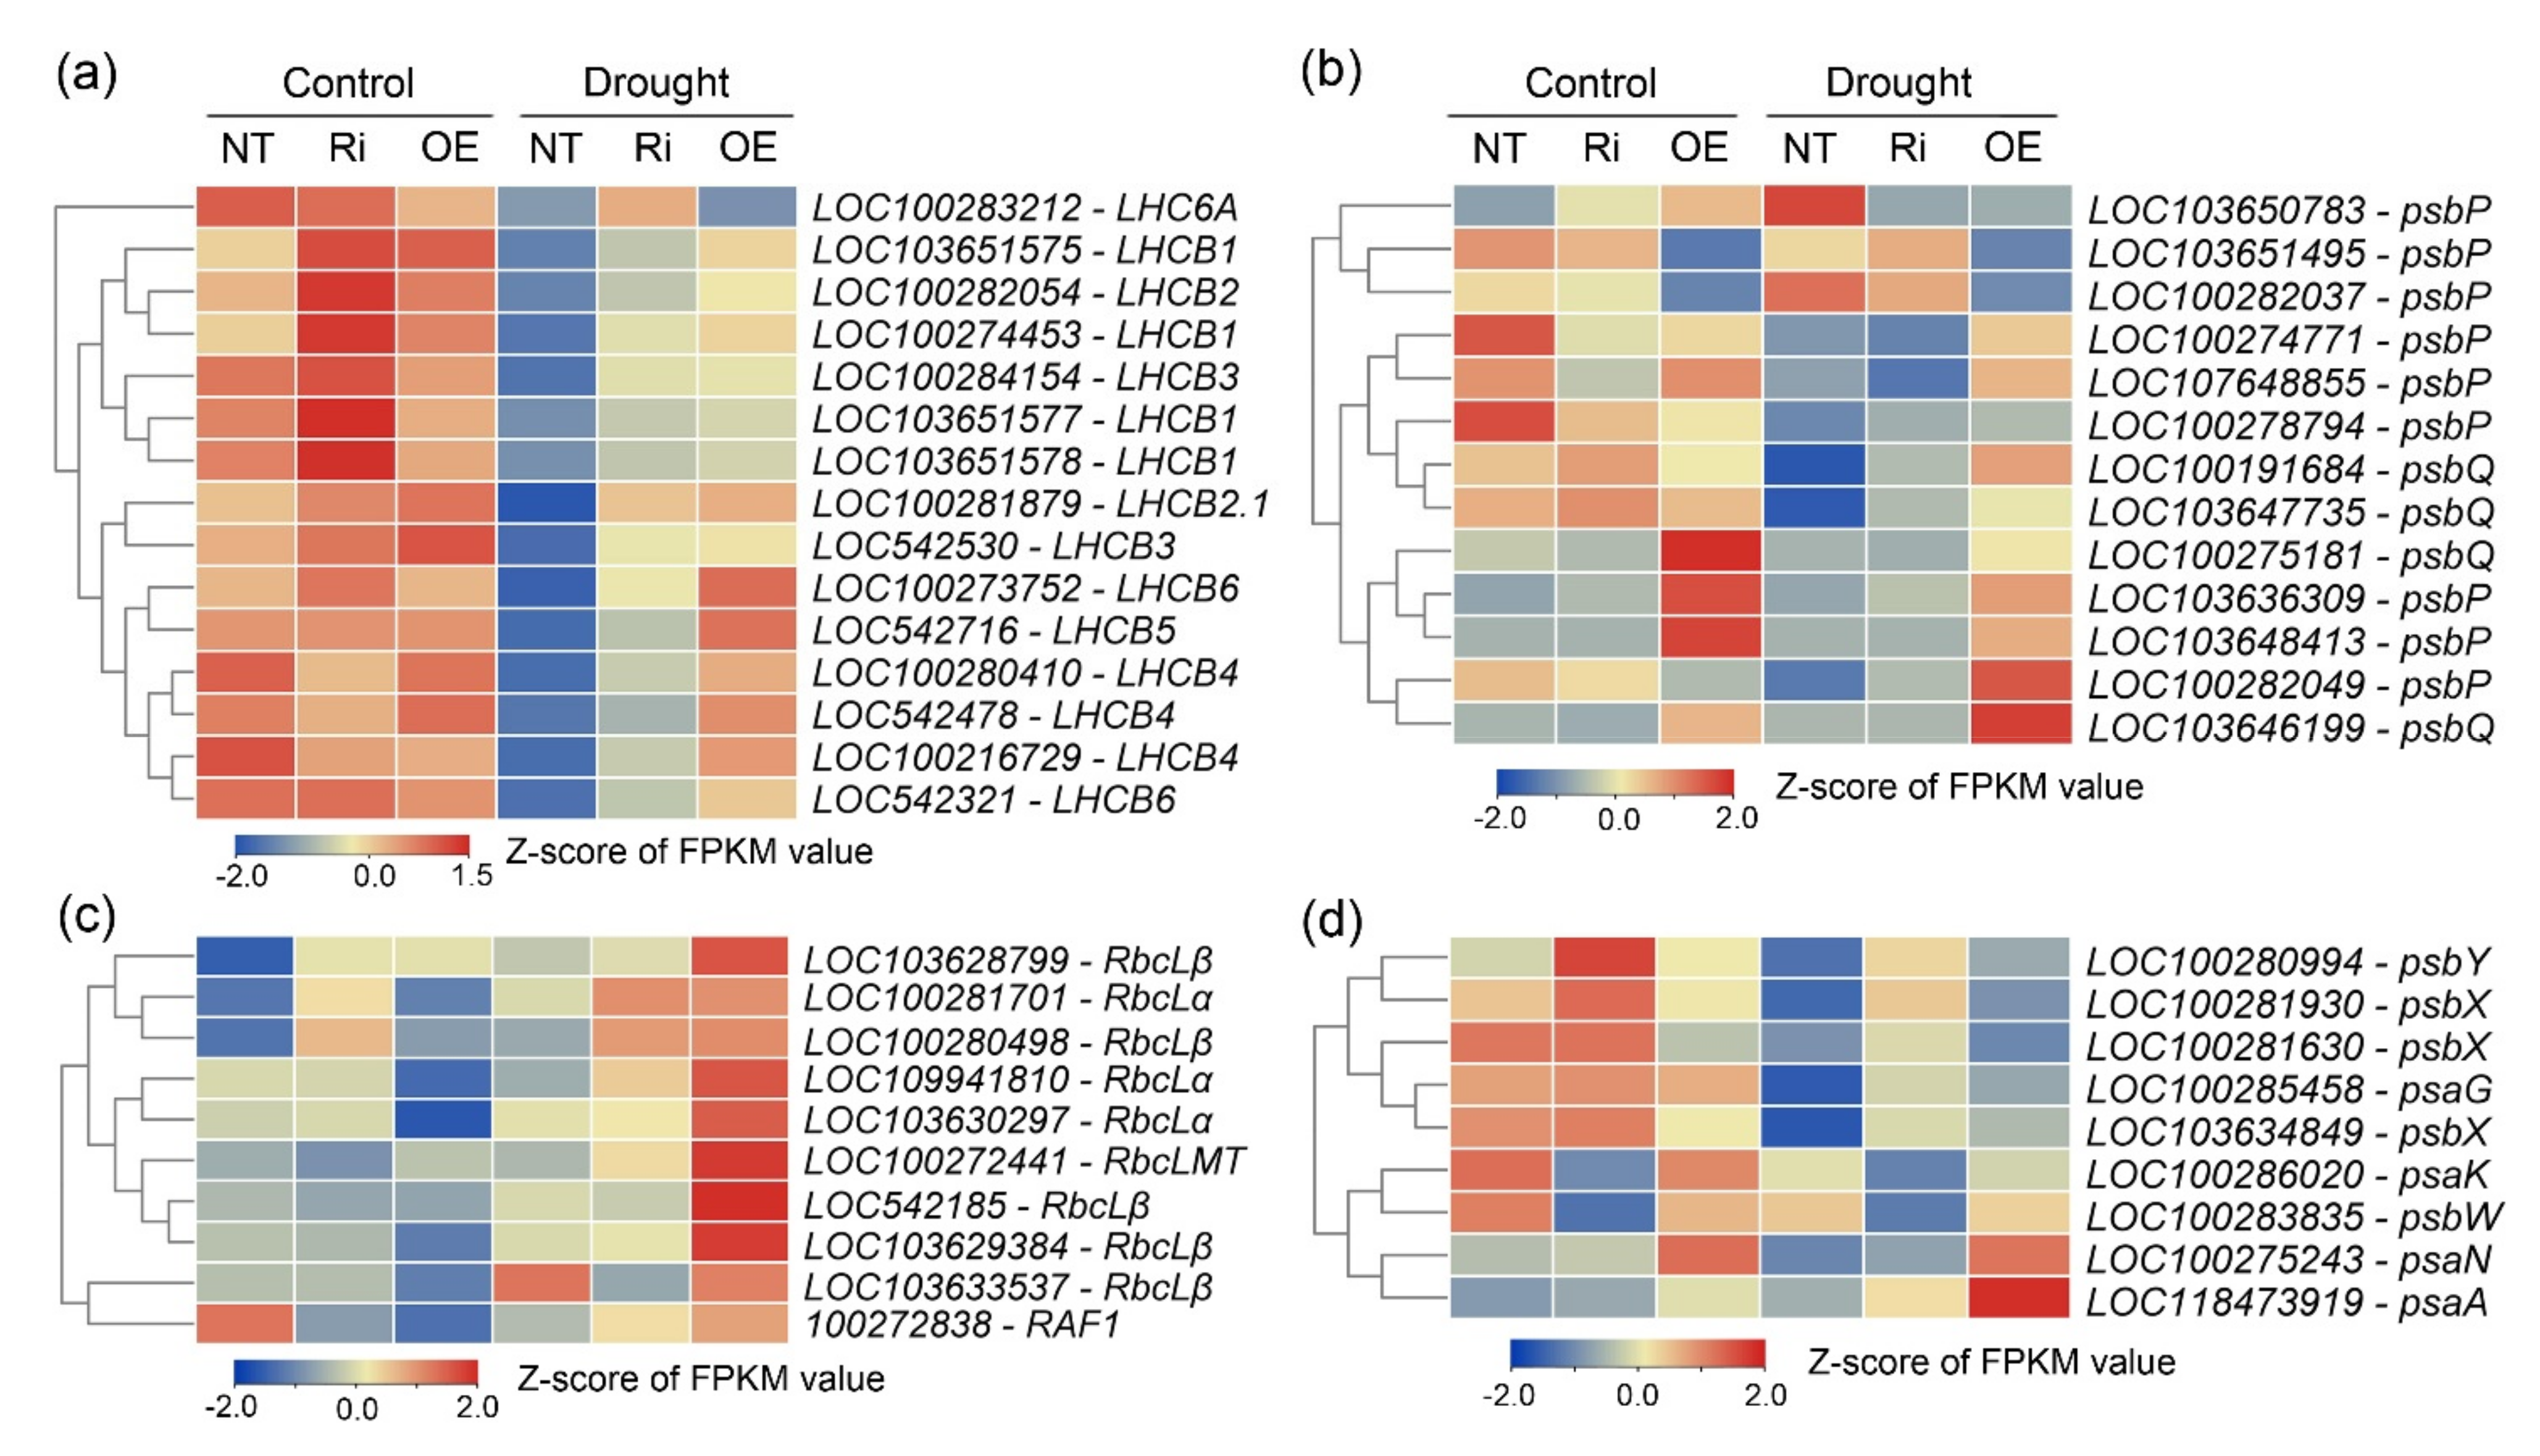
3.8. Comprehensive Responses at Transcriptional Level of CgbHLH001 Overexpression in Maize Seedlings Subjected to Drought Stress

To further elucidate the molecular mechanism of CgbHLH001 regulation in drought stress, gene expression profiles were investigated via RNA-seq analysis. Approximately, 592.01 million clean reads were obtained, and 79.43–87.48% of them were mapped to the maize reference genome (Table S2). When compared with the transcriptome of NT plants under drought conditions, 3952 and 2363 differentially expressed genes (DEGs) were found with up-regulation in OE and Ri plants, respectively. Similarly, 3467 and 1628 DEGs were downregulated in OE and Ri plants, respectively (Figure 7a). A total of 547 upregulated and 461 downregulated DEGs were detected in all lines in both control and drought conditions (Figure 7b). These upregulated common DEGs were mainly related to signal transduction, electron carrier activity, and antioxidant activity (Figure S1); the downregulated common DEGs were mainly involved in antioxidant activity (Figure S2). In general, changes in control and drought conditions (both upregulated and downregulated) were much greater for OE lines than Ri lines. The principal component analysis (PCA) and Pearson correlation analysis showed that there was a high level of reproducibility among three biological replicates (Figure S3). Gene Ontology (GO) enrichment of DEGs was analyzed under drought treatment. The top 20 significant GO terms were identified and categorized in molecular function, cellular component, and biological process (Table S3). GO terms related to transmembrane transport, protein phosphorylation, and signal transduction were significantly enriched in Ri and OE plants. In addition, development-related GO terms were enriched in Ri and OE plants, such as cell wall organization and cellular component morphogenesis. Twenty-five GO terms involved in drought stress were annotated in the biological process and many DEGs in the OE line were enriched in response to drought and water deprivation under drought conditions (Figure S4). Meanwhile, DEGs with the highest and lowest expression level were investigated (Table S4). The functions of DEGs with the highest expression level in OE lines were mainly associated with energy production and conversion (e.g., ATP binding, photosynthesis), carbohydrate transport and metabolism, and signal transduction, which were related to the defense responses, while genes with the lowest expression level were primarily involved in amino acid transport and metabolism, secondary metabolite biosynthesis, posttranslational modification, etc. To figure out the response of bHLHs to stress, the expression profiles of ZmbHLHs in NT plants and the OE line were analyzed with RNA-seq data (Figure S5). A total of 128 ZmbHLHs were obtained, 70 of which were upregulated in NT plants under drought stress, suggesting that bHLH genes in maize could positively respond to drought stress (Figure S5a,b; Table S5). The expression profiles of ZmbHLHs in the OE line under the control or drought stress were different from those in NT plants (Figure S5c,d).
Among these GO terms, we found that upregulated DEGs related to photosynthesis were significantly enriched in response to drought stress (Figure 7c). Consequently, we analyzed DEGs involved in photosynthesis, including those encoding subunits of chlorophyll a/b binding proteins (LHC), photosystem (PS) II oxygen evolving complex (OEC), Rubisco large subunits, and PS I and II reaction center proteins (Figure 8). The expression levels of these genes were significantly downregulated following drought treatment, while they were significantly higher in OE plants compared with that in NT and Ri plants (Figure 8a,b,d; Table S6). In contrast, the expression level of most DEGs related to Rubisco large subunits increased when subjected to drought and were much higher in OE lines than in NT plants (Figure 8c; Table S6), which is consistent with results of its enzymatic activity (Figure 5d) and gene expression pattern in qRT-PCR (Figure 6h).

4. Discussion

Maize is an essential crop cultivated worldwide while much sensitive to drought stress, which may reduce production by more than 20% [4]. Plants have evolved diverse mechanisms at the molecular level in response to drought stress; among them, bHLH TFs play important roles [7,8]. In our previous study, we revealed that the CgbHLH001 gene from an annual halophyte C. glaucum improved the drought tolerance of transgenic maize [30]. In the present study, we further explored the CgbHLH001 function in drought tolerance by improving the photosynthetic capacity in maize seedlings. Our results showed that CgbHLH001 overexpression could improve the drought tolerance of transgenic maize by enhancing the photosynthetic performance, including gas exchange parameters, chlorophyll fluorescence, photosynthetic enzyme activity, and the expression of photosynthesis-related genes. In addition, differentially expressed genes (DEGs) involved in photosynthetic systems were identified under drought conditions based on RNA-seq analysis, many of which were upregulated in OE plants compared with that in NT and Ri plants. Our findings may provide insights in understanding of the diverse strategies of bHLH TFs in response to drought stress, especially the effect on photosystems.
In our previous work, via Agrobacterium-mediated transformation, we got five transgenic maize lines (OE1, OE3, OE7, OE12, OE16) with a high expression level of CgbHLH001; all these OE lines showed a drought-tolerant phenotype (in varying degree), and we chose OE1, OE7, and OE12 in our previous work [30]. Consequently, when planting these transgenic lines in the field, we found that some agronomic traits of OE1 and OE7 were not good enough for the following study on the photosynthetic capacity, e.g., higher ear height, flowering asynchronism, very compact plant, smaller functional leaves, etc. Therefore, in the present study, these two OE lines were not included. In comparison, OE3 and OE12 exhibited better performance in the field, which were then used in the analysis of photosynthetic indexes. Meanwhile, we also got two ZmbHLH-RNAi transgenic lines (Ri33, Ri37), between them, the performance of Ri33 was not always consistent in different experiments compared with that of Ri37, though the inhibition effect on the expression of several ZmbHLHs (homologs with CgbHLH001) in two Ri maize lines was similar [30]. The underlying mechanism on the performance of RNAi plants remains unclear. Consequently, we selected two transgenic lines—OE12 and Ri37—and NT plants for RNA-seq analysis under drought stress, because their performances were consistent in various aspects both in the present and previous work [30].
Photosynthesis is one of the most fundamental processes whereby plants convert light into chemical energy to synthesize organic compounds. Generally, increased biomass is related to an increase in photosynthetic capacity [41]. However, photosynthesis is sensitive to drought. Therefore, the most adverse effects of drought are associated with photosynthetic processes. In the present study, drought stress induced growth inhibition in all maize seedlings, consistent with the results of previous studies [37,42]. However, root growth is less affected than shoot growth under drought stress [43]. As the first organ to sense water stress, a more extensive root system is crucial for crops to resist water stress, including increased root weight, length, and distribution [44]. The root dry weight of drought-tolerant potato cultivars was significantly higher than that of susceptible cultivars [45]. The turfgrass germplasm was screened to evaluate drought tolerance based on a relatively high root/shoot ratio [46]. In the present study, the root biomass in OE plants was higher than that in NT and Ri plants under drought conditions, and the root/shoot ratio was also higher. Our results indicate that overexpression of CgbHLH001 improves drought tolerance, at least in part, by increasing root biomass.
As components of photosynthetic membranes and indispensable photosynthetic pigments in the biosphere, chlorophyll (Chl) a and b serve functions of light-harvesting antenna pigments and convert solar energy to chemical energy [47]. It has been reported that drought-tolerant wheat cultivars maintain relatively higher Chl content than susceptible cultivars do [48]. Therefore, higher Chl a and b contents indicate greater light capture capacity. In the present study, contents of Chl a and b in OE lines were higher than those in NT plants when subjected to drought treatment, suggesting that OE lines may capture light more efficiently to improve light reactions. The increase in chlorophyll content was also reported in Amaranthus tricolor leaves under salt stress [49] and in maize seedlings under extreme low-light intensity [50]. In contrast to the degradation of Chl a, Chl b is first converted to Chl a during degradation [51]. In the present study, the Chl a/b significantly decreased in OE lines compared with that in NT plants, suggesting that OE lines may slow the conversion or that NT plants are more rapid in conversion of Chl b to Chl a. In addition, the restriction of Chl a supply would lead to Chl b deficiency [52]. This implies that blocking Chl a degradation in OE lines might have a comparable effect on the Chl a/b balance under drought stress. Furthermore, a decrease in the Chl a/b is associated with an increase in the light-harvesting Chl protein complex II, which consists of the antenna protein of photosystem II [53]. Our results were also similar to the report that some soybeans responded to salt stress by reducing Chl a/b value [53].
Abiotic stress reduces photosynthetic activity in higher plants. This decrease is attributed to stomatal or non-stomatal limitations. Once subjected to drought stress, stomatal closure is a well-known mechanism for avoiding water loss [54], which may lead to the inhibition of gas exchange [21]. However, even the stomatal closure increases, C4 plants can still maintain higher photosynthetic efficiency than C3 plants [55]. In our study, the net photosynthetic rate (Pn) decreased due to the reduction in stomatal conductance (Gs), transpiration rate (Tr), and internal CO2 concentration (Ci) when exposed to water deficit. However, Pn maintained significantly higher values in OE lines compared with those in NT lines. Higher Gs levels increase CO2 content in the cellular spaces and promote transpiration, which can reduce leaf epidermal resistance and improve transportation of substances to enhance photosynthesis [56]. Consistent with these results, in the present study, Gs and Tr in OE lines showed a higher level than in other lines, which contributed to the improvement of Pn values in OE plants.
PSII, a primary component of the photosynthetic apparatus, is prominent and susceptible to abiotic stress [57]. Chlorophyll fluorescence (ChlF) emitted by intact and attached leaves is an accurate and non-invasive way to monitor photosynthetic processes to assess plant physiological changes [58]. ChlF has been considered as an important indicator in screening drought-susceptible or drought-tolerant cultivars based on the level of PSII [59]. A higher effective PSII quantum yield (ΦPSII) and electron transport rate (ETR) indicate higher electron transportation, leading to an increase in the CO2 assimilation rate [59]. The value of Fv/Fm (maximum PSII quantum yield) is usually in the range of 0.75–0.85 under normal conditions, and it is also used to monitor the survival of plants under drought stress [60]. In the present study, the Fv/Fm was approximately 0.77, demonstrating that the OE lines were drought tolerant. A decrease in qP under drought conditions indicates the closure of the PSII reaction center. In contrast, the increase in NPQ under stress may be due to the dissipation of excitation energy in the form of heat [61]. In our study, the OE lines presented relatively higher ΦPSII, ETR, and qP levels than NT plants under drought stress, implying that OE plants had a lesser closure extent of PSII reaction centers and higher photosynthesis efficiency; meanwhile, NPQ was lower in OE lines under stress conditions, demonstrating that the harvested light energy was better utilized, and the efficiency of photochemical reactions was higher in OE plants [62]. Taken together, chlorophyll fluorescence parameters in our study implied that the photosynthetic apparatus in OE lines might be less damaged than in NT plants under drought stress.
Carbohydrate sugars are the main products of photosynthesis which supply basic carbon skeletons and energy sources for various biological processes [63]. Fructose and glucose play crucial roles in maintaining osmotic adjustment and scavenging free radicals and molecular signals [64]. The accumulation of glucose and fructose from sucrose and starch constitutes a typical osmotic adjustment response to water deficits, mitigating negative impacts on the structure and function caused by drought stress [65]. In the present study, the glucose and fructose presented a general increase under drought stress in different lines, but in OE lines the levels were significantly higher than those of NT plants, which implies that OE lines improve drought tolerance by maintaining higher sugar levels.
The C4 pathway of the NADP-ME type in maize is composed of CO2 fixation, decarboxylation regeneration of PEP, and CO2 refixation and assimilation [66], in which photosynthetic enzymes—PEPC, NADP-ME, PPDK, and Rubisco—play important roles; meanwhile, they also function in drought stress by reducing reactive oxygen species and membrane lipid peroxidation [67]. It has been reported that overexpression of C4 photosynthetic pathway-related genes can improve photosynthesis under drought or salt stress [68]. However, controversial conclusions remain [69]. Therefore, the C4 photosynthetic pathway involves complex physiological and biochemical processes. In our study, activities of C4 photosynthetic pathway-related enzymes (PEPC, NADP-MDH, NADP-ME, RuBisCO, PPDK) in OE plants were higher than those in NT plants under drought stress, except for PPDK. The lower PPDK activity may be partially attributed to its origin as a non-photosynthetic enzyme [70]. Our results are consistent with previous reports [71,72], suggesting that these photosynthetic enzymes in OE lines play a role in drought tolerance in addition to their catalytic activity.
Drought response is a complex process that involves many genes. Plants can enhance drought tolerance by regulating the expression of photosynthesis-related genes [73]. The photosynthetic electron transport chain involves the PSII electron donor, PSI electron acceptor, and cytochrome b6/f complex, which transfers electrons from PSII to PSI. psbA and psbD genes (encoding D1 and D2 proteins in the PSII reaction center) participate in electron transfer [74]. Numerous studies have found that the D1 protein is a key target in response to abiotic stress [75]. In our study, the expression of psbA in maize was markedly decreased in all lines under drought stress, but the expression level of ZmpsbA in OE lines was significantly higher than that in NT plants. Similar results were observed for ZmpsaA and ZmpsaB (encoding PSI reaction center proteins), along with ZmpetA and ZmpetB (encoding the cytochrome b6/f complex). It has been reported that increased expression of PEPC or NADP-ME alleviates inhibition of photosynthesis due to drought stress, and upregulated NADP-ME provides more NADPH for the biosynthetic pathway to balance reactive oxygen species [76]. In the present study, both photosynthetic electron transport-related genes and key photosynthetic enzyme genes were expressed at higher levels in OE lines compared with that in NT plants (except for NADP-MDH) under drought stress, combined with results on enzyme activities, which may suggest that OE lines acquire more ability in either photosynthesis efficiency or stress tolerance.
Transcriptome is widely used to investigate variations of drought response genes in maize; among them, photosynthesis-related genes are usually enriched [31]. e.g., among 4552 DEGs identified between a drought-tolerant maize variety C7-2 and C7-2 mutant, the expression of photosynthesis-related DEGs was inhibited in the C7-2 rather than C7-2 mutant under drought conditions [77]. Similar results were observed in the expression profiles of DEGs involved in photosynthesis between drought-sensitive line RIL93 and drought-tolerant line RIL70 in maize [16]. In the present study, the DEG number was higher in the OE line than those in the NT and Ri lines under drought stress; among them, a moderate proportion was involved in the photosynthetic pathway. Generally, the expression of DEGs related to PSI and PSII reaction center proteins and photosynthetic electron transport was decreased under drought conditions as a whole, whereas expression levels of these DEGs in OE lines were much higher than those in NT plants, which is consistent with our previous qRT-PCR results (Figure 6). e.g., for most genes of the chlorophyll a/b binding protein (LHC), PS II oxygen evolving complex (OEC), photosystem I and II reaction center proteins, and Rubisco large subunit, in the present study, more transcripts were accumulated in OE lines than in NT plants under drought stress. It has been reported that drought results in the disturbance of energy transfer from the light-harvested complex to the reaction center and inactivation of the OEC, which consequently impairs the electron transport from the donor to the acceptor side of PSII [58]. LHC proteins play indispensable roles in light harvesting, energy transfer, and drought tolerance [78], and downregulation of any member of the LHC family in A. thaliana may lead to reduced drought tolerance [79]. In our RNA-seq data, we detected relatively higher expression of these genes in OE lines, suggesting that CgbHLH001 overexpression may aid to reduce drought-induced electron transfer damage and confer drought tolerance to transgenic maize.

5. Conclusions

In the present study, the OE maize lines exhibited higher photosynthetic efficiency than NT and Ri plants, especially under drought stress. The OE lines had greater root biomass, a relatively lower leaf area reduction rate, and higher chlorophyll content, Pn values, chlorophyll fluorescence parameters, and sugar content in leaves than those in NT and Ri plants under drought conditions. CgbHLH001 overexpression also increased C4 photosynthetic enzyme activities and expression levels of related genes in maize seedlings subjected to short-term drought stress, along with some genes associated with the photosynthetic electron transport chain. RNA-seq results further verified that the majority of genes related to photosynthetic systems were upregulated in OE plants under drought conditions. Our findings may provide novel insights into the functions of bHLH related to abiotic stress tolerance and suggest a candidate gene for breeding drought-tolerant maize cultivars.

Supplementary Materials

The following supporting information can be downloaded at: https://0-www-mdpi-com.brum.beds.ac.uk/article/10.3390/agronomy12051149/s1, Table S1: Primers used in the present study; Table S2: Summary of reads, mapped to B37 reference genome; Table S3: The top 20 significantly enriched Gene Ontology (GO) terms among DEGs in response to drought stress; Table S4: DEGs differing in the highest and lowest expression level under drought conditions; Table S5: The nucleotide similarity of ZmbHLHs with CgbHLH001; Table S6: DEGs related to the photosynthesis; Figure S1: Enriched Gene Ontology (GO) terms among the common up-regulated DEGs in response to drought stress; Figure S2: Enriched Gene Ontology (GO) terms among the common down-regulated DEGs in response to drought stress; Figure S3: The principle component analysis (PCA) and the heatmap of correlation analysis among replicates in the same group and between different groups; Figure S4: The enrichment of DEGs in GO terms related to drought stress; Figure S5: Expression profiles of available ZmbHLHs in the present RNA-seq data.

Author Contributions

Conceptualization, H.Z., C.W. and H.L.; methodology, H.Z.; software, H.Z. and A.A.; validation, H.Z., C.W. and H.L.; formal analysis, H.Z.; investigation, H.Z. and A.A.; resources, H.L.; data curation, H.Z., A.A., C.W. and H.L.; writing—original draft preparation, H.Z.; writing—review and editing, H.L.; visualization, H.Z.; supervision, C.W. and H.L.; project administration, C.W. and H.L.; funding acquisition, C.W. and H.L. All authors have read and agreed to the published version of the manuscript.

Funding

This research was funded by the Major Project of Science and Technology of Xinjiang Uygur Autonomous Region, grant number 2021A02001-2 and 2018A01001.

Institutional Review Board Statement

Not applicable.

Informed Consent Statement

Not applicable.

Data Availability Statement

The data supporting the conclusions of this article are included within the paper.

Acknowledgments

The authors thank all who have contributed their helpful comments and suggestions on this manuscript. Authors are also grateful to the heads of JoinHope Seed Industry CO., LTD. for their help in the field trials.

Conflicts of Interest

The authors declare no conflict of interest. The funders had no role in the design of the study; in the collection, analyses, or interpretation of data; in the writing of the manuscript, or in the decision to publish the results.

References

  1. Wassmann, R.; Jagadish, S.V.K.; Sumfleth, K.; Pathak, H.; Heuer, S. Regional vulnerability of climate change impacts on Asian rice production and scope for adaptation. Adv. Agron. 2009, 102, 99–133. [Google Scholar] [CrossRef]
  2. Vinocur, B.; Altman, A. Recent advances in engineering plant tolerance to abiotic stress: Achievements and limitations. Curr. Opin. Biotech. 2005, 16, 123–132. [Google Scholar] [CrossRef] [PubMed]
  3. Ribaut, J.M.; Ragot, M. Marker-assisted selection to improve drought adaptation in maize: The backcross approach, perspectives, limitations, and alternatives. J. Exp. Bot. 2007, 58, 351–360. [Google Scholar] [CrossRef] [PubMed] [Green Version]
  4. Gong, F.; Wu, X.; Zhang, H.; Chen, Y.; Wang, W. Making better maize plants for sustainable grain production in a changing climate. Front. Plant Sci. 2015, 6, 835. [Google Scholar] [CrossRef] [PubMed] [Green Version]
  5. Yamaguchi-Shinozaki, K.; Shinozaki, K. Transcriptional regulatory networks in cellular responses and tolerance to dehydration and cold stresses. Annu. Rev. Plant Biol. 2006, 57, 781–803. [Google Scholar] [CrossRef] [Green Version]
  6. Ma, H.; Liu, C.; Li, Z.; Ran, Q.; Xie, G.; Wang, B.; Fang, S.; Chu, J.; Zhang, J. ZmbZIP4 contributes to stress resistance in maize by regulating ABA synthesis and root development. Plant Physiol. 2018, 178, 753–770. [Google Scholar] [CrossRef] [Green Version]
  7. Liu, D.; Li, Y.Y.; Zhou, Z.C.; Xiang, X.; Liu, X.; Wang, J.; Hu, Z.R.; Xiang, S.P.; Li, W.; Xiao, Q.Z. Tobacco transcription factor bHLH123 improves salt tolerance by activating NADPH oxidase NtRbohE expression. Plant Physiol. 2021, 3, 3. [Google Scholar] [CrossRef]
  8. Dong, H.; Chen, Q.; Dai, Y.; Hu, W.; Huang, X. Genome-wide identification of PbrbHLH family genes, and expression analysis in response to drought and cold stresses in pear (Pyrus bretschneideri). BMC Plant Biol. 2021, 21, 86. [Google Scholar] [CrossRef]
  9. Ort, D.R.; Long, S.P. Limits on Yields in the Corn Belt. Science 2014, 344, 484. [Google Scholar] [CrossRef]
  10. Tausta, S.L.; Coyle, H.M.; Rothermel, B.; Stiefel, V.; Nelson, T. Maize C4 and non-C4 NADP-dependent malic enzymes are encoded by distinct genes derived from a plastid-localized ancestor. Plant Mol. Biol. 2002, 50, 635–652. [Google Scholar] [CrossRef]
  11. Edwards, G.; Walker, D. C3 C4: Mechanisms and cellular and environmental regulation of photosynthesis. Plant Cell Environ. 1983, 6, 747–748. [Google Scholar]
  12. Omoto, E.; Taniguchi, M.; Miyake, H. Adaptation responses in C4 photosynthesis of maize under salinity. J. Plant Physiol. 2012, 169, 469–477. [Google Scholar] [CrossRef]
  13. Peterhansel, C.; Horst, I.; Niessen, M.; Blume, C.; Kebeish, R.; Kürkcüoglu, S.; Kreuzaler, F. Photorespiration. Arab. Book 2010, 8, e0130. [Google Scholar] [CrossRef]
  14. Anderson, L.E. Chloroplast and cytoplasmic enzymes II. Pea leaf triose phosphate isomerases. BBA-Enzymol. 1971, 235, 237–244. [Google Scholar] [CrossRef]
  15. Maiti, R.K.; Maiti, L.E.; Sonia, M.; Maiti, A.M.; Maiti, M.; Maiti, H. Genotypic variability in maize cultivars (Zea mays L.) for resistance to drought and salinity at the seedling stage resistance to drought and salinity at the seedling stage. J. Plant Physiol. 1996, 148, 741–744. [Google Scholar] [CrossRef]
  16. Min, H.; Chen, C.; Wei, S.; Shang, X.; Sun, M.; Xia, R.; Liu, X.; Hao, D.; Chen, H.; Qi, X. Identification of drought tolerant mechanisms in maize seedlings based on transcriptome analysis of recombination inbred lines. Front. Plant Sci. 2016, 7, e01080. [Google Scholar] [CrossRef]
  17. Farooq, M.; Wahid, A.; Kobayashi, N.; Fujita, D.; Basra, S.M.A. Plant drought stress: Effects, mechanisms and management. Agron. Sustain. Dev. 2009, 29, 185–212. [Google Scholar] [CrossRef] [Green Version]
  18. Hussain, H.A.; Hussain, S.; Khaliq, A.; Ashraf, U.; Anjum, S.A.; Men, S.N.; Wang, L.C. Chilling and drought stresses in crop plants: Implications, cross talk, and potential management opportunities. Front. Plant Sci. 2018, 9, 393. [Google Scholar] [CrossRef]
  19. Yeh, S.Y.; Lin, H.H.; Chang, Y.M.; Chang, Y.L.; Chang, C.K.; Huang, Y.C.; Ho, Y.W.; Lin, C.Y.; Zheng, J.Z.; Jane, C.K.; et al. Maize Golden2-like transcription factors boost rice chloroplast development, photosynthesis, and grain yield. Plant Physiol. 2021, 188, 442–459. [Google Scholar] [CrossRef]
  20. Zargar, S.M.; Gupta, N.; Nazir, M.; Mahajan, R.; Malik, F.A.; Sofi, N.R.; Shikari, A.B.; Salgotra, R.K. Impact of drought on photosynthesis: Molecular perspective. Plant Gene. 2017, 11, 154–159. [Google Scholar] [CrossRef]
  21. Hayano-Kanashiro, C.; Calderon-Vazquez, C.; Ibarra-Laclette, E.; Herrera-Estrella, L.; Simpson, J. Analysis of gene expression and physiological responses in three Mexican maize landraces under drought stress and recovery irrigation. PLoS ONE 2009, 4, e7531. [Google Scholar] [CrossRef]
  22. Flexas, J.; Medrano, H. Drought-inhibition of photosynthesis in C3 plants: Stomatal and non-stomatal limitations revisited. Ann. Bot-Lond. 2002, 89, 183–189. [Google Scholar] [CrossRef] [Green Version]
  23. Martinstpaul, N.; Delzon, S.; Cochard, H. Plant resistance to drought depends on timely stomatal closure. Ecol. Lett. 2017, 20, 11. [Google Scholar] [CrossRef]
  24. Mitchel, P.L.; Sheehy, J.E. Supercharging rice photosynthesis to increase yield. New Phytol. 2006, 171, 688–693. [Google Scholar] [CrossRef]
  25. Gu, J.; Yin, X.; Stomph, T.J.; Wang, H.; Struik, P.C. Physiological basis of genetic variation in leaf photosynthesis among rice (Oryza sativa L.) introgression lines under drought and well-watered conditions. J. Exp. Bot. 2012, 63, 5137–5153. [Google Scholar] [CrossRef] [Green Version]
  26. Almoguera, C.; Prieto-Dapena, P.; Personat, J.M.; Tejedor-Cano, J.; Lindahl, M.; Diaz- Espejo, A.; Jordano, J. Protection of the photosynthetic apparatus from extreme dehydration and oxidative stress in seedlings of transgenic tobacco. PLoS ONE 2012, 7, e51443. [Google Scholar] [CrossRef] [Green Version]
  27. Han, X.; Tang, S.; An, Y.; Zheng, D.C.; Xia, X.L.; Yin, W.L. Overexpression of the poplar NF-YB7 transcription factor confers drought tolerance and improves water-use efficiency in Arabidopsis. J. Exp. Bot. 2013, 14, 4589–4601. [Google Scholar] [CrossRef] [Green Version]
  28. Huo, Y.; Wang, M.; Wei, Y.; Xia, Z. Overexpression of the maize psbA gene enhances drought tolerance through regulating antioxidant system, photosynthetic capability, and stress defense gene expression in tobacco. Front. Plant Sci. 2016, 6, 1223. [Google Scholar] [CrossRef] [Green Version]
  29. Mbambalala, N.; Panda, S.K.; Vyver, C. Overexpression of AtBBX29 improves drought tolerance by maintaining photosynthesis and enhancing the antioxidant and osmolyte capacity of sugarcane plants. Plant Mol. Biol. Rep. 2021, 39, 419–433. [Google Scholar] [CrossRef]
  30. Zhao, H.J.; Wang, C.H.; Lan, H.Y. A bHLH transcription factor from Chenopodium glaucum confers drought tolerance to transgenic maize by positive regulation of morphological and physiological performances and stress-responsive genes’ expressions. Mol. Breed. 2021, 41, 47. [Google Scholar] [CrossRef]
  31. Ren, J.; Xie, T.; Wang, Y.; Li, H.; Liu, T.; Zhang, S.; Yin, L.; Wang, S.; Deng, X.; Ke, Q. Coordinated regulation of carbon and nitrogen assimilation confers drought tolerance in maize (Zea mays L.). Environ. Exp. Bot. 2020, 176, 104086. [Google Scholar] [CrossRef]
  32. Anders, S.; Huber, W. Differential expression analysis for sequence count data. Genome Biol. 2010, 11, R106. [Google Scholar] [CrossRef] [PubMed] [Green Version]
  33. Livak, K.J.; Schmittgen, T.D. Analysis of relative gene expression data using real-time quantitative PCR and the 2−ΔΔCT method. Methods 2001, 25, 402–408. [Google Scholar] [CrossRef]
  34. Djangaopa, J.T.; Mambu, S.M.; Song, A.N. Variations in Leaf chlorophyll concentration in croton plants (Codiaeum variegatum L.) cultivar Gelatik at a different leaf age. J. Ilm. Sains 2020, 20, 78–87. [Google Scholar] [CrossRef]
  35. Genty, B.; Briantais, J.M.; Baker, N.R. The relationship between the quantum yield of photosynthetic electron transport and quenching of chlorophyll fluorescence. BBA-Genernal Subj. 1989, 990, 87–92. [Google Scholar] [CrossRef]
  36. Schreiber, U.; Bilger, W.; Neubauer, C. Chlorophyll fluorescence as a nonintrusive indicator for rapid assessment of in vivo photosynthesis. In Ecophysiology of Photosynthesis; Schulze, E.D., Caldwell, M.M., Eds.; Springer Study edn; Springer: Berlin/Heidelberg, Germany, 1995; Volume 100, pp. 49–70. [Google Scholar] [CrossRef]
  37. Sujatha, E.; Anusha, C.; Taheniyat, S.; Lalitha, R. Effect of 28-Homobrassinolide on photosynthesis and carbohydrate content of Maize under salt and cadmium stress. Ann. Plant Sci. 2019, 8, 3517. [Google Scholar] [CrossRef]
  38. Schreiber, U. Pulse-amplitude-modulation (PAM) fluorometry and saturation pulse method: An overview. In Chlorophyll a Fluorescence: A Signature of Photosynthesis; Papageorgiou, G.C., Govindjee, Eds.; Advances in photosynthesis and respiration; Springer: Dordrecht, The Netherlands, 2004; Volume 19, pp. 279–319. [Google Scholar]
  39. Bradford, M.M. A rapid and sensitive method for the quantitation of microgram quantities of protein utilizing the principle of protein-dye binding. Anal. Biochem. 1976, 72, 248–254. [Google Scholar] [CrossRef]
  40. Wood, C.W.; Reeves, D.W.; Himelrick, D.G. Relationships between chlorophyll meter readings and leaf chlorophyll concentration, N status, and crop yield: A review. Proc. Agron. Soc. N.Z. 1993, 23, 1–9. [Google Scholar]
  41. Athar, H.U.R.; Khan, A.; Ashraf, M. Inducing Salt Tolerance in Wheat by Exogenously Applied Ascorbic Acid through Different Modes. J. Plant Nutr. 2009, 32, 1799–1817. [Google Scholar] [CrossRef]
  42. Jabeen, F.; Shahbaz, M.; Ashraf, M. Discriminating some prospective cultivars of maize (Zea mays L.) for drought tolerance using gas exchange characteristics and proline contents as physiological markers. Pak. J. Bot. 2008, 40, 2329–2343. [Google Scholar] [CrossRef] [Green Version]
  43. Benjamin, J.G.; Nielsen, D.C.; Vigil, M.F.; Mikha, M.M.; Calderon, F. Water Deficit Stress Effects on Corn (Zea mays L.) Root:Shoot Ratio. Open J. Soil Sci. 2014, 04, 151–160. [Google Scholar] [CrossRef] [Green Version]
  44. Ludlow, M.M.; Muchow, R.C. A critical evaluation of traits for improving crop yields in water-limited environments. Adv. Agron. 1990, 43, 107–153. [Google Scholar] [CrossRef]
  45. Legay, S.; Lefèvre, I.; Lamoureux, D.; Barreda, C.; Tincopa, R.; Gutierrez, R.; Quiroz, R.; Hoffmann, L.; Hausman, J.F.; Bonierbale, M.; et al. Carbohydrate metabolism and cell protection mechanisms differentiate drought tolerance and sensitivity in advanced potato clones (Solanum tuberosum L.). Funct. Integr. Genom. 2011, 11, 275–291. [Google Scholar] [CrossRef]
  46. Bonos, S.A.; Rush, D.; Hignight, K.; Meyer, W.A. Selection for Deep Root Production in Tall Fescue and Perennial Ryegrass. Crop Sci. 2004, 44, 5. [Google Scholar] [CrossRef]
  47. Hynninen, P.H.; Mesilaakso, M. Synthesis and characterization of chlorophyll a enol derivatives: Chlorophyll a tert-butyldimethylsilyl-enol ether and 131-deoxo-131,132-didehydro-chlorophyll a. J. Porphyr. Phthalocya. 2016, 20, 590–601. [Google Scholar] [CrossRef]
  48. Chandrasekar, V.; Sairam, R.K.; Srivastava, G.C. Physiological and Biochemical Responses of Hexaploid and Tetraploid Wheat to Drought Stress. J. Agron. Crop Sci. 2010, 185, 219–227. [Google Scholar] [CrossRef]
  49. Wang, Y.; Nii, N. Changes in chlorophyll, ribulose bisphosphate carboxylase-oxygenase, glycine betaine content, photosynthesis and transpiration in Amaranthus tricolor leaves during salt stress. J. Hortic. Sci. Biotech. 2000, 75, 623–627. [Google Scholar] [CrossRef]
  50. Nyitrai, P.; Sárvári, É.; Keresztes, Á.; Láng, F. Organization of Thylakoid Membranes in Low-Light Grown Maize Seedlings. Effect of Lincomycin Treatmen. J. Plant Physiol. 1994, 144, 370–375. [Google Scholar] [CrossRef]
  51. Ohtsuka, O.; Ito, H.; Tanaka, A. Conversion of chlorophyll b to chlorophyll a and the assembly of chlorophyll with apoproteins by isolated chloroplasts. Plant Physiol. 1997, 113, 137–147. [Google Scholar] [CrossRef] [Green Version]
  52. Falbel, T.G.; Staehelin, L.A. Partial blocks in the early steps of chlorophyll synthesis pathway: A common feature of chlorophyll b-deficient mutants. Physiol. Plant. 1996, 97, 311–320. [Google Scholar] [CrossRef]
  53. Çiçek, N.; Çakırlar, H. Effects of salt stress on some physiological and photosynthetic parameters at three different temperatures in six soya bean (Glycine max L. Merr.) cultivars. J. Agron. Crop Sci. 2008, 194, 34–46. [Google Scholar] [CrossRef]
  54. Assmann, S.M.; Jegla, T. Guard cell sensory systems. Recent insights on stomatal responses to light, abscisic acid, and CO2. Curr. Opin. Plant Biol. 2016, 33, 157–167. [Google Scholar] [CrossRef] [PubMed] [Green Version]
  55. Ghannoum, O. C4 photosynthesis and water stress. Ann. Bot-Lond. 2009, 103, 635–644. [Google Scholar] [CrossRef] [PubMed] [Green Version]
  56. Xie, T.; Gu, W.; Yao, M.; Li, J.; Wang, Y.; Qu, D.; Wei, S. Exogenous DCPTA ameliorates simulated drought conditions by improving the growth and photosynthetic capacity of maize seedlings. Sci. Rep. 2017, 7, 12684. [Google Scholar] [CrossRef] [Green Version]
  57. Picorel, R.; Miguel, A.; Maya, V. Editorial: Molecular basis of the response of photosynthetic apparatus to light and temperature stress. Front. Plant Sci. 2017, 8, 288. [Google Scholar] [CrossRef] [Green Version]
  58. Kalaji, H.M.; Jajoo, A.; Oukarroum, A.; Brestic, M.; Zivcak, M.; Samborska, I.A.; Cetner, M.D.; Łukasik, I.; Goltsev, V.; Ladle, R.J. Chlorophyll a fluorescence as a tool to monitor physiological status of plants under abiotic stress conditions. Acta Physiol. Plant. 2016, 38, 102. [Google Scholar] [CrossRef] [Green Version]
  59. Araus, J.L.; Amaro, T.; Voltas, J.; Nakkoul, H.; Nachit, M.M. Chlorophyll fluorescence as a selection criterion for grain yield in durum wheat under Mediterranean conditions. Field Crop Res. 1998, 55, 209–223. [Google Scholar] [CrossRef]
  60. Woo, N.S.; Badger, M.R.; Pogson, B.J. A rapid, non-invasive procedure for quantitative assessment of drought survival using chlorophyll fluorescence. Plant Methods 2008, 4, 27–42. [Google Scholar] [CrossRef] [Green Version]
  61. Lambrev, P.H.; Miloslavina, Y.; Jahns, P.; Holzwarth, A.R. On the relationship between non-photochemical quenching and photoprotection of Photosystem II. BBA-Bioenerg. 2012, 1817, 760–769. [Google Scholar] [CrossRef] [Green Version]
  62. Graßes, T.; Pesaresi, P.; Schiavon, F.; Varotto, C.; Slamini, F.; Jahns, P.; Leister, D. The role of ΔpH-dependent dissipation of excitation energy in protecting photosystem II against light-induced damage in Arabidopsis thaliana. Plant Physiol. Biochem. 2002, 40, 41–49. [Google Scholar] [CrossRef] [Green Version]
  63. Ho, L.C. Metabolism and compartmentation of imported sugars in sink organs in relation to sink strength. Annu. Rev. Plant Biol. 1988, 39, 355–378. [Google Scholar] [CrossRef]
  64. Du, Y.; Lu, R.; Xia, J. Impacts of global environmental change drivers on non-structural carbohydrates in terrestrial plants. Funct. Ecol. 2020, 34, 1525–1536. [Google Scholar] [CrossRef]
  65. Merewitz, E.B.; Gianfagna, T.; Huang, B. Protein accumulation in leaves and roots associated with improved drought tolerance in creeping bentgrass expressing an ipt gene for cytokinin synthesis. J. Exp. Bot. 2011, 62, 5311–5333. [Google Scholar] [CrossRef] [Green Version]
  66. Hatch, M.D. C4 photosynthesis, a unique blend of modified biocheistry, anatomy, and ultrastructure. Biochim. Biophys. Acta 1987, 895, 81–106. [Google Scholar] [CrossRef]
  67. Jiao, D.; Huang, X.; Li, X.; Chi, W.; Kuang, T.; Zhang, Q.; Ku, M.S.; Cho, D. Photosynthetic characteristics and tolerance to photo-oxidation of transgenic rice expressing C4 photosynthesis enzymes. Photosynth. Res. 2002, 72, 85–93. [Google Scholar] [CrossRef]
  68. Yoon, D.K.; Ishiyama, K.; Suganami, M.; Tazoe, Y.; Watanabe, M.; Imaruoka, S.; Ogura, M.; Ishida, H.; Suzuki, Y.; Obara, M.; et al. Transgenic rice overproducing Rubisco exhibits increased yields with improved nitrogen-use efficiency in an experimental paddy field. Nat. Food 2020, 1, 134–139. [Google Scholar] [CrossRef] [Green Version]
  69. Suzuki, Y.; Ohkubo, M.; Hatakeyama, H.; Ohashi, K.K.; Yoshizawa, R.; Kojima, S.; Hayakawa, T.; Yamaya, T.; Mae, T.; Makino, A. Increased Rubisco content in transgenic rice transformed with the ‘sense’ rbcS gene. Plant Cell Physiol. 2007, 48, 626–637. [Google Scholar] [CrossRef]
  70. Sage, R.F. The evolution of C4 photosynthesis. New Phytol. 2004, 161, 341–370. [Google Scholar] [CrossRef]
  71. Jia, S.; Lv, J.; Jiang, S.; Liang, T.; Liu, C.; Jing, Z. Response of wheat ear photosynthesis and photosynthate carbon distribution to water deficit. Photosynthetica 2015, 53, 95–109. [Google Scholar] [CrossRef] [Green Version]
  72. Zhang, X.; Peng, P.; Tang, Y.; Zhang, L.X.; Lv, J.Y. C4 photosynthetic enzymes play a key role in wheat spike bracts primary carbon metabolism response under water defcit. Plant Physiol. Biochem. 2019, 142, 163–172. [Google Scholar] [CrossRef]
  73. Zhou, J.; Wang, X.; Jiao, Y.; Qin, Y.; Liu, X.; He, K. Global genome expression analysis of rice in response to drought and high-salinity stresses in shoot, flag leaf, and panicle. Plant Mol. Biol. 2007, 63, 591–608. [Google Scholar] [CrossRef] [Green Version]
  74. Nelson, N.; Yocum, C.F. Structure and function of photosystems I and II. Annu. Rev. Plant Biol. 2006, 57, 521–565. [Google Scholar] [CrossRef] [Green Version]
  75. Chen, Y.E.; Mao, J.J.; Sun, L.Q.; Huang, B.; Ding, C.B.; Gu, Y.; Liao, J.Q.; Hu, C.; Zhang, Z.W.; Yuan, S. Exogenous melatonin enhances salt stress tolerance in maize seedlings by improving antioxidant and photosynthetic capacity. Physiol. Plant. 2018, 164, 349–363. [Google Scholar] [CrossRef]
  76. Moller, I.M. Plant mitochondria and oxidative stress: Electron transport, NADPH turnover, and metabolism of reactive oxygen species. Annu. Rev. Plant Physiol. Plant Mol. Biol. 2001, 52, 561–591. [Google Scholar] [CrossRef] [Green Version]
  77. Zhang, Q.; Liu, H.; Wu, X.; Wang, W. Identification of drought tolerant mechanisms in a drought-tolerant maize mutant based on physiological, biochemical and transcriptomic analyses. BMC Plant Biol. 2020, 20, 315. [Google Scholar] [CrossRef] [PubMed]
  78. Gereziher, T.; Xu, Y.; Magwanga, R.O.; Kirungu, J.N.; Cai, X.; Hou, Y.; Wang, Y.; Wang, K.; Zhou, Z.; Liu, F. Genome wide identification and characterization of light-harvesting Chloro a/b binding (LHC) genes reveals their potential role in enhancing drought tolerance in Gossypium hirsutum. J. Cotton Res. 2021, 4, 13. [Google Scholar] [CrossRef]
  79. Xu, Y.H.; Liu, R.; Yan, L.; Liu, Z.Q.; Jiang, S.C.; Shen, Y.Y.; Wang, X.F.; Zhang, D.P. Light-harvesting chlorophyll a/b binding proteins are required for stomatal response to abscisic acid in Arabidopsis. J. Exp. Bot. 2012, 63, 1095–1106. [Google Scholar] [CrossRef] [PubMed] [Green Version]
Figure 1. Phenotype of transgenic maize lines under drought stress indoors and changes of the chlorophyll content under PEG treatment. Two CgbHLH001-overexpressed lines (OE3 and OE12), two ZmbHLH-RNAi lines (Ri33 and Ri37), and non-transgenic plant (NT) were treated under natural drought conditions. (a) Control (normally-watered); (b) drought (deprived water for 8 days); (ce) Chl a, Chl b, Chl a/b content, respectively; (f) SPAD values (relative chlorophyll content measured by soil plant analyzer development on the living plant). NT, non-transgenic plant; OE3 and OE12, CgbHLH001-overexpressed T3 maize lines; Ri33 and Ri37, ZmbHLH-RNAi T3 maize lines. PEG, 15% PEG 6000 (polyethylglycol). Different lowercase letters above the columns indicate significant differences between NT plants and transgenic lines under the same condition (Tukey’s test, p < 0.05). Values are means ± SD of three replicates.
Agronomy 12 01149 g001aAgronomy 12 01149 g001b
Figure 2. Effects of CgbHLH001 overexpression on gas exchange parameters of maize seedlings under drought stress. (a) Net photosynthetic rate (Pn); (b) stomatal conductance (Gs); (c) transpiration rate (Tr); (d) internal CO2 concentration (Ci); (e) water use efficiency (WUE). NT, non-transgenic plant; OE3 and OE12, CgbHLH001-overexpressed T3 lines; Ri33 and Ri37, ZmbHLH-RNAi T3 lines. PEG, 15% PEG 6000. Different lowercase letters above columns indicate significant differences between NT plants and transgenic lines under the same condition (Tukey’s test, p < 0.05). Values are means ± SD of three replicates.
Agronomy 12 01149 g002
Figure 3. Effects of CgbHLH001 overexpression on chlorophyll fluorescence parameters of maize seedlings under drought stress. (a) Effective PSII quantum yield (ΦPSII); (b) electron transport rate (ETR); (c) photochemical quenching (qP); (d) non-photochemical quenching (NPQ). NT, non-transgenic plant; OE3 and OE12, CgbHLH001-overexpressed T3 maize lines; Ri33 and Ri37, ZmbHLH-RNAi T3 maize lines. PEG, 15% PEG 6000. Different lowercase letters above the columns indicate significant differences between NT plants and transgenic lines under the same condition (Tukey’s test, p < 0.05). Values are means ± SD of three replicates.
Agronomy 12 01149 g003
Figure 4. Effects of CgbHLH001 overexpression on carbohydrate fractions of maize seedlings under drought stress. (a) Starch; (b) sucrose; (c) fructose; (d) glucose. NT, non-transgenic plant; OE3 and OE12, CgbHLH001-overexpressed T3 maize lines; Ri33 and Ri37, ZmbHLH-RNAi T3 maize lines. PEG, 15% PEG 6000. Different lowercase letters above the columns indicate significant differences between NT plants and transgenic lines under the same condition (Tukey’s test, p < 0.05). Values are means ± SD of three replicates.
Agronomy 12 01149 g004
Figure 5. Effects of CgbHLH001 overexpression on the activity of photosynthetic enzymes of maize seedlings under drought stress. (a) PEPC activity; (b) NADP-MDH activity; (c) NADP-ME activity; (d) Rubisco activity; (e) PPDK activity. NT, non-transgenic plant; OE3 and OE12, CgbHLH001-overexpressed T3 maize lines; Ri33 and Ri37, ZmbHLH-RNAi T3 maize lines. PEG, 15% PEG 6000. PEPC, phosphoenol-pyruvate carboxylase; NADP-MDH, NADP-malic dehydrogenase; NADP-ME, NADP-malic enzyme; Rubisco, ribulose-1, 5-bisphosphate carboxylase/oxygenase; PPDK, pyruvate orthophosphate dikinase. Different lowercase letters above the columns indicate significant differences between NT plants and transgenic lines under the same condition (Tukey’s test, p < 0.05). Values are means ± SD of three replicates.
Agronomy 12 01149 g005
Figure 6. Effects of CgbHLH001 overexpression on photosynthesis-related genes of maize seedlings under drought stress. (a) ZmpsbA (encoding the PSII D1 protein); (b) ZmpsbD (encoding the PSII D2 protein); (c) ZmpsaA (encoding the PSI P700 apoprotein A1); (d) ZmpsaB (encoding the PSI P700 apoprotein A2); (e) ZmpetA (encoding the apocytochrome f precursor); (f) ZmpetB (encoding the cytochrome b6); (g) ZmPEPC (phosphoenol-pyruvate carboxylase); (h) ZmRubisco (ribulose-1, 5-bisphosphate carboxylase/oxygenase); (i) ZmNADP-MDH (NADP-malic dehydrogenase); (j) ZmNADP-ME (NADP-malic enzyme); (k) ZmPPDK (pyruvate orthophosphate dikinase). NT, non-transgenic plant; OE3 and OE12, CgbHLH001-overexpressed T3 maize lines; Ri33 and Ri37, ZmbHLH-RNAi T3 maize lines. PEG, 15% PEG 6000. Different lowercase letters above the columns indicate significant differences between NT plants and transgenic lines under the same condition (Tukey’s test, p < 0.05). Values are means ± SD of three replicates.
Agronomy 12 01149 g006
Figure 7. Comparison of RNA-seq data between NT and Ri or OE lines of maize seedlings under drought stress. (a) Volcano plots showing the number of differentially expressed genes (DEGs). Each point represents a DEG; (b) UpSet graphs displaying shared and unique DEGs identified in maize seedlings; (c) Gene Ontology (GO) functional annotation of molecular functions (blue column), cellular components (green column), biological processes (red column) of DEGs (numbers above each bar represent the number of DEGs related to the GO term). FC, fold change; NT(c), Ri(c), OE(c): seedlings of NT, Ri, OE under control condition, respectively; NT(d), Ri(d), OE(d): seedlings of NT, Ri, OE under drought condition, respectively. Up, up-regulated; down, down-regulated; ns, not significant.
Agronomy 12 01149 g007
Figure 8. Expression profiles of DEGs involved in the photosynthetic pathway in maize seedlings under drought stress. Heatmaps show the expression level of DEGs. (a) Chlorophyll a/b binding protein (LHC); (b) PS II oxygen evolving complex (OEC); (c) Rubisco large subunit; and (d) photosystem I and II reaction center proteins. NT, non-transgenic plant; Ri, ZmbHLH-RNAi T3 maize lines (Ri37); OE, CgbHLH001-overexpressed T3 maize lines (OE12). Heatmaps were generated based on the FPKM value (Z-score method). The redder the color, the higher the gene expression level. FPKM, fragments per kilobase of transcript sequence per million fragments mapped.
Agronomy 12 01149 g008
Table 1. Growth characterization of transgenic lines and NT under normal and drought conditions.
TreatmentLineFresh Biomass (g Plant−1)Dry Biomass (g Plant−1)Root/Shoot RatioArea of the 4th Leaf (cm2)Plant Height (cm)
ShootRootShootRoot
ControlNT6.62 ± 0.08 ab1.28 ± 0.02 bc0.44 ± 0.02 a0.09 ± 0.002 b0.19 ± 0.005 bc71.55 ± 2.32 a16.13 ± 0.18 b
OE37.44 ± 0.21 a1.65 ± 0.10 a0.47 ± 0.02 a0.12 ± 0.011 a0.23 ± 0.005 a59.65 ± 1.30 c14.50 ± 0.20 c
OE126.44 ± 0.19 b1.39 ± 0.07 b0.42 ± 0.02 a0.09 ± 0.004 b0.22 ± 0.008 ab61.71 ± 1.25 bc13.98 ± 0.31 c
Ri337.04 ± 0.39 ab1.23 ± 0.11 bc0.45 ± 0.02 a0.09 ± 0.004 b0.18 ± 0.004 c69.66 ± 0.68 ab16.98 ± 0.61 ab
Ri376.36 ± 0.15 b1.13 ± 0.06 c0.42 ± 0.01 a0.07 ± 0.003 b0.18 ± 0.007 c57.42 ± 3.55 c17.63 ± 0.17 a
DroughtNT2.21 ± 0.04 a0.32 ± 0.01 b0.33 ± 0.02 a0.12 ± 0.006 c0.14 ± 0.003 b58.09 ± 0.66 a13.93 ± 0.29 a
OE32.86 ± 0.05 a0.47 ± 0.02 a0.36 ± 0.01 a0.15 ± 0.008 ab0.17 ± 0.002 ab56.10 ± 0.39 a12.05 ± 0.22 b
OE122.27 ± 0.10 a0.45 ± 0.02 a0.33 ± 0.01 a0.17 ± 0.008 a0.20 ± 0.010 a56.70 ± 2.02 a11.83 ± 0.13 b
Ri332.50 ± 0.24 a0.37 ± 0.02 b0.34 ± 0.02 a0.13 ± 0.006 bc0.15 ± 0.005 b57.94 ± 1.50 a14.23 ± 0.42 a
Ri372.25 ± 0.26 a0.33 ± 0.01 b0.33 ± 0.01 a0.14 ± 0.006 c0.15 ± 0.005 b48.93 ± 1.20 b15.10 ± 0.46 a
Note: All data are expressed as the mean ± SE. Different lowercase letters indicate significant differences (p < 0.05).
Publisher’s Note: MDPI stays neutral with regard to jurisdictional claims in published maps and institutional affiliations.

