Article

Glucose Increases the Abundance of Phosphate Solubilizing Bacterial Community for Better Apple Seedling Growth and Phosphate Uptake

1
Xuzhou Institute of Agricultural Sciences of the Xuhuai District of Jiangsu Province, Xuzhou 221131, China
2
State Key Laboratory of Crop Biology, College of Horticulture Science and Engineering, Shandong Agricultural University, Taian 271018, China
3
Tongshan Test Station, Xuzhou Institute of Agricultural Sciences of the Xuhuai District of Jiangsu Province, Xuzhou 221121, China
*
Authors to whom correspondence should be addressed.
These authors contributed equally to this work.
Submission received: 14 April 2022 / Revised: 12 May 2022 / Accepted: 13 May 2022 / Published: 14 May 2022
(This article belongs to the Special Issue Nutrient Management in Orchards)

Abstract

:
Phosphorus-solubilizing microorganisms play an important role in soil nutrient phosphorus cycling. In order to clarify the effect of glucose (C6H12O6) on soil phosphorus transformation, the effects of glucose additions on the bacterial community, soil phosphorus status, and plant phosphorus uptake in apple rhizosphere soil were investigated. A 90-day pot experiment was carried out, and the experiment was repeated three times. Glucose additions were 0, 2.5, 5, 7.5, 10, and 12.5 g glucose per kg of soil. We measured soil bacteria and phosphorus related indexes using Illumina MiSeq sequencing technology and chemical methods. The results showed that when the glucose application rate was 2.5–7.5 g·kg−1, the soil total phosphorus content decreased by 4.4–7.3%; however, the soil acid phosphatase activity increased by 0.5–1.3 times, and the microbial biomass phosphorus increased by 29.1% and 37.0%. The content of Al-P and Fe-P in the rhizosphere soil decreased by 14.4 to 32.7 mg·kg−1 and 16.04 to 28.7 mg·kg−1, respectively. The compositional difference of the bacterial community became larger, and the relative abundance of 11 bacterial phyla changed significantly, among which the most significant change was found in Proteobacteria. This study also found that the relative abundances of Bacillus, Pseudomonas, Arthrobacter, and Cuprococcus increased by 0.9%, 2.2%, 2.4%, and 0.8%, respectively. Applying 7.5 g glucose per kg of soil can significantly increase the relative abundance of phosphorus solubilizing bacteria (Bacillus, Pseudomonas, Arthrobacter et al.) in rhizosphere soil, activate Al-P and Fe-P, and improve the availability of soil phosphorus.

1. Introduction

Phosphorus is one of the three essential elements for plant growth and plays an important role in the composition and energy conversion of many macromolecular compounds in plants. According to statistics, phosphorus deficiency limits the crop productivity to 40% of the world’s arable land [1]. Phosphorus deficiency seriously affects the normal growth and yield of crops and the security of food production. Phosphorus is easily absorbed and fixed by the soil, and a large amount of phosphorus applied to the soil is mainly stored in an ineffective state, resulting in a low utilization rate of phosphate fertilizers. In China, the utilization rate of phosphorus fertilizer is only 10–25% [2]. At present, the average pure phosphorus application rate in apple orchards in China is as high as 676.2 kg·ha−1 [3], and the soil phosphorus surplus is as high as 407.5 kg·ha−1, which not only causes waste of phosphorus resources, but also increases environmental risk. Therefore, making full use of a large amount of inactive phosphorus in the soil is not only an important way to reduce application phosphorus fertilizers, but also has positive significance for reducing the risk of phosphorus leaching.
It is well known that phosphorus-solubilizing microorganisms can improve soil phosphorus availability. The main mechanisms of phosphorus solubilization include proton excretion, organic acid production, and acid phosphatase synthesis [4]. Tartaric acid, acetic acid, citric acid, and other low-molecular-weight organic acids release the fixed phosphate ions by many pathways [5]. One of the important ways is reducing the pH of the rhizosphere using [6]. The hydroxyl and carboxyl groups of low molecular weight organic acids compete with cation to form a chelate, which will convert insoluble inorganic phosphorus into soluble phosphorus [7]. The release of phosphorus in soil organic matter is mainly through the action of acid phosphatase enzymes secreted by microorganisms and plant roots, which leads to dephosphorylation of phosphate ester or phosphoric anhydride bonds in organic matter [8]. At the same time, microorganisms in the soil will also release part of the phosphorus they hold in the process of metabolism, growth, and death, and the annual turnover of microbial biomass flux estimates is much larger than that of their reserves [6,9,10]. Rapid transformation of phosphorus in microbial pools may be a major source of available phosphorus pools. Therefore, soil phosphorus-dissolving microorganisms play an important role in improving the availability of soil phosphorus.
Soil organic matter in Chinese apple orchards is less than 1%, which is a “carbon-limited” planting system [11]. Chinese fruit farmers have used chemical fertilizers unreasonably and neglected organic fertilizers for a long time. The soil micro ecological environment has been seriously damaged, resulting in the decline of microbial diversity and quantity. It will also bring problems such as the decline of soil enzyme activity [12]. On the premise of fixing less phosphorus by microorganisms, how to fully mobilize phosphorus dissolving microorganisms in soil is the core problem to improve the utilization efficiency of soil phosphorus.
Spohn et al. [13] pointed out that the mineralization of organic phosphorus is not driven by the demand for phosphorus by microorganisms, but due to the demand for carbon. Studies have shown that the addition of different forms of carbon sources such as glucose, straw, organic fertilizer, and biological carbon can cause significant changes in the composition of soil microbial communities and improve microbial activity [14,15,16,17,18]. The increase of soil carbon content can improve soil physicochemical properties and improve fertilizer utilization [19,20]. This is beneficial to promote crop growth and improve yield, quality and stress resistance [21]. Due to the addition of carbon, the formation of soil aggregates is promoted, which provides a good growth environment for microorganisms, and the microorganisms are active to accelerate the nutrient transformation [22,23]. However, Zhang et al. [24] found that adding a small amount of inorganic phosphorus to the rhizosphere and reducing the c/p ratio could promote the mineralization of phytic acid by bacteria and improve plant phosphorus nutrition. Some reports also pointed out that too much carbon input in the soil would increase the risk of phosphorus leaching and reduce fertilizer utilization [25,26]. Too high soil carbon content will strengthen the retention of phosphorus by soil microorganisms, which means that soil microorganisms will compete with crops for phosphorus, and crops will be temporarily deficient in phosphorus [27].
Glucose is a low molecular weight organic carbon source with simple structure and easy to be utilized by microorganisms. Glucose does not contain nutrients such as nitrogen and phosphorus, which can avoid the influence of other elements on phosphorus solubilizing microorganisms. Therefore, we chose glucose as the carbon source of this study. Due to the limitations of traditional technology, most of the previous studies on phosphate-solubilizing microorganisms were to separate phosphate-solubilizing microorganisms and to evaluate their phosphate-solubilizing ability in the laboratory [5]. High-throughput technology can quantitatively analyze the number and species of soil phosphorus-solubilizing microorganisms under real conditions and evaluation of their dominant position in the whole microbial community [28].
At present, there are no studies using high-throughput technology to characterize the effect of soil carbon content changes on rhizosphere phosphorus-solubilizing microorganisms. Therefore, in this experiment, glucose was used as the carbon source, and high-throughput sequencing technology was used to study the effects of different glucose additions on the growth of apple seedlings (M9T337), rhizosphere soil microbial community structure, and microbial biomass carbon and phosphorus, in order to answer whether: (1) adding glucose will affect the composition of microbial communities involved in soil phosphorus transformation; and (2) whether glucose usage will affect soil phosphorus transformation.

2. Materials and Methods

2.1. Site Description and Experimental Design

The experimental site is located in the experimental station of Shandong Agricultural University (36°15′ N, 117°15′ E), Tai’an City, Shandong Province. It belongs to the temperate continental semi-humid monsoon climate zone, with an average annual temperature of 12.9 °C, an extreme maximum temperature of 40 °C, an extreme minimum temperature of −22 °C, and an annual precipitation of 600–800 mm, mainly from June to September. The soil texture is clay loam. The basic physical and chemical properties of soil were: organic matter 10.4 g·kg−1, pH 6.5, alkaline hydrolyzable nitrogen 56.4 mg·kg−1, available phosphorus 22.5 mg·kg−1, and available potassium 66.8 mg·kg−1. The experimental period was from April 2018 to July 2018, a total of 90 days. The mean monthly rainfall and temperature during the experiment are presented in Table 1.
The test material of Malus domestica was M9T337 dwarf rootstock. The test air-dried soil was put into plastic pots (pot height 25 cm, diameter 30 cm), and each pot was filled with 5 kg of soil. Before the seedlings were transplanted 0.67 g of urea, 0.6 g of potassium sulfate and different quantities of glucose were added to each pot. The seedlings with the same growth vigor were selected and planted in the pots. Each treatment was replicated three times and each replicate consisted of five apple seedlings. One apple seedling per plastic pot. The experimental treatments included: adding 0, 2.5, 5, 7.5, 10, and 12.5 g of glucose per 1 kg of soil, equivalent to the application amount of glucose per pot were 0, 12.5, 25, 37.5, 50, and 62.5 g, respectively, which were denoted as C0, C1, C2, C3, C4, and C5.

2.2. Sample Collection and Analysis

Seedlings were planted in mid-April. Soil and plant sampling were performed 90 days after treatment. In each treatment, three plants were randomly selected, and the soil adhering to the root system was obtained by the shaking off method as rhizosphere soil. A portion of each soil sample was put into polyethylene bags and stored in liquid nitrogen at −80 °C for extraction of soil DNA for high-throughput sequencing. A portion of soil was collected and brought back in zip lock bags, and fresh soil samples were passed through a 2 mm sieve to remove visible plant residues and soil macro-organisms. The soil water content was adjusted and was stored in a 4 °C refrigerator for the determination of microbial biomass and phosphorus. The rest of the soil samples were naturally air-dried at room temperature. The whole plant was sampled, and the roots, stems, and leaves were dried at 70 °C, crushed, and passed through a 60-mesh sieve to determine the phosphorus concentration of each organ.
Soil total phosphorus level was determined by H2SO4-HClO4 digestion-molybdenum-antimony resistance colorimetry. Olsen-P was determined by 0.5 mol·L−1 NaHCO3 extraction-molybdenum-antimony resistance colorimetry; plant phosphorus content was determined by the H2SO4-H2O2 digestion-vanadium-molybdenum yellow colorimetric method. Soil microbial biomass phosphorus was determined by fumigation with chloroform, 0.5 mol·L−1 NaHCO3 solution (water-soil ratio 1:20) extraction method; acid phosphatase activity was determined by the phenyl disodium phosphate colorimetric method. The soil inorganic phosphorus components were determined by the Gu et al. classification method [29].

2.3. Soil DNA Isolation

Genomic DNA was extracted from 0.25 g soil sample using TIANamp Soil DNA Kit following the manufacture’s procedures. The quality and integrity of DNA was controlled by A260/280 ratio and agarose gel electrophoresis. The genomic DNA was stored at −20 °C until PCR amplification and metagenomic sequencing were carried out.

2.4. PCR Amplifications and Illumina Library Generation

Bacterial community structures was assessed by sequencing the V3–V4 region of the 16S rRNA gene using universal primers primer pair B341F(5′-CCTACGGGNGGCWGCAG-3′) and B785R (5′-GACTACHVGGGTATCTAATCC-3′) [30] (Tm = 55 °C) and index sequence were designed. Fungus community structures was assessed by sequencing the ITS3-ITS4 region of the ITS rRNA gene using universal primers primer pair ITS3 (5′-GATGAAGAACGYAGYRAA-3′) and ITS4 (5′-TCCTCCGCTTATTGATATGC-3′) (Tm = 53 °C) and index sequence were designed. PCR amplification was conducted in a GeneAmp PCR System 9700 (Life Technologies, Carlsbad, CA, USA). Each reaction (25 μL) contained 12.5 μL 2 × KAPA HiFi HotStart ReadyMix, 0.25 umol·L−1 of each primer and 10 ng of DNA template. Thermocycling conditions consisted of an initial denaturation at 95 °C for 3 min, 25 cycles at 95 °C for 30 s, Tm for 30 s, 72 °C for 30 s, and 72 °C for 5 min. Indexes that allow sample multiplexing during sequencing were incorporated between the Illumina MiSeq adaptor and the reverse primer in the amplification reaction.
PCR amplicon libraries were prepared by combining the PCR products for each sample. After purification, the PCR products from the different samples were quantified using the Agilent 2100 Bioanalyzer System (Santa Clara, CA, USA) and then pooled at equal concentrations.

2.5. Statistical Analysis

MiSeq sequencing platform paired-end sequencing would generate two sequencing file data (fastq.gz file), the results of the two fastq.gz files were spliced together using FLASH for further analysis [31]. Then, quality control and filter on the sequences quality. Operational taxonomic units (OTUs) were formed based on sequence similarity clustering. OTUs were defined at an identity cutoff of 97%. The singleton sequence were away. RDP classifier was using to sequence classification and distribution of species taxon.
The Good’s coverage, Chao1 diversity index, Shannon diversity index and Simpson diversity index were calculated in Mothur v.1.3.3 and used to compare soil bacterial alpha diversity. For multivariate analysis of the microbial communities, a principal coordinate analysis (PCA) was performed (based on Unifrac distance) using the vegan package in R software. Significant differences in plant and soil data were identified by analysis of variance (ANOVA) using the statistical analysis system (SPSS 19.0) software. The response ratio was used to determine changes in bacterial relative abundance compared to a control with a 95% confidence interval.

3. Results

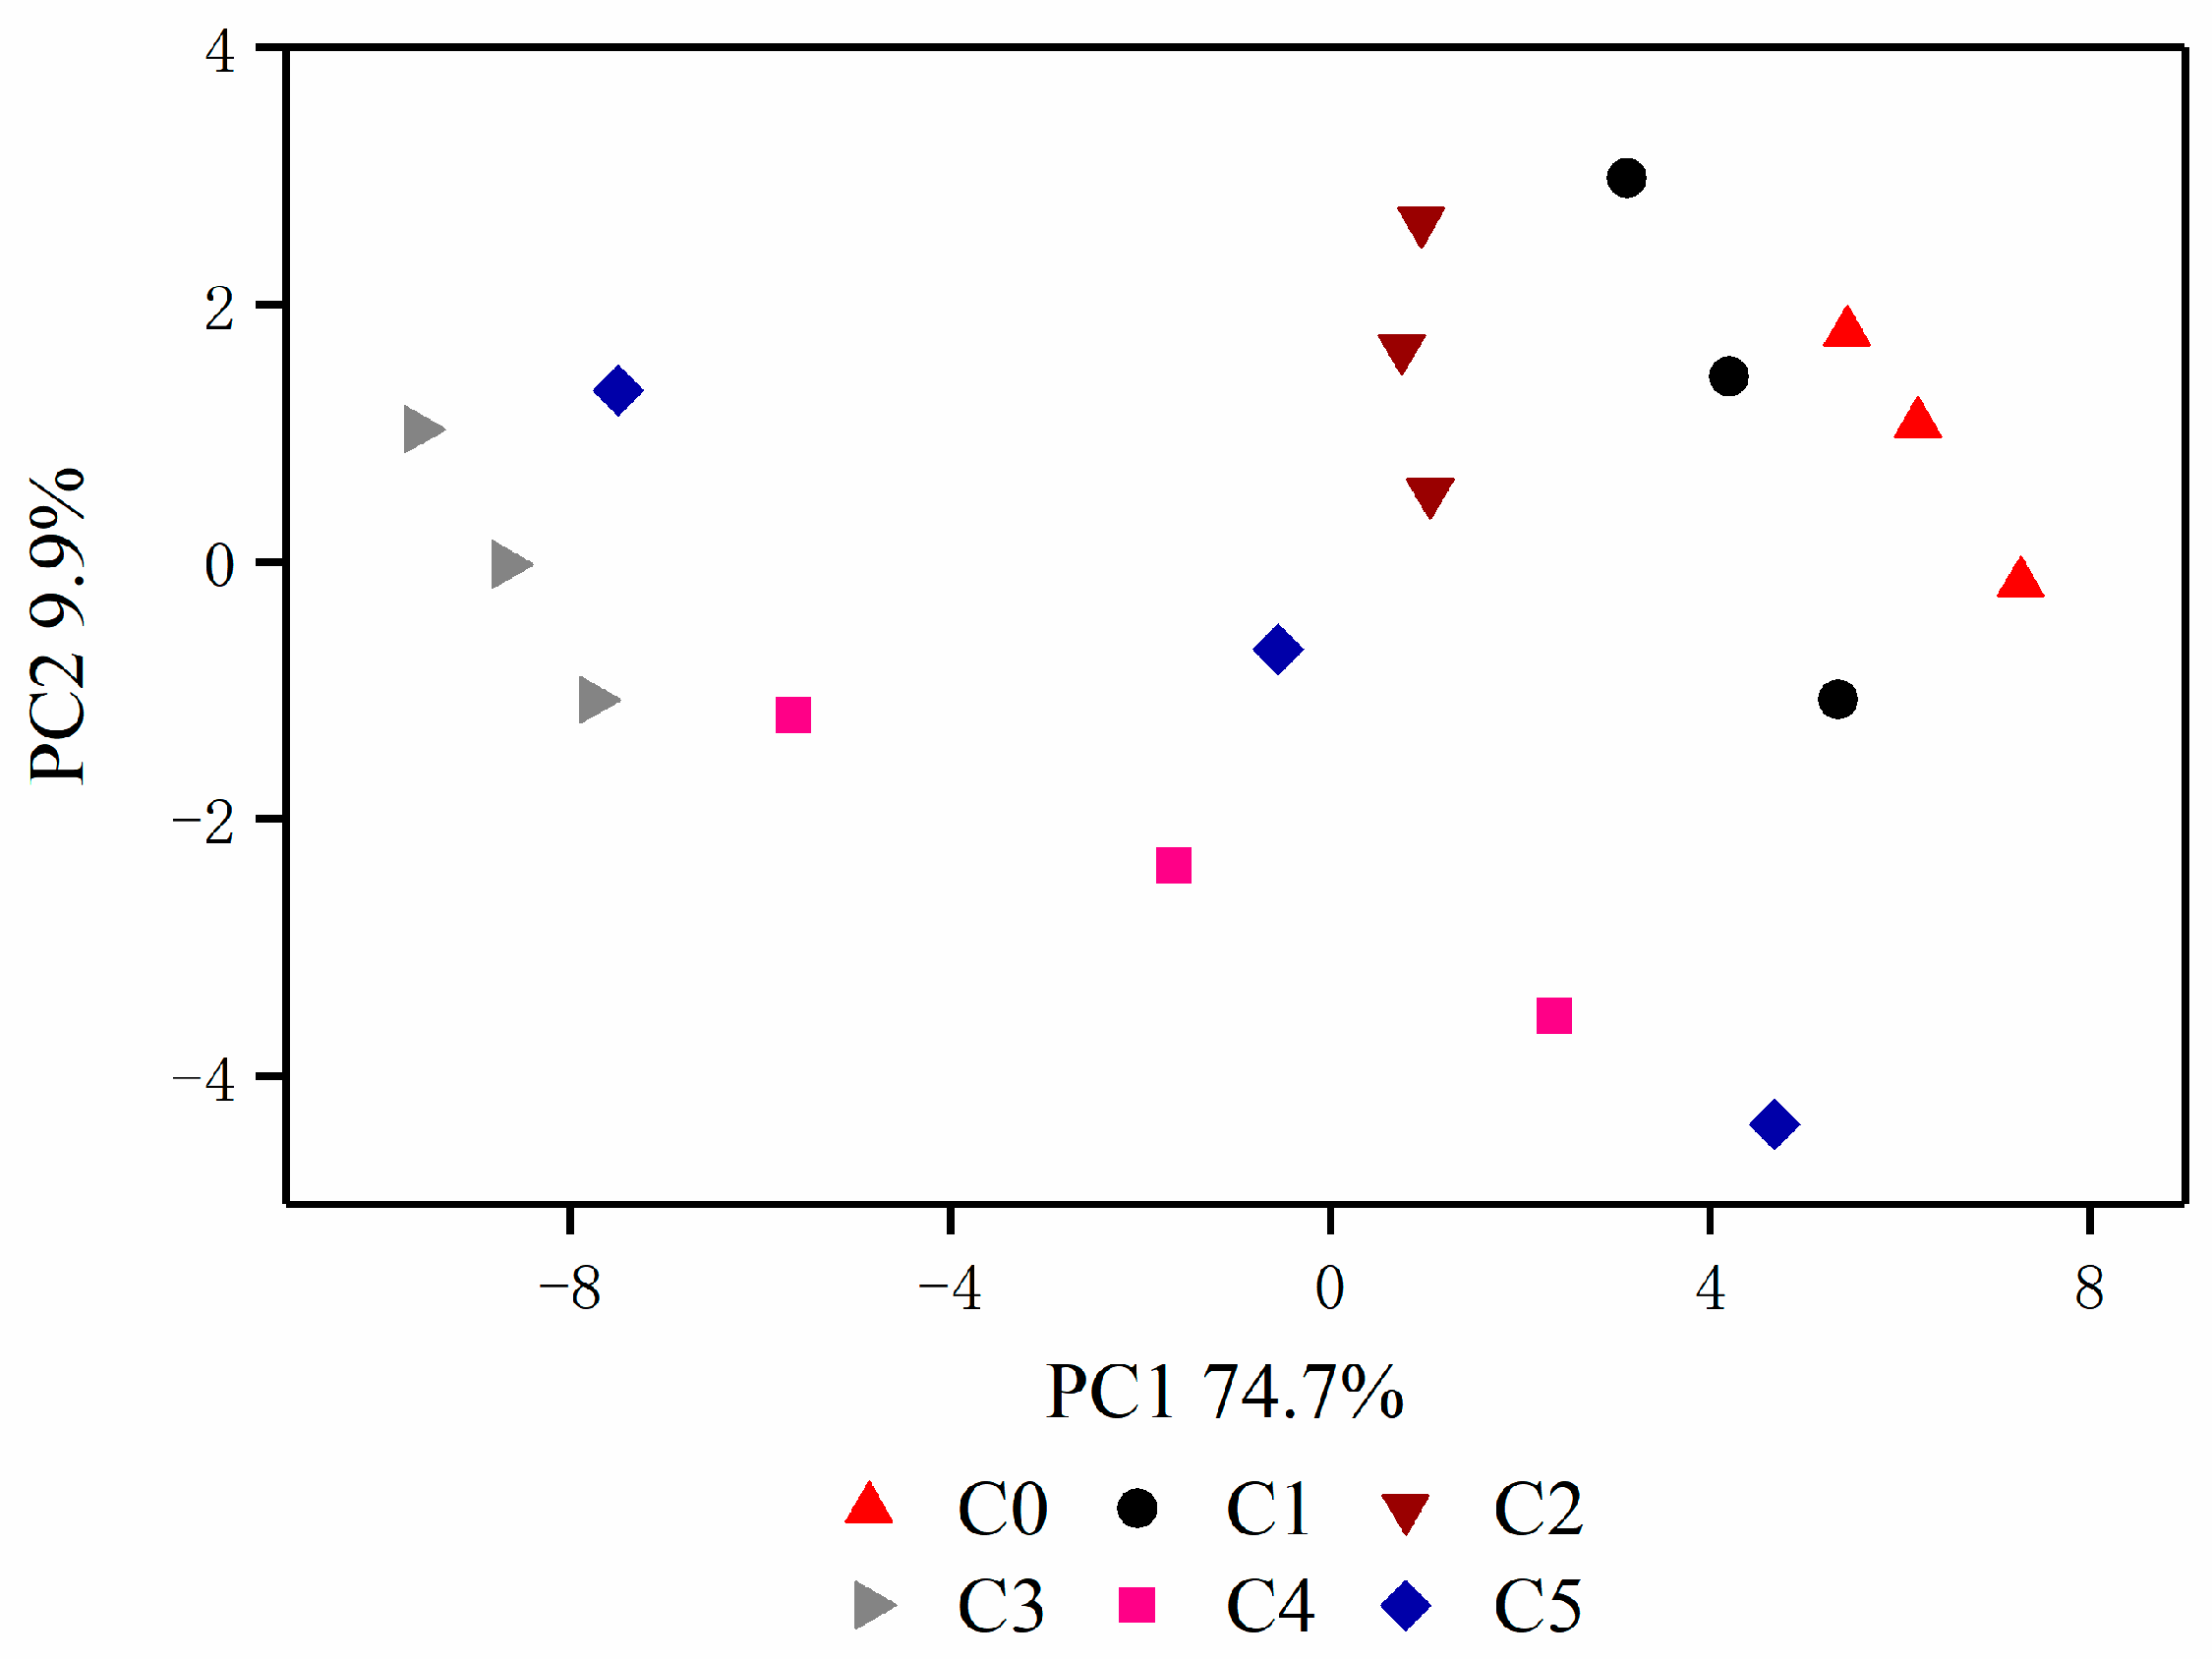
3.1. Classification and Sequencing of Bacterial Community

A total of 1,430,398 raw sequences were obtained by Illumina MiSeq sequencing. After filtering out unqualified sequences, at least 17,000 valid sequences could be obtained from each repeat. The filtered sequences were classified as operational taxonomic units (OTUs) with a similarity threshold of 97%, and the total number of OTUs obtained was 45,612. The average number of OTUs per sample was 2534. The results of bacterial community alpha diversity index analysis are shown in Table 2.
The average good coverage of each sample reached 96%, indicating that the sequencing depth can cover most bacteria. The numbers of OTUs, Chao1 index, Ace index, and Shannon index of C1 treatment were higher than those of the other treatments, but the numbers of OTUs, Chao1 index, Ace index, and Shannon index were not significantly different from those of C0. The OTUs of C2, C3, and C5 treatments were significantly lower than those of C0. The Chao1 index of C5 was significantly lower than that of C0 C1, C3 treatments. The Ace index of C0, C1, C3 were significantly higher than of C5. The Shannon index of C0 and C1 treatments was significantly higher than that of C2, C3, C4, and C5 treatments.
Principal coordinate analysis (PCA) was conducted based on relative abundance of the bacterial community at the order level (Figure 1); the variance contribution rate of the first principal component (PC1) was 74.7%, and that of the second principal component (PC2) was 9.9%. With the increase of soil glucose addition, the differences in bacterial community composition in the rhizosphere soil showed an increasing trend.

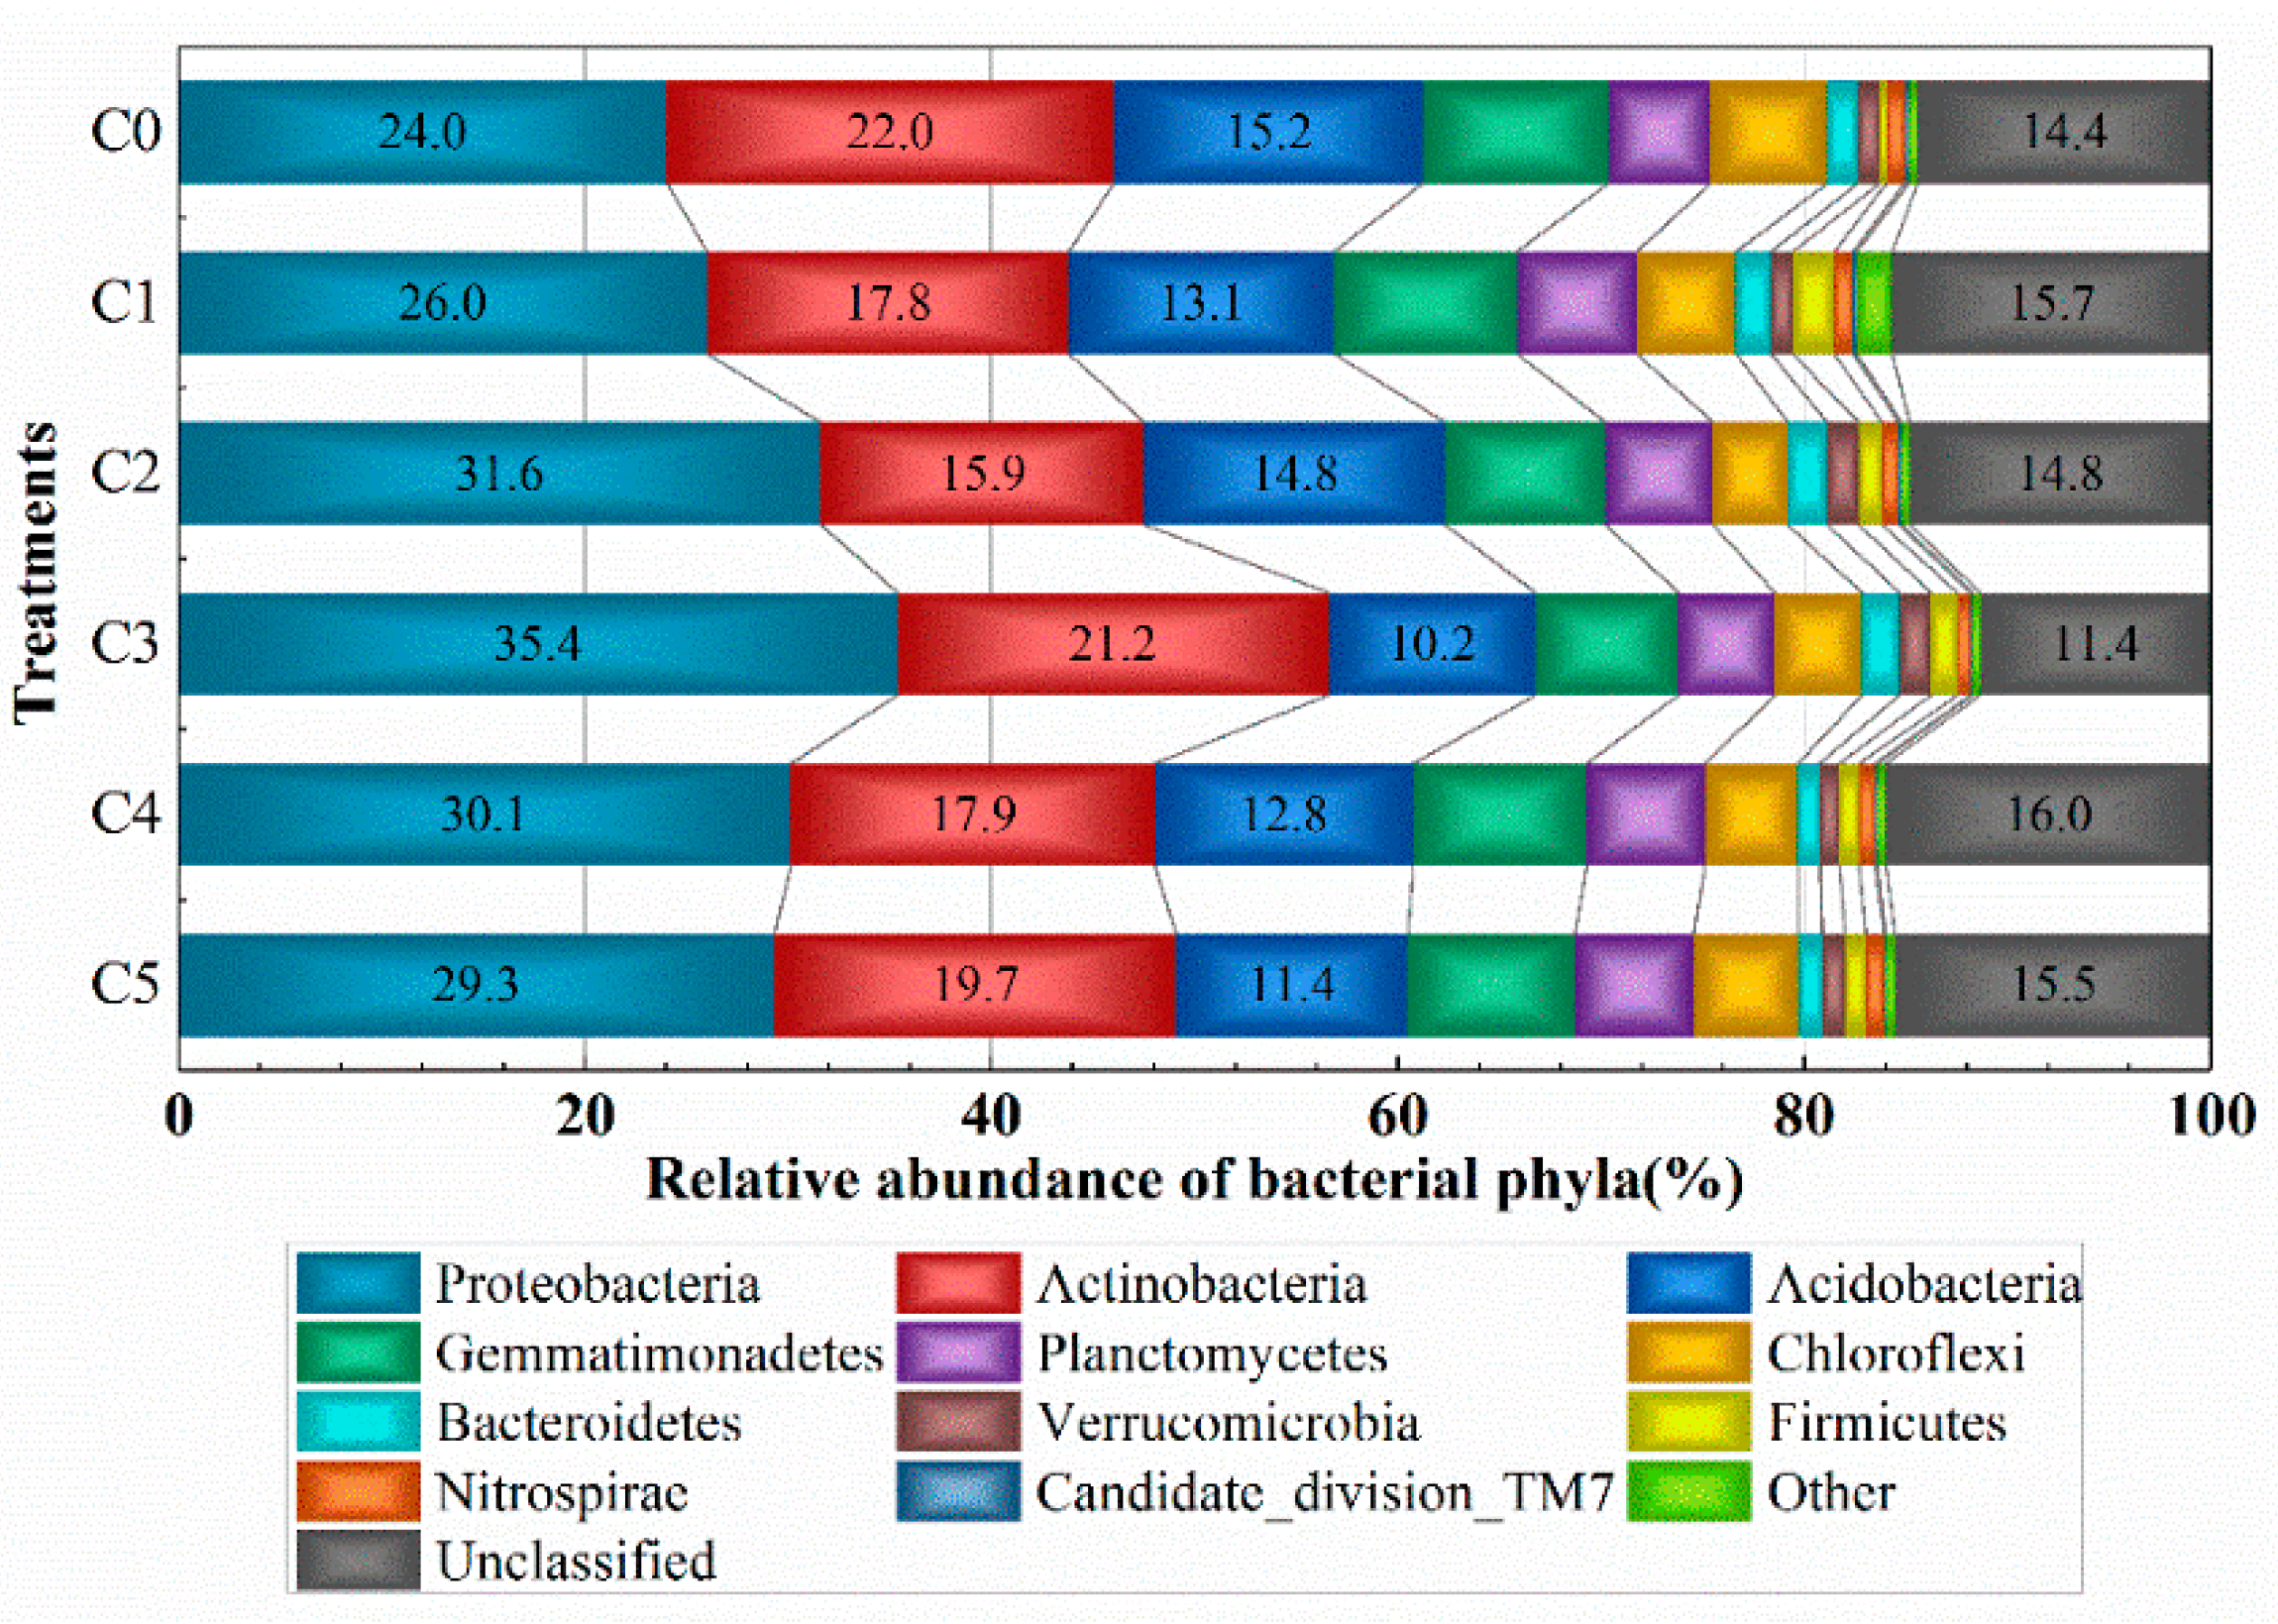
3.2. Classification and Relative Abundance of Different Taxa

The dominant bacterial phyla present in all soil samples were Proteobacteria, Actinomycetes, Acidobacteria, Bacillus, Planktoria, Chloroflexus, Bacteroides, and Firmicutes, accounting for more than 80% of all sequences. The amount of glucose added did not significantly change the main dominant bacterial phyla. Proteobacteria had the highest relative abundance in the six treatments, accounting for 21.2–35.9% of all bacteria, followed by Actinobacteria, Acidobacteria, and Bacillus (Figure 2).
There were significant differences in the relative abundance of 11 phyla among the 26 phyla during the treatments. Compared with the C0 treatment without glucose, the Proteobacteria were increased to varying degrees after the addition of glucose, and the relative abundance of Proteobacteria under the C3 treatment was significantly higher than that under the C0 treatment. In addition, the relative abundance of Firmicutes and Cyanobacteria in C1 was also significantly higher than that in C0; the relative abundance of other phyla with significant differences showed a decreasing trend after adding glucose.

3.3. Plant Growth and Phosphorus Uptake

The dry matter accumulation, phosphorus uptake, and root growth of seedlings were significantly changed under different glucose additions (Table 3). The total biomass and phosphorus uptake of plants under treatments C1, C2, and C3 were significantly higher than those of other treatments. The total root length and total root surface area were highest in C2 treatment, which increased by 138.0% and 162.2%, respectively, compared with the control. C1 treatment has the highest number of root tips, followed by C3 and C4. However, the C5 treatment with the highest glucose addition had significantly lower phosphorus uptake and root morphological indexes. It can be seen that the appropriate addition of glucose was beneficial to promote plant growth and phosphorus absorption.

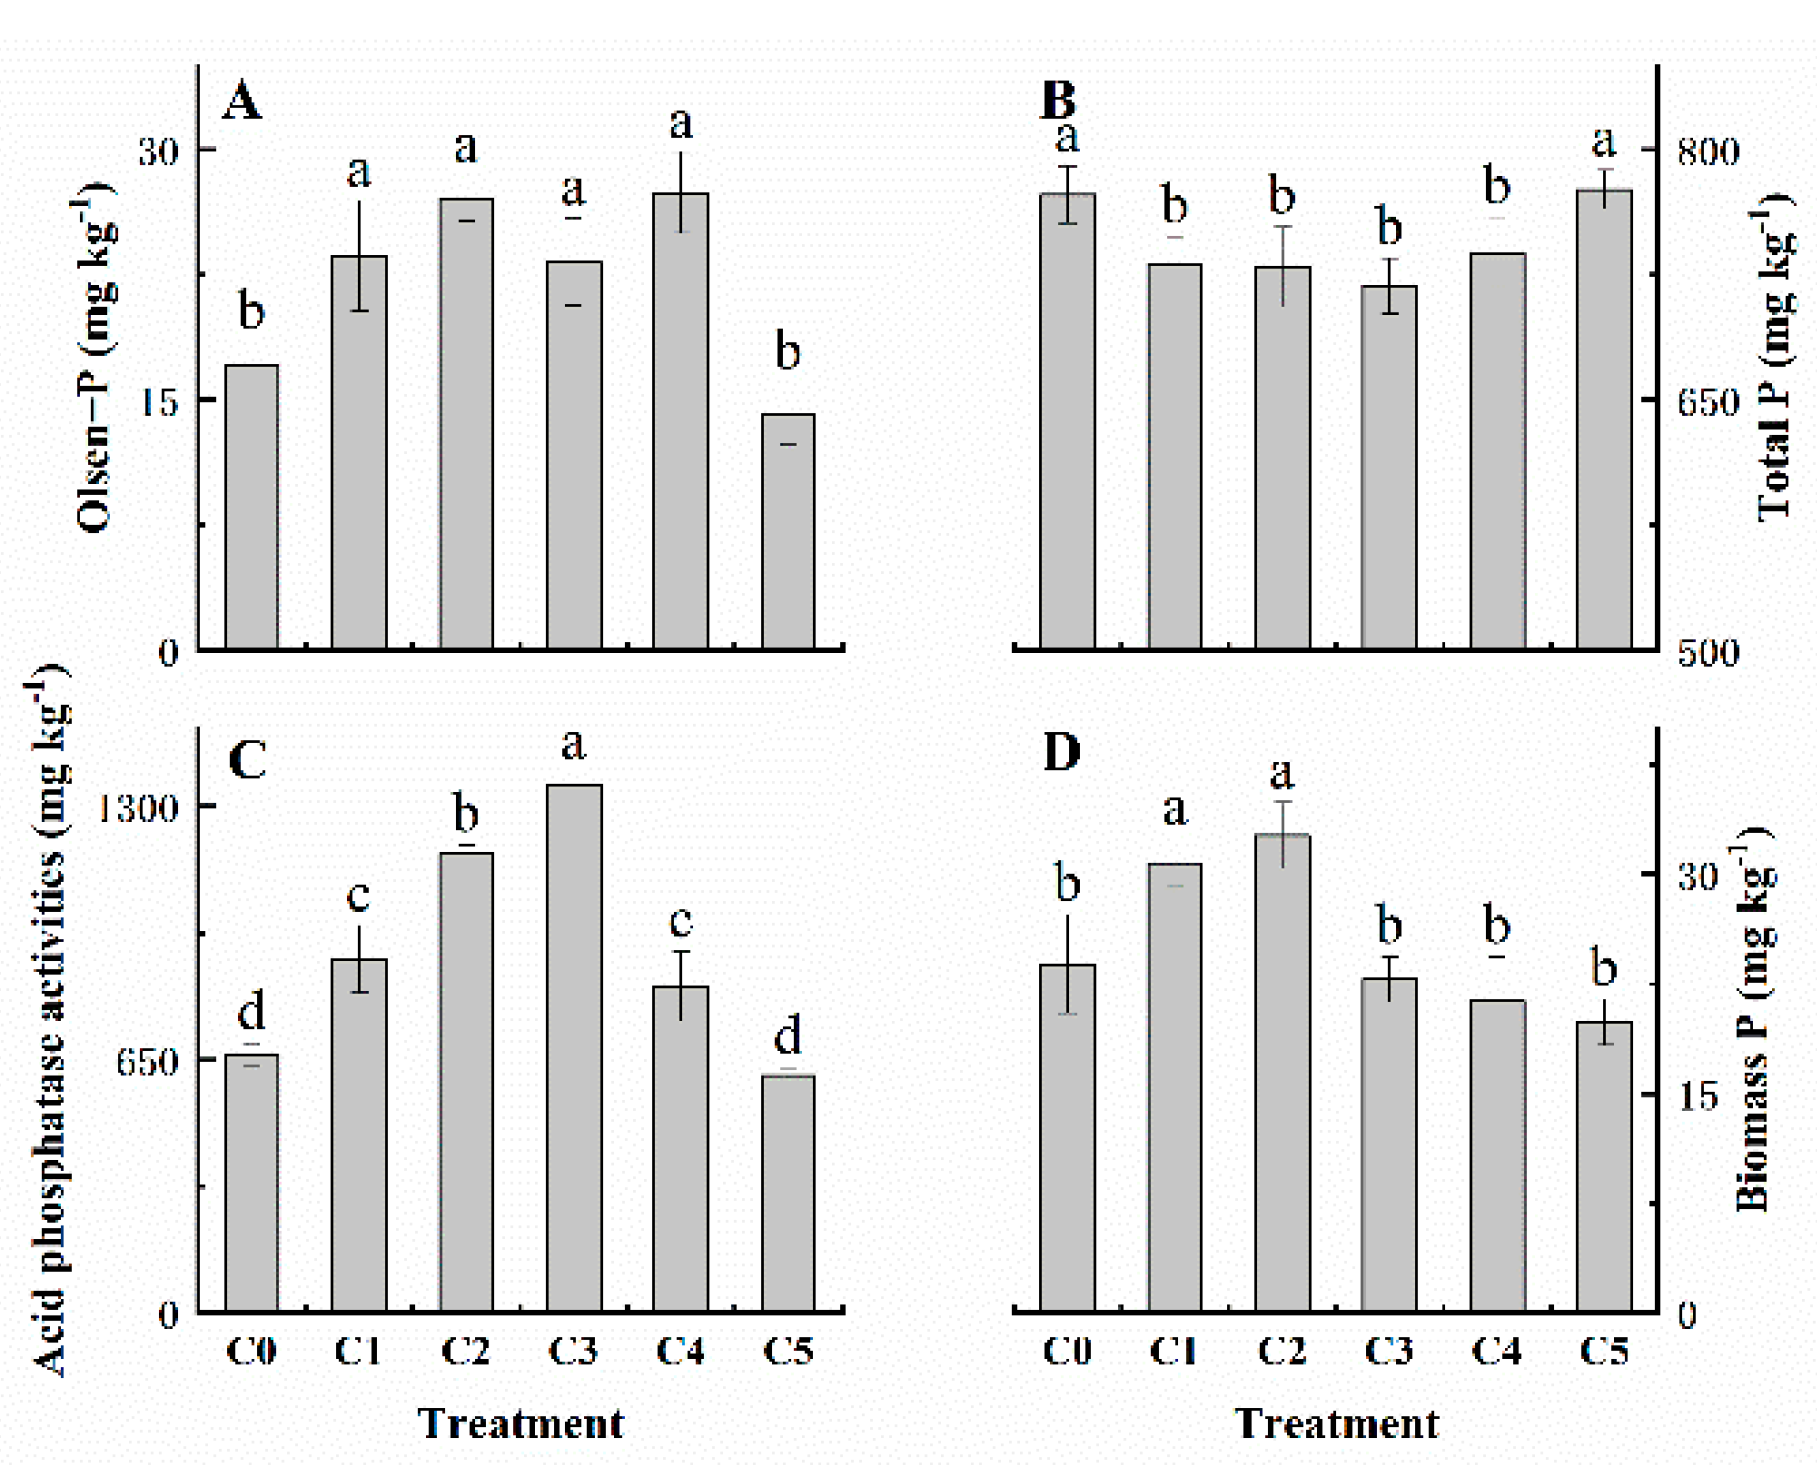
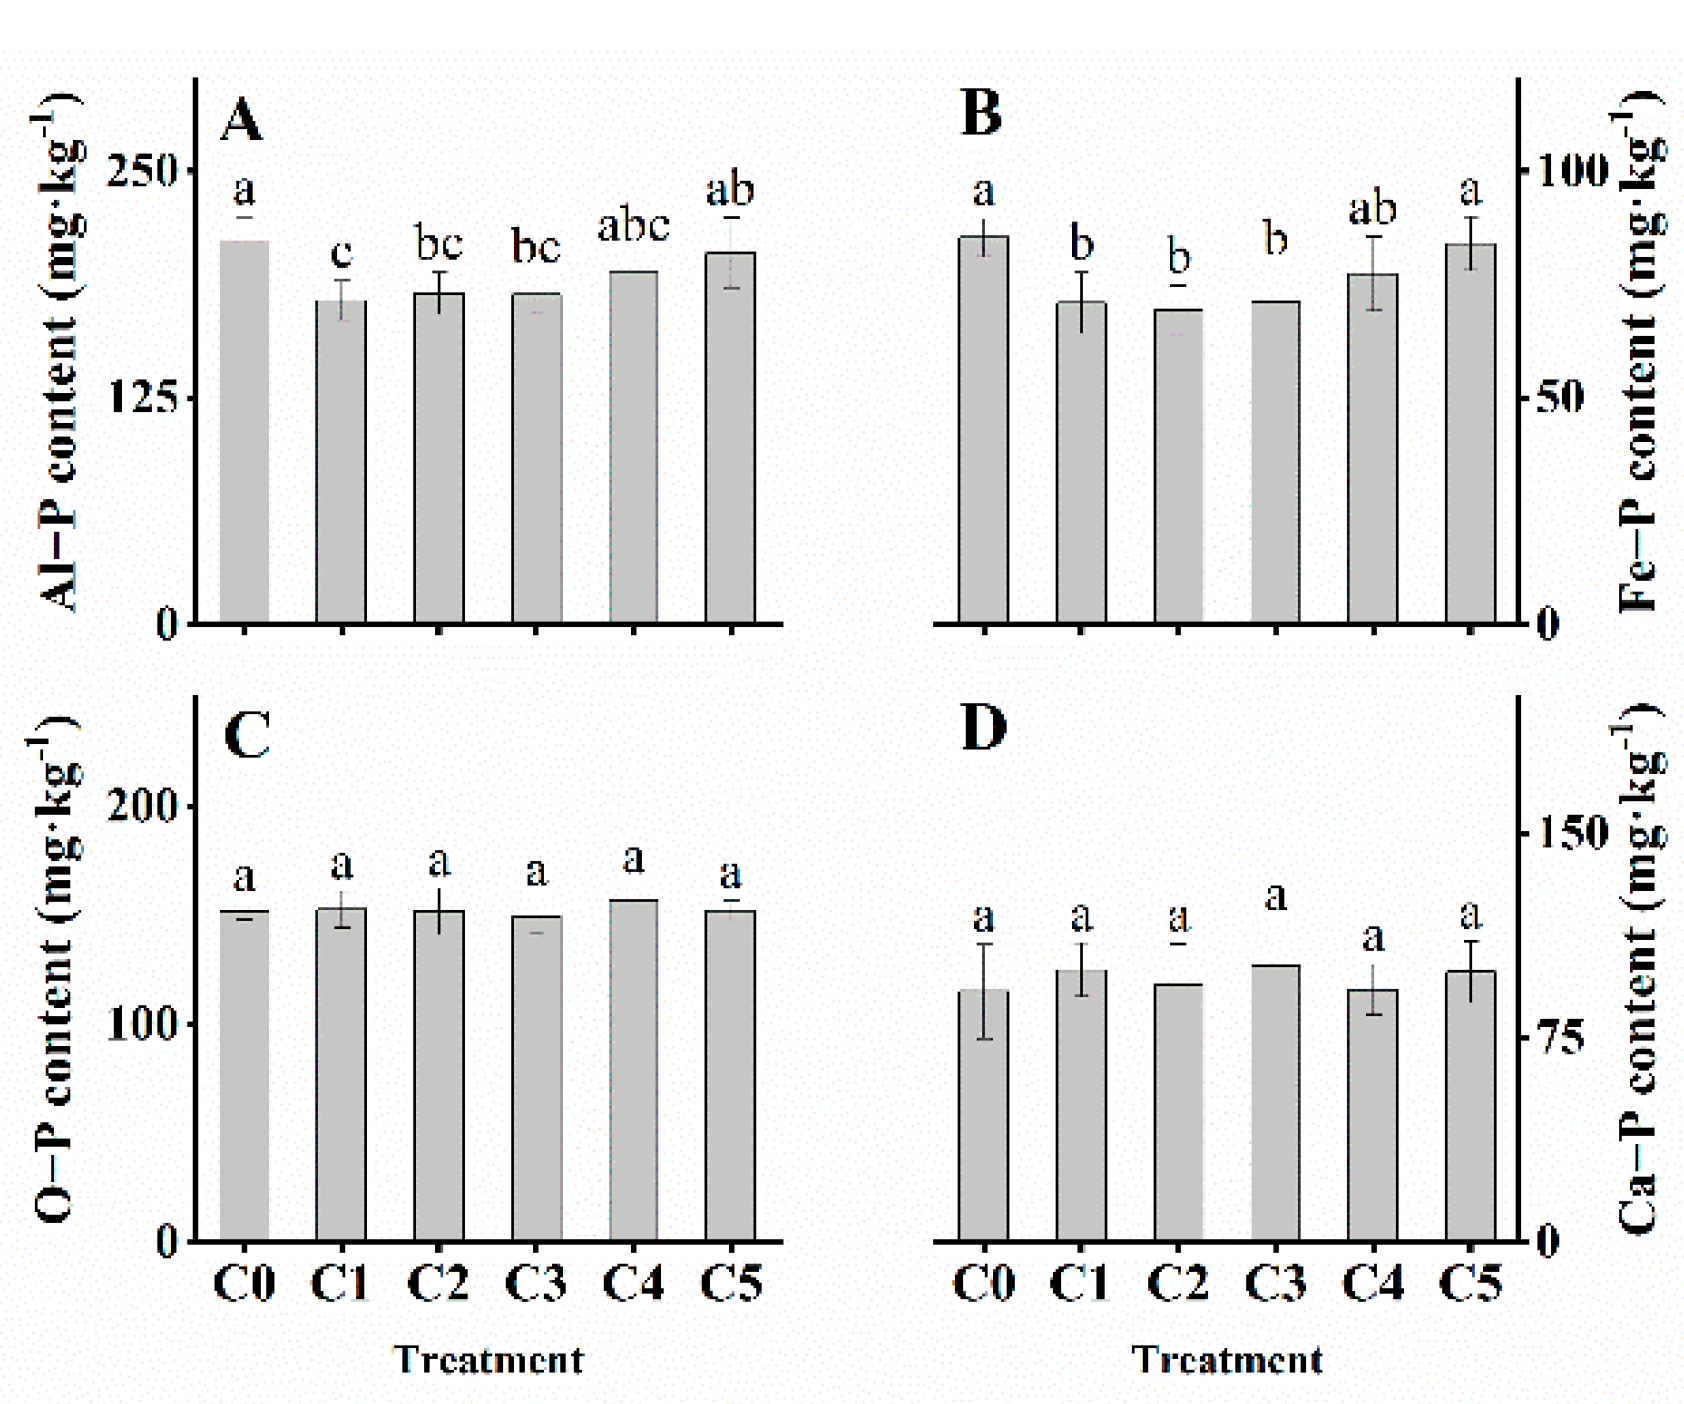
3.4. Soil Chemical Properties

It can be seen from Figure 3 that the difference between available phosphorus and total phosphorus in rhizosphere soil was significant under different treatments of glucose. The content of available phosphorus in rhizosphere soil first increased and then decreased with the increase of glucose application, while the total phosphorus content decreased and then increased. When the glucose application rate was 2.5–10 g·kg−1, the available phosphorus content in the rhizosphere soil increased by 38.6%, 58.7%, 36.4% and 60.8%. The content of C3 treatment was the lowest, 718.05 mg·kg−1, which was 54.8% lower than that of C0. After the application amount reached 12.5 g·kg−1 the content of available phosphorus decreased by 16.7%. The content of total phosphorus increased by 3.2 mg·kg−1. There was no significant difference compared with C0 treatment. The rhizosphere soil acid phosphatase activity was significantly different among different treatments. C3 treatment showing the highest, 1353 mg·kg−1, followed by C2 treatment,1176 mg·kg−1. Soil microbial biomass phosphorus in C1 and C2 treatments was significantly higher than that in other treatments, which was increased by 29.1% and 37.0%, respectively, compared with the control. There was no significant difference between C3, C4, and C5 treatments and the control.
The addition of glucose significantly affected the content of inorganic phosphorus components Al-P and Fe-P in the rhizosphere soil. It can be seen from Figure 4 that Al-P and Fe-P under the C1, C2, and C3 treatments were significantly lower than the C0 treatment. Compared with C0, Al-P in C1, C2 and C3 treatment decreased by 32.7, 28.7, and 29.6 mg·kg−1, respectively. Fe-P in C1, C2 and C3 treatment decreased by 14.4, 16.0 and 14.1 mg·kg−1 compared with CO, respectively. Compared with CO, the contents of Al-P and Fe-P in C4 and C5 treatment did not decrease significantly. There was no significant change between O-P and Ca-P treatments.

3.5. Changes and Correlation Analysis of Phosphorus-Solubilizing Microorganisms

A total of nine genera of phosphorus-solubilizing bacteria were detected in all samples, namely, Bacillus, Pseudomonas, Flavobacterium, Bradyrhizobia, Arthrobacter, Paenibacillus, Rhizobium, and Rhizobium (Figure 5). Among the cocci, Bacillus had the highest relative abundance, followed by Pseudomonas, Arthrobacter, and Cuprococcus, with an average relative abundance of 1.4%, 1.1%, 0.5%, and 0.4%, respectively. Except for Flavobacterium, Bradyrhizobia, and Rhizobium, the addition of glucose significantly increased the relative abundance of the other rhizosphere soil phosphorus-solubilizing bacteria, while the relative abundance of Flavobacterium decreased with the application of glucose. The change of soil glucose content has no obvious effect on rhizobium. The relative abundance of the other phosphate-solubilizing bacteria generally increased first and then decreased with the increase of glucose dosage. Compared with C0, the relative abundance of Bacillus, Pseudomonas, Arthrobacter, Cuprococcus, and Paenibacillus in other treatments increased by 0.9%, 2.2%, 2.4%, 0.8% and 0.1% at most.

4. Discussion

4.1. Changes in Bacterial Communities

A small amount of glucose can increase the number and diversity of bacteria in rhizosphere soil. A study by Reischke et al. [32] found that when the concentration of glucose applied per gram of soil (sandy loamy brown earth soil) lower than 4 mg C, it mainly stimulates bacterial growth, which is similar to this experiment. This may be due to the fact that a large amount of glucose stimulates the proliferation of dominant heterotrophic bacteria such as Proteobacteria, and its antagonistic effect inhibits the growth of other bacteria [33,34]. However, Falchini et al. [14] found the diversity bacterial community in sandy soil did not increase after adding glucose. De Graaff et al. [35] added seven different concentrations of glucose to coarse silica sand and found that glucose only increased microbial metabolic activity. This may be due to the different responses of bacterial communities in different soil types to glucose concentrations.

4.2. Changes in Soil Phosphorus Availability

The addition of glucose stimulated the growth of phosphate-solubilizing bacteria in the rhizosphere soil [33]. There are large number of phosphorus-dissolving microorganisms in plant rhizosphere soil, and the number of bacteria with phosphorus-solubilizing ability accounting for 1% to 50% of the total number of microorganisms in the soil [36]. Phosphorus bacteria accounted for 0.9% to 6.2% of the total number of bacteria. Soil microbial activity is usually limited by carbon, and low-molecular-weight and easily degradable organic carbon has a strong stimulating effect on it [37]. The numbers have increased to varying degrees, improving the understanding of the dominant position of phosphorus bacteria. The traditional view is that most bacteria mainly utilize activated carbon sources with a simple structure in the soil, for example r-strategic microorganisms, which have the characteristics of high growth rate and relatively high nutrient requirements [38]. When glucose is applied externally, the energy limitation is relieved, allowing it to proliferate rapidly. In the case of relatively deficient soil phosphorus, due to the advantages of phosphate-solubilizing bacteria in dissolving, absorbing, and utilizing limited phosphorus sources, these bacteria can remain competitive and expand in the presence of phosphorus-deficiency when an appropriate amount of glucose is added, so the relative abundance of phosphorus-solubilizing bacterial population increases significantly [39].
After being stimulated by glucose to proliferate, phosphate-solubilizing bacteria promoted the transformation and circulation of soil phosphorus. Glucose can promote the transformation and utilization of Al-P and Fe-P in rhizosphere soil to inorganic phosphorus. Studies have also shown that glucose can desorb phosphorus adsorbed on aluminum and iron oxides in brick red soil, and the amount of phosphorus desorption increased by 67% and 80% [40]. In this study, it was found that the content of Al-P and Fe-P in the rhizosphere soil was significantly reduced by the addition of an appropriate amount of glucose. Wu et al. [41] added glucose (2 g C kg–1 soil) to the strongly weathered subtropical soil for organic improvement, and found that soil Al-P and Fe-P contents decreased by 3.8 mg·kg−1 and 10.9 mg·kg−1, respectively, similar to the results of this study. The secretion of low-molecular-weight organic acids is the main means for microorganisms to dissolve insoluble inorganic phosphate in the soil [6]. Carbon sources can affect the secretion of organic acids through the process of microbial carbon metabolism [42]. Glucose cannot only be used as an energy substance to stimulate the activity of phosphate-solubilizing microorganisms and increase the secretion of organic acids, but also phosphate-solubilizing ability [43]. Glucose can also be directly oxidized to gluconic acid by some Gram-negative bacteria through enzymes located in the periplasmic space. 2-keto-D-gluconic acid, while gluconic acid is considered to be one of the most common organic acids produced by phosphate-solubilizing bacteria, has a strong ability to dissolve inorganic phosphorus [5,44].
The mineralization of soil organic phosphorus depends on the enzymatic action of soil phosphatase, and the phosphatase secreted by microorganisms is an important source of soil acid phosphatase. It has also been reported that phosphorus mineralization is not caused by microbial demand for phosphorus, and microbial phosphorus mineralization may be a side effect of microbial carbon acquisition [45]. Spohn et al. [13] found that soil acid phosphatase was increased after adding glucose (12 mg C g−1 soil). Organophosphorus activity increased four-fold, but total mineralization rate increased twenty-fold. It can be seen that the addition of glucose can significantly improve the mineralization rate of soil organic phosphorus.

4.3. Changes in Plant Phosphorous

The traditional view is that a too high C/P ratio in the soil will lead to competition between plants and microorganisms for phosphorus, which is not conducive to the absorption of phosphorus by plants [7]. Zhang et al. [24] added a small amount of inorganic phosphorus to the rhizosphere to reduce the C/P ratio, and found that the mineralization of phytic acid by bacteria was promoted, and the phosphorus nutrition of plants was improved. In this experiment, C1 treatment (2.5 g glucose kg−1 soil) and C2 treatment (5 g glucose kg−1 soil) also significantly increased rhizosphere microbial biomass phosphorus. However, the difference was that the rhizosphere soil available phosphorus level and the total phosphorus absorption of plants were not greatly affected, which were significantly higher than those without glucose treatment. In one study, Spohn et al. [13] pointed out that although root exudates (glucose, alanine, and methionine) can make microorganisms absorb a large amount of available phosphorus in a short time, the microbial biomass phosphorus concentration did not continue to increase in the next two weeks. The microorganism’s phosphorus is only activated at a higher rate without changing the rate of phosphorus absorption, and this part of phosphorus is eventually released. Similarly, rhizosphere microbes have recently been shown to fix nitrogen faster than plants and subsequently release nitrogen slowly [46]. Therefore, the first rapid fixation of phosphorus in microbial biomass and subsequent release of phosphorus may ultimately be beneficial to plants.
Glucose can indirectly promote plant growth to improve phosphorus absorption capacity. In addition, glucose also stimulates the proliferation of phosphorus-aware bacteria, and phosphorus-solubilizing bacteria can not only improve the phosphorus nutrition level of plants, but also benefit plants as rhizosphere growth-promoting bacteria by dissolving other nutrients, secreting hormones, and antagonizing pathogenic bacteria. For example, Bacillus rhizogenesis has been shown to produce indole acetic acid (IAA), siderophores, phytases, organic acids, 1-aminocyclopropane-l-carboxylate (ACC) deaminase, cyanogen, lysozyme, and oxalate oxidase, and to dissolve various sources of organic and inorganic phosphate, potassium, and zinc [47]. Studies have also shown that glucose can directly act as a signal molecule to regulate the occurrence of lateral roots, and lower concentrations of glucose can promote the occurrence of roots [48], which is beneficial to the absorption of phosphorus [49].

5. Conclusions

(1) Glucose can stimulate the proliferation of some phosphate-solubilizing bacteria (Bacillus, Pseudomonas, Arthrobacter, Cuprococcus, Paenibacillus and Rhizobacter); (2) phosphorus solubilizing bacteria in apple rhizosphere had strong ability to dissolve Al-P and Fe-P; and (3) applying 2.5–7.5 g glucose per kg of soil can significantly improve the phosphorus absorption of apple seedlings. In future studies, the effects of different genotypes or varieties, planting time, and environmental changes on phosphorus-dissolving microorganisms should also be considered.

Author Contributions

Conceptualization, Y.J., S.G., Z.J. and L.Z.; methodology, Z.J. and L.Z.; validation, Z.J. and L.Z.; formal analysis, Z.J. and L.Z.; investigation, Z.J. and L.Z.; resources, Y.J. and S.G.; data curation, Z.J. and X.X.; writing—original draft preparation, Z.J.; writing—review and editing, Z.J., L.Z., J.Z., W.J. and M.W.; supervision, S.G.; project administration, Y.J. and S.G.; funding acquisition, S.G. All authors have read and agreed to the published version of the manuscript.

Funding

This work was supported by the Ministry of Finance and Ministry of Agriculture and Rural Affairs: The China Agriculture Research System (CARS-27), the Taishan Scholar Assistance Program from Shandong Provincial Government (TSPD20181206), and the National Key R&D Program of China “Technology Boosts Economy 2020” (2020YFF0426464).

Data Availability Statement

Not applicable.

Conflicts of Interest

The authors declare no conflict of interest.

References

  1. Balemi, T.; Negisho, K. Management of soil phosphorus and plant adaptation mechanisms to phosphorus stress for sustainable crop production: A review. J. Soil Sci. Plant Nutr. 2012, 12, 547–562. [Google Scholar] [CrossRef] [Green Version]
  2. Wang, Y.Z.; Cheng, Y.; Shi, Y. Phosphorus availability in cropland soils of China and related affecting factors. J. Appl. Ecol. 2013, 24, 260–268. [Google Scholar]
  3. Zhu, Z.L.; Xia, Y.; Liu, J.J.; Ge, S.F.; Jiang, Y.M. Analysis of Soil Phosphorus Input and Phosphorus Environment Load Risk in Major Apple Production Regions of Shandong Province. Acta Hortic. Sin. 2017, 44, 97–105. [Google Scholar]
  4. Zhu, J.; Li, M.; Whelan, M. Phosphorus activators contribute to legacy phosphorus availability in agricultural soils: A review. Sci. Total Environ. 2018, 612, 522–537. [Google Scholar] [CrossRef] [Green Version]
  5. Sharma, S.B.; Sayyed, R.Z.; Trivedi, M.H.; Gobi, T.A. Phosphate solubilizing microbes: Sustainable approach for managing phosphorus deficiency in agricultural soils. Springerplus 2013, 2, 587. [Google Scholar] [CrossRef] [Green Version]
  6. Khan, M.S.; Zaidi, A.; Ahmad, E. Mechanism of Phosphate Solubilization and Physiological Functions of Phosphate-Solubilizing Microorganisms; Springer International Publishing: Cham, Switzerland, 2014; pp. 31–62. [Google Scholar]
  7. Jenkinson, D.S. Cycles of Soils. Carbon, Nitrogen Phosphorus, Sulfur, Micronutrients; Wiley: New York, NY, USA, 1986. Available online: https://www.vgls.vic.gov.au/client/en_AU/VGLS-public/search/detailnonmodal/ent:$002f$002fSD_ILS$002f0$002fSD_ILS:28092/ada?qu=Soil+dynamics.&d=ent%3A%2F%2FSD_ILS%2F0%2FSD_ILS%3A28092%7EILS%7E44&ps=300&h=8 (accessed on 1 April 2022).
  8. Yadav, B.K.; Tarafdar, J.C.; Panwar, J. Microbial dynamics in rhizosphere of fruit plants during summer and monsoon in arid environment. Indian J. Hortic. 2011, 68, 161–169. [Google Scholar]
  9. Chen, C.R.; Condron, L.M.; Davis, M.R.; Sherlock, R.R. Seasonal changes in soil phosphorus and associated microbial properties under adjacent grassland and forest in New Zealand. For. Ecol. Manag. 2003, 177, 539–557. [Google Scholar] [CrossRef]
  10. Agbenin, J.O.; Adeniyi, T. The microbial biomass properties of a savanna soil under improved grass and legume pastures in northern Nigeria—ScienceDirect. Agric. Ecosyst. Environ. 2005, 109, 245–254. [Google Scholar] [CrossRef]
  11. Liu, S.Z.; Zhang, Q.; Zhao, C.J.; Bi, N.N.; Wang, X.W. Effect of Soil Organic Matter on Soil Characteristics and Fruit Quality in Orchard. J. Anhui Agric. Sci. 2010, 38, 21104–21106. [Google Scholar]
  12. Shen, F.; Wu, J.; Fan, H.; Liu, W.; Guo, X.; Duan, H.; Hu, L.; Lei, X.; Wei, X. Soil N/P and C/P ratio regulate the responses of soil microbial community composition and enzyme activities in a long-term nitrogen loaded Chinese fir forest. Plant Soil 2019, 436, 1–17. [Google Scholar] [CrossRef]
  13. Spohn, M.; Ermak, A.; Kuzyakov, Y. Microbial gross organic phosphorus mineralization can be stimulated by root exudates—A 33P isotopic dilution study. Soil Biol. Biochem. 2013, 65, 254–263. [Google Scholar] [CrossRef]
  14. Falchini, L.; Naumova, N.; Kuikman, P.J.; Bloem, J.; Nannipieri, P. CO2 evolution and denaturing gradient gel electrophoresis profiles of bacterial communities in soil following addition of low molecular weight substrates to simulate root exudation. Soil Biol. Biochem. 2003, 35, 775–782. [Google Scholar] [CrossRef]
  15. Nguyen, T.T.N.; Wallace, H.M.; Xu, C.Y.; Van Zwieten, L.; Weng, Z.H.; Xu, Z.; Che, R.; Tahmasbian, I.; Hu, H.W.; Bai, S.H. The effects of short term, long term and reapplication of biochar on soil bacteria. Sci. Total Environ. 2018, 636, 142–151. [Google Scholar] [CrossRef]
  16. Yao, Q.; Liu, J.; Yu, Z.; Li, Y.; Jin, J.; Liu, X.; Wang, G. Changes of bacterial community compositions after three years of biochar application in a black soil of northeast China. Appl. Soil Ecol. 2017, 113, 11–21. [Google Scholar] [CrossRef]
  17. Cheng, C.G.; Zhao, D.Y.; Lv, D.G.; Jiang, M.; Du, G.D. Effects of plant-derived organic materials and humification driving forces on soil microbial community diversity in orchards. Plant Nutr. Fertil. Sci. 2014, 20, 913–922. [Google Scholar]
  18. Tian, W.; Wang, L.; Li, Y.; Zhuang, K.; Li, G.; Zhang, J.; Xiao, X.; Xi, Y. Responses of microbial activity, abundance, and community in wheat soil after three years of heavy fertilization with manure-based compost and inorganic nitrogen. Agric. Ecosyst. Environ. 2015, 213, 219–227. [Google Scholar] [CrossRef]
  19. Jeffery, S.; Verheijen, F.G.; van der Velde, M.; Bastos, A.C. A quantitative review of the effects of biochar application to soils on crop productivity using meta-analysis. Agric. Ecosyst. Environ. 2011, 144, 175–187. [Google Scholar] [CrossRef]
  20. Abdallahi, M.M.; N’Dayegamiye, A. Effects of two incorporations of green manures on soil physical and biological properties and on wheat (Triticum aestivum L.) yields and N uptake. Can. J. Soil Sci. 2000, 80, 81–89. [Google Scholar] [CrossRef] [Green Version]
  21. Bowden, C.L.; Evanylo, G.K.; Zhang, X.; Ervin, E.H.; Seiler, J.R. Soil Carbon and Physiological Responses of Corn and Soybean to Organic Amendments. Compost Sci. Util. 2010, 18, 162–173. [Google Scholar] [CrossRef]
  22. Chen, X.; Li, Z.; Liu, M.; Jiang, C.; Che, Y. Microbial community and functional diversity associated with different aggregate fractions of a paddy soil fertilized with organic manure and/or NPK fertilizer for 20 years. J. Soils Sediments 2015, 15, 292–301. [Google Scholar] [CrossRef]
  23. Young, I.; Crawford, J.; Nunan, N.; Otten, W.; Spiers, A. Microbial Distribution in Soils: Physics and Scaling. Adv. Agron. 2008, 100, 81–121. [Google Scholar]
  24. Zhang, L.; Ding, X.; Chen, S.; He, X.; Zhang, F.; Feng, G. Reducing carbon: Phosphorus ratio can enhance microbial phytin mineralization and lessen competition with maize for phosphorus. J. Plant Interact. 2014, 9, 850–856. [Google Scholar] [CrossRef]
  25. Ge, S.F.; Zhou, L.; Men, Y.G.; Li, H.N.; Wei, S.C.; Jiang, Y.M. Effect of Carbon Application on Nitrogen and Phosphorus Leaching in Apple Orchard Soil. J. Soil Water Conserv. 2013, 27, 31–35. [Google Scholar]
  26. Ding, X.D.; Zhang, S.R.; Lou, J.H.; Wang, Z.H.; Li, Y.; Zhang, L.; Wang, K.R. Effects of Combined Organic Manure and Phosphorus Fertilizer on the Phosphorus Leaching Risk in Coastal Saline Soil. Ecol. Environ. 2016, 25, 1169–1173. [Google Scholar]
  27. Song, Q.; Li, F.; Liu, H.; Wang, J.; Li, S. Effect of plastic film mulching on soil microbial biomass in spring wheat field in semi-arid loess area. J. Appl. Ecol. 2003, 9, 1512–1516. [Google Scholar]
  28. Fernando, P.S.; Jacobo, A.; Víctor, P. A novel conceptual approach to read-filtering in high-throughput amplicon sequencing studies. Nucleic Acids Res. 2015, 44, e40. [Google Scholar]
  29. Gu, Y.; Jiang, B. Determination of inorganic phosphorus classification in calcareous soil. Soils 1990, 101–102, 110. [Google Scholar]
  30. Anna, K.; Elmar, P.; Timmy, S.; Jrg, P.; Christian, Q.; Matthias, H.; Oliver, G.F. Evaluation of general 16S ribosomal RNA gene PCR primers for classical and next-generation sequencing-based diversity studies. Nucleic Acids Res. 2012, 41, e1. [Google Scholar]
  31. Mago, T.; Salzberg, S.L. FLASH: Fast Length Adjustment of Short Reads to Improve Genome Assemblies. Bioinformatics 2011, 27, 2957–2963. [Google Scholar] [CrossRef]
  32. Reischke, S.; Rousk, J.; Bth, E. The effects of glucose loading rates on bacterial and fungal growth in soil. Soil Biol. Biochem. 2014, 70, 88–95. [Google Scholar] [CrossRef]
  33. Rinnan, R.; Baath, E. Differential Utilization of Carbon Substrates by Bacteria and Fungi in Tundra Soil. Appl. Environ. Microbiol. 2009, 75, 3611–3620. [Google Scholar] [CrossRef] [PubMed] [Green Version]
  34. Marianne, K.; Christina, K.; Lucia, F.; Barbara, K.; Angela, S.; Sophie, Z.B.; Andreas, R. Fungal and bacterial utilization of organic substrates depends on substrate complexity and N availability. FEMS Microbiol. Ecol. 2014, 87, 142–152. [Google Scholar]
  35. De Graaff, M.A.; Classen, A.T.; Castro, H.F.; Schadt, C.W. Labile soil carbon inputs mediate the soil microbial community composition and plant residue decomposition rates. New Phytol. 2010, 188, 1055–1064. [Google Scholar] [CrossRef] [PubMed] [Green Version]
  36. Kishore, N.; Pindi, P.K.; Reddy, S.R. Phosphate-Solubilizing Microorganisms: A Critical Review; Springer: New Delhi, India, 2015. [Google Scholar]
  37. Nobili, M.; Contin, M.; Mondini, C.; Brookes, P.C. Soil microbial biomass is triggered into activity by trace amounts of substrate. Soil Biol. Biochem. 2001, 33, 1163–1170. [Google Scholar] [CrossRef]
  38. el Zahar Haichar, F.; Santaella, C.; Heulin, T.; Achouak, W. Root exudates mediated interactions belowground. Soil Biol. Biochem. 2014, 77, 69–80. [Google Scholar] [CrossRef]
  39. Cleveland, C.C.; Nemergut, D.R.; Schmidt, S.K.; Townsend, A.R. Increases in soil respiration following labile carbon additions linked to rapid shifts in soil microbial community composition. Biogeochemistry 2007, 82, 229–240. [Google Scholar] [CrossRef]
  40. De Araújo, L.M.C.; Sampaio, E.V.D.S.B.; De Araújo, M.D.S.B. Phosphorus Desorption from Fe and Al Oxides Mediated by Soil Microorganisms. Commun. Soil Sci. Plant Anal. 2015, 46, 633–640. [Google Scholar] [CrossRef]
  41. Wu, J.; Min, H.; Xiao, H.A.; Su, Y.R.; Tong, C.L.; Huang, D.Y.; Syers, J.K. Dynamics in microbial immobilization and transformations of phosphorus in highly weathered subtropical soil following organic amendments. Plant Soil 2007, 290, 333–342. [Google Scholar] [CrossRef]
  42. Nahas, E. Phosphate Solubilizing Microorganisms: Effect of Carbon, Nitrogen, and Phosphorus Sources; Springer: Dordrecht, The Netherlands, 2007; pp. 111–115. [Google Scholar]
  43. Scervino, J.M.; Papinutti, V.L.; Godoy, M.S.; Rodriguez, M.A.; Monica, I.D.; Recchi, M.; Pettinari, M.J.; Godeas, A.M. Medium pH, carbon and nitrogen concentrations modulate the phosphate solubilization efficiency of Penicillium purpurogenum through organic acid production. J. Appl. Microbiol. 2011, 110, 1215–1223. [Google Scholar] [CrossRef]
  44. Sashidhar, B.; Podile, A.R. Mineral phosphate solubilization by rhizosphere bacteria and scope for manipulation of the direct oxidation pathway involving glucose dehydrogenase. J. Appl. Microbiol. 2010, 109, 1–12. [Google Scholar] [CrossRef]
  45. Spohn, M.; Kuzyakov, Y. Phosphorus mineralization can be driven by microbial need for carbon. Soil Biol. Biochem. 2013, 61, 69–75. [Google Scholar] [CrossRef]
  46. Kuzyakov, Y.; Xu, X. Competition between roots and microorganisms for nitrogen: Mechanisms and ecological relevance. New Phytol. 2013, 198, 656–669. [Google Scholar] [CrossRef] [PubMed]
  47. Kumar, P.; Dubey, R.C.; Maheshwari, D.K. Bacillus strains isolated from rhizosphere showed plant growth promoting and antagonistic activity against phytopathogens. Microbiol. Res. 2012, 167, 493–499. [Google Scholar] [CrossRef] [PubMed]
  48. Xiong, Y.; Mccormack, M.; Li, L.; Hall, Q.; Xiang, C.; Sheen, J. Glucose-TOR signalling reprograms the transcriptome and activates meristems. Nature 2013, 496, 181. [Google Scholar] [CrossRef] [Green Version]
  49. Gupta, A.; Singh, M.; Laxmi, A. Interaction between Glucose and Brassinosteroid during the Regulation of Lateral Root Development in Arabidopsis. Plant Physiol. 2015, 168, 307–320. [Google Scholar] [CrossRef] [Green Version]
Figure 1. Principal coordinate analysis (PCA) plot of soil bacterial community structure in glucose treatments using the relative abundance of order. Principal components 1 and 2 explained 74.7% and 9.9% of the variance, respectively.
Agronomy 12 01181 g001
Figure 2. Relative abundance of the bacterial community at the phylum level. Phyla that compose less than 2% of the bacteria in all treatments are grouped into “Other”. Sequences that could not be classified into any known group were assigned as “Unclassified”.
Agronomy 12 01181 g002
Figure 3. Changes of available phosphorus (A), total phosphorus (B), acid phosphatase activity (C), and microbial biomass phosphorus (D) in rhizosphere soil with different treatments. Different letters above columns indicate significant differences among treatments tested by one-way ANOVA (p < 0.05).
Agronomy 12 01181 g003
Figure 4. Amounts of rhizosphere soil inorganic P in Al−P (A), Fe−P (B), O−P (C), and Ca−P (D) fractions with different treatments. Al−P, Fe−P, and Ca−P refer to P in the fractions bound with Al, Fe, and Ca, and O-P to the occluded fractions. Different letters above columns indicate significant differences among treatments tested by one-way ANOVA (p < 0.05).
Agronomy 12 01181 g004
Figure 5. Response ratio analysis of changes in relative abundance of phosphate solubilizing bacterial OTUs in response to glucose addition compared to the C0 treatment, at 95% confidence interval. Error bar symbols plotted to the right of the dashed line indicate that the relative abundance increased, while those at the left side decreased.
Agronomy 12 01181 g005
Table 1. Average monthly rainfall and temperature from April 2018 to July 2018.
AprilMayJuneJuly
Average rainfall
(mm)
2743.690.6209.9
Average temperature
(°C)
13.719.124.426
Table 2. Bacterial community alpha diversity based on the 16S rRNA gene library (similarity threshold of 97%) sequenced by an Illumina MiSeq platform.
TreatmentNseqsaOTUsChao 1AceShannonCoverage
C022,305 ± 4862 ab2812 ± 189 ab3489 ± 188 a3533 ± 136 a6.986 ± 0.0111 a0.962 ± 0.0092 a
C122,993 ± 3231 a2881 ± 101 a3557 ± 221 a3610 ± 215 a6.985 ± 0.0068 a0.963 ± 0.0107 a
C217,870 ± 553 a2500 ± 220 cd3367 ± 131 ab3416 ± 141 ab6.827 ± 0.0513 b0.952 ± 0.0012 a
C320,793 ± 2805 a2608 ± 115 bc3372 ± 18 ab3451 ± 38 a6.490 ± 0.1890 d0.960 ± 0.0078 a
C422,099 ± 2325 a2675 ± 75 abc3494 ± 69 a3516 ± 52 ab6.608 ± 0.0596 c0.970 ± 0.0170 a
C517,883 ± 1193 a2362 ± 81 d3114 ± 337 b3148 ± 357 b6.56 ± 0.07630 cd0.956 ± 0.0114 a
nseq: Number of sequences clustered to OTUs. “C0–C5” represent adding 0, 2.5, 5, 7.5, 10, and 12.5 g of glucose per 1 kg of soil. In each column, different lowercase letters shows significant differences of means (p < 0.05). The values are means from three replicates (n = 3).
Table 3. Effects of different glucose contents on the growth status of M9T337 seedlings.
TreatmentTotal Biomass
(g/Plant)
P Uptake
(mg/Plant)
Total Root Length
(cm)
Root Total Surface Area
(cm2)
Number of Root Tips
C023.9 ± 3.6 c39.8 ± 5.8 b1818 ± 389 cd389 ± 26 c3507 ± 491 b
C128.8 ± 3.8 ab52.1 ± 3.3 a2451 ± 465 c608 ± 73 b5371 ± 249 a
C229.5 ± 2.6 ab52.5 ± 0.4 a4327 ± 575 a1020 ± 98 a4789 ± 602 a
C330.2 ± 2.4 a49.5 ± 2.7 a3487 ± 491 b1010 ± 128 a5126 ± 427 a
C425.3 ± 4.1 bc42.6 ± 2.2 b3630 ± 422 ab715 ± 67 b4880 ± 408 a
C520.9 ± 2.9 c30.1 ± 1.7 c1464 ± 312 d230 ± 32 d2046 ± 239 c
“C0-C5” represent adding 0, 2.5, 5, 7.5, 10, and 12.5 g of glucose per 1 kg of soil. In each column, different lowercase letters show significant differences of means (p < 0.05). The values are means from three replicates (n = 3).
Publisher’s Note: MDPI stays neutral with regard to jurisdictional claims in published maps and institutional affiliations.

