
Agri-Food Waste as a Method for Weed Control and Soil Amendment in Crops
by
 , , , and
Paula Lorenzo
1,* ,
,
Rosa Guilherme
2,3,
Sara Barbosa
3,4,
António J. D. Ferreira
3,4 and
Cristina Galhano
1,3,4 1
Centre for Functional Ecology (CFE)—Science for People & the Planet, Department of Life Sciences, University of Coimbra, 3000-456 Coimbra, Portugal
2
Direção Regional de Agricultura e Pescas do Centro, Av. Fernão Magalhães, 465, 3000-177 Coimbra, Portugal
3
CERNAS—Centro de Estudos de Recursos Naturais, Ambiente e Sociedade, Escola Superior Agrária de Coimbra, Instituto Politécnico de Coimbra, Bencanta, 3045-601 Coimbra, Portugal
4
Coimbra Agriculture School, Polytechnic of Coimbra, Bencanta, 3045-601 Coimbra, Portugal
*
Author to whom correspondence should be addressed.
Agronomy 2022, 12(5), 1184; https://0-doi-org.brum.beds.ac.uk/10.3390/agronomy12051184
Submission received: 5 April 2022
/
Revised: 10 May 2022
/
Accepted: 12 May 2022
/
Published: 14 May 2022
(This article belongs to the Special Issue CERNAS – Current Evolution and Research Novelty in Agricultural Sustainability)
Abstract
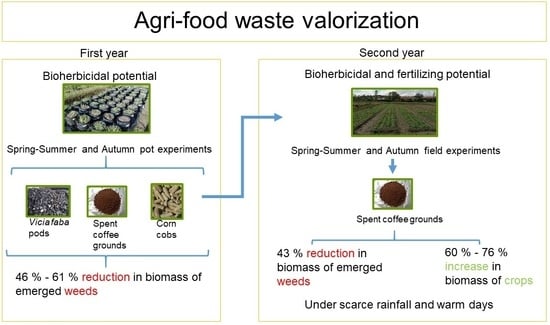
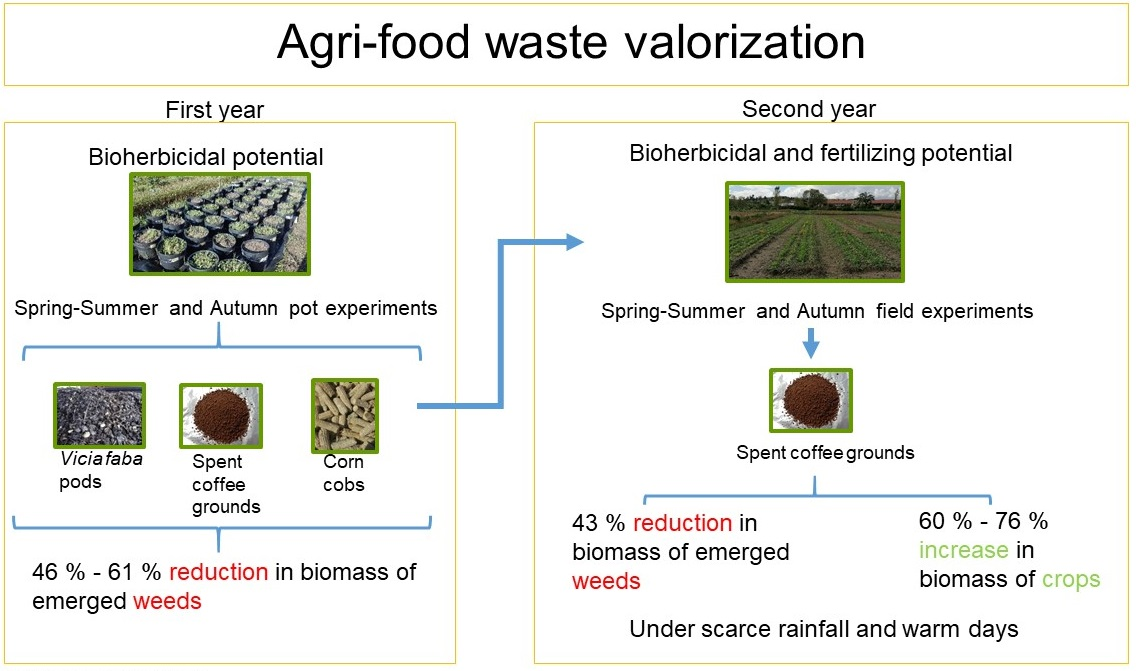
:The continued and extensive use of synthetic herbicides to control weeds to maximize crop yield is no longer sustainable, as it results in negative impacts on the environment and human health. Innovative sustainable and resilient food production systems should preserve resources and environmental health by incorporating alternative natural herbicides, recycling waste, and favoring a circular economy. The present work assesses the value of different organic waste (Urtica dioica residues, Vicia faba pods, spent coffee grounds, and corn cobs) as bioherbicides and fertilizers in different seasons through pot and field two-year sequential experiments. Pot assays revealed that V. faba pods, spent coffee grounds, and corn cob waste showed the best inhibitory effect, which were subsequently evaluated in the Spring–Summer and Autumn crops. In the field, spent coffee grounds reduced the biomass of total naturally-emerged weeds and stimulated crop growth under scarce rainfall and warm days. However, its effect varied under different environmental conditions. Spent coffee grounds can partially control weeds in the field, which valorizes them as a bioherbicide and boosts sustainable agriculture.
1. Introduction
The widespread use of synthetic herbicides and fertilizers on agricultural lands to maximize yield and feed an increasing population has resulted in air, soil, and water pollution [1,2,3]. The overuse of herbicides has additionally resulted in an increase in herbicide-resistant weeds [4]. This reduces the effectiveness of the long-term use of herbicides, compromising crops yield [5]. Environmental contamination by synthetic pesticides results in human diseases [6,7] and to the depletion of non-human biota populations [6]. This has led to an increasing demand for organic products free of synthetic herbicides, able to provide sustainable and safe alternatives, leading to a rapid increase of organic farming, which contributes to environmental protection [8,9]. In the last ten years, the European Union’s organic farming area increased by 70% [9]. Maintaining agricultural production based on synthetic agrochemicals has proven to be environmentally and socially unsustainable in the long term. As a result, both the United Nations, through its 2030 Agenda, and the European Union, with the European Green Deal, are deeply committed to ensuring the use of sustainable and resilient food production systems that preserve ecosystems for future generations. The European Commission aims to significantly and urgently reduce the dependence on pesticides and fertilizers by promoting a circular bioeconomy and integrated pest management to achieve sustainable food production [10]. Conducting sustainable agriculture involves abandoning old risky practices and adopting new, safer farming strategies that preserve the environment [11].
Herbicides can be partially replaced by natural phytotoxic compounds or organic mulches to control weeds [12,13,14]. Natural compounds are considered safer than synthetic herbicides, since they have shorter environmental half-lives and rarely contain halogenated atoms [15,16]. Similarly, renewable manures made with organic waste can be a source of nutrients for crops [17,18], reducing the use of synthetic fertilizers. Organic amendments also improve soil fertility and favor water retention [19,20]. Additionally, the use of biopesticides and biofertilizers contributes to the recovery and maintenance of soil quality and health, which are essential in agriculture [21].
Valuing waste by finding new potential uses for it, while reducing the use of synthetic agrochemicals in agriculture, embodies a holistic and sustainable alternative that prevents environmental contamination, provides new raw materials, and favors zero waste, by turning waste into by-products. This contributes towards the implementation of the circular economy strategy and the Waste Directive approved by the Council of the European Union on 30 May 2018 [22]. In Portugal, three types of common organic waste include spent coffee grounds (CG), Vicia faba L. (broad bean) pods, and corn cobs. Coffee is the most popular beverage in Portugal with a consumption average rate per capita of 4.15 kg/year1 [23], providing a considerable daily amount of CG. However, this waste is marginally recycled as a mushroom substrate or adsorbent for cationic dyes in sewage water [24]. Biodiesel production from CG was also evaluated, but it does not seem to be worthwhile since the production costs outweigh the energy revenues [24]. Vicia faba is a popular crop in Portugal. Data from 2017 pointed out that 2892 tons of broad beans were produced in the country that year, with the fresh pods being thrown away to landfills. Corn (Zea mays L.) is the main cereal crop in Portugal for grain production [25]. Corn cob waste is generally burned [26]. Recent studies evaluated its potential as a raw building material for thermal insulation [26,27] and a source of xylan to produce nanoxylan particles with antileishmanial and antifungal activities [28].
Despite the abundance of CG, V. faba pods, and corn cob waste, their potential as new agricultural resources has not been broadly explored. Extensive literature has focused on CG properties and its potential uses [29,30]. For agriculture purposes, CG may be a nutrient source, since it increases the content of organic matter, carbon, total nitrogen, available potassium and phosphorous, and reduced C/N ratio in soils [31,32]. This waste also increases moisture in sandy-loam soil [33]. The direct application of CG produced contradictory results on crop yields; while low doses can slightly affect the plant growth [33,34], high doses suppress the growth of a range of different crops [32,33], although the inhibitory effect can be alleviated through composting [34]. Crop-growth inhibition by CG seems to be related to the presence of phytotoxic compounds such as caffeine, tannins, and chlorogenic acids [31,35]. However, this negative effect might be useful to control weeds in sustainable agriculture, a relevant issue that was scarcely explored for CG [31]. In the case of V. faba, the literature highlighted both its phytotoxic and fertilizing properties. Interestingly, fresh flowering V. faba plants incorporated into the soil reduced weed biomass in maize crops by 50% in the short-term, but increased crop and weed biomass after the phytotoxic effects disappeared [36]. For V. faba pod waste in particular, Al-Chammaa et al. [37] found that sorghum plants almost doubled their biomass in response to soil amendments with this type of green manure, with the N from green manure being effectively used (up to 45%) by sorghum. Pod-waste extracts are known to have phytotoxic activity on three nematode species under in vitro and in vivo conditions [38]. Corn cobs are a source of antioxidant phenolic compounds that could be useful in food and pharmacological industries [39,40]. However, their use for agricultural purposes has not yet been explored.
This study presents a combined strategy to reduce waste and the overuse of synthetic agrochemicals. Therefore, the objective of this study is to explore the potential herbicidal effect of different agri-food waste incorporated into the soil as tools to control emerging weeds in Spring–Summer and Autumn crops, and simultaneously to evaluate the waste effect on crops’ biomass and soil quality. We hypothesize that these waste would contribute towards conducting more sustainable practices in agriculture by reducing the use of synthetic herbicides and fertilizers, and favor a circular economy by providing new uses for overlooked agri-food byproducts.
2. Materials and Methods
2.1. Evaluated Waste
The flowering plants of Urtica dioica L. were weeded at the Escola Superior Agrária de Coimbra farm (ESAC, Coimbra, Portugal; 40°13′02″ N, 8°26′56.2″ W) on 29 May 2019, allowed to dry in a shaded placed until 3 June 2019, cut into 4–7 cm pieces, and stored in a paper box before use.
The fruitful plants of Vicia faba L. were harvested from crops in central Portugal on 3 June 2019 and on 29 May 2020, and immediately processed in the FRIP company (Gafanha da Nazaré, Portugal) 2–3 days before setting up the experiments. Fresh-oxidized pods were used in the Spring–Summer experiments to test their effect, but overprocessing was avoided. However, dry pods were used in the Autumn experiments because broad bean is only cultivated during the Winter–Spring season at this latitude. Fresh-oxidized pods were dried at 65 °C for preservation and stored at dark-room temperature before use.
The spent coffee grounds were obtained from local coffee shops. In October 2019, fresh one-day spent coffee grounds were collected and immediately used in the Autumn pot experiment (2019) as fresh waste. The amount of coffee grounds needed for the field experiments, set in 2020, was much higher. However, the availability of spent coffee grounds was sporadic due to the COVID-19 pandemic restrictions, which kept local coffee shops closed. Therefore, we decided to collect spent coffee grounds when available, dry them at room temperature to prevent fungal contamination, and mix them before setting up the experiments.
The corn cobs were obtained from local farmers in September 2019 and 2020, ground using a standard garden grinder to provide 3–8 cm particles, and stored at room temperature before use.
2.2. Waste Extracts for Pot Experiments
In Spring–Summer 2019, dry U. dioica and fresh pods of V. faba were used to obtain water extracts at 20% mixing 20 g of waste with 100 mL of distilled water for 24 h, at room temperature. These were periodically shaken. The extracts were then filtered through a gauze and immediately used.
In Autumn 2019, water extracts using U. dioica or V. faba (20%, 20 g dry waste 100 mL−1 distilled water) were obtained as described for the Spring–Summer extracts.
2.3. Crop Species for Field Evaluation
To evaluate the waste effect on crops, several species were selected to ensure different taxa and crop-edible plant parts. Lactuca sativa L. and Raphanus sativus var. niger (Mill.) J. Kern. were chosen to represent leaf-edible and bulb-edible crops under Spring–Summer conditions, while Brassica rapa subsp. nipposinica (L. H. Bailey) Hanelt (leaf-edible) and Beta vulgaris L., sp. Pl. (bulb-edible) were chosen to represent crops under the Autumn conditions. The seedlings of those species were obtained from local suppliers before conducting the field experiments.
2.4. Experimental Set-Up
Two trials in two consecutive years were conducted. First, the herbicidal effect of different waste on weeds naturally emerging from agricultural soils was evaluated in pots in Spring–Summer and Autumn. Agri-food waste showed the best herbicidal results, which is the reason why they were subsequently assayed in field plots to test their effect on weeds, crops, and physico-chemical soil properties during the Spring–Summer and Autumn seasons. To facilitate their potential use by farmers, fresh waste were primarily used when available to avoid later overprocessing. However, the availability of some agri-food waste depended on crop timing. To standardize the procedures, fresh agri-food waste were dried for preservation and used when needed.
2.4.1. Pot Trials
Experiment 1—Bioherbicidal Effect of Different Waste on Emerging Spring–Summer Weeds
The first pot experiment was established outdoors at ESAC farm (Coimbra, Portugal; 40°12′47,3″ N, 8°27′05,1″ W) from 6 June to 18 July 2019. This region is characterized by a warm temperate climate with a dry summer—Csb (Köppen–Geiger climate classification, [41]), with very scarce rainfall and an average medium temperature of 20 °C for the experimental period (Figure S1: meteorological data were obtained from the ESAC meteorological station). The area is devoted to organic production that is heavily infested by several weed species, mainly Cyperus spp. The soil characteristics at the experimental site were the following in average: pH(H2O) = 6.5, 1.3% organic matter (OM), 84 mg P2O5 kg−1 extractable phosphorus (P), 122 mg K2O kg−1 extractable potassium (K), and 0.13% total Kjeldahl nitrogen (N). Fifteen-liter pots (29 cm diameter, 24 cm high) were filled with agricultural soil (Ap horizon) collected from this location and watered with 2 L of tap water. The pots were randomly assigned to one of the treatments: dry U. dioica waste (hereafter U), fresh V. faba waste (hereafter F), extract of dry U. dioica waste (hereafter UE), extract of fresh V. faba waste (hereafter FE), control without any addition of waste or extract as a negative control (hereafter C), and Cyperal herbicide (Benfuresato 40%) as a positive control (hereafter H). The treatments were applied in the doses described in Table 1. The control pots received water from the Mondego River (pH 7.34; electrical conductivity 0.10 mS cm−1; [42]). The treatments were replicated five times and the pots were randomly distributed. The doses for fresh (28 Mg ha−1) and dry (9 Mg ha−1) waste applied in the present study were similar to those for phytotoxic mulches or manures commonly used in weed control [14,43,44]. The dose for aqueous treatments was the quantity of waste extracts needed to moisten the soil, while avoiding percolation. U and F were incorporated into the first 10 cm soil layer. EU, EF, and H were homogeneously applied on the top of the soil. After treatment application, the pots were covered with plastic bags for 24 h to avoid premature treatment leachate by rain on June 6th (Figure S1). Then, the bags were removed, and weeds grew under natural conditions. The pots were watered with the same quantity of tap water two or three times a week, avoiding percolation.
At the end of the experiment, the weeds from each pot were uprooted, classified into monocotyledons, dicotyledons, and Cyperus spp., typically the most problematic weed, and dried at 65 °C until a constant weight was achieved. Determinations included the aboveground biomass (g m−2) of each weed group and total weeds.
Experiment 2—Bioherbicidal Effect of Different Waste on Emerging Autumn Weeds
A second pot experiment was conducted in the same place, from 15 October to 26 November 2019. Environmental conditions throughout the experiment were characterized by average values of 6 mm for rainfall and 14 °C of medium temperature (Figure S1: data collected at ESAC). Fifteen-liter pots were filled with the same agricultural soil as for Experiment 1 and randomly assigned to these treatments: dry U, dry F, UE, FE, fresh spent coffee grounds waste (CG), dry corn cob waste (CC), C, and H. The treatments were applied in the doses described in Table 2 and were replicated five times. The control treatment received water from the Mondego River.
Waste and extract treatments were applied as described in Experiment 1. At the beginning of the experiment, the pots were covered by plastic bags for 48 h to avoid premature treatments leachate by rain from 17 October to 19 October (Figure S1). Then, the bags were removed, and the weeds grew normally. The pots were naturally rain-fed.
At the end of the experiment, the weed biomass as indicated for Experiment 1 and soil samples from the first 15 cm of the top soil layer in each pot were collected. The soil samples were dried at 30 °C, sieved through a 2 mm sieve (Soil Mill Pulverizette 8, Fritsch, Idar-Oberstein, Germany), and analyzed following Magalhães et al. [45] to determine the pH, OM, extractable P, extractable K, and total N. Briefly, the soil pH was determined using 1:5 soil volume/distilled water volume ratio. Organic matter was estimated by oxidizing organic carbon in 2 g soil samples at 600 °C (model SC-144 DR, LECO, St. Joseph, Michigan, United States) and multiplying the organic carbon value by the 1.724 factor. Extractable P and K were extracted in 2 g soil samples using the Egnér–Riehm method. P was calorimetrically determined at 650 nm. K was quantified using an atomic absorption spectrophotometer (model Analyst 300 with software AA Winlab, Perkin Elmer, Waltham, Massachusetts, United States) based on a calibration curve with K2O standard solutions. Total N was determined in 2.5 g soil samples using the Kjeldahl method [45].
2.4.2. Field Evaluation
Pot experiments 1 and 2 indicated that F, CG, and CC treatments had the best herbicidal effect on the biomass of the total weeds. Therefore, these treatments were selected to evaluate their herbicidal effect under field conditions.
Experiment 3—Evaluation of Agri-Food Waste Effects on Spring–Summer Crops and Associated Weeds
The Spring–Summer field experiment was established on ESAC’s agricultural farm (Coimbra, Portugal, 40°13′05.7″ N 8°26′54.1″ W) from 1 June to 27 July 2020, with the same climate as Experiment 1. This area was used to grow potatoes under organic farming and was characterized by the following soil properties: 7 ± 0.0 pH, 2.40 ± 0.10% OM, 319.33 ± 63.40 mg kg−1 P, 308.00 ± 43.03 mg kg−1 K, and 0.15 ± 0.01% N. The average values for rainfall and mean temperature during the experiment were 0.24 mm and 22 °C, respectively (Figure S2: data collected at ESAC).
An experimental area covering 319 m2 was ploughed and earth-milled on 29 May 2020, and split into 16 6 m × 1.5 m plots, divided from each other by 1 m in all directions. The applied treatments were dry CG, dry CC, fresh F, and C, with four replicates each. The treatments were randomly distributed by plots at doses of 9 Mg ha−1, 9 Mg ha−1, and 28 Mg ha−1 for CG, CC, and F, respectively, and manually incorporated into the first 15 cm of the soil layer on 1 June 2020. Seedlings of L. sativa and R. sativus were immediately planted in each plot in three central intermixed rows with 0.25 m separating the rows: one central R. sativus row (0.75 m from margins) with 0.10 m between plants, and two L. sativa rows (0.5 m from margins) with 0.30 m between plants [46]. The plots were watered by a drip irrigation system (2.66 L s−1 flow rate per emitter) for 30 min, every 2–3 days [42].
The normalized difference vegetation index (NDVI) was recorded weekly by measuring plant spectral reflectance with a GreenSeeker® handheld sensor (NTech Industries Incorporation, Ukiah, CA, USA; [47]) for the first seven weeks after waste incorporation until stable values were reached. Readings were collected at a height of 1 m from the topsoil layer along each plot and covering the central area.
The aboveground weed biomass was sampled in four random frames (0.25 m × 0.25 m) per plot, excluding plot margins, at four and eight weeks after waste incorporation (on 29 June and 27 July 2020, respectively). The weeds were cut at ground level, separated into monocotyledons, dicotyledons and Cyperus spp., as the most problematic weed in the area, and dried at 65 °C for 72 h to determine the dry biomass for each weed group and total weeds in each plot.
Lactuca sativa and Raphanus sativus were harvested on 16 July 2020, when commercial size was reached. Twelve L. sativa and fifteen R. sativus plants per plot were uprooted in both rows following the one-yes/one-no or one-yes/two-no schemes, respectively, discarding plants at 0.50 m row margins. The crop plants were washed to remove soil, divided into leaves and roots, and dried at 65 °C until constant weight to obtain the leaf, root, and total biomass. Additionally, L. sativa leaves, R. sativus roots, and waste were powdered to 0.05 mm size particles and analyzed to determine the total content of macronutrients (phosphorous, P; calcium, Ca; magnesium, Mg; potassium, K; nitrogen, N) and micronutrients (copper, Cu; iron, Fe; zinc, Zn; manganese, Mn). Briefly, the crop or waste dry composite samples (0.5 g) were extracted with HCl after ignition at 480–500 °C for 14 h. The elements Cu, Zn, Mn, Fe, Ca, Mg, and K were assessed based on a calibration curve for each one, using an atomic absorption spectrophotometer (model Analyst 300, Perkin Elmer). Phosphorous was colorimetrically quantified, at 470 nm, using the vanadate–molybdate reagent in nitric acid solution and a calibration curve. The total N was determined using the Kjeldahl method [45]. Among CG, CC, and F waste, CG had the highest content of N, Cu, and Mn; F was rich in P, Ca, K, Zn, and Fe; and CC showed the lowest content of nutrients, except for Mg, which was the highest (Table S1).
The soil samples were collected at the same time as the weed samples. A composed-soil sample was obtained per plot mixing soil four subsamples collected from the top 30 cm of soil. The soil samples were air-dried, sieved through a 2 mm sieve, and analyzed to determine the pH, OM, P, K, and N, as described in Experiment 2.
Experiment 4—Evaluation of Agri-Food Waste Effect on Autumn Crops and Associated Weeds
In the Autumn, an additional field experiment was conducted in the ESAC farm located 87 m apart from Experiment 3, from 25 September to 2 December 2020. For this period, the rainfall averaged per day was 3 mm, with heavy rain concentrated from 19 to 28 October, achieving 44 mm in one day (Figure S2, data collected at ESAC). The average mean temperature was 15 °C (Figure S2).
The same plot preparation, experimental design, treatments, and waste doses used for Experiment 3 were established, except for F that was calculated based on the same fresh volume used in Experiment 3, resulting in 3.84 Mg dry weight ha−1. Seedlings of Brassica rapa and Beta vulgaris were alternately planted in four pure rows separated by 0.30 m between rows. Two B. rapa and two B. vulgaris rows were planted with 0.20 and 0.15 m between plants, respectively [46]. The seedlings were watered with river water immediately after plantation, and then rain fed.
NDVI was recorded for the first six weeks, like in Experiment 3. Weed samplings were performed four and eight weeks after waste incorporation on 26 October and 23 November, respectively, as described in Experiment 3. The crops were harvested when they had achieved commercial size, e.g., on 26 October 26 for B. rapa, and on 2 December 2021 for B. vulgaris. Ten and thirteen plants of B. rapa and B. vulgaris, respectively, were sampled in respective lines following the one-yes/one-no scheme, avoiding the 0.50 m row margins. These plants were processed as indicated for the crops in Experiment 3 to obtain leaf, root, and total biomass. Chemical analyses of B. rapa leaves and B. vulgaris roots were conducted as described in Experiment 3.
Soil sampling and analyses followed the pattern of Experiment 3.
2.5. Statistical Analyses
For the pot experiments, analyses of variance via general linear models (LMs, lm() function, ‘stats’ package) or generalized linear models (GLMs with Gamma error and identity or log link, glm() function, ‘stats’ package) were conducted. These were performed separately for each season experiment to test the effect of treatment (Spring–Summer: U, F, EU, EF, C, H; Autumn: U, F, CC, CG, UE, FE, H) on the biomass of monocotyledons, dicotyledons, Cyperus spp., and total weed groups. The effect of treatments on soil parameters (pH, MO, K, N, P) in Autumn was assessed using LMs.
In the case of field experiments, analyses were separately performed for the Spring–Summer and Autumn experiments. Two-way repeated measured models via generalized linear mixed models (GLMMs, lmer() function, ‘lme4′ package) were conducted to test whether treatment (C, CG, F, CC; fixed factor), time (sampling week; repeated measures) and their interaction had an effect on NDVI. Plot was considered as a random factor. To explore the effect of treatment (C, CG, F, CC; fixed factor), time (week four and eight; repeated measures) and treatment × time interaction on biomass of different weed groups (monocotyledons, dicotyledons, Cyperus spp., and total weeds), two-way repeated measures GLMMs were used with sampling units nested in plots as a random factor. The effect of treatment (C, CG, F, CC; fixed factor) on crop biomass (leaves, roots, and total) was assessed via one-way linear mixed models (LMMs, lmer() function, ‘lme4′ package) with plot as a random factor for each crop. In crop chemicals analysis, individuals from the same plot were pulled together to obtain a composite sample per plot. Therefore, one-way LMs or GLMs with Gamma error and identity link were conducted to test for the effect of treatment (C, CG, F, CC) on the content of each nutrient (P, Ca, Mg, K, N, Cu, Zn, Fe, Mn) in each crop. Finally, a two-way LM was used to assess the effect of treatment (C, CG, F, CC) and time (week four and eight) and the interaction between these two factors on the soil parameters (pH, OM, P, K, N) for Spring–Summer data, while in Autumn, the effect of the same factors using two-way LMs in the case of soil pH, OM, K, and N and a two-way GLM (Gamma error and identity link) for soil P was evaluated.
Post hoc mean separations were conducted using the lsmeans() function (‘lsmeans’ package) by comparing the least-square means obtained in each model.
All statistical analyses were conducted in R [48]. The level of significance was set at p ≤ 0.05.
3. Results
3.1. Bioherbicidal Effect on Emerging Common Weeds in Pots
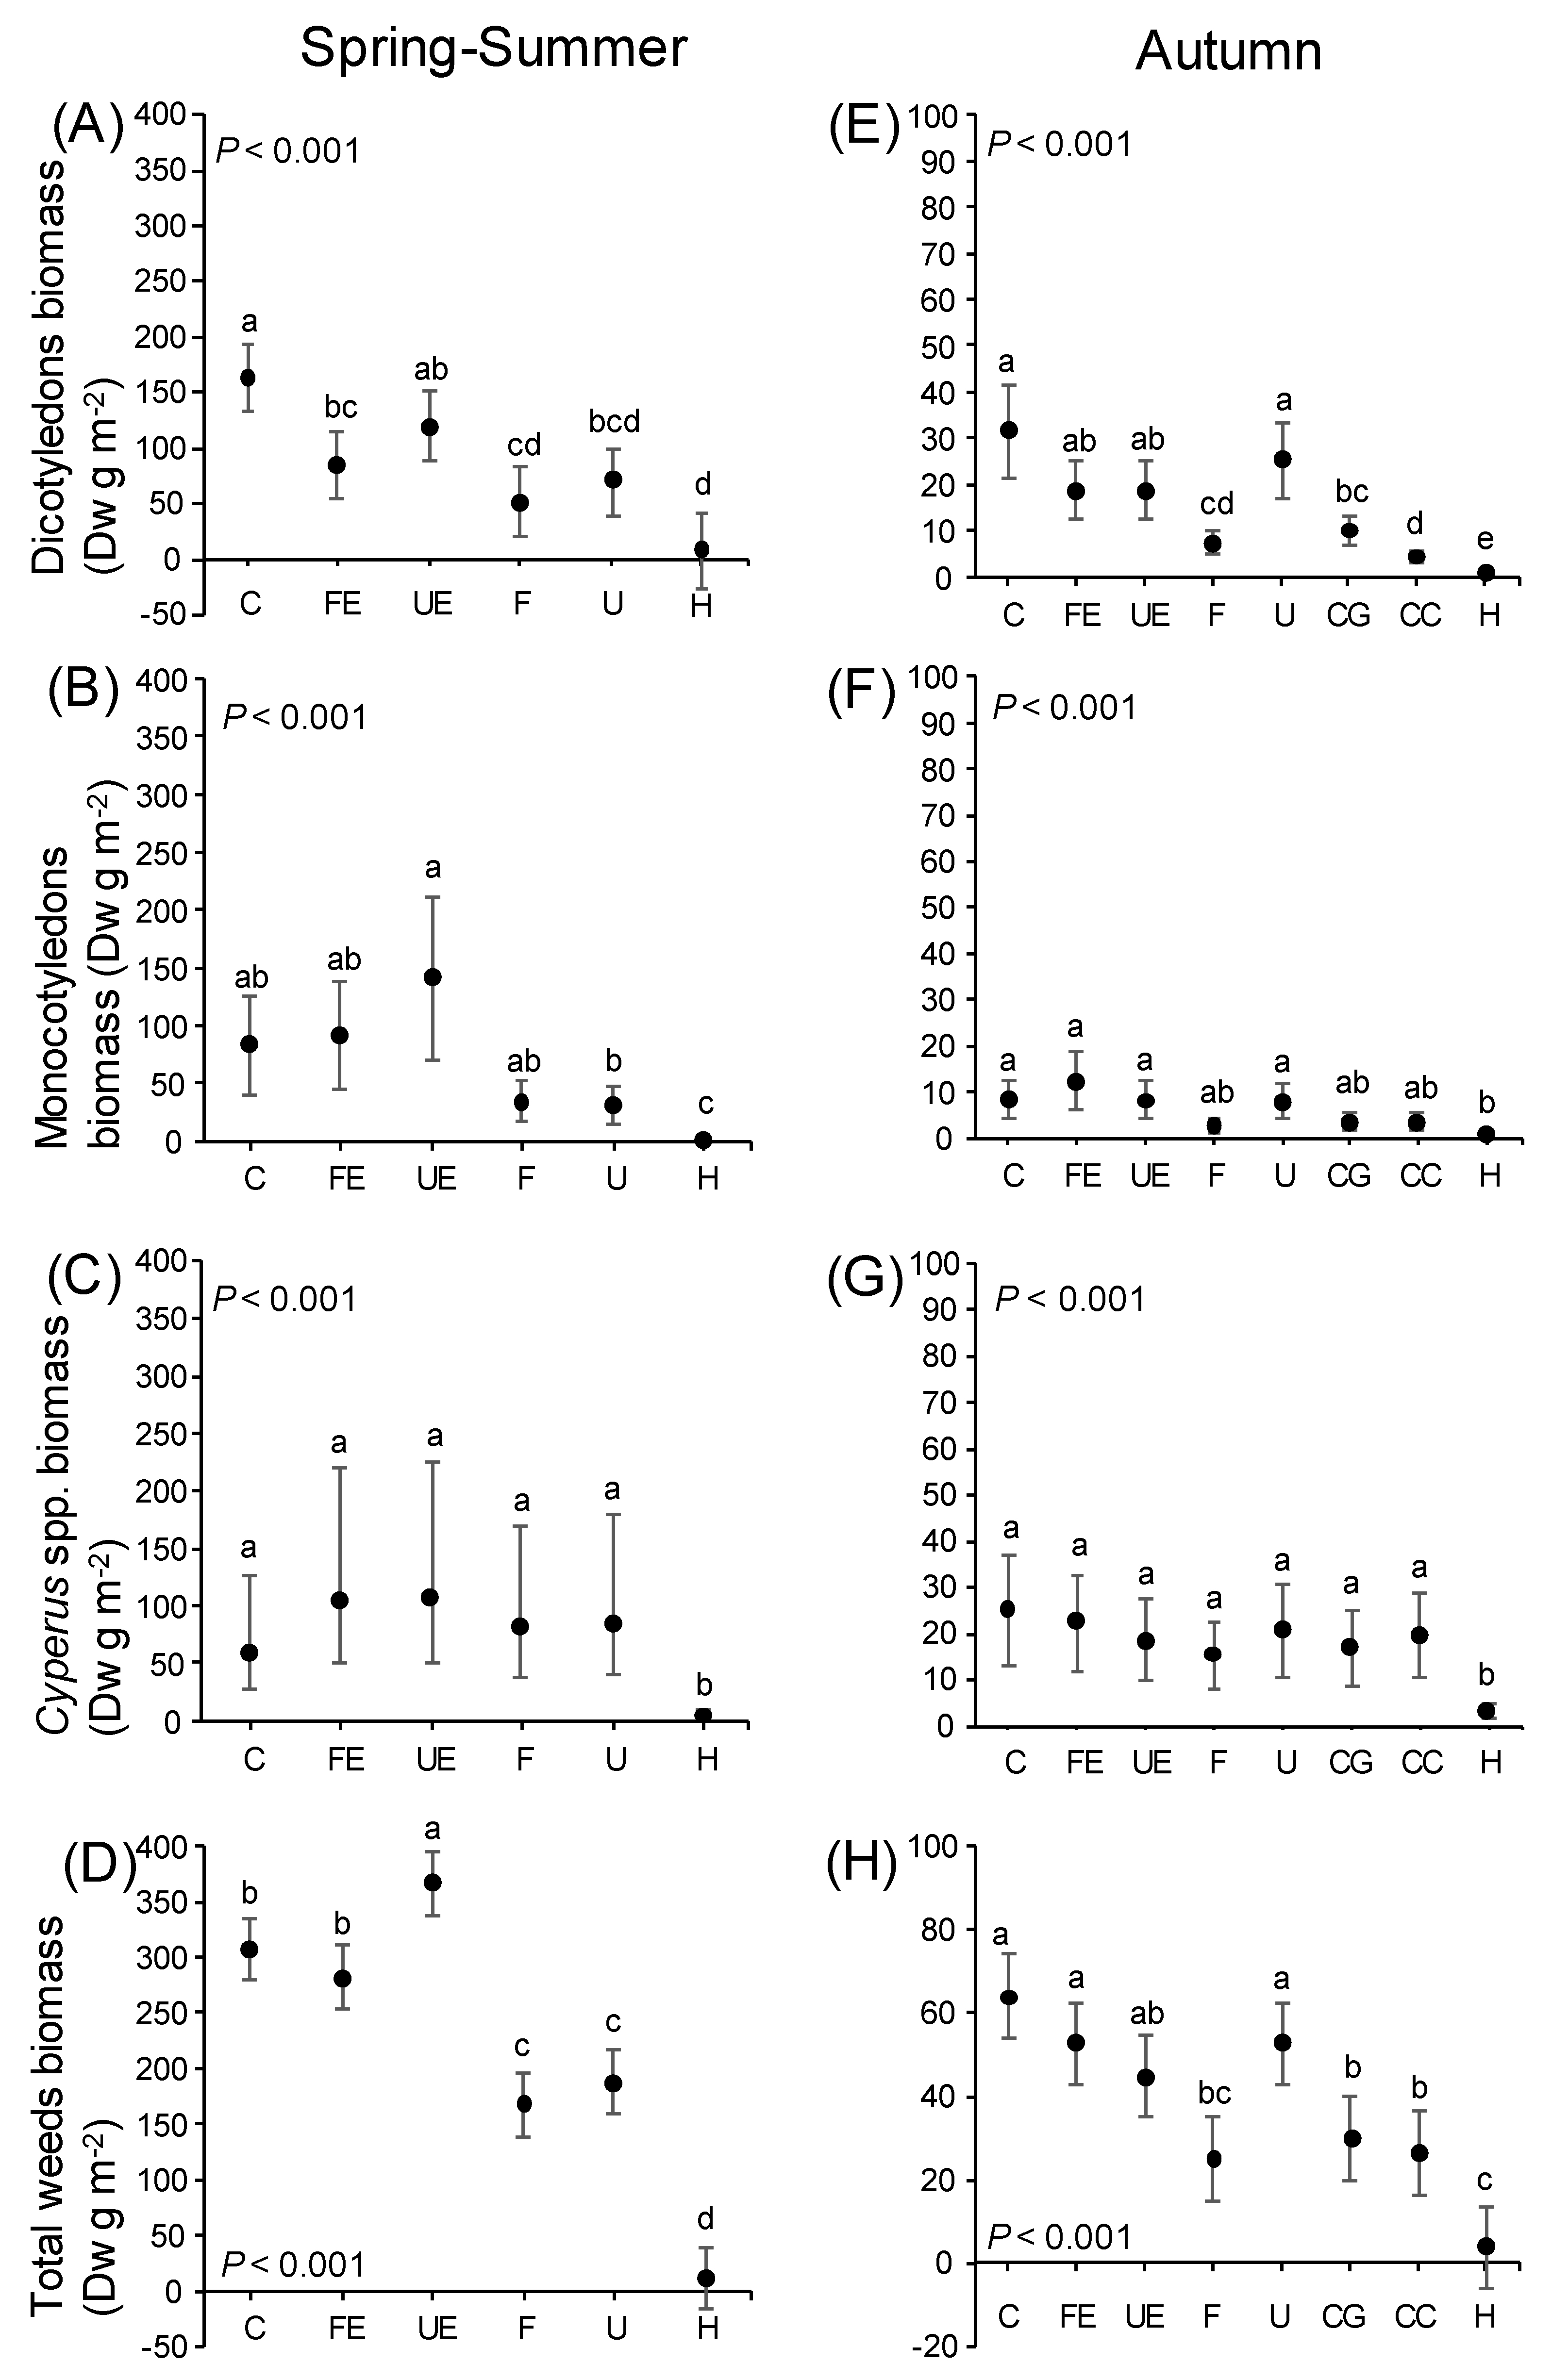
For the Spring–Summer (Experiment 1), treatment significantly affected the biomass of all weed groups (Figure 1). The biomass of dicotyledons was reduced when treated with FE, F, and U relative to the control (Figure 1A). However, the biomass of monocotyledons and Cyperus spp. did not differ from the control under any waste treatment (Figure 1B and 1C, respectively). Considering total weeds, the plant biomass increased in UE and decreased by 46% and 39% in F and U, respectively, when compared to the control (Figure 1D). As expected, pots treated with herbicide (positive control) always showed the greatest inhibition (Figure 1A–D).
In Autumn (Experiment 2), treatment had a significant biomass impact for all weed groups (Figure 1). Dicotyledons showed reduced biomass in F, CG, and CC waste treatments (Figure 1E). As found in Spring–Summer, the biomass of monocotyledons and Cyperus spp. showed no significant differences between waste treatments and the control (Figure 1F and 1C, respectively). For total weeds, plant biomass was inhibited in F (61%), CG (54%), and CC (59%) pots compared to the control pots, being close to herbicide inhibition (Figure 1H). Again, herbicide showed the lowest weed biomass for all weed groups (Figure 1E–H). Regarding soil from pots in Autumn, treatment significantly affected pH, the content of OM, and N (Table 3). Soils treated with FE, UE, F, U, and CC had higher pH than control soils (Table 3). Soils with F and CG showed increased OM, while CG increased the content of N (Table 3).
3.2. Waste Performance in Field Crops
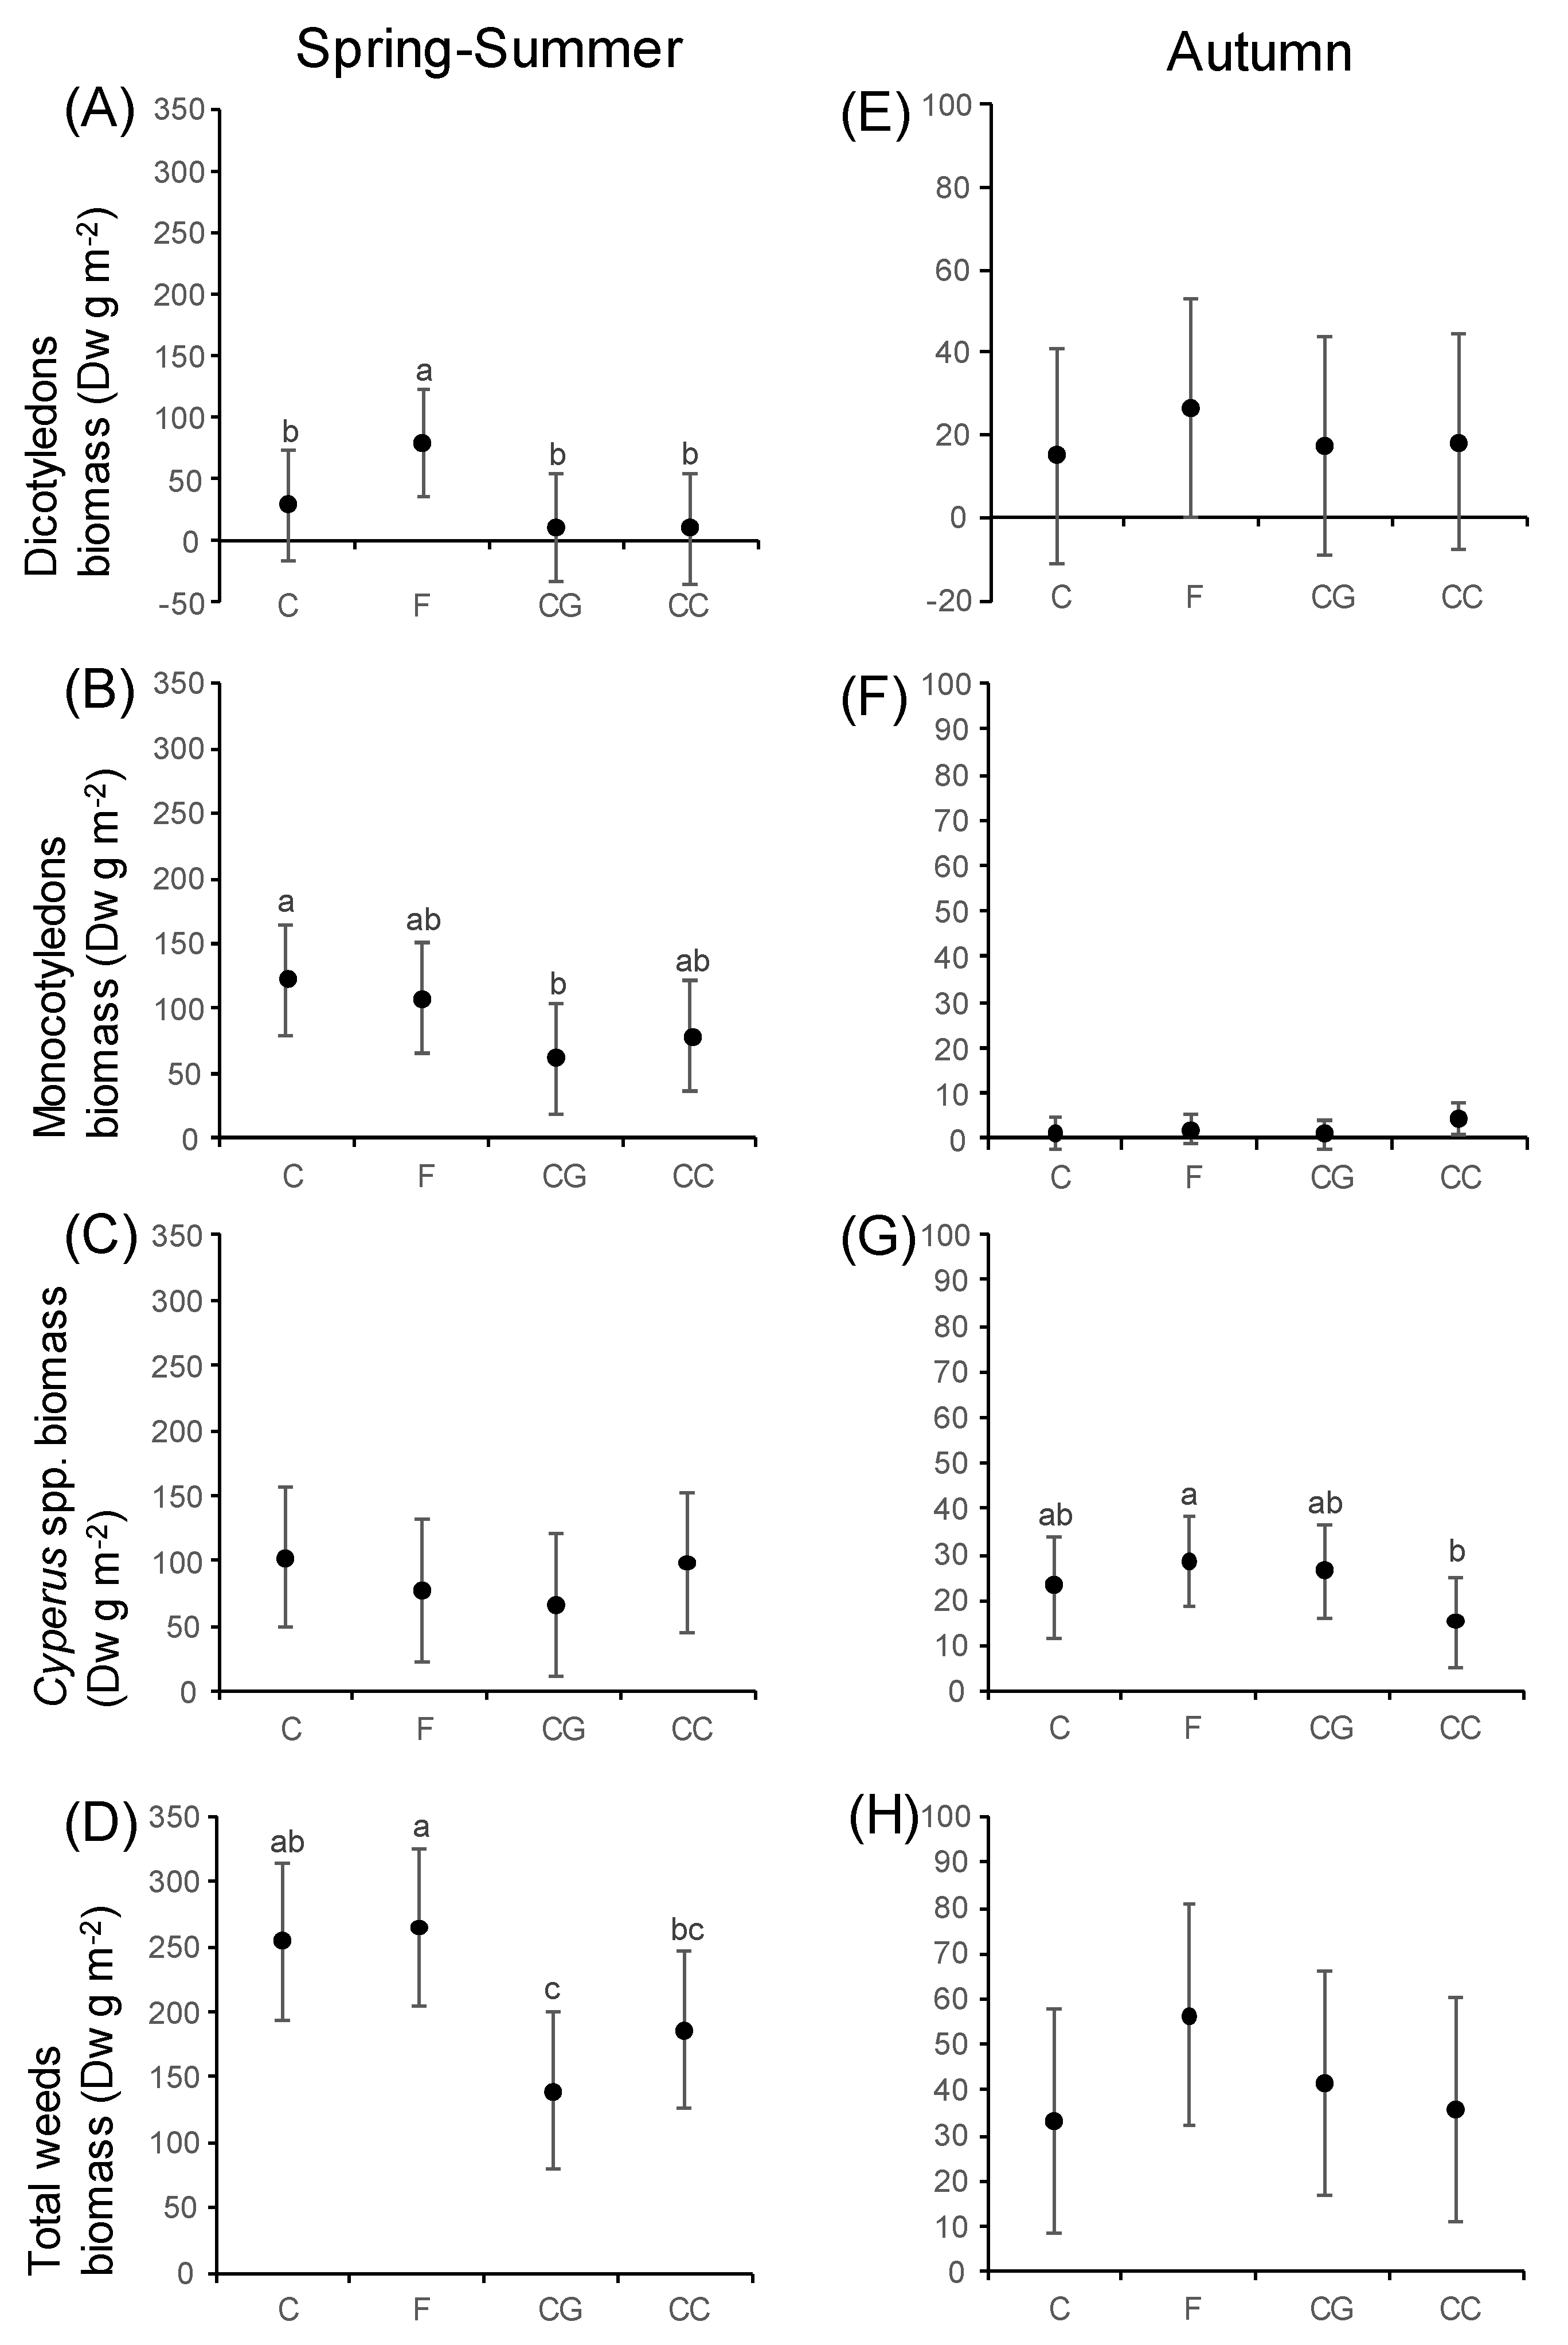
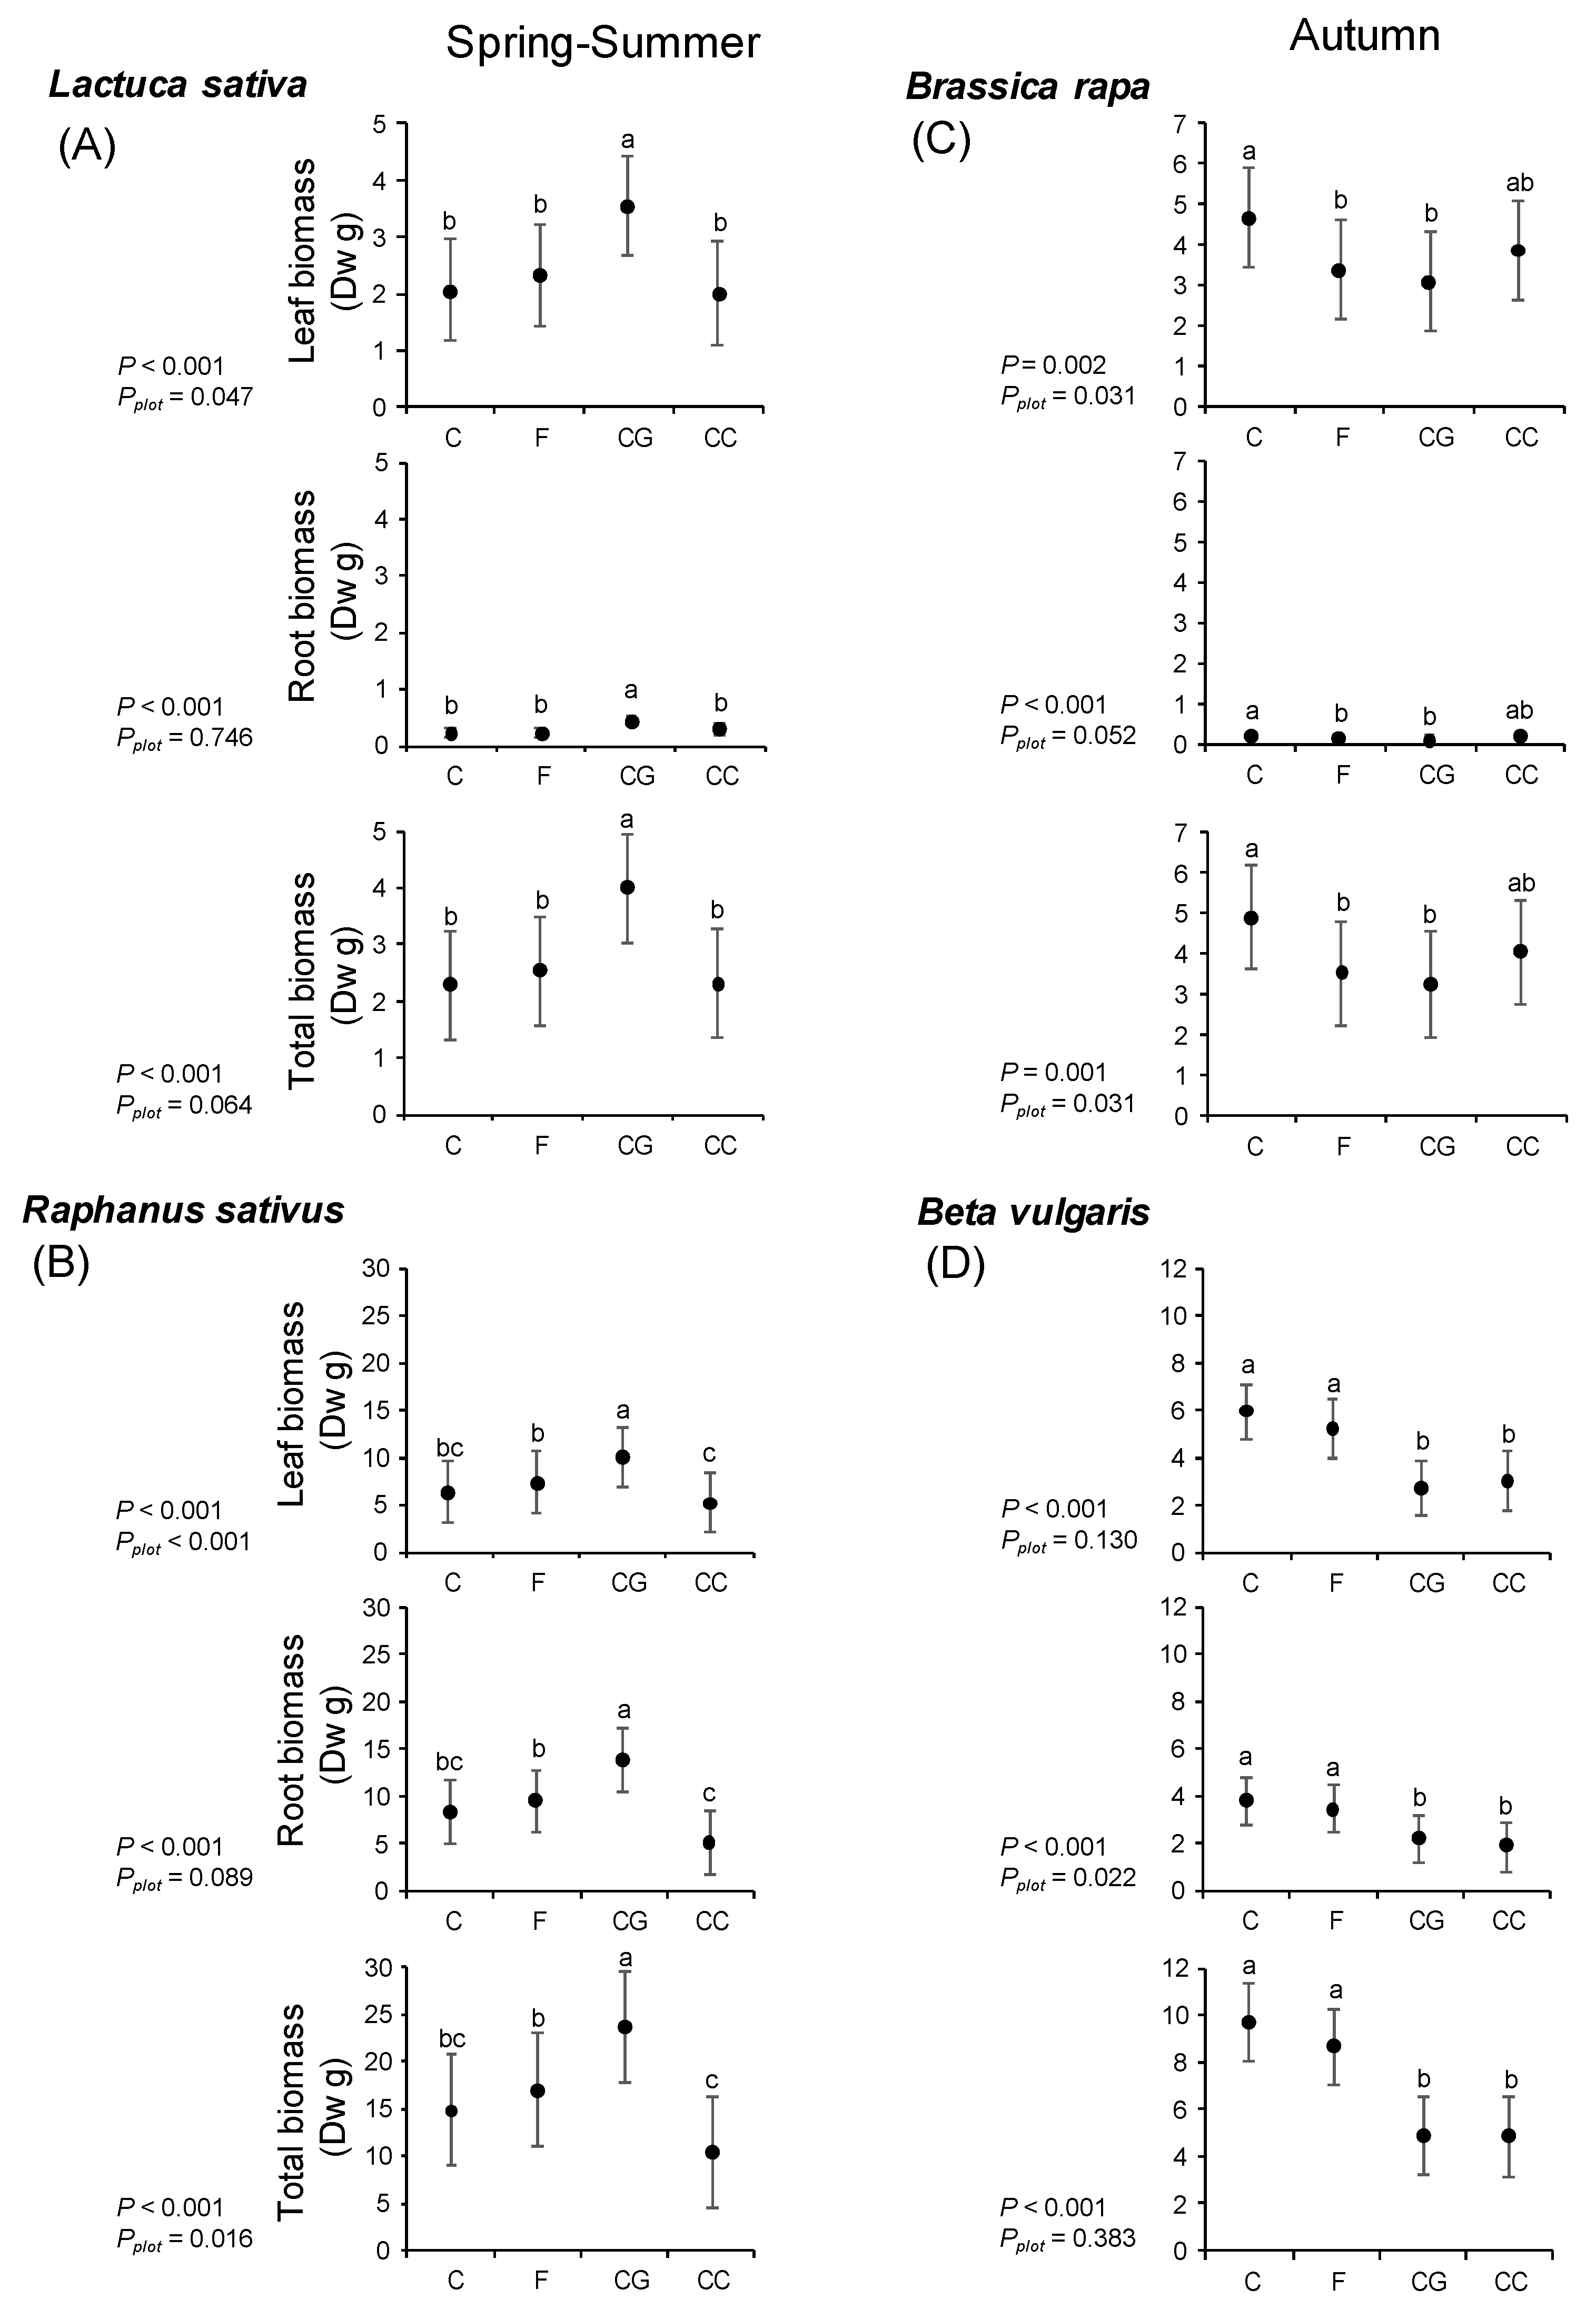
In Spring–Summer (Experiment 3), time, treatment, and the time × treatment interaction had a significant effect on NDVI (Table S2). This parameter increased over time (Figure 2A). Plots treated with CG and CC registered lower NDVI than the control plots (Figure 2B). A significant reduction in NDVI was found for CG plots at weeks three and four and for CC at week four (Figure 2C). For the weed groups, treatment significantly affected the biomass of dicotyledons, monocotyledons, and total weeds (Table S2). Plots with F waste significantly increased dicotyledons’ biomass (Figure 3A). However, plots receiving CG reduced the biomass of monocotyledons and total weeds 2- and 1.8-fold, respectively (Figure 3B,E). Time also significantly affected the biomass of all weed groups, being higher at week eight after waste incorporation (Tables S2 and S3). A treatment × time interaction was observed for dicotyledons’ biomass and total weeds (Table S2). At week eight, plots receiving F waste had higher dicotyledons’ biomass (Figure S3A). However, plots with CG reduced the biomass of all weed groups, although a significant reduction was only found for total weeds (43%), compared with the control (Figure S3D). In crops, the biomass of leaf- and bulb-edible plants was significantly affected by treatment (Figure 4A,B). This effect was influenced by the plot covariate for the leaf biomass of L. sativa and for leaf and total biomass of R. sativus (Figure 4A,B). CG significantly increased the leaf, root, and total biomass by 72, 109, and 76% in the case of L. sativa (Figure 4A) and by 57, 66, and 60% for R. sativus (Figure 4B). Treatment also affected the content of N, Fe, and Mn in L. sativa leaves and of P, Zn, Fe, and Mn in R. sativus roots (Table S4). In L. sativa, leaves from the CC treatment had a higher content of Fe than the control (Table S4). Plots treated with F had a higher content of N and Mn than CC and CG plots, respectively, but their content was not different from the control plots (Table S4). For R. sativus roots, the content of P an Zn increased in F plots (Table S4). Zn was additionally increased by CC (Table S4). However, CC reduced the Fe content (Table S4). Differences in the content of Mn occurred between F and CG and CC, but their values did not differ from the control (Table S4). For soil parameters, only the time factor significantly affected the content of OM and K, which decreased after eight weeks of waste incorporation (Table 4).
In Autumn (Experiment 4), the NDVI parameter was significantly affected by treatment, time, the interaction between these two factors and plot as covariate (Table S2). The values of NDVI were different among sampling weeks and increased over time (Figure 2D). This parameter was lower in CC compared to the control (Figure 2E). Nevertheless, considering treatment and time together, significant differences were registered between F and CC for weeks four and five (Figure 2F). Concerning weeds, treatment only significantly affected the biomass of Cyperus spp. (Table S2, Figure 3), which presented higher values for F compared to CC (Figure 3G). Time had a significant effect on the biomass of dicotyledons, Cyperus spp., and total weeds (Table S2). This effect was also influenced by plot for dicotyledons (Table S2). When affected by time, the biomass of the weed groups was higher at week eight (Table S3). The treatment × time interaction did not affect weed biomass (Table S2, Figure S3E–H). For crops, the leaf, root, and total biomass of leaf-edible B. rapa were significantly affected by treatment (Figure 4C). Leaf and total biomass were also influenced by plot as a covariate (Figure 4C). Plots treated with F and CG had smaller B. rapa plants than the control plots (Figure 4C). Treatment also affected the biomass of bulb-edible B. vulgaris plants, with an additional effect of the covariate plot on roots (Figure 4D). The leaf, root, and total biomass of B. vulgaris were reduced by 42–51% when grown in plots with CG or CC compared with the control plots (Figure 4D). Regarding plant nutrients, treatment only had a significant effect on K in both B. rapa and B. vulgaris (Table S4). B. rapa leaves from plants growing in F and CC plots showed a lower content of K than the control plots (Table S4). For B. vulgaris, the content of K was lower in CG and CC plots compared with the control (Table S4). Concerning the soil parameters, soils collected in F plots had significantly lower pH, N, P, and K than the control plots (Table 4). Time also significantly affected the content of N and P, presenting higher values at week four after waste incorporation (Table 4). Finally, the treatment × time interaction had a significant effect on K, which increased in CG plots at week four, but rapidly decreased in CG and F plots at week eight compared with the control plots (Table 4).
4. Discussion
The Spring–Summer pot experiment revealed that U and F waste were efficient in reducing the biomass for almost all weed groups. However, U waste lost its inhibitory effect in the Autumn pot experiment, with F, CG, and CC being the most effective treatments in reducing the biomass of weeds emerging during that season. The inhibitory effect of these waste did not seem to be influenced by environmental conditions nor by a nutrient deficit. F waste showed exactly the same inhibitory pattern for dicotyledons, monocotyledons, and total weeds in Spring–Summer and in Autumn, and soil treated with this waste had higher OM content than the control soils. Similarly, soils mixed with CG were enriched with OM and N. No soil with F, CG, and CC showed nutrient or pH limitations compared to the control soils. This implies that the reduced growth found for weeds in these treatments are related to the release of phytotoxic compounds by the waste. In fact, CG inhibited the growth of different crops and weeds when directly applied to the soil, probably due to its natural toxic compounds [31,32,33,35]. A recent study on weed control using V. faba found that green manures of this plant reduced by half weed biomass in field maize crops, with the inhibitory effect occurring within 27 days after the incorporation of green manure [36]. After 27 days, the inhibition disappeared and the fertilizing effects were evident [36]. Water-soluble and volatile organic compounds released by V. faba probably play a role in reducing weed biomass [49]. For V. faba pods in particular, a herbicidal effect on weeds was scarcely studied. However, pod extracts of this species had nematocidal activity [38]. As far as we know, the inhibitory effect of CC waste or its composition in phytotoxic compounds is unknown. This could mean that toxic compounds were not abundant in this waste or were not released during the pot experiment duration (six weeks). One plausible explanation for the reduced weed growth found in CC pots may be related to the C/N ratio and the lower nutrient content of this raw waste compared to CG and F (Table S1). The C/N ratios for CG and F are around 23:1 and 18:1, respectively [33,37]. However, CC has a C/N ratio of 120:1 [50], which is very high, explaining its poor quality. Although the soil from CC pots did not show nutrient limitations relative to control soils, CC soils had lower OM and N content than CG soils. This could indicate that CC raw waste contains a poor nutrient stock that was likely firstly immobilized by the microbial biomass (i.e., N), leading to a lower nutrient availability for plants, which, in turn, hindered their growth [33].
As F, CG, and CC showed the best inhibitory effect on weed biomass in the Spring–Summer and Autumn pot experiments, consequently, their effectiveness was evaluated in real field crops in both seasons. Under field conditions, the results varied with the seasons. The CG waste reduced weed biomass and increased crop biomass in Spring–Summer, but had no effect on weeds and reduced crop biomass in Autumn. The NDVI parameter indicated that the negative effect caused by CG occurred at week three and four after waste incorporation. The inhibitory trend of this waste was similar in both seasons, but the significant effect was only found in Spring–Summer. The F and CC waste did not impact weed biomass regardless of season and crop biomass in Spring–Summer. However, F and CC inhibited the growth of B. rapa and B. vulgaris in Autumn. The different results found between the Spring–Summer and Autumn field trials may be firstly explained by different environmental conditions during the experiments. In Spring–Summer, warm days with scarce precipitation prevailed. Lower temperatures and rainy days were more frequent in Autumn. Heavier rain events, especially those concentrated in short periods, as found for the Autumn field trial, may contribute to soil nutrient leachate [51,52]. This could explain the lower content of all nutrients measured in the soils from F plots, which in turn may result in the lower biomass and K leaf content of B. rapa found in these plots. High rainfall concentrated at week four in the Autumn experiment could also lead to a phytotoxicity loss from CG by leaching toxic compounds, reducing its effectiveness. This may explain why no significant differences were found between CG and the control treatments in Autumn, despite having a similar inhibitory trend (NDVI) to the Spring–Summer field trial. The remaining phytotoxicity of CG seemed to be sufficient to affect the growth of Autumn crops, since no nutrient deficit was found in the CG plots. Additionally, contrasting behavior between the Spring–Summer and Autumn crops in the CG plots might be related to the different sensitivity of plant species to the same phytochemicals [53]. On the other hand, CC waste did not show a clear pattern for weeds or crops. However, the values of both weeds and crops biomass tended to be lower than in the control plots. This could be related to the high C/N ratio, as previously discussed [50]. Additional studies under field conditions should be conducted to clarify this issue.
The waste dose applied may also influence the results. Most studies assessing the value of CG as an organic amendment found that doses higher than 10% had a toxic effect on lettuce, broccoli, leek, radish, viola, and sunflower [32,33,34]. However, growing substrate containing up to 5% CG stimulated seed emergence of Brassica crops [54]. In our field trials, CG was used at 9 Mg ha−1, which is lower than that previously reported [32] and agreed with those results, showing positive effects of CG at low densities [54]. Interestingly, we found that CG dose positively impacted the growth of both L. sativa and R. sativus and additionally reduced weed biomass when precipitation was scarce, and temperature was warm (Spring–Summer). However, this effect was not consistent under different environmental conditions (Autumn), probably because the dose used represents a threshold between low and medium-high doses under field conditions. The effect of CG at different doses in the field is an interesting topic that requires further research.
Cyperus spp. are among the most serious weed species in arable lands in warmer countries, substantially reducing crop yield, especially in organic agriculture [55]. They efficiently reproduce by seed and tubers and show tolerance to various herbicides [56]. For these reasons, Cyperus spp. have become particularly worrisome to farmers and efficient alternatives are urgently needed to control them. That is why we paid attention to evaluating the effect of the tested waste on this weed group. Unfortunately, the tested waste did not effectively control Cyperus weeds. However, in field trials, the lowest biomass value of Cyperus spp. was obtained from CG plots in Spring–Summer and CC plots in Autumn. As discussed above, the applied dose might be the key to obtaining effective results. Hardgrove and Livesley [33] found that amendments with increasing rates of CG decreased weed growth. Therefore, it can be suggested that higher doses of CG and CC than those applied in the present study may contribute to reducing Cyperus spp.; for that, an additional evaluation is required.
On the other hand, organic waste is expected to improve soil fertility. For example, Cervera-Mata et al. [32] showed that the addition of CG at 10% to two different soils increased the content of organic carbon, total N, and available K after 15, 30, 45, and 60 days. Similarly, Chrysargyris et al. [54] found that a substrate mixture including CG showed enriched content of N, P, K, and some micronutrients. In the case of F waste, Al-Chammaa et al. [37] proved that adding green manures of V. faba pods as soil amendment with, 15 days before plant sowing, provided a considerable amount of N requirements for Sorghum plants. These three studies were conducted in pots using a range of substrates (peat–perlite and field soil). In our study, a more basic pH (by F, CG, and CC) and improved OM content (by F and CG) and total N (by CG) were obtained when the effect of these wastes was evaluated in pots. Against expectations, field trials indicated that F, CG, and CC did not increase soil nutrients. Although we did not check for this, one plausible explanation might be related to the different decomposition rates occurring in the pots (e.g., higher temperature) that accelerates the process. Moreover, even if a similar decomposition rate occurred between pot and field trials, leaching or movement of nutrients from pots was likely to be hampered by a physical barrier.
5. Conclusions
Finding new alternatives to control weeds is a major task for the future of organic agriculture, as well as for environmental and human health preservation. Various organic waste can play an important role in replacing synthetic pesticides, which is why we assessed the role of Urtica dioica waste, Vicia faba pods, spent coffee grounds, and corn cob waste. The work presented here shows that the applied doses of organic waste can reduce the sprouting of weeds, but can also have a negative impact on cash crop yields.
The findings of this study show that, among all of the evaluated waste, the application of CG at 9 Mg ha−1 reduced the total biomass of naturally-emerged weeds, while stimulating crop growth, under scarce rainfall and warm days. The inhibitory effect is likely to occur between weeks three and four, after the incorporation of the waste into the soil. The inhibitory and stimulating effects of CG obtained under real conditions suggest that this waste could partially replace the use of synthetic agrochemicals and provide new evidence to boost a circular economy. However, the effectiveness of this waste seems to be limited by environmental conditions and probably by the applied dose. Despite these promising results, additional field research is required to corroborate the obtained effect of CG at different doses in the long term, covering several years.
Supplementary Materials
The following supporting information can be downloaded at: https://0-www-mdpi-com.brum.beds.ac.uk/article/10.3390/agronomy12051184/s1: Figure S1: Meteorological data registered during pot experiments in Spring–Summer (A, Experiment 1) and Autumn (B, Experiment 2) 2019; Figure S2: Meteorological data registered during field experiments in Spring–Summer (A, Experiment 3) and Autumn (B, Experiment 4) 2020; Figure S3: Effect of the interaction between waste treatments and time on biomass of different weed groups (dicotyledons, monocotyledons, Cyperus spp., total weeds) in experimental filed plots in Spring–Summer (Experiment 3, 2020) and Autumn (Experiment 4, 2020); Table S1: Content of macro- and micronutrients of agri-food waste used in the field trials; Table S2: Repeated measures results obtained via generalized linear mixed models to test for the effect of treatment (different waste), time (sampling week), and the interaction between them on the normalized difference vegetation index (NDVI) of weeds and crops and on the biomass of different weed groups in experimental field plots under Spring–Summer and Autumn conditions (Experiment 3 and 4, 2020, respectively); Table S3: Effect of time on biomass of different weed groups (dicotyledons, monocotyledons, Cyperus spp., total weeds) in experimental field plots in Spring–Summer (Experiment 3, 2020) and Autumn (Experiment 4, 2020); Table S4: Effect of treatment (agri-food waste) on the macro- and micronutrients content of Lactuca sativa leaves and Raphanus sativus roots grown in field plots in Spring–Summer (S-S) (Experiment 3, 2020) and of Brassica rapa leaves and Beta vulgaris roots grown in field plots during Autumn (A) (Experiment 4, 2020).
Author Contributions
Conceptualization, P.L., R.G. and C.G.; methodology, P.L., R.G., S.B. and C.G.; formal analysis, P.L.; investigation, P.L., R.G., S.B. and C.G.; resources, P.L., R.G., A.J.D.F. and C.G.; data curation, P.L., R.G., S.B. and C.G.; writing—original draft preparation, P.L.; review and editing, R.G., S.B., A.J.D.F. and C.G.; supervision, P.L.; additional funding acquisition, P.L., R.G., A.J.D.F. and C.G. All authors have read and agreed to the published version of the manuscript.
Funding
This work was supported by the Portuguese Foundation for Science and Technology—FCT/MEC and ERDF, within the PT2020 Partnership Agreement, and COMPETE 2020, grant number UID/BIA/04004/2019 and FCT-UIDB/681/2020. P.L. was funded by FCT, grant SFRH/BPD/88504/2012 and contract IT057-18-7248.
Data Availability Statement
The data that support the findings of this study are available from the corresponding author, P.L., upon request.
Acknowledgments
The authors thank the Frip company, Dona Olga Bar, Abadia Bar, Novo Pinguin, Pedro Moreira, the local farmers, Francisco Farias, and the ESAC students for the supplied waste or field and technical support.
Conflicts of Interest
The authors declare no conflict of interest.
References
- Cycon, M.; Mrozik, A.; Piotrowska-Seget, Z. Bioaugmentation as a strategy for the remediation of pesticide-polluted soil: A review. Chemosphere 2017, 172, 52–71. [Google Scholar] [CrossRef] [PubMed]
- De Corato, U. Towards new soil management strategies for improving soil quality and ecosystem services in sustainable agriculture: Editorial overview. Sustainability 2020, 12, 9398. [Google Scholar] [CrossRef]
- Khan, M.A.; Costa, F.B.; Fenton, O.; Jordan, P.; Fennell, C.; Mellander, P.E. Using a multi-dimensional approach for catchment scale herbicide pollution assessments. Sci. Total Environ. 2020, 747, 141232. [Google Scholar] [CrossRef] [PubMed]
- Duke, S.O.; Heap, I. Evolution of weed resistance to herbicides: What have we learned after 70 years? In Biology, Physiology and Molecular Biology of Weeds; Jugulam, M., Ed.; CRC Press: Boca Raton, FL, USA, 2017; pp. 63–86. [Google Scholar]
- Green, J.M.; Owen, M.D.K. Herbicide-resistant crops: Utilities and limitations for herbicide-resistant weed management. J. Agric. Food Chem. 2011, 59, 5819–5829. [Google Scholar] [CrossRef]
- Carvalho, F.P. Pesticides, environment, and food safety. Food Energy Secur. 2017, 6, 48–60. [Google Scholar] [CrossRef]
- Fasusi, O.A.; Babalola, O.O. The multifaceted plant-beneficial rhizobacteria toward agricultural sustainability. Plant Protect. Sci. 2021, 57, 95–111. [Google Scholar]
- European Commission (EC). Regulation No 834/2007. Official Journal of the European Union on Organic Production and Labeling of Organic Products and Repealing Regulation (EEC); No 2092/91. OJL 189, 20.7.2007; European Commission (EC): Brussels, Belgium, 2007; pp. 1–23. [Google Scholar]
- European Commission (EC). Organic Farming in the EU. A Fast Growing Sector; EU Agricultural Markets Briefs; European Commission (EC): Brussels, Belgium, 2019. [Google Scholar]
- European Commission (EC). Communication from the Commission to the European Parliament, the Council, the European Economic and Social Committee and the Committee of the Regions. A Farm to Fork Strategy for a Fair, Healthy and Environmentally-Friendly Food System; Communication No 381/2020. 20.5.2020; European Commission (EC): Brussels, Belgium, 2020; pp. 1–20. [Google Scholar]
- Semida, W.M.; Beheiry, H.R.; Sétamou, M.; Simpson, C.R.; Abd El-Mageed, T.A.; Rady, M.M.; Nelson, S.D. Biochar implications for sustainable agriculture and environment: A review. S. Afr. J. Bot. 2019, 127, 333–347. [Google Scholar] [CrossRef]
- Lorenzo, P.; Reboredo-Durán, J.; Muñoz, L.; Freitas, H.; González, L. Herbicidal properties of the commercial formulation of methyl cinnamate, a natural compound in the invasive silver wattle (Acacia dealbata). Weed Sci. 2020, 68, 69–78. [Google Scholar] [CrossRef] [Green Version]
- Puig, C.G.; Álvarez-Iglesias, L.; Reigosa, M.J.; Pedrol, N. Eucalyptus globulus leaves incorporated as green manure for weed control in maize. Weed Sci. 2013, 61, 154–161. [Google Scholar] [CrossRef]
- Souza-Alonso, P.; Puig, C.G.; Pedrol, N.; Freitas, H.; Rodríguez-Echeverría, S.; Lorenzo, P. Exploring the use of residues from the invasive Acacia sp. for weed control. Renew. Agric. Food Syst. 2020, 35, 26–37. [Google Scholar] [CrossRef]
- Duke, S.O.; Dayan, F.E.; Romagni, J.G.; Rimando, A.M. Natural products as sources of herbicides: Current status and future trends. Weed Res. 2000, 40, 99–111. [Google Scholar] [CrossRef]
- Dayan, F.E.; Owens, D.K.; Duke, S.O. Rationale for a natural products approach to herbicide discovery. Pest Manag. Sci. 2012, 68, 519–528. [Google Scholar] [CrossRef] [PubMed]
- Kadoglidou, K.; Kalaitzidis, A.; Stavrakoudis, D.; Mygdalia, A.; Katsantonis, D. A novel compost for rice cultivation developed by rice industrial by-products to serve circular economy. Agronomy 2019, 9, 553. [Google Scholar] [CrossRef] [Green Version]
- Pellejero, G.; Palacios, J.; Vela, E.; Gajardo, O.; Albrecht, L.; Aschkar, G.; Chrorolque, A.; García-Navarro, F.J.; Jiménez-Ballesta, R. Effect of the application of compost as an organic fertilizer on a tomato crop (Solanum lycopersicum L.) produced in the field in the Lower Valley of the Río Negro (Argentina). Int. J. Recycl. Org. Waste Agric. 2021, 10, 145–155. [Google Scholar]
- Diacono, M.; Montemurro, F. Long-term effects of organic amendments on soil fertility. A review. Agron. Sustain. Dev. 2010, 30, 401–422. [Google Scholar] [CrossRef] [Green Version]
- Zhou, H.; Chen, C.; Wang, D.; Arthur, E.; Zhang, Z.; Guo, Z.; Peng, X.; Mooney, S.J. Effect of long-term organic amendments on the full-range soil water retention characteristics of a Vertisol. Soil Till. Res. 2020, 202, 104663. [Google Scholar] [CrossRef]
- Campos, E.V.; Proença, P.L.; Oliveira, J.L.; Bakshi, M.; Abhilash, P.C.; Fraceto, L.F. Use of botanical insecticides for sustainable agriculture: Future perspectives. Ecol. Indic. 2019, 105, 483–495. [Google Scholar] [CrossRef] [Green Version]
- European Commission (EC). Directive (EU) 2018/851 of the European Parliament and of the Council of 30 May 2018 Amending Directive 2008/98/EC on Waste; OJL 150, 14.6.2018; European Commission (EC): Brussels, Belgium, 2018; pp. 109–140. [Google Scholar]
- Oliveira, T.; Dias, R.R. Tendências Económico-Sociais No Consumo de Café em Portugal Para. 2021. Available online: https://www.academia.edu/16593649/O_Cafe_Perspectivas_e_Tende_ncias_Sociais_em_Portugal (accessed on 30 September 2021).
- Caldeira, D.C.A. Valorização da Borra de Café: Otimização da Produção de Biodiesel por Catálise Enzimática. Ph.D. Thesis, Instituto Superior de Engenharia do Porto, Porto, Portugal, 2015. [Google Scholar]
- AMPROMIS. Associaçião Nacional dos Produtores de Milho e Sorgo. 2021. Available online: https://www.anpromis.pt/ (accessed on 25 August 2021).
- Pinto, J.; Cruz, D.; Paiva, A.; Pereira, S.; Tavares, P.; Fernandes, L.; Varum, H. Characterization of corn cob as a possible raw building material. Constr. Build. Mater. 2012, 34, 28–33. [Google Scholar] [CrossRef]
- Ramos, A.; Briga-Sá, A.; Pereira, S.; Correia, M.; Pinto, J.; Bentes, I.; Teixeira, C.A. Thermal performance and life cycle assessment of corn cob particleboards. J. Build. Eng. 2021, 44, 102998. [Google Scholar] [CrossRef]
- Viana, R.L.S.; Fidelis, G.P.; Medeiros, M.J.C.; Morgano, M.A.; Alves, M.G.C.F.; Passero, L.F.D.; Pontes, D.L.; Theodoro, R.C.; Arantes, T.D.; Sabry, D.A.; et al. Green synthesis of antileishmanial and antifungal silver nanoparticles using corn cob xylan as a reducing and stabilizing agent. Biomolecules 2020, 10, 1235. [Google Scholar] [CrossRef]
- Stylianou, M.; Agapiou, A.; Omirou, M.; Vyrides, I.; Ioannides, I.M.; Maratheftis, G.; Fasoula, D. Converting environmental risks to benefits by using spent coffee grounds (SCG) as a valuable resource. Environ. Sci. Pollut. R. 2018, 25, 35776–35790. [Google Scholar] [CrossRef] [PubMed]
- McNutt, J.; He, Q. Spent coffee grounds: A review on current utilization. J. Ind. Eng. Chem. 2019, 71, 78–88. [Google Scholar] [CrossRef]
- Yamane, K.; Kono, M.; Fukunaga, T.; Iwai, K.; Sekine, R.; Watanabe, Y.; Iijima, M. Field evaluation of coffee grounds application for crop growth enhancement, weed control, and soil improvement. Plant Prod. Sci. 2014, 17, 93–102. [Google Scholar] [CrossRef]
- Cervera-Mata, A.; Pastoriza, S.; Rufián-Henares, J.A.; Párraga, J.; Martín-García, J.M.; Delgado, G. Impact of spent coffee grounds as organic amendment on soil fertility and lettuce growth in two Mediterranean agricultural soils. Arch. Agron. Soil Sci. 2018, 64, 790–804. [Google Scholar] [CrossRef]
- Hardgrove, S.J.; Livesley, S.J. Applying spent coffee grounds directly to urban agriculture soils greatly reduces plant growth. Urban For. Urban Green. 2016, 18, 1–8. [Google Scholar] [CrossRef]
- Gomes, T.; Pereira, J.A.; Ramalhosa, E.; Casal, S.; Baptista, P. Effect of fresh and composted spent coffee grounds on lettuce growth, photosynthetic pigments and mineral composition. In VII Congreso Ibérico de Agroingeniería y Ciencias Horticolas; Téllez, A., Masaguer, F., Sancho, I., Robinson, M., Altisent, M., Ballesteros, F., Strap, E., Eds.; SECH e SEAgIng: Madrid, Spain, 2014; pp. 1–5. [Google Scholar]
- Batish, D.R.; Singh, H.P.; Kaur, M.; Kohli, R.K.; Yadav, S.S. Caffeine affects adventitious rooting and causes biochemical changes in the hypocotyl cuttings of mung bean (Phaseolus aureus Roxb.). Acta Physiol. Plant. 2008, 30, 401–405. [Google Scholar] [CrossRef]
- Álvarez-Iglesias, L.; Puig, C.G.; Revilla, P.; Reigosa, M.J.; Pedrol, N. Faba bean as green manure for field weed control in maize. Weed Res. 2018, 58, 437–449. [Google Scholar] [CrossRef]
- Al-Chammaa, M.; Al-Ain, F.; Kurdali, F. Growth, nitrogen and phosphorus uptake of sorghum plants as affected by green manuring with pea or faba bean shell pod wastes using N. Open Agric. J. 2019, 13, 133–145. [Google Scholar] [CrossRef]
- Roshan-Bakhsh, A.; Pourjam, E.; Ayyari, M.; Pedram, M. Biocontrol properties of some agricultural waste extracts on three nematode species in in vitro and in vivo conditions. Nematology 2019, 21, 837–846. [Google Scholar] [CrossRef]
- Hernández, M.; Ventura, J.; Castro, C.; Boone, V.; Rojas, R.; Ascacio-Valdés, J.; Martínez-Ávila, G. Uplc-esi-qtof-ms2-based identification and antioxidant activity assessment of phenolic compounds from red corn cob (Zea mays L.). Molecules 2018, 23, 1425. [Google Scholar] [CrossRef] [Green Version]
- Gullón, P.; Eibes, G.; Lorenzo, J.M.; Pérez-Rodríguez, N.; Lú-Chau, T.A.; Gullón, B. Green sustainable process to revalorize purple corn cobs within a biorefinery frame: Co-production of bioactive extracts. Sci. Total Environ. 2020, 709, 136236. [Google Scholar] [CrossRef] [PubMed]
- Kottek, M.; Grieser, J.; Beck, C.; Rudolf, B.; Rubel, F. World map of the Köppen-Geiger climate classification updated. Meteorol. Z. 2006, 15, 259–263. [Google Scholar] [CrossRef]
- Guilherme, R.; Reboredo, F.; Guerra, M.; Ressurreição, S.; Alvarenga, N. Elemental composition and some nutritional parameters of sweet pepper from organic and conventional agriculture. Plants 2020, 9, 863. [Google Scholar] [CrossRef] [PubMed]
- Abbas, T.; Nadeem, M.A.; Tanveer, A.; Ali, H.H.; Farooq, N. Role of allelopathic crop mulches and reduced doses of tank-mixed herbicides in managing herbicide-resistant Phalaris minor in wheat. Crop Prot. 2018, 110, 245–250. [Google Scholar] [CrossRef]
- Farooq, M.; Nawaz, A.; Ahmad, E.; Nadeem, F.; Hussain, M.; Siddique, K.H. Using sorghum to suppress weeds in dry seeded aerobic and puddled transplanted rice. Field Crop. Res. 2017, 214, 211–218. [Google Scholar] [CrossRef]
- Magalhães, M.C.; Cameira, M.C.; Pato, R.L.; Santos, F.; Bandeira, J. Biomassa florestal residual: Efeitos da sua remoção na qualidade do solo. Rev. Ciências Agrárias 2011, 34, 205–217. [Google Scholar]
- Almeida, D. Manual de Culturas Hortícolas; Coleção: Guias Práticos; Presença: Lisboa, Portugal, 2006; Volume II, p. 400. [Google Scholar]
- Ali, A.M.; Thind, H.S. A framework for refining nitrogen management in dry direct-seeded rice using GreenSeeker™ optical sensor. Comput. Electron. Agric. 2015, 110, 114–120. [Google Scholar] [CrossRef]
- R Development Core Team. R: A Language and Environment for Statistical Computing; R Foundation for Statistical Computing: Vienna, Austria, 2015. [Google Scholar]
- Álvarez-Iglesias, L. Vicia faba L. for Weed Control: From Biochemical Evidences to Field Application. Ph.D. Thesis, Universidade de Vigo, Vigo, Spain, 2015. [Google Scholar]
- Osunde, M.O.; Olayinka, A.; Fashina, C.D.; Torimiro, N. Effect of carbon-nitrogen ratios of lignocellulosic substrates on the yield of mushroom (Pleurotus pulmonarius). OALib. J. 2019, 6, 1–8. [Google Scholar] [CrossRef]
- Miranda, J.; Costa, L.M.D.; Ruiz, H.A.; Einloft, R. Composição química da solução de solo sob diferentes coberturas vegetais e análise de carbono orgânico solúvel no deflúvio de pequenos cursos de água. Rev. Bras. Cienc. Solo 2006, 30, 633–647. [Google Scholar] [CrossRef] [Green Version]
- Urbaniak, M.; Gągała, I.; Szewczyk, M.; Bednarek, A. Leaching of PCBs and nutrients from soil fertilized with municipal sewage sludge. Bull. Environ. Contam. Tox. 2016, 97, 249–254. [Google Scholar] [CrossRef] [Green Version]
- Kobayashi, K. Factors affecting phytotoxic activity of allelochemicals in soil. Weed Biol. Manag. 2004, 4, 1–7. [Google Scholar] [CrossRef]
- Chrysargyris, A.; Antoniou, O.; Xylia, P.; Petropoulos, S.; Tzortzakis, N. The use of spent coffee grounds in growing media for the production of Brassica seedlings in nurseries. Environ. Sci. Pollut. Res. 2021, 28, 24279–24290. [Google Scholar] [CrossRef] [PubMed]
- Peerzada, A.M. Biology, agricultural impact, and management of Cyperus rotundus L.: The world’s most tenacious weed. Acta Physiol. Plant. 2017, 39, 270. [Google Scholar] [CrossRef]
- Riemens, M.M.; van der Weide, R.Y.; Runia, W.T. Nutsedge, Biology and Control of Cyperus rotundus and Cyperus esculentus, Review of a Literature Survey; Plant Research International B.V.: Wageningen, The Netherlands, 2008. [Google Scholar]
Figure 1.
Effect of waste treatments on the biomass of dicotyledon weeds (A,E); monocotyledon weeds (B,F); the weed Cyperus spp. (C,G); and total weeds (D,H) emerged from pots filled with agricultural soil and placed outdoors in Spring–Summer (Experiment 1, 2019) and Autumn (Experiment 2, 2019). C = control, FE = Vicia faba pod extract, UE = Urtica dioica extract, F = Vicia faba pod waste, U = Urtica dioica waste, CG = spent coffee grounds waste, CC = corn cobs waste, H = positive control with herbicide. Dw = dry weight. Figures show least-square mean values (±confidence intervals). n = 5. For Cyperus spp. biomass in Spring–Summer, confidence intervals were back-transformed from the log scale. Different letters indicate statistical significance according to the lsmeans function at p ≤ 0.05.

Figure 2.
Effect of time (sampling week, (A,D)), treatment (different waste, (B,E)), and the interaction between these two factors (C,F)) on the normalized difference vegetation index (NDVI) recorded in field experiments under Spring–Summer and Autumn conditions (Experiment 3 and 4, 2020, respectively). W1, W2,…, W7 = week 1, week 2,…, week 7 after waste incorporation. C = control, F = Vicia faba pod waste, CG = spent coffee grounds waste, CC = corn cob waste. Figures show least-square mean values (±confidence intervals). n = 4. Different letters refer to statistical significance according to significant p values from Table S2 and lsmeans function at p ≤ 0.05.

Figure 3.
Effect of waste treatments on biomass of dicotyledon weeds (A,E); monocotyledon weeds (B,F); the weed Cyperus spp. (C,G); and total weeds (D,H) in experimental field plots in Spring–Summer (Experiment 3, 2020) and Autumn (Experiment 4, 2020). C = control, F = Vicia faba pod waste, CG = spent coffee grounds waste, CC = corn cob waste. Dw = dry weight. Figures show least-square mean values (±confidence intervals). n = 16. Least-square mean values without statistical letters are not significantly different. Different letters indicate statistical significance according to significant p values from Table S2 and lsmeans function at p ≤ 0.05.

Figure 4.
Effect of waste treatments on leaf, root, and total biomass of Lactuca sativa (A) and Raphanus sativus (B) grown in field plots in Spring–Summer (Experiment 3, 2020) and of leaf, root, and total biomass of Brassica rapa (C) and Beta vulgaris (D) grown in field plots during Autumn (Experiment 4, 2020). Upper figures = leaf-edible crops. Lower figures = bulb-edible crops. C = control, F = Vicia faba pod waste, CG = spent coffee grounds waste, CC = corn cobs waste. Dw = dry weight. plot = random factor. Figures show least-square mean values (±confidence intervals). n = 4–12, 10–15, 9–11, and 10–14 for L. sativa, R. sativus, B. rapa, and B. vulgaris, respectively. Different letters indicate statistical differences according to the lsmeans function at p ≤ 0.05 after conducting linear mixed models.


Table 1.
Doses for treatments tested in Experiment 1.
| Treatment | Abbreviation | Dose |
|---|---|---|
| River water/no waste (negative control) (L ha−1) | C | 45,418.8 |
| Vicia faba pod extract (L ha−1) | FE | 45,418.8 |
| Urtica dioca extract (L ha−1) | UE | 45,418.8 |
| Vicia faba pod waste (Mg ha−1) | F | 28 |
| Urtica dioca waste (Mg ha−1) | U | 9 |
| Herbicide (positive control) (L ha−1) | H | 3 |
Table 2.
Doses for treatments tested in Experiment 2.
| Treatment | Abbreviation | Dose |
|---|---|---|
| River water/no waste (negative control) (L ha−1) | C | 45,418.8 |
| Vicia faba pod extract (L ha−1) | FE | 45,418.8 |
| Urtica dioca extract (L ha−1) | UE | 45,418.8 |
| Vicia faba pod waste (Mg ha−1) | F | 9 |
| Urtica dioca waste (Mg ha−1) | U | 9 |
| Spent coffee grounds waste (Mg ha−1) | CG | 28 |
| Corn cob waste (Mg ha−1) | CC | 9 |
| Herbicide (positive control) (L ha−1) | H | 3 |
Table 3.
Values of soil properties obtained in soils mixed with different waste and collected at the end of Experiment 2 (Autumn pots, 2019). Least-square mean values (±confidence intervals) are shown. n = 5.
Table 3.
Values of soil properties obtained in soils mixed with different waste and collected at the end of Experiment 2 (Autumn pots, 2019). Least-square mean values (±confidence intervals) are shown. n = 5.
| Treatment | pH | Organic Matter (%) | N (%) | P2O5 (mg kg−1) | K2O (mg kg−1) |
|---|---|---|---|---|---|
| River water/no waste (negative control) | 6.06 ± 0.17 c | 2.70 ± 0.28 c | 0.17 ± 0.02 b | 422 ± 120 | 390 ± 160 |
| Vicia faba pod extract | 6.40 ± 0.17 ab | 2.81 ± 0.28 bc | 0.17 ± 0.02 b | 358 ± 120 | 413 ± 160 |
| Urtica dioca extract | 6.44 ± 0.17 ab | 2.80 ± 0.28 bc | 0.17 ± 0.02 b | 298 ± 120 | 346 ± 160 |
| Vicia faba pod waste | 6.41 ± 0.17 ab | 3.15 ± 0.28 b | 0.19 ± 0.02 ab | 350 ± 120 | 576 ± 160 |
| Urtica dioca waste | 6.57 ± 0.17 a | 3.12 ± 0.28 bc | 0.19 ± 0.02 ab | 390 ± 120 | 442 ± 160 |
| Spent coffee grounds waste | 6.28 ± 0.17 bc | 3.86 ± 0.28 a | 0.22 ± 0.02 a | 309 ± 120 | 316 ± 160 |
| Corn cob waste | 6.46 ± 0.17 ab | 2.91 ± 0.28 bc | 0.16 ± 0.02 b | 255 ± 120 | 373 ± 160 |
| Herbicide (positive control) | 6.32 ± 0.17 abc | 2.73 ± 0.28 bc | 0.17 ± 0.02 b | 388 ± 120 | 333 ± 160 |
| p | <0.001 | <0.001 | <0.001 | 0.116 | 0.052 |
Values in bold indicate significance at p ≤ 0.05. Least-square mean values within a column and without statistical letters are not significantly different, when followed by different superscript letters statistical differences were found according to the lsmeans function at p ≤ 0.05.
Table 4.
Effect of treatment (different waste), time (sampling week), and the interaction between them on soil properties from soils collected in the experimental field plots during Experiment 3 (Spring–Summer, 2020) and Experiment 4 (Autumn, 2020). Least-square mean values (±confidence intervals) are shown. n = 4.
| Season | Source of Variation | Source Level | pH | Organic Matter (%) | N (%) | P2O5 (mg kg−1) | K2O (mg kg−1) |
|---|---|---|---|---|---|---|---|
| Spring–Summer | Treatment (Tr) | C | 6.79 ± 0.17 | 1.89 ± 0.30 | 0.123 ± 0.02 | 191 ± 120.0 | 227 ± 63.0 |
| F | 6.90 ± 0.17 | 1.91 ± 0.30 | 0.129 ± 0.02 | 251 ± 120.0 | 265 ± 63.0 | ||
| CG | 6.89 ± 0.17 | 2.06 ± 0.30 | 0.144 ± 0.02 | 218 ± 120.0 | 267 ± 63.0 | ||
| CC | 6.96 ± 0.17 | 1.88 ± 0.29 | 0.130 ± 0.02 | 215 ± 120.1 | 295 ± 63.0 | ||
| p | 0.285 | 0.643 | 0.137 | 0.817 | 0.259 | ||
| Time (t) | W4 | 6.92 ± 0.11 | 2.07 ± 0.19 a | 0.133 ± 0.01 | 246 ± 75.0 | 309 ± 40.0 a | |
| W8 | 6.84 ± 0.11 | 1.80 ± 0.18 b | 0.129 ± 0.01 | 192 ± 75.0 | 218 ± 39.0 b | ||
| p | 0.207 | 0.021 | 0.559 | 0.196 | 0.001 | ||
| Tr × t | C W4 | 6.83 ± 0.2 | 1.80 ± 0.46 | 0.123 ± 0.03 | 191 ± 188.0 | 271 ± 98.6 | |
| F W4 | 6.95 ± 0.26 | 2.15 ± 0.46 | 0.139 ± 0.03 | 306 ± 188.2 | 335 ± 98.6 | ||
| CG W4 | 6.95 ± 0.26 | 2.23 ± 0.47 | 0.141 ± 0.03 | 234 ± 188.2 | 298 ± 98.9 | ||
| CC W4 | 6.97 ± 0.27 | 2.10 ± 0.46 | 0.130 ± 0.03 | 252 ± 188.2 | 334 ± 99.0 | ||
| C W8 | 6.75 ± 0.26 | 1.99 ± 0.47 | 0.122 ± 0.03 | 190 ± 188.0 | 184 ± 98.8 | ||
| F W8 | 6.85 ± 0.26 | 1.66 ± 0.46 | 0.119 ± 0.03 | 197 ± 188.0 | 196 ± 98.5 | ||
| CG W8 | 6.83 ± 0.27 | 1.89 ± 0.46 | 0.147 ± 0.03 | 202 ± 188.0 | 237 ± 99.0 | ||
| CC W8 | 6.95 ± 0.2 | 1.66 ± 0.46 | 0.130 ± 0.03 | 178 ± 188.5 | 256 ± 98.9 | ||
| p | 0.950 | 0.139 | 0.528 | 0.884 | 0.670 | ||
| Autumn | Treatment | C | 6.41 ± 0.17 a | 1.92 ± 0.21 ab | 0.146 ± 0.01 ab | 244 ± 69.0 a | 304 ± 74.0 a |
| F | 6.15 ± 0.18 b | 1.82 ± 0.21 b | 0.126 ± 0.01 c | 122 ± 34.2 b | 191 ± 74.0 b | ||
| CG | 6.39 ± 0.18 ab | 2.16 ± 0.21 a | 0.161 ± 0.01 a | 299 ± 103.0 a | 247 ± 74.0 ab | ||
| CC | 6.36 ± 0.18 ab | 2.04 ± 0.21 ab | 0.141 ± 0.01 bc | 186 ± 52.0 ab | 203 ± 74.0 ab | ||
| p | 0.032 | 0.023 | <0.001 | <0.001 | 0.023 | ||
| Time | W4 | 6.29 ± 0.11 | 2.01 ± 0.13 | 0.149 ± 0.01 a | 264 ± 54.0 a | 248 ± 46.0 | |
| W8 | 6.36 ± 0.11 | 1.95 ± 0.13 | 0.138 ± 0.01 b | 161 ± 31.0 b | 224 ± 46.0 | ||
| p | 0.263 | 0.438 | 0.036 | 0.009 | 0.396 | ||
| Tr × t | C W4 | 6.36 ± 0.28 | 1.97 ± 0.33 | 0.158 ± 0.02 | 228 ± 99.0 bc | 313 ±116.0 | |
| F W4 | 6.06 ± 0.27 | 1.81 ± 0.33 | 0.129 ± 0.02 | 133 ± 57.6 bcd | 196 ± 116.0 | ||
| CG W4 | 6.36 ± 0.27 | 2.27 ± 0.33 | 0.167 ± 0.02 | 512 ± 221.5 a | 261 ± 115.4 | ||
| CC W4 | 6.38 ± 0.27 | 2.00 ± 0.33 | 0.142 ± 0.02 | 185 ± 80.1 bc | 221 ± 115.0 | ||
| C W8 | 6.46 ± 0.28 | 1.87 ± 0.33 | 0.135 ± 0.02 | 261 ± 112.8 ab | 294 ± 116.0 | ||
| F W8 | 6.24 ± 0.28 | 1.82 ± 0.33 | 0.123 ± 0.02 | 111 ± 48.0 cd | 185 ± 115.2 | ||
| CG W8 | 6.42 ± 0.28 | 2.05 ± 0.33 | 0.154 ± 0.02 | 85 ± 36.8 d | 233 ± 116.0 | ||
| CC W8 | 6.33 ± 0.28 | 2.08 ± 0.33 | 0.140 ± 0.02 | 187 ± 81.6 bc | 185 ± 115.7 | ||
| p | 0.677 | 0.537 | 0.448 | <0.001 | 0.989 |
Values in bold indicate significance at p ≤ 0.05. Least-square mean values within a column for each source of variation and without statistical letters are not significantly different; when accompanied by different superscript letters, statistical differences were found according to the lsmeans function at p ≤ 0.05. C = control, F = Vicia faba pod waste, CG = spent coffee grounds waste, CC = corn cob waste. W4 = week 4 after waste incorporation, W8 = week 8 after waste incorporation.
Publisher’s Note: MDPI stays neutral with regard to jurisdictional claims in published maps and institutional affiliations. |
© 2022 by the authors. Licensee MDPI, Basel, Switzerland. This article is an open access article distributed under the terms and conditions of the Creative Commons Attribution (CC BY) license (https://creativecommons.org/licenses/by/4.0/).
Share and Cite
MDPI and ACS Style
Lorenzo, P.; Guilherme, R.; Barbosa, S.; Ferreira, A.J.D.; Galhano, C. Agri-Food Waste as a Method for Weed Control and Soil Amendment in Crops. Agronomy 2022, 12, 1184. https://0-doi-org.brum.beds.ac.uk/10.3390/agronomy12051184
AMA Style
Lorenzo P, Guilherme R, Barbosa S, Ferreira AJD, Galhano C. Agri-Food Waste as a Method for Weed Control and Soil Amendment in Crops. Agronomy. 2022; 12(5):1184. https://0-doi-org.brum.beds.ac.uk/10.3390/agronomy12051184
Chicago/Turabian StyleLorenzo, Paula, Rosa Guilherme, Sara Barbosa, António J. D. Ferreira, and Cristina Galhano. 2022. "Agri-Food Waste as a Method for Weed Control and Soil Amendment in Crops" Agronomy 12, no. 5: 1184. https://0-doi-org.brum.beds.ac.uk/10.3390/agronomy12051184
Note that from the first issue of 2016, this journal uses article numbers instead of page numbers. See further details here.