Yield Stability Analysis in Maize Hybrids of Southwest China under Genotype by Environment Interaction Using GGE Biplot

College of Agriculture & Biological Sciences, Dali University, Dali 671003, China
*
Author to whom correspondence should be addressed.
Agronomy 2022, 12(5), 1189; https://0-doi-org.brum.beds.ac.uk/10.3390/agronomy12051189
Submission received: 20 April 2022
/
Revised: 12 May 2022
/
Accepted: 13 May 2022
/
Published: 15 May 2022
Abstract
:Selecting superior genotypes across different environments is vital for varietal release, crop planting, and commercial use. Therefore, the objectives of this research were to appraise the performance of hybrids approved in recent years in diverse environments, and recommend high-yielding and stable genotypes for wider adaptation. Fourteen single cross maize hybrid genotypes (G), including a check, were implemented across ten environments (E) in two crop seasons (2020 and 2021). The combined analysis of variance revealed that G, E, and their interactive (GEI) significantly (p < 0.01) affected the grain yield. Moreover, the mean grain yield ranged from 9333 kg ha−1 for HH-2 (2021) to 13,195 kg ha−1 for LD-18 (2020). The “which won where” GGE biplot revealed the existence of mega environments with their own best hybrids (LD-18 and LD-29 in 2020; LD-18, LD-19, and YY-1506 in 2021). The “mean vs. stable” GGE biplot suggested that LD-18 and ZY-811, with highest/middle productive and high stability across 10 environments, were closest to the ideal genotype. Furthermore, the “discriminating power vs. representativeness” GGE biplot showed that Xuanwei, Yanshan, Gengma, and Shiling were the most the ideal test environments for hybrid selecting, based on their discriminative ability and representativeness. Therefore, the GGE biplot analysis allowed for an efficient selection of high-yielding and stable maize hybrids to guide ecological planting and commercial use.
1. Introduction
Maize (Zea mays L.) is one of the most predominant crops in China, especially in the Southwest. It is the source of carbohydrates, protein, oil, iron, minerals, alcohol, vitamin B, and essential fatty acids [1,2]. Developing countries are the major consumers of maize. In China, maize is the largest crop, mainly used for feed production, and has a pivotal role in agriculture and animal husbandry. However, the average grain yield of maize in China was lower than that of other countries, i.e., the USA, Canada, Turkey, the European Union, and Argentina [3]. Therefore, selecting appropriate and productively stable maize hybrids for cultivation is an effective solution for increasing the grain yield of maize. Moreover, we can select ideal maize hybrids in diverse sites by evaluating genotype and environment interaction (GEI) and their stability [4,5].
GEI commonly exists and is associated with the performance and stability of varieties planted in different environments. Therefore, a variety that performs well in one site or period may not grow well in other conditions [6]. Hence, therefore, it is very important to analyze the yield and stability of new maize cultivars through multi-environment trials (METs) [7,8]. However, in the absence of appropriate analytical methods, breed selection may be inefficient. With the application of stability analysis models, and the genotype main effect plus genotype by environment interaction (GGE) biplot, the problem has been effectively solved [8,9,10].
The GGE biplot, which is a modification of the best linear unbiased prediction (BLUP), and the additive main effects and multiplicative interaction analysis (AMMI), is more superior because it displays both the effects of the genotypes and the GEI, which are the two sources of variation [11,12]. In other words, the GGE biplot analysis is a method in analyzing GEI and MET data for identifying and selecting the superior genotypes in specific environments [13,14]. Nowadays, GGE biplot analysis is the more widely used for integrating genotype main effect with the GEI effect [7], since it could benefit grouping mega environments [11], identify ideal environments with high representative and discriminative [15], and select genotypes with high grain yields and stability [16]. Additionally, GGE biplot analysis has been widely used in the study of maize [7,17,18,19,20], cotton [21], potato [14,22], sweet potato [23], wheat [24,25], and pigeon pea [26].
Therefore, the purposes of this study were to (a) evaluate the performance of 14 maize hybrid genotypes under 10 diverse environments through the GGE biplot, and (b) identify high-yielding and stable varieties across environments to help in the ecological planting and commercial use of maize cultivar.
2. Materials and Methods
2.1. Experimental Material
The experimental material in this study consisted of a check and thirteen single cross maize hybrids, which were approved by Yunnan province in recent years. The code and the source of these hybrids were given in Table 1. Among them, HH-2 hybrid was approved to control hybrids while the others (ZY-811, ZY-607, ZY-609, YY-1503, YY-1506, DY-201, DY-502, DY-602, LD-18, LD-19, LD-29, LX-1, and JL-118) were under evaluation.
2.2. Experimental Site
The 14 maize hybrids were performed in 10 environments in two crop seasons (2020 and 2021). The code and the characteristics of these 10 test environments were given in Table 2. Moreover, test accuracy analysis showed that the error coefficient of variation (CV) and the genetic coefficient of variation (GCV) in each test site were less than 10%, except for Yanshan in 2021 (Table S1), which indicated that pilot selection was reasonable, field operation was standardized, observation and measurement records were consistent, the test accuracy was high, and the results were reliable.
2.3. Experimental Design
The experiments were arranged by a randomized complete block design with three replications. Five-row experimental plots of 5 m length, spaced 0.8 m apart were used. The grain yield trait was used to check the productivity and stability of maize hybrids, which was calculated by the three central rows of each plot during harvest. Five protective rows were set up around the plot using the corresponding hybrids. Standard agronomic practices were carried out at all locations. Grain was timely harvested, and later measured for yield using the following formula:
where 10,000 m2 = area of 1 hectare plot.
Grain yield (kg ha−1) = (Unit grain yield (kg)/unit area (m2)) × 10,000 (m2 ha−1)
2.4. Statistical Analysis
The experimental data were preliminarily organized and analyzed by Excel. Variance analysis (ANOVA) was conducted by using statistical analysis software “Zone Test 99” (China Agricultural University). Additionally, the GGE biplot software (GenStat software Version 21.1) was used to graph the data [16].
3. Results
3.1. Variance Analysis for Grain Yield
The combined analysis of variance across 10 locations for 14 maize hybrids showed that G, E, and GEI significantly (p < 0.01) affected the grain yield in both two seasons (Table 3 and Table 4). In addition, the environment’s contribution to the total variation (SS) was high, explaining 73.49% and 66.74% of the SS in 2020 and 2021, respectively (Table 3 and Table 4). Hence, it was necessary to further analyze the GEI using GGE analysis.
3.2. Performance of Maize Grain Yield across the Environments
The yield performance of 14 maize hybrids across 10 environments was evaluated with their mean grain yield (Table 5, Table 6 and Table 7). For environments, grain yield ranged from 9222 kg ha−1 in Zhaotong to 15,065 kg ha−1 in Binchuan, while it was from 11,138 kg ha−1 (HH-2) to 13,195 kg ha−1 (LD-18) among hybrids in 2020 (Table 5). Meanwhile, in 2021, the lowest- and highest-yielding for environments was 8066 kg ha−1 (Zhaotong) and 13,113 kg ha−1 (Shilin), respectively. The yields ranged from 9333 kg ha−1 (HH-2) to 11,404 kg ha−1 (LD-18) among 14 maize hybrids (Table 6). Hybrids LD-18, LD-29, ZY-811, and LD-19 were found as the top four productive genotypes in 2020. Among these four hybrids, LD-18 was the highest-yielding genotype across six different environments in 2020, i.e., Xuanwei, Binchuan, Shilin, Lijiang, Mile, and Yanshan. Moreover, situation in 2021 was similar to that in 2020, where LD-18 performed best across five different environments followed by LD-19, ZY-811, and LX-1 (Table 6). Additionally, over the data of two years (Table 7), the best performing four hybrids were LD-18, LD-19, ZY-811, and LD-29, with LD-18 having the highest yield.
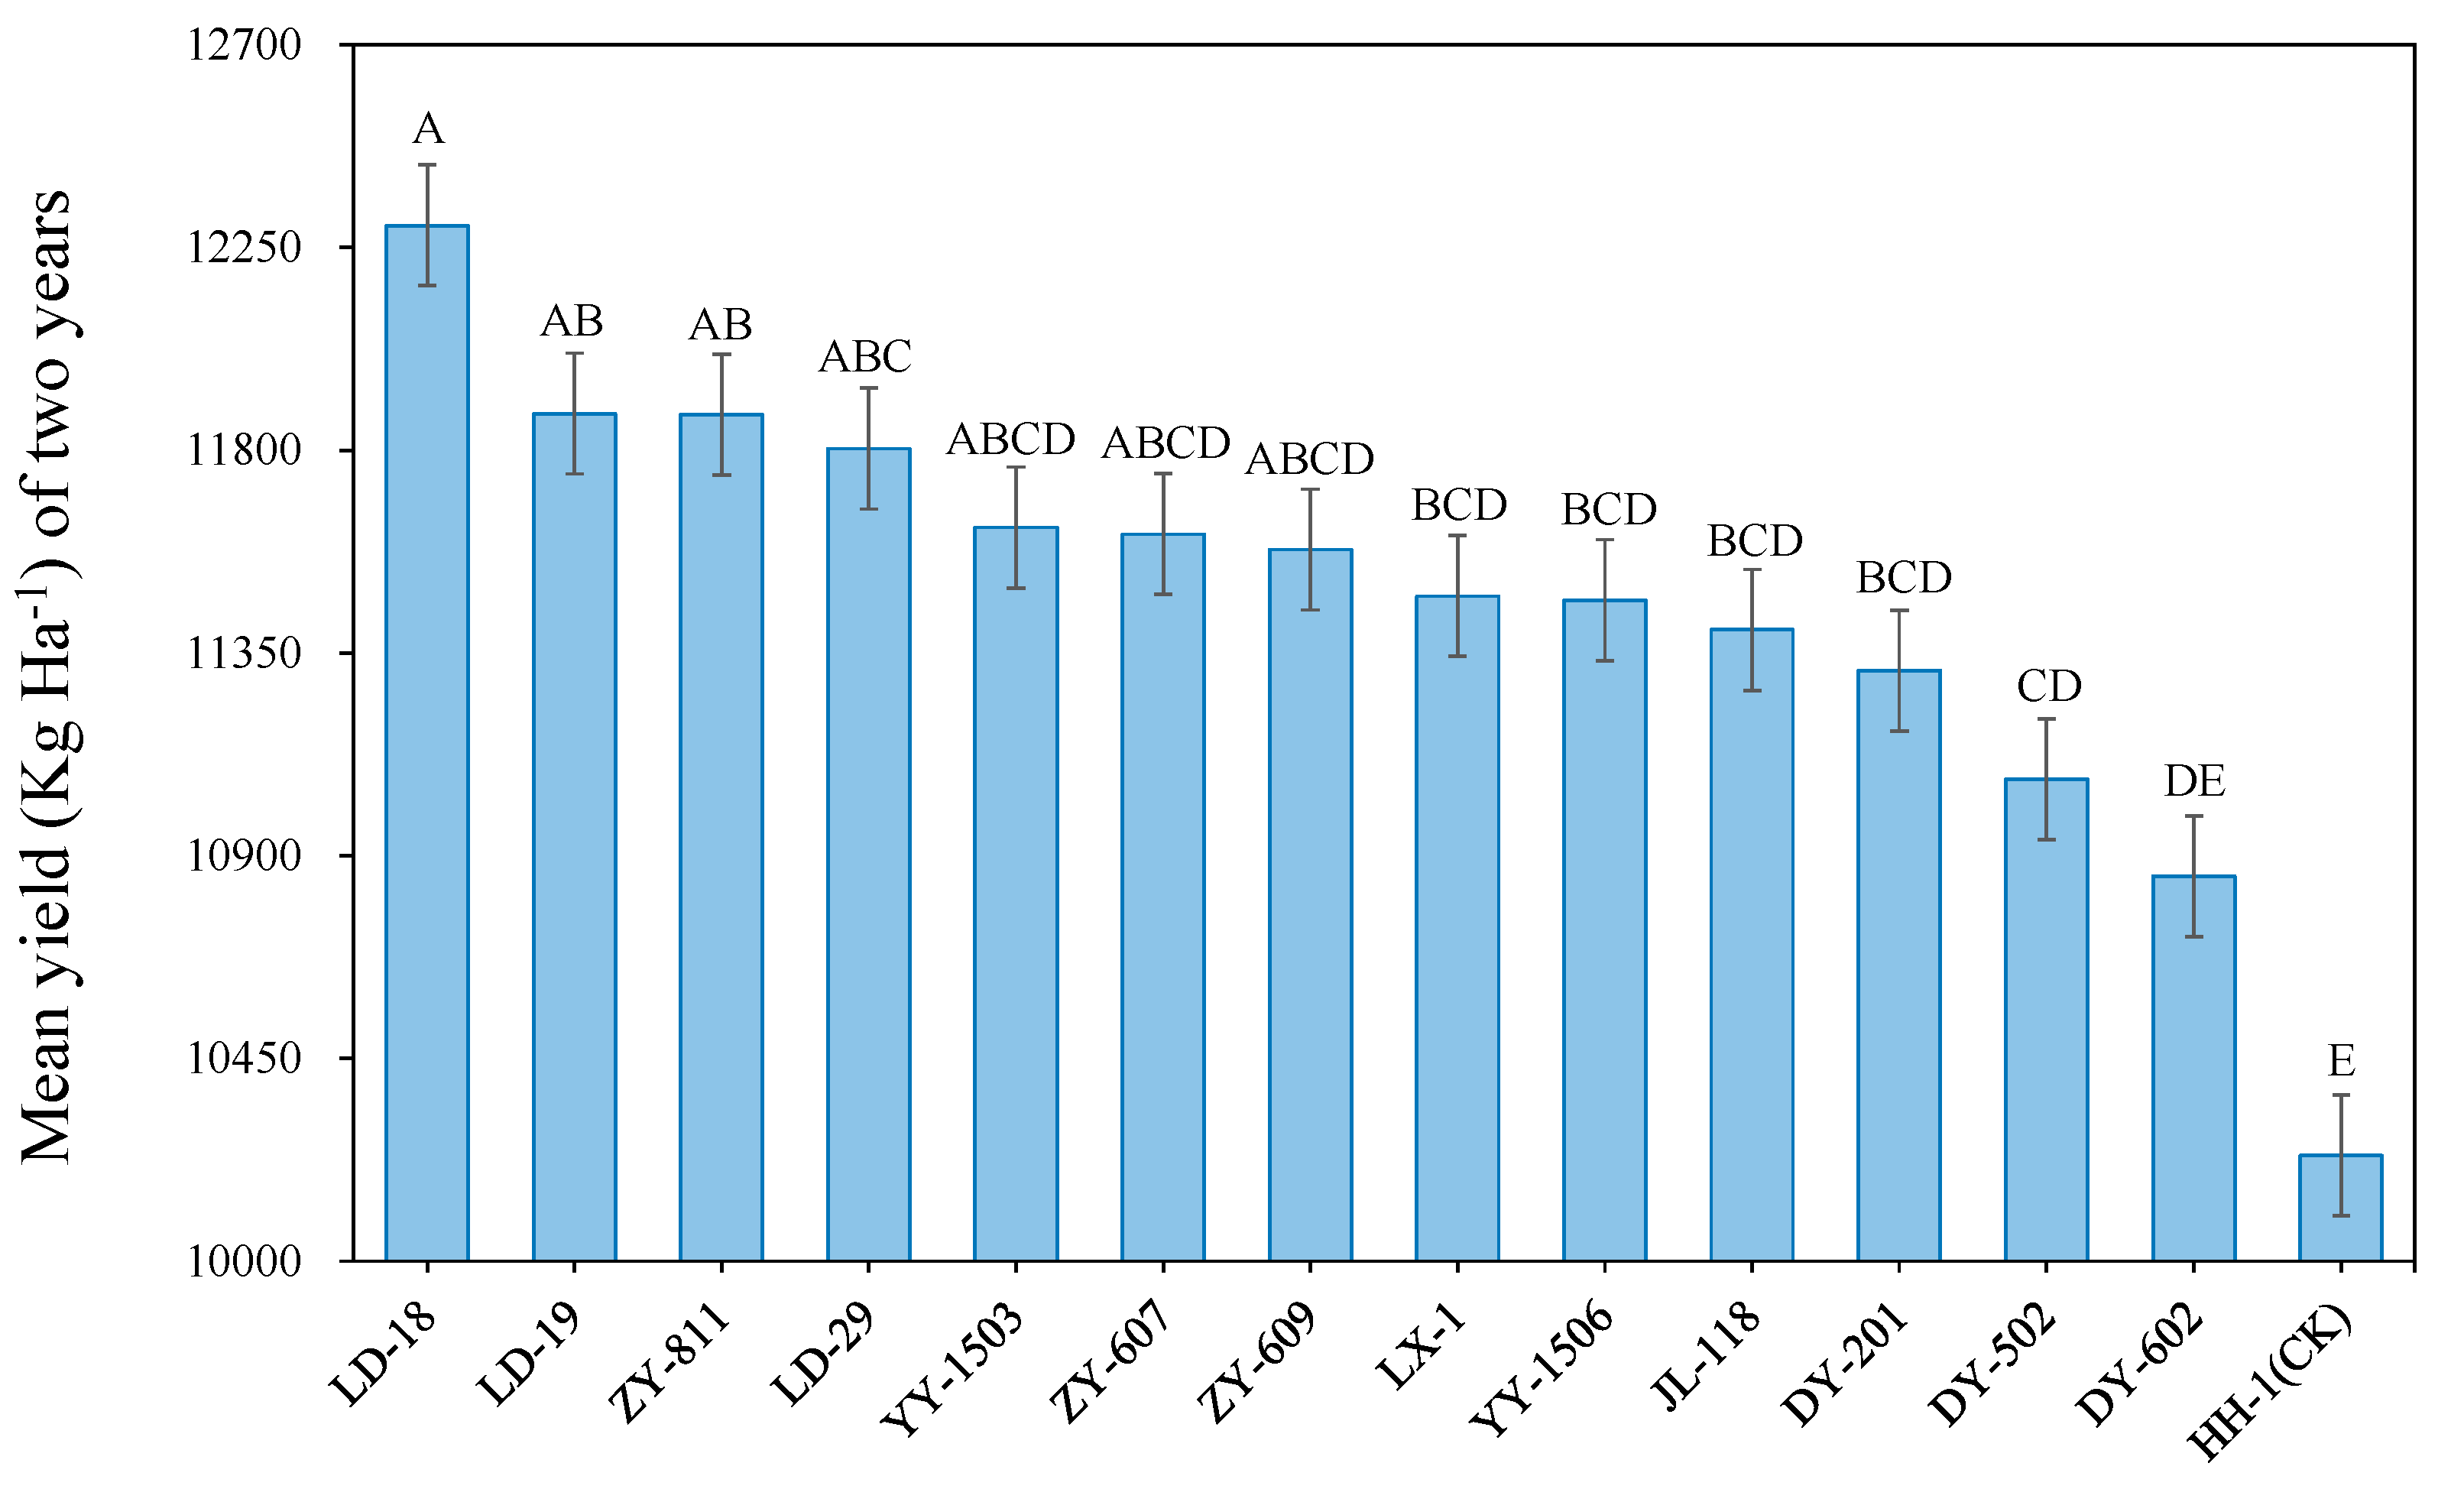
Moreover, the multiple comparison results showed that the mean yield of 13 evaluated hybrids were all higher than the control hybrid HH-2 (Figure 1 and Table S2). Moreover, there were no significant differences among the top 7 varieties, LD-18, LD-19, ZY-811, LD-29, YY-1503, ZY-607, and ZY-609. Additionally, LD-18 had over 20.16% yield advantage over HH-2 (Table S2). These results indicated that LD-18, LD-19, and ZY-811 were the more productive genotypes in 2020 and 2021.
3.3. Selection of Ideal Hybrids across 10 Test Environments Based on GGE Biplot
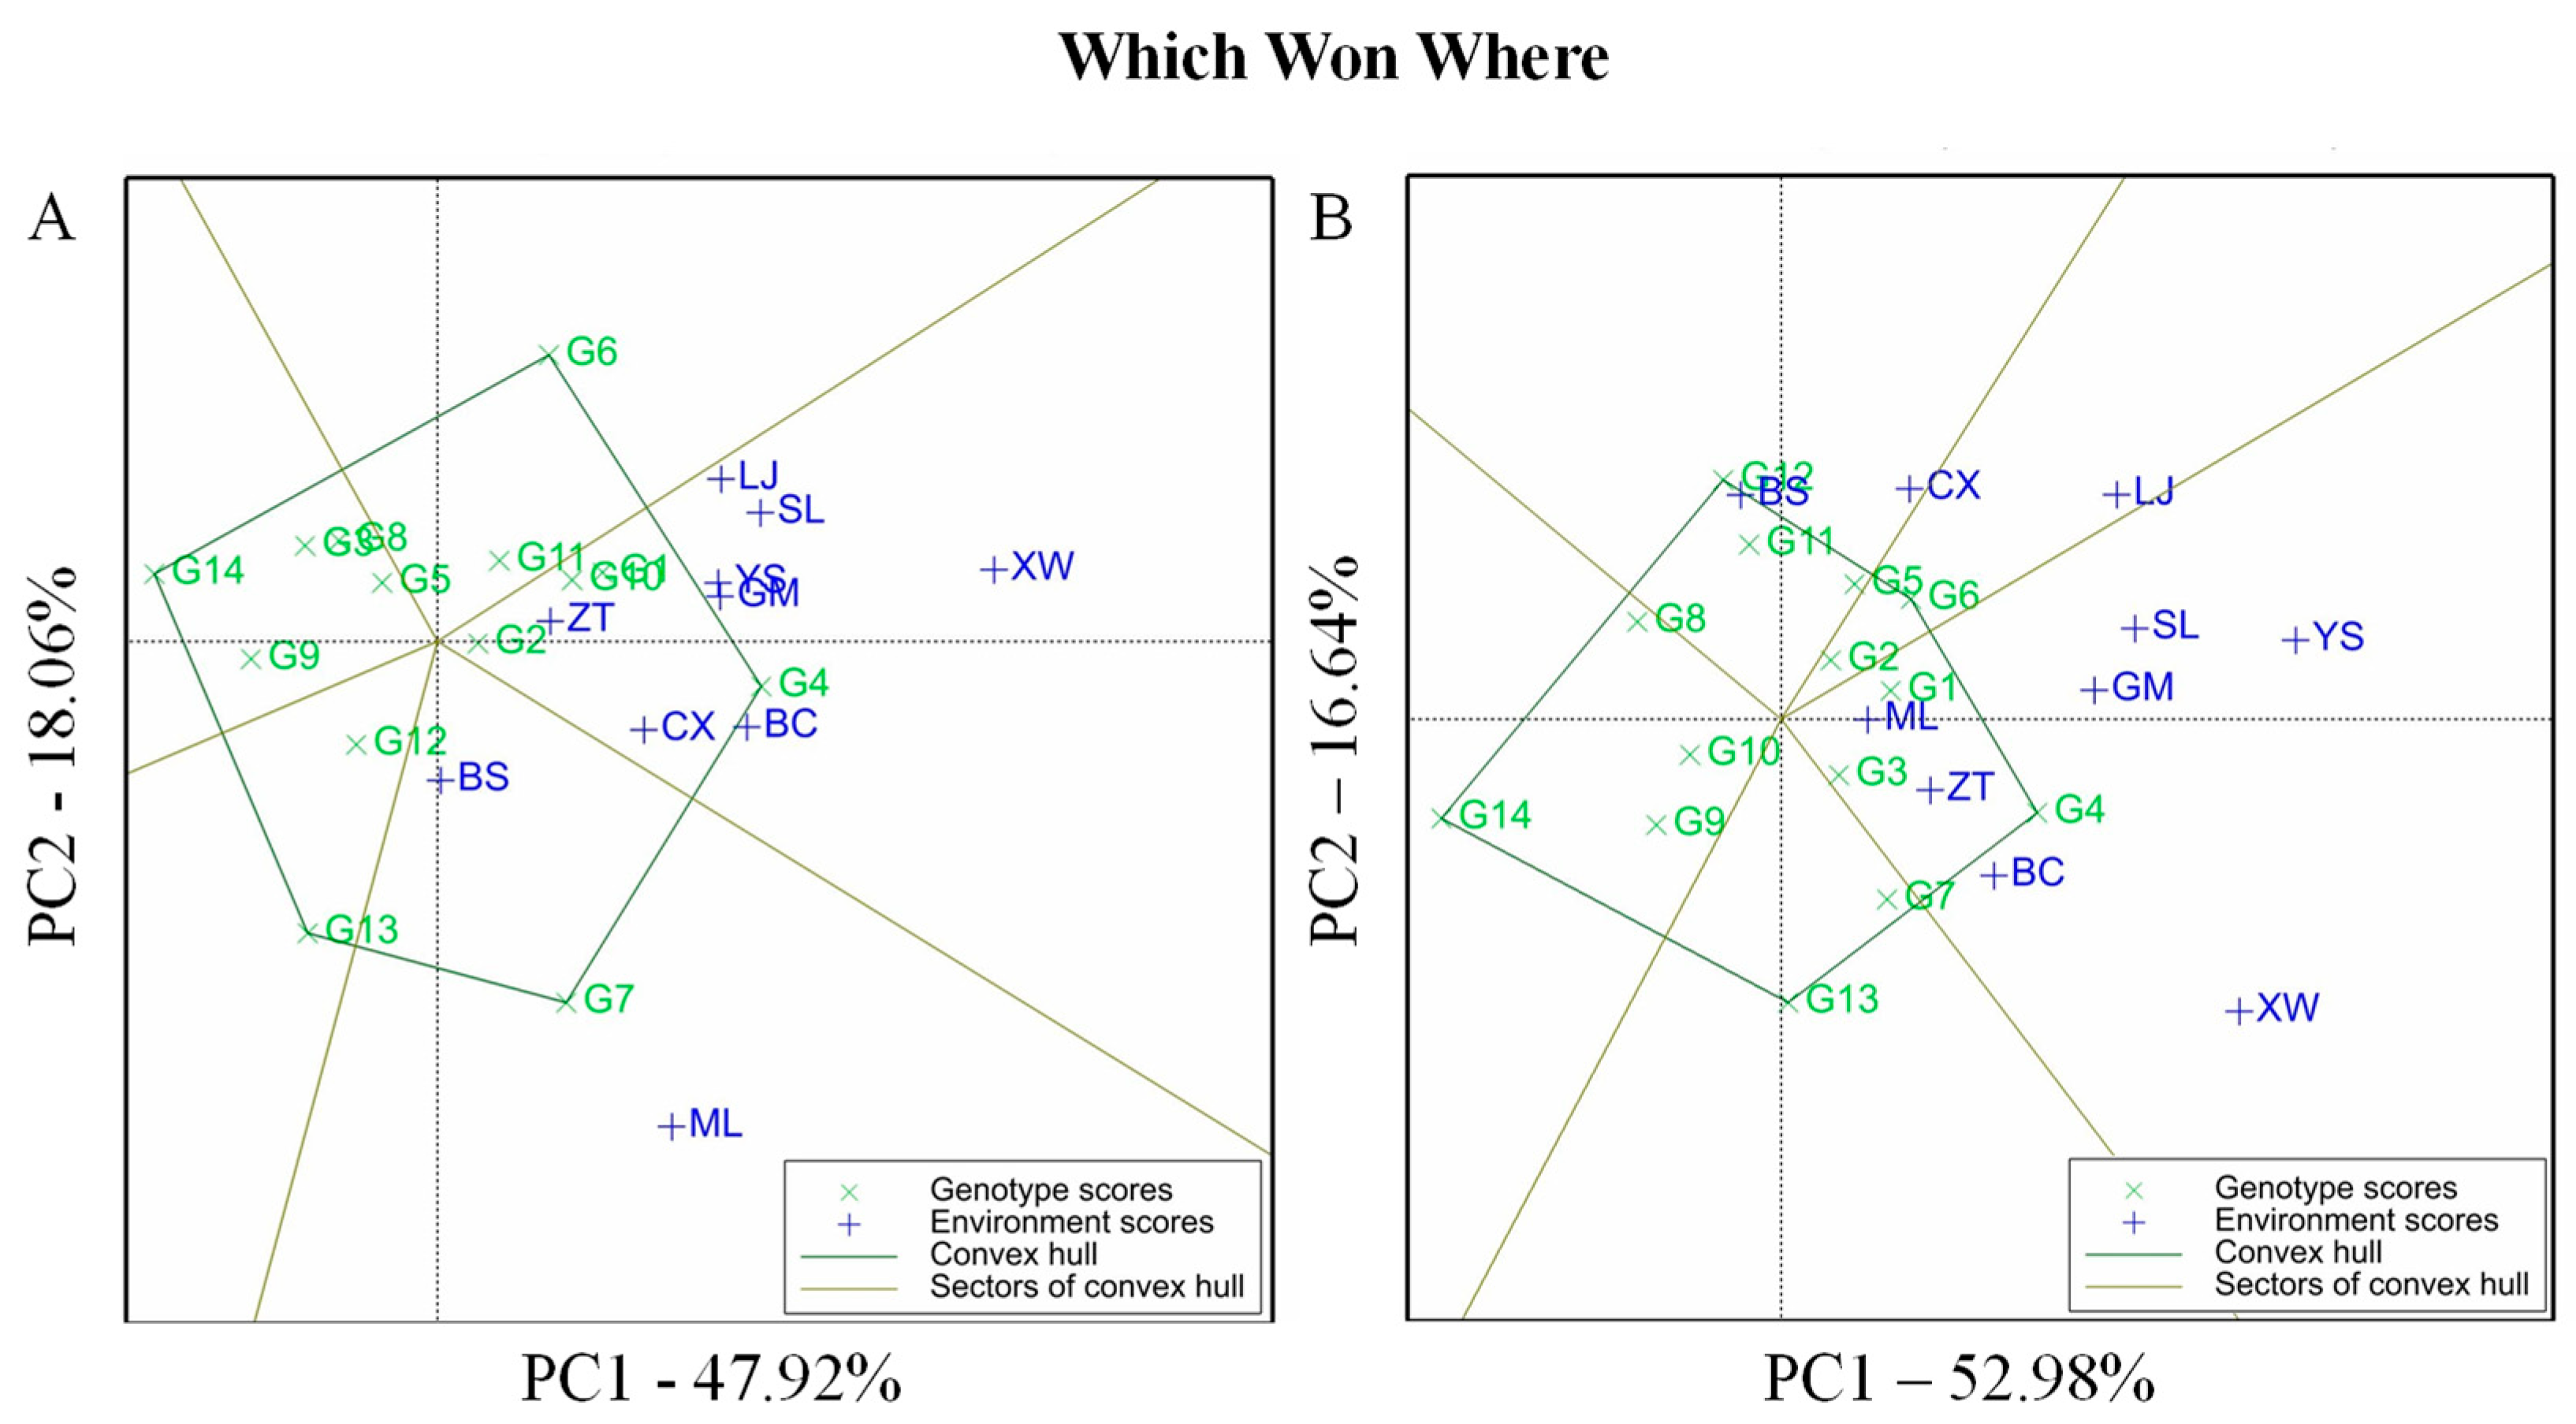
“Which-won-where” GGE biplot is shown in Figure 2. The vertices of the polygon were the best varieties in their own sectors. In detail, 14 genotypes were distributed in five sectors in 2020, and LD-18 and LD-29 were the best hybrids in the two mega environments (Figure 2A). Additionally, LD-18, LD-19, and YY-1506 were the best performing varieties in their respective mega environment zones in 2021 (Figure 2B). Moreover, hybrids in vertex were more responsive than those within the polygon, and some hybrids, which were not in any of the mega environments, performed poorly across some or all of the test environments (Figure 2).
3.4. Selection of Ideal Hybrids across 10 Test Environments Based on GGE Biplot
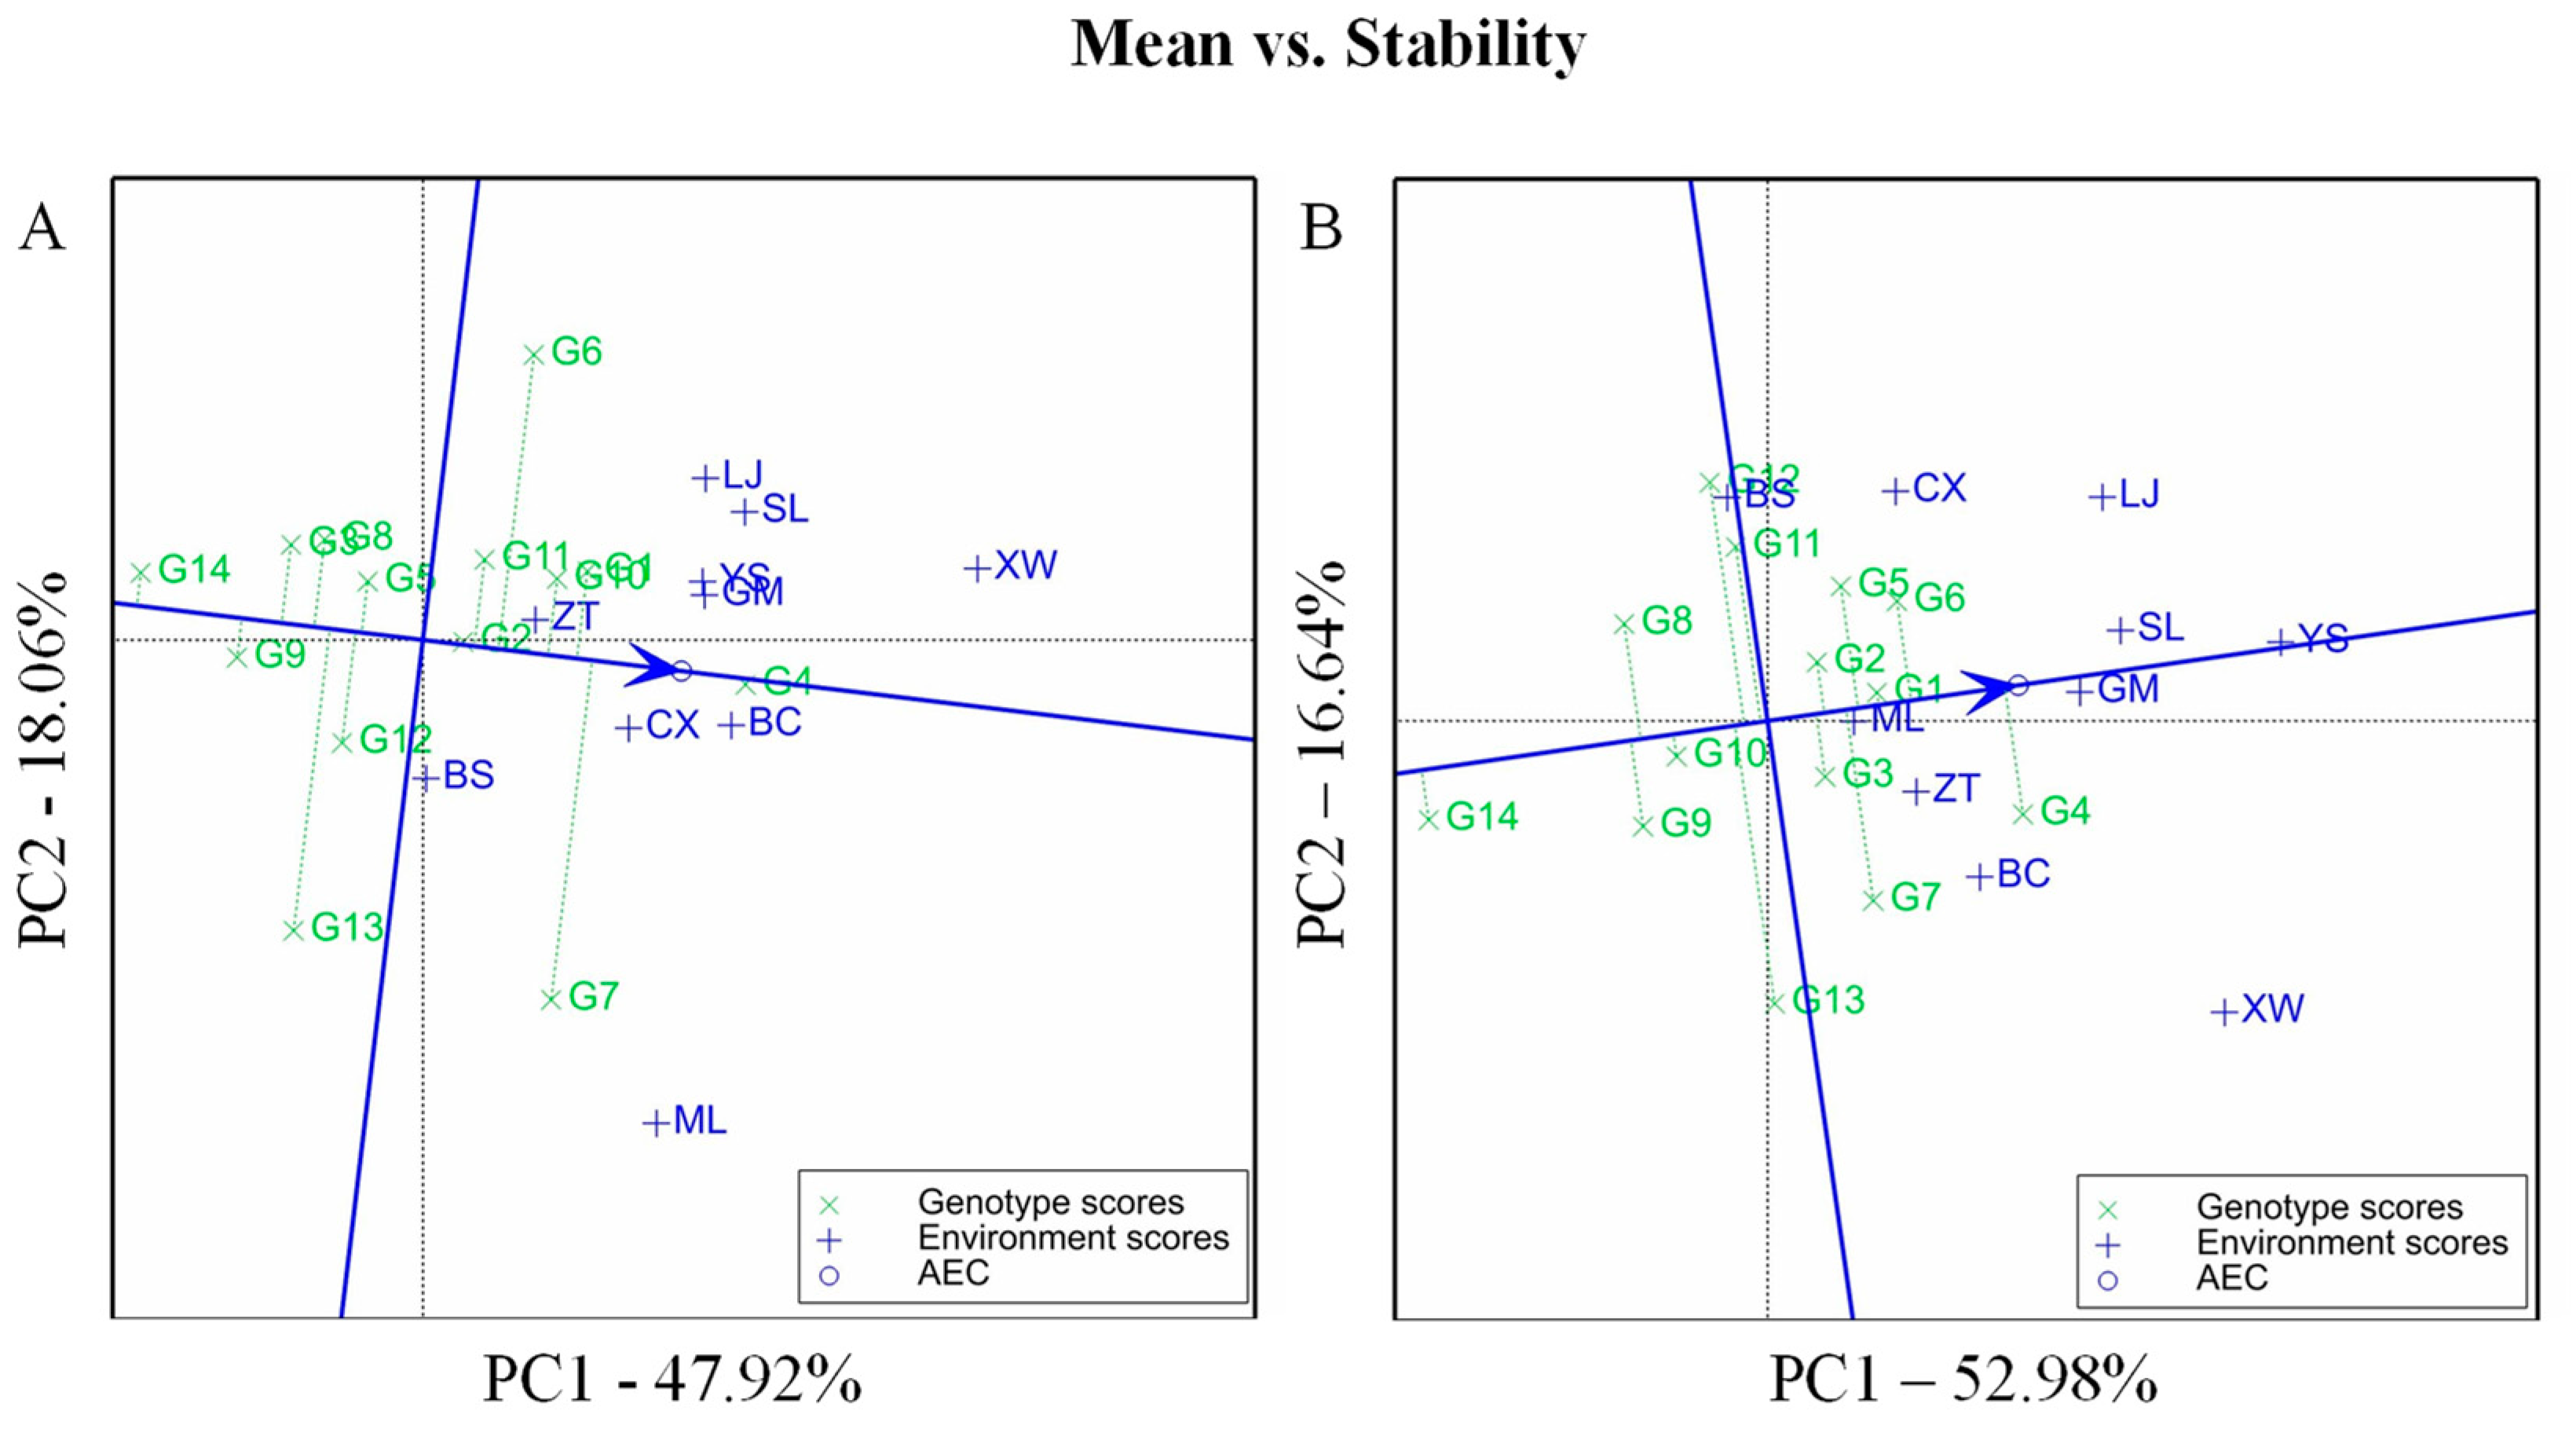
The mean yield and stability of hybrids were evaluated by GGE biplot with average environment coordination (AEC) (Figure 3). The vertical foot position of each variety on the ACE axis represented the variety yield, while the vertical line segment indicated the stability of the variety. In this study, LD-18 was highest-yielding, followed by LD-29, ZY-811, ZY607, LD-19, ZY-809, and YY-1503 in 2020 (Figure 3A), and followed by LD-19, ZY-811, LX-1, LD-29, YY-1503, and DY-201 in 2021 (Figure 3B). Moreover, YY-1503 was found as the most stable hybrid followed by LD-18, DY-602, and HH-2 in 2020. ZY-811 was the most stable genotype followed by ZY-607, HH-2, and YY-1503 in 2021 (Figure 3B). Thus, the above results further revealed that LD-18 and ZY-811 were the best hybrids with outstanding yield performance (the most productive or middle productive) and excellent stability (higher or best) across the environments.
3.5. Representativeness and Discriminating Ability of the Test Environments
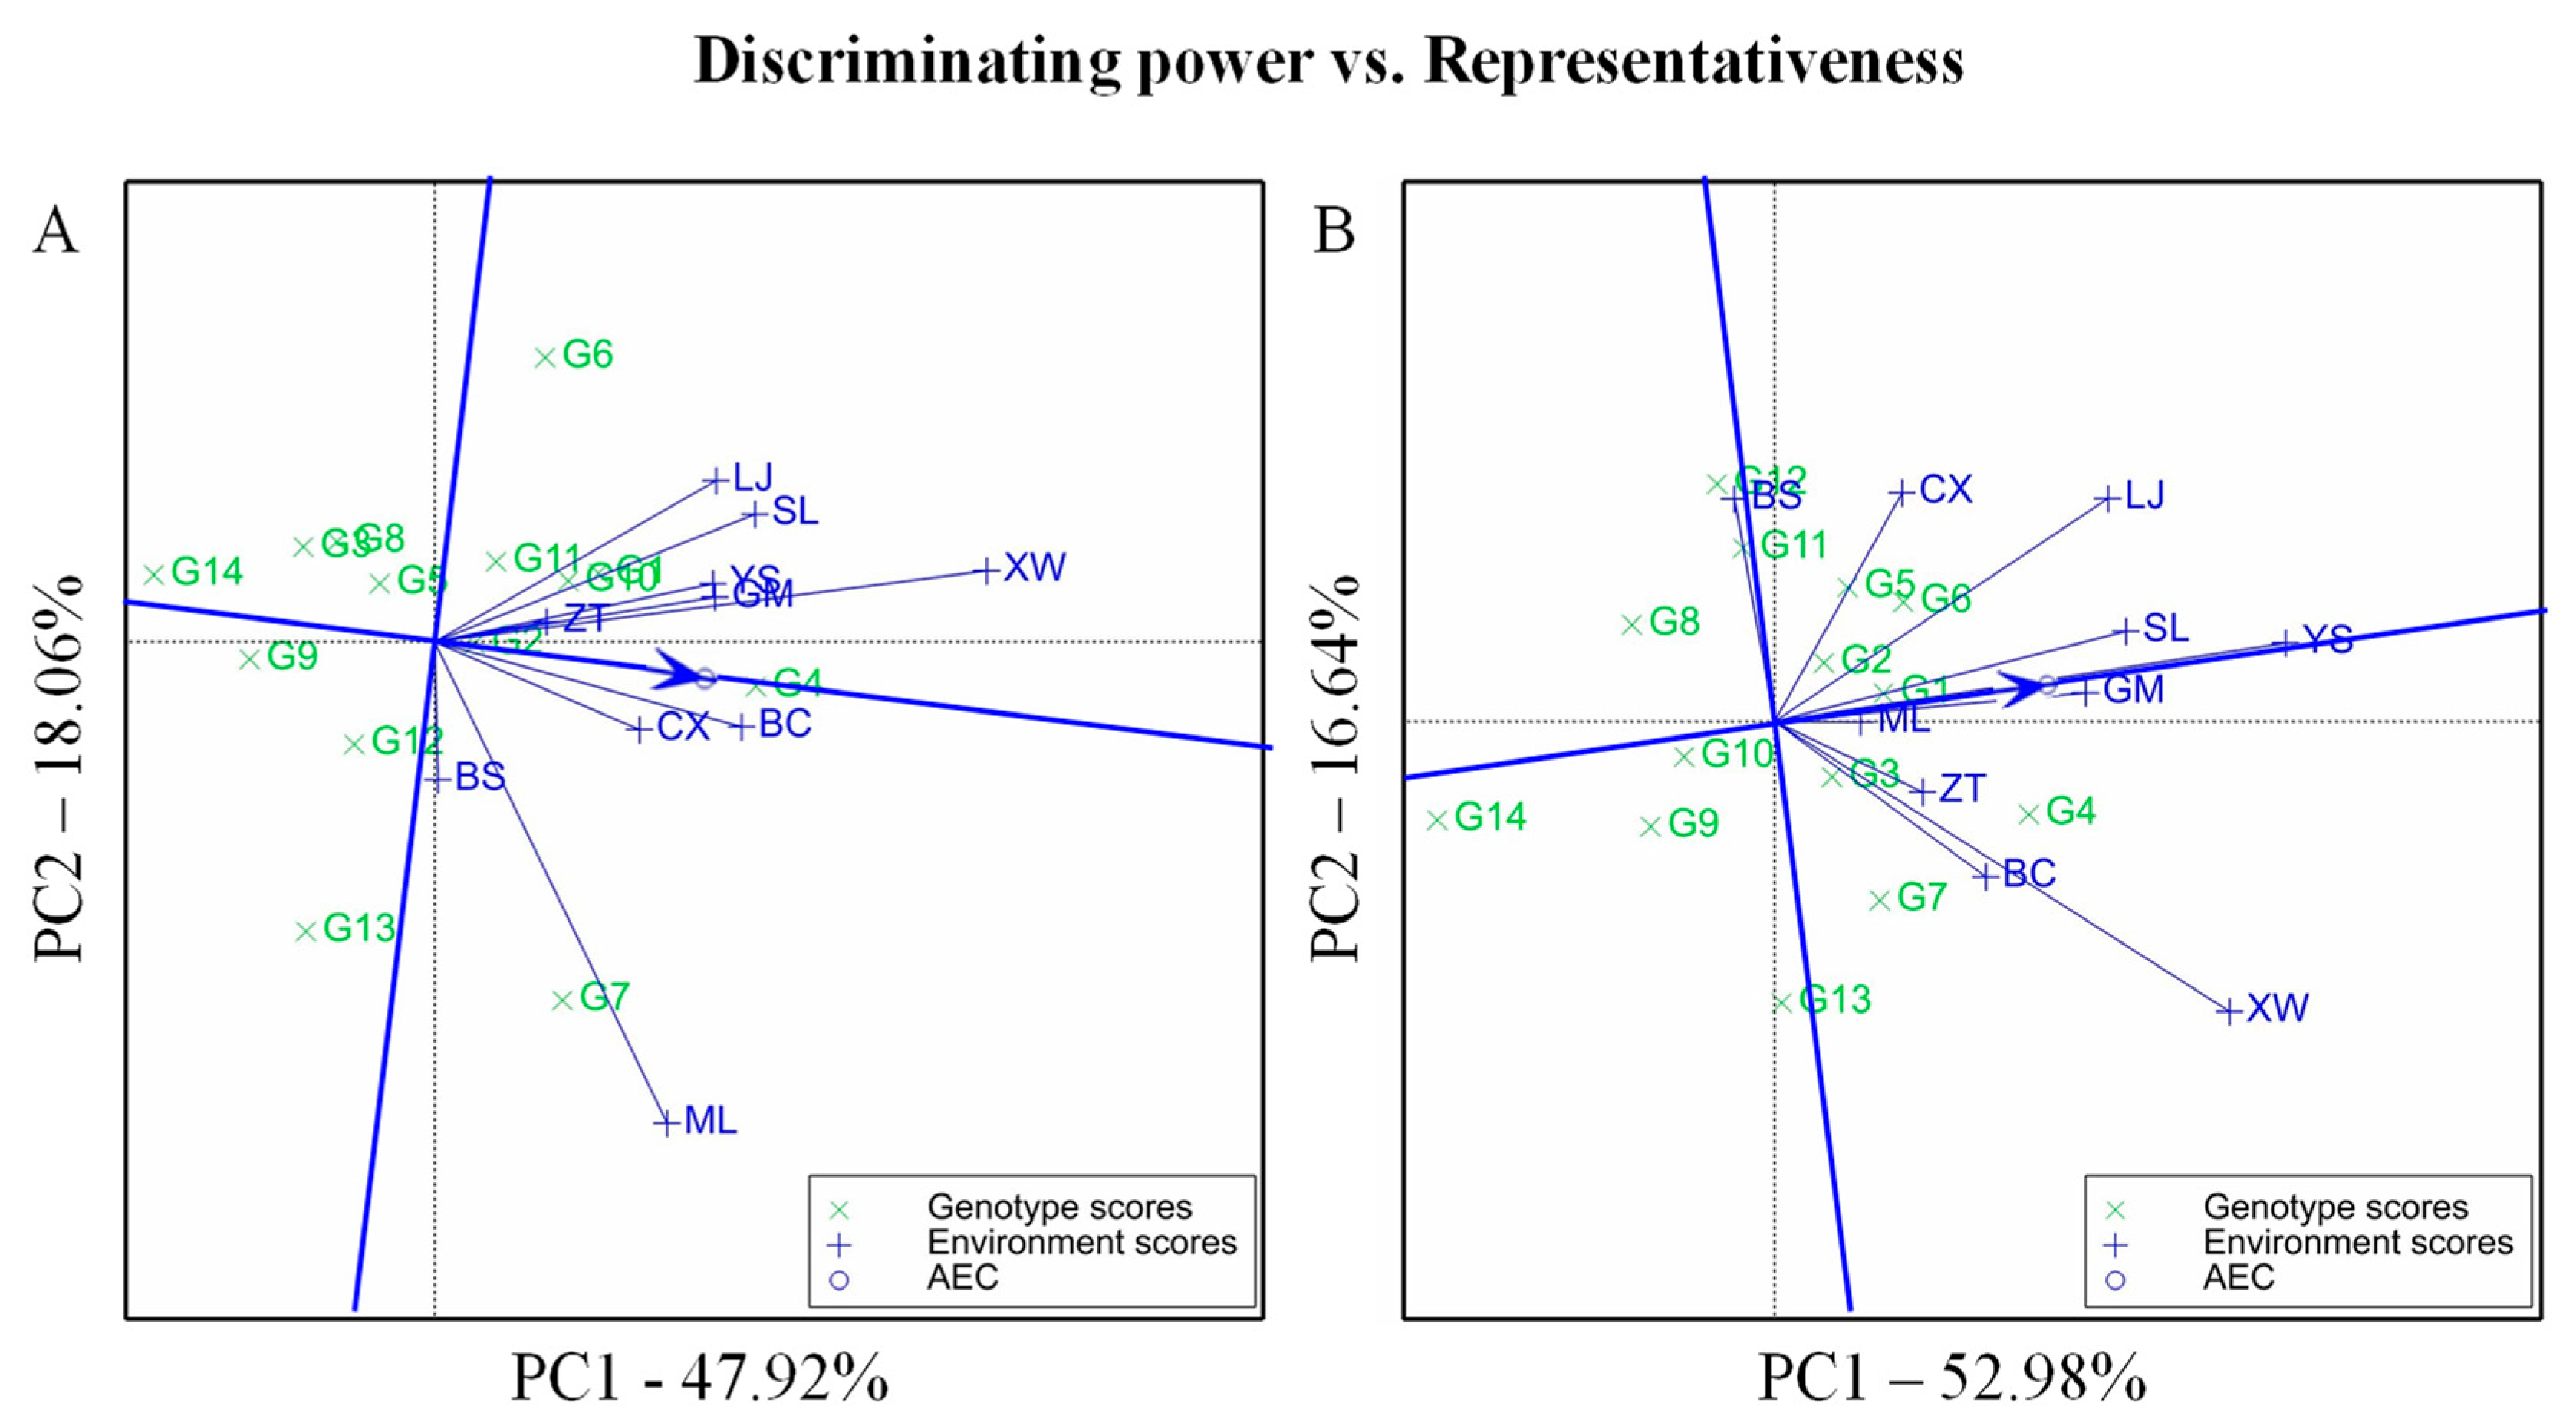
The discriminating ability and representativeness of tested environments were displayed in Figure 4. Test environments with long vectors’ length (most discriminative), and small angles with the AEC abscissa (most representative), were considered as the ideal environments for the selection of superior varieties. The results revealed that Xuanwei was the relatively most discriminative and representative environment, which appeared to be similar to Yanshan, Gengma, and Zhaotong, based on the small angle between them in 2020 (Figure 4A). Accordingly, Yanshan was the ideal environment associated with Shiling and Gengma for the small angle between them in 2021 (Figure 4B). Hence, Xuanwei, Yanshan, Gengma, and Shiling were the desirable environments for selecting superior maize hybrids.
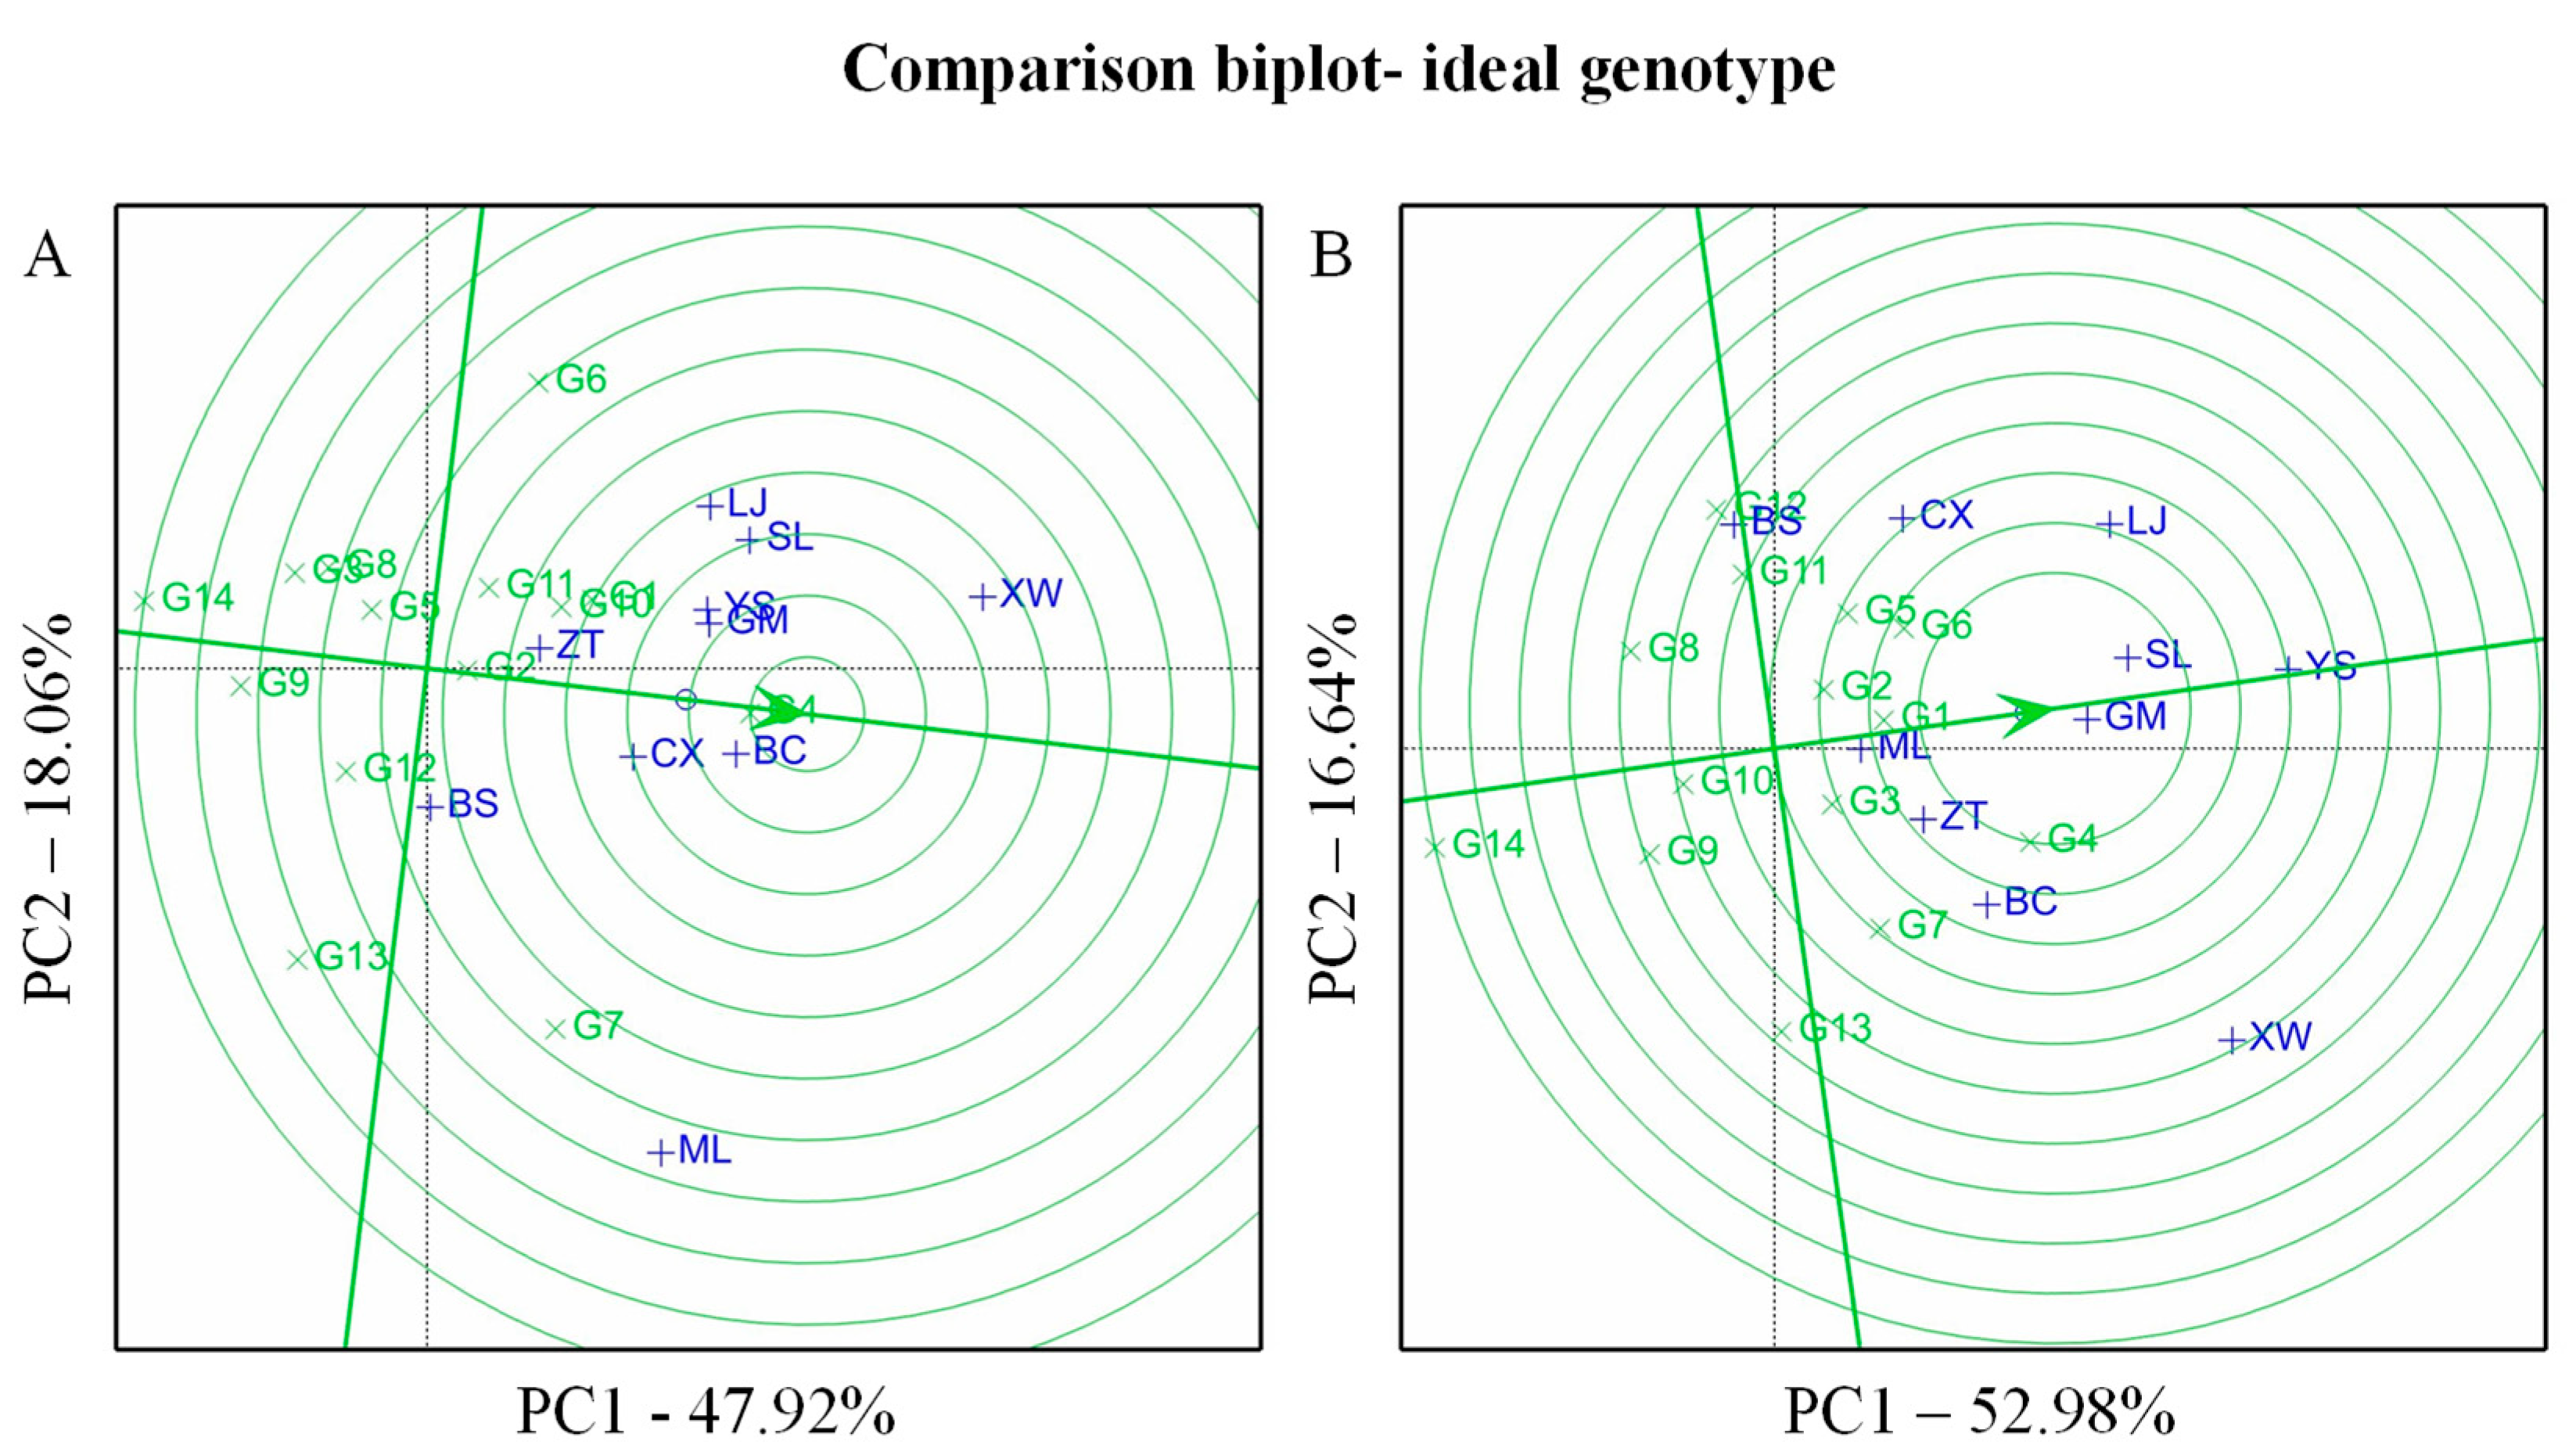
3.6. Evaluation of Ideal Varieties and Ideal Environments
From the comparison biplot (Figure 5), the ideal genotypes are lying in the first concentric circle, and varieties closer to the ideal spot are desirable. In the current study, LD-18 was an outstanding hybrid located on the first concentric circle followed by ZY-811 and ZY-607 in 2020 (Figure 5A), and by ZY-811 and LD-19 in 2021 (Figure 5B). Therefore, these results revealed that LD-18 and ZY-811 were the relatively desirable genotypes (Figure 5).
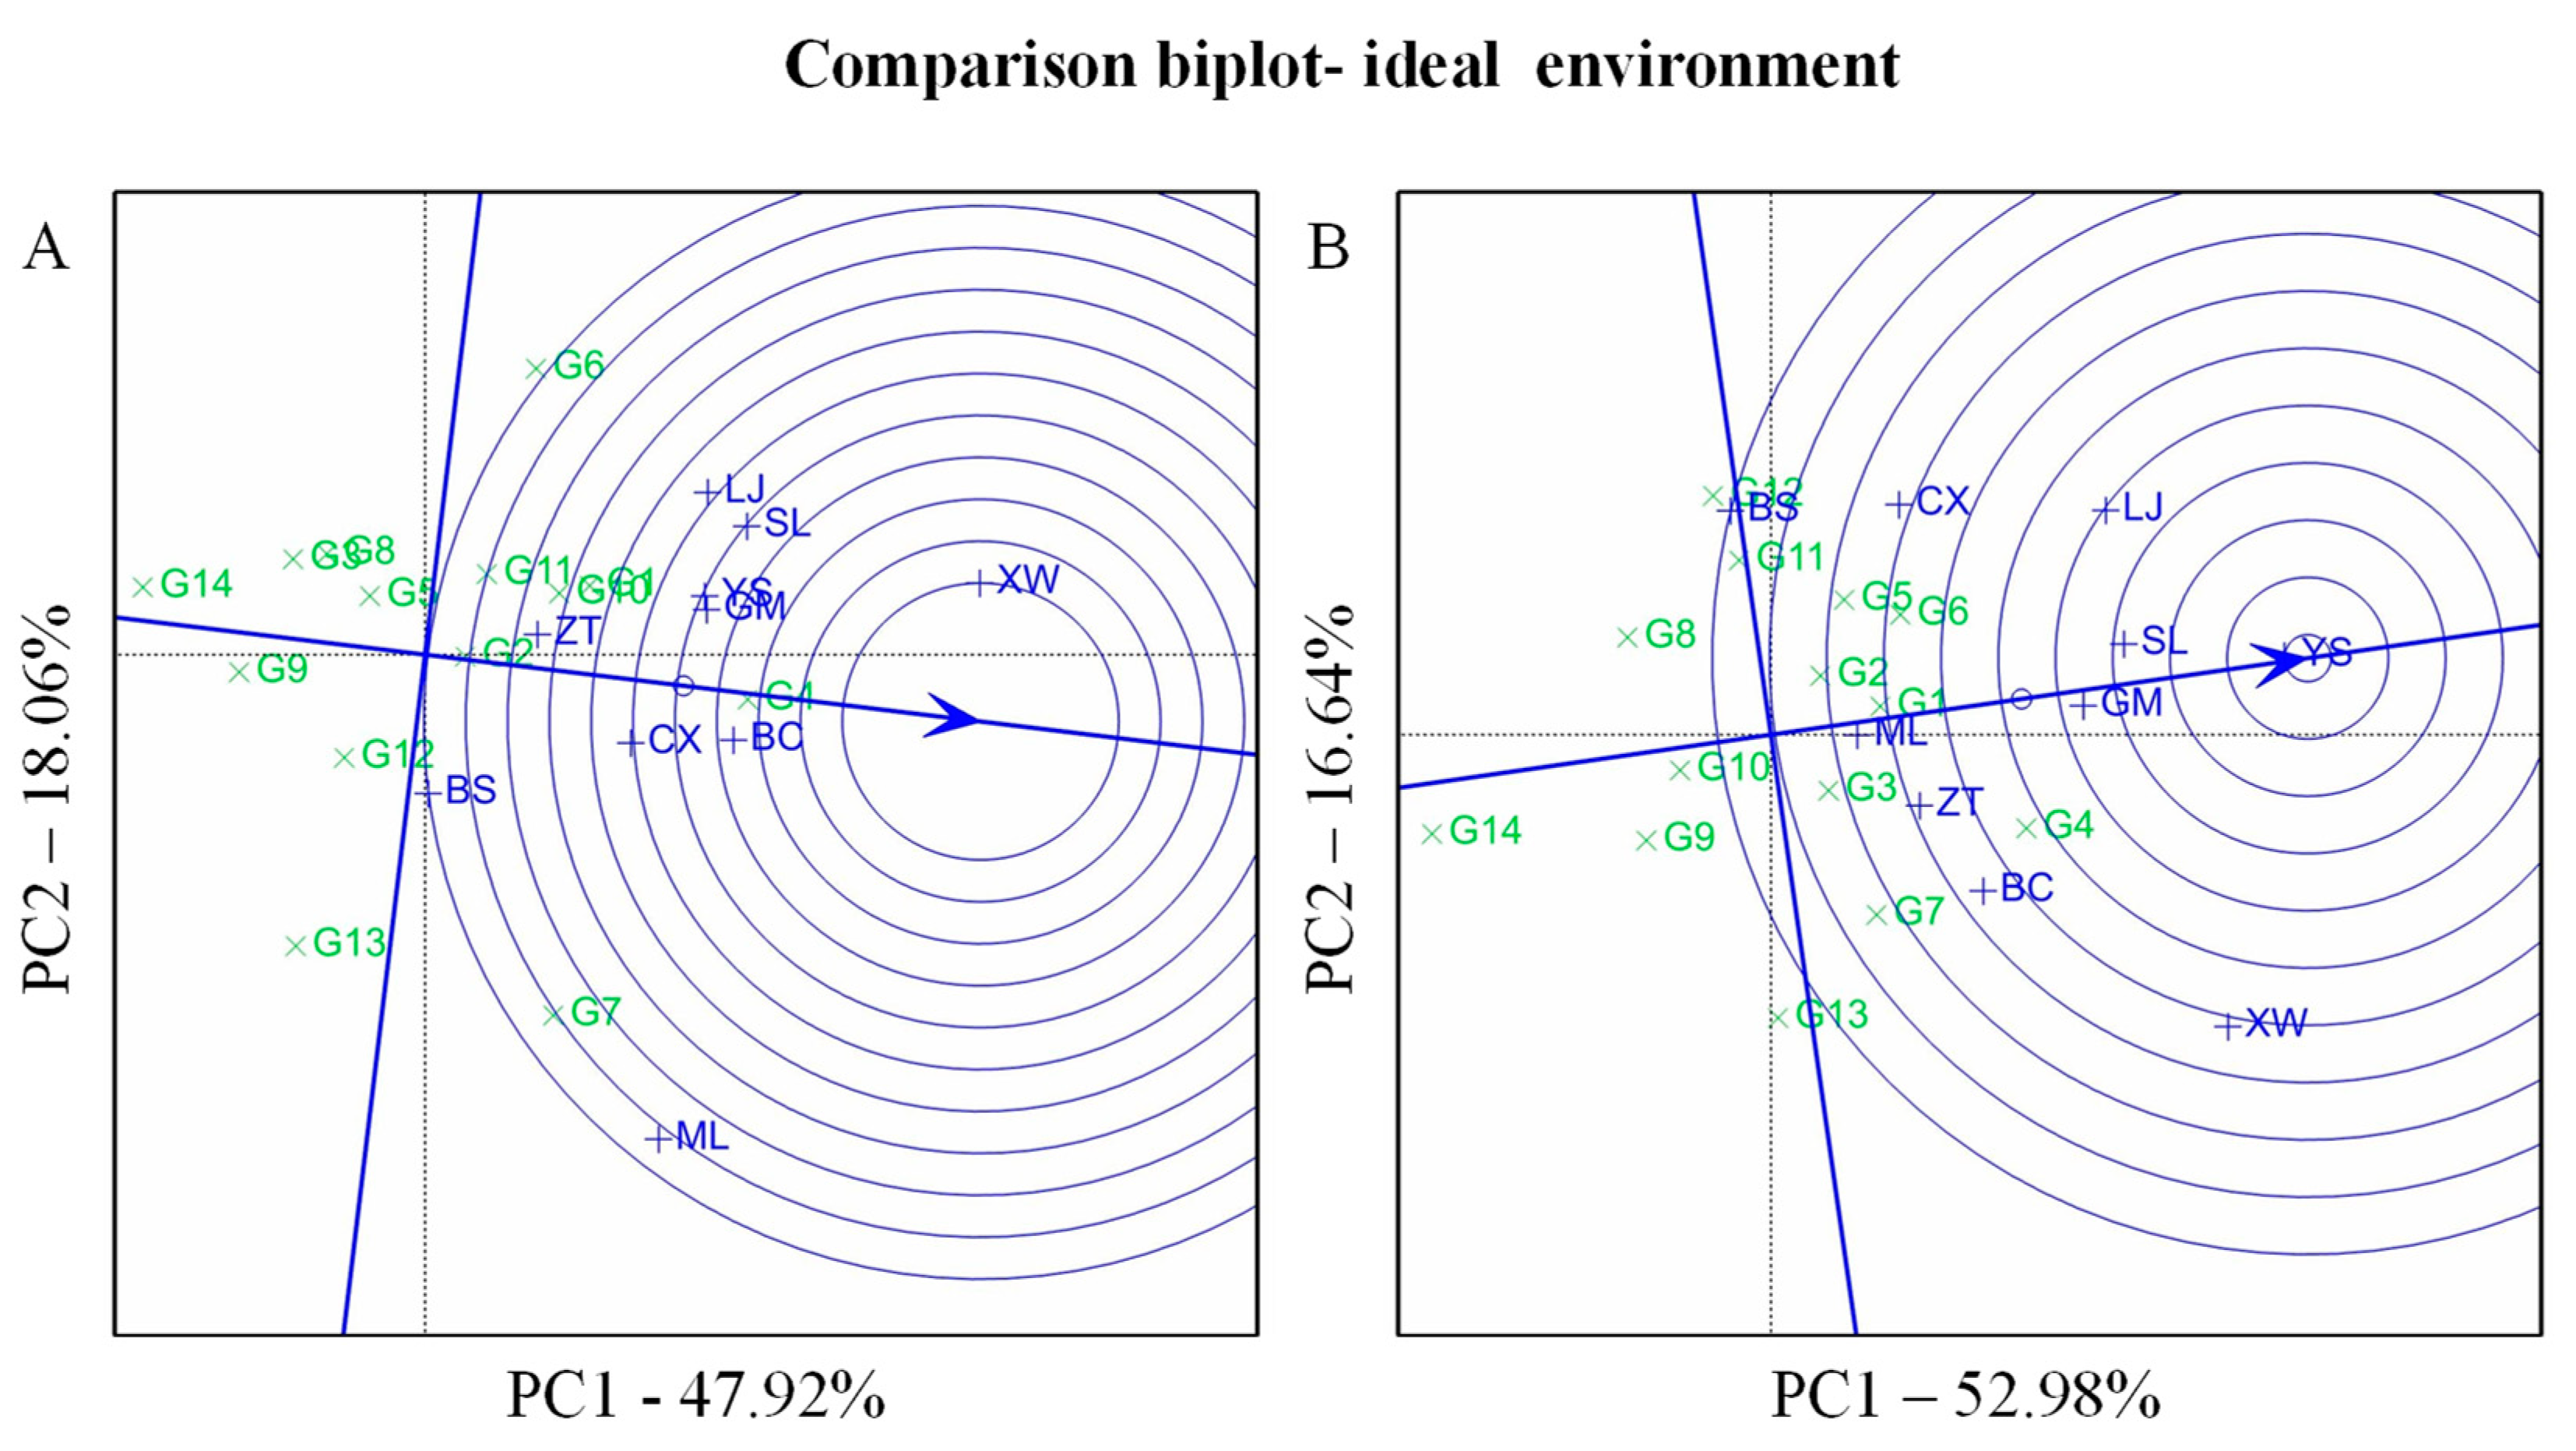
According to the above analysis method, the ideal/desirable environments can be easily found (Figure 6). Obviously, Xuanwei was identified as an excellent environment, as it was lying in the first concentric circle followed by Binchuan, Yanshan, Gengma, and Shiling in 2020 (Figure 6A). Additionally, a desirable environment was Yanshan in 2021, followed by Shiling, Gengma, Linxing, and Xuanwei (Figure 6B). Generally speaking, test environments Yanshan, Xuanwei, Shiling, and Gengma were more reliable and worthy of consideration (Figure 6), and this finding was consistent with the results identified by representativeness and discriminating ability of the 10 environments (Figure 4).
4. Discussion
4.1. Performance of 14 Maize Hybrids under 10 Diverse Environments
In this study, the environment component created more variation than genotype and GEI, indicating that there was high variability among test environments (Table 3 and Table 4). This was similar to the results found by Agyeman and Ewool, Badu-Apraku et al., and Yousaf et al., who observed that environment was the largest part of the total variation [7,17,18]. The GEI was highly significant for grain yield, suggesting the use of the GGE biplot analysis to evaluate grain yield performance, and stability was feasible. This finding was similar with the results described by previous studies [18,27,28,29,30].
4.2. Mega-Environment Analysis Based on GGE Biplot
Figure 2 showed the “which-won-where” polygon view, and each environment group had the same best genotype [16,31]. Therefore, we could visually identify some mega environments from Figure 2. In detail, LD-18 and LD-29 performed well under the first and second mega-environment in 2020, respectively. LD-18, LD-19, and YY-1506 were the highest-yielding hybrids adapted to their own mega environment zones in 2021. Generally, the polygon view exposed the most productive hybrids in each environmental group [14,32,33], and further demonstrated that these varieties could guide the ecological planting, and were recommended for widespread commercial use. However, further evaluation is required under more multi-environments over seasons.
4.3. Ideal Maize Hybrids’ Evaluation
Previous studies suggested that the ideal hybrid should have the highest yield and stability across test environments [16,34,35]. However, the ideal genotype served only as a reference for variety selection, since few existed in reality [36]. Following this suggestion, we found that LD-18 and ZY-811 were close to the ideal genotype because of their relatively higher grain yield and stability. This was similar to the findings discovered by Badu-Apraku et al. and Yousaf et al [7,37].
4.4. Ideal Test Environment Evaluation
Identifying an ideal test environment is considered very essential for selecting superior maize hybrids and crop improvement [31]. An ideal test environment should be most discriminative (the differentiation power) and most representative (illustrates its competence) across the target environments [12]. Hence, the GGE biplot revealed that these environments, Yanshan, Xuanwei, Shiling, and Gengma, were the closest to the ideal environment, thanks to their long vector length and small angles with AEC abscissa. Moreover, some previous studies had evaluated ideal test environments in optimizing maize genotype selection based on discriminating ability and representativeness of the test environment [1,17,18,21,32]. Therefore, these four environments could be used to evaluate maize hybrids in Southwestern China for variety selection and crop production.
5. Conclusions
Significant (p < 0.01) differences were observed between environments, genotypes, and their interaction. The GGE biplot analysis revealed the existence of mega environments with their own best varieties (LD-8 and LD-29 in 2018; LD-18, LD-19, and YY-1506 in 2019). In these hybrids, LD-18 was the most productive hybrid with relatively higher stability; additionally, ZY-811 was the other ideal genotype for middle productive hybrid and highest stability. Hence, LD-18 and ZY-811 maize hybrids can be used for crop production. Furthermore, Yanshan, Xuanwei, Gengma, and Shiling were considered as the ideal test environments for hybrid selecting, based on their discriminative ability and representativeness. Therefore, the GGE biplot methodology was effectively identified, in terms of high-yielding and stable varieties, to guide the ecological planting of maize and for its commercial use, and the two varieties and the four environments provided guidance for maize variety selection and planting in Southwest China.
Supplementary Materials
The following supporting information can be downloaded at https://0-www-mdpi-com.brum.beds.ac.uk/article/10.3390/agronomy12051189/s1, Table S1: Test accuracy analysis in 2020 and 2021, Table S2: Multiple comparison results by the LSD method over two years.
Author Contributions
Conceptualization, Z.Y.; formal analysis, C.L., J.L. and C.M.; funding acquisition, Z.Y.; investigation, Z.Y., C.L., J.L. and C.M.; project administration, C.L. and Z.Y.; resources, Z.Y.; software, C.L. and J.L.; supervision, C.L. and Z.Y.; visualization, C.M.; writing—original draft, C.L. and Z.Y.; writing—review and editing, C.L. and Z.Y. All authors have read and agreed to the published version of the manuscript.
Funding
This research was funded by Doctoral Research Start-up Project of Dali University, grant number KY2096124140 and Basic Research Project of Yunnan Science and Technology Department—Youth Project, grant number 202201AU070003. The funding bodies provided the financial support in carrying out the experiments, sample and data analysis, and MS writing.
Institutional Review Board Statement
Not applicable.
Informed Consent Statement
Not applicable.
Data Availability Statement
Not applicable.
Acknowledgments
We would like to thank the Yunnan Zu Feng Seed Industry Co., Ltd., for their assistance in the investigation during the cropping periods.
Conflicts of Interest
The authors declare that they have no conflict of interest.
References
- Badu-Apraku, B.; Akinwale, R. Identification of early-maturing maize inbred lines based on multiple traits under drought and low N environments for hybrid development and population improvement. Can. J. Plant Sci. 2011, 91, 931–942. [Google Scholar] [CrossRef] [Green Version]
- Langade, D.M.; Shahi, J.P.; Agrawal, V.K.; Sharma, A. Maize as emerging source of oil in India: An overview. Maydica 2013, 58, 224–230. [Google Scholar]
- Anonymous. Food and Agriculture Organization of the United Nations Statistics Division. 2019. Available online: http://www.fao.org/faostat/en/#home (accessed on 5 March 2021).
- Khalil, I.H.; Shah, S.M.A.; Ahmad, H. Stability analysis of maize hybrids across North West of Pakistan. Pak. J. Bot. 2010, 42, 1083–1091. [Google Scholar]
- Maqbool, M.A.; Aslam, M.; Beshir, A.; Atta, B.M. Trends in regional and chronological diversity of maize (Zea mays L.) germplasm in Pakistan. Pak. J. Bot. 2019, 51, 521–533. [Google Scholar] [CrossRef]
- Sibiya, J.; Tongoona, P.; Derera, J.; Rij, N. Genetic analysis and genotype by environment (G X E) for grey leaf spot disease resistance in elite African maize (Zea mays L.) germplasm. Euphytica 2012, 185, 349–362. [Google Scholar] [CrossRef]
- Badu-Apraku, B.; Oyekunle, M.; Obeng-Antwi, K.; Osuman, A.S.; Ado, S.G.; Coulibaly, N.; Yallou, C.G.; Abdulai, M.; Boakyewaa, G.A.; Didjeira, A. Performance of extra-early maize cultivars based on GGE biplot and AMMI analysis. J. Agric. Sci. 2012, 150, 473–483. [Google Scholar] [CrossRef]
- Ndhlela, T. Improvement Strategies for Yield Potential, Disease Resistance and Drought Tolerance of Zimbabwean Maize Inbred Lines; Department of Plant Sciences (Plant Breeding), University of the Free State: Bloemfontein, South Africa, 2012; 295p. [Google Scholar]
- Adu, G.B.; Akromah, R.; Abdulai, M.S.; Obeng-Antwi, K.; Kena, A.W.; Tengan, K.M.L.; Alidu, H. Assessment of Genotype by Environment interactions and Grain Yield Performance of Extra-Early Maize (Zea mays L.) Hybrids. J. Biol. Agric. Healthc. 2013, 3, 7–15. [Google Scholar]
- Hongyu, K.; García-Peña, M.; Tadeu dos Santos Dias, C. Statistical analysis of yield trials by AMMI analysis of genotype × environment interaction. Biom. Lett. 2014, 51, 89–102. [Google Scholar] [CrossRef] [Green Version]
- Yan, W.; Hunt, L.A.; Sheng, Q.; Szlavnics, Z. Cultivar evaluation and mega-environment investigation bapsed on the GGE biplot. Crop Sci. 2000, 40, 597–605. [Google Scholar] [CrossRef]
- Yan, W.; Kang, M.S.; Ma, B.; Woods, S.; Cornelius, P.L. GGE biplot vs. AMMI analysis of genotype-by-environment data. Crop Sci. 2007, 47, 643–655. [Google Scholar] [CrossRef]
- Amare, B.; Abay, F.; Tsehaye, Y. Evaluation of sweet potato (Ipomea batata L.) varieties for total storage root yield in south. Am. J. Trade Policy 2014, 1, 27–32. [Google Scholar] [CrossRef] [Green Version]
- Kivuva, B.M.; Githiri, S.M.; Yencho, G.C.; Sibiya, J. Genotype × Environment interaction for storage root yield in sweet potato under managed drought stress conditions. J. Agric. Sci. 2014, 6, 41–56. [Google Scholar]
- Cooper, M.; Stucker, R.E.; DeLacy, I.H.; Harch, B.D. Wheat breeding nurseries, target environments, and indirect selection for grain yield. Crop Sci. 1997, 37, 1168–1176. [Google Scholar] [CrossRef]
- Yan, W. GGE biplot: A windows application for graphical analysis of multi-environment trial data and other types of two-way data. Agron. J. 2001, 93, 1111–1118. [Google Scholar] [CrossRef] [Green Version]
- Agyeman, A.; Ewool, M. Genotype by environment interaction analysis of grain yield and yield components in provitamin A maize. J. Crop Improv. 2021, 36, 1–24. [Google Scholar] [CrossRef]
- Yousaf, M.I.; Akhtar, N.; Mumtaz, A.; Shezad, A.; Arshad, M.; Shoaib, M.; Mehboob, A. Yield stability studies in indigenous and exotic maize hybrids under genotype by environment interaction. Pak. J. Bot. 2021, 53, 941–948. [Google Scholar] [CrossRef]
- Apala Mafouasson, H.N.L.; Gracen, V.; Yeboah, M.A.; Ntsomboh-Ntsefong, G.; Tandzi, L.N.; Mutengwa, C.S. Genotype-by-environment interaction and yield stability of maize single cross hybrids developed from tropical inbred lines. Agronomy 2018, 8, 62. [Google Scholar] [CrossRef] [Green Version]
- Okoth, S.; Rose, L.J.; Ouko, A.; Netshifhefhe, N.E.I.; Sila, H.; Viljoen, A. Assessing genotype-by-environment interactions in Aspergillus ear rot and pre-harvest aflatoxin accumulation in maize inbred lines. Agronomy 2017, 7, 86. [Google Scholar] [CrossRef] [Green Version]
- Ali, I.; Khan, N.U.; Rahman, M.U.; Gul, R.; Bibi, Z.; Gul, S.; Ahmed, S.; Ali, S.; Ali, N.; Afridi, K.; et al. Genotype by environment and biplot analyses for yield and fiber traits in upland cotton. Int. J. Agric. Biol. 2018, 20, 1979–1990. [Google Scholar]
- Muthoni, J.; Shimelis, H.; Melis, R. Genotype × Environment Interaction and Stability of Potato Tuber Yield and Bacterial Wilt Resistance in Kenya. Am. J. Potato Res. 2015, 92, 367–378. [Google Scholar] [CrossRef]
- Mustamu, Y.A.; Tjintokohadi, K.; Grüneberg, W.J.; Karuniawan, A.; Ruswandi, D. Selection of superior genotype of sweet-potato in Indonesia based on stability and adaptability. Chil. J. Agric. Res. 2018, 78, 461–469. [Google Scholar] [CrossRef] [Green Version]
- Kendal, E.; Şener, O. Examination of genotype × environment interactions by GGE biplot analysis in spring durum wheat. Indian J. Genet. 2015, 75, 341–348. [Google Scholar] [CrossRef]
- Ahmadi, J.; Mohammadi, A.; Najafi Mirak, T. Targeting Promising Bread Wheat (Triticum aestivum L.) Lines for Cold Climate Growing Environments Using AMMI and SREG GGE Biplot Analyses. J. Agric. Sci. Technol. 2012, 14, 645–657. [Google Scholar]
- Yohane, E.N.; Shimelis, H.; Laing, M.; Mathew, I.; Shayanowako, A. Genotype-by-environment interaction and stability analyses of grain yield in pigeonpea [Cajanus cajan (L.) Millspaugh]. Acta Agric. Scand. Sect. B-Soil Plant Sci. 2021, 71, 145–155. [Google Scholar] [CrossRef]
- Ghani, A.; Yousaf, M.I.; Arshad, M.; Hussain, K.; Hussain, S.M.T.; Hussain, A.; Rehman, S. YH-1898: A new high yielding, high temperature tolerant local yellow maize (Zea mays L.) hybrid. Int. J. Biol. Biotech. 2017, 14, 441–449. [Google Scholar]
- Saeed, M.; Mumtaz, A.; Hussain, D.; Arshad, M.; Yousaf, M.I.; Ahmad, M.S. Multivariate analysis-based evaluation of maize genotypes under high temperature stress. I3 Biodivers. 2018, 1, 1–12. [Google Scholar]
- Shehzad, A.; Yousaf, M.I.; Ghani, A.; Hussain, K.; Hussain, S.; Arshad, M. Genetic analysis and combining ability studies for morpho-phenological and grain yield traits in spring maize (Zea mays L.). Int. J. Biol. Biotech. 2019, 16, 925–931. [Google Scholar]
- Vargas, M.; Combs, E.; Alvarado, G.; Atlin, G.; Mathews, K.; Crossa, J. META: A suite of SAS programs to analyze multi-environment breeding trials. Agron. J. 2012, 105, 11–19. [Google Scholar] [CrossRef] [Green Version]
- Yan, W.; Kang, M.S. GGE Biplot Analysis: A Graphical Tool for Breeders, Genetics, and Agronomist, 1st ed.; CRC Press: Boca Raton, FL, USA, 2003. [Google Scholar]
- Haruna, A.; Adu, G.B.; Buah, S.S.; Kanton, R.A.; Kudzo, A.I.; Seidu, A.M.; Kwadwo, O.A. Analysis of genotype by environment interaction for grain yield of intermediate maturing drought tolerant top-cross maize hybrids under rain-fed conditions. Cogent Food Agric. 2017, 3, 1333243. [Google Scholar] [CrossRef]
- Setimela, A.P.S.; Vivek, B.; Banziger, M.; Crossa, J.; Maideni, F. Evaluation of early to medium maturing open pollinated maize varieties in SADC region using GGE biplot based on the SREG Model. Field Crop Res. 2007, 103, 161–169. [Google Scholar] [CrossRef]
- Kang, M.S. Genotype by environment interaction: Progress and prospects. In Quantitative Genetics, Genomics and Plant Breeding; Kang, M.S., Ed.; CABI Publishing: Wallingford, CT, USA, 2002; pp. 221–243. [Google Scholar]
- Kang, M.S.; Balzarini, M.G.; Guerra, J.L.L. Genotype-by-environment Interaction. In Genetic Analysis of Complex Traits Using SAS; Saxton, A.M., Ed.; SAS Publications, SAS Institute: Cary, NC, USA, 2004; pp. 66–96. [Google Scholar]
- Yan, W. Singular-value partitioning in biplot analysis of multi-environment trial data. Agron. J. 2002, 94, 990–996. [Google Scholar] [CrossRef] [Green Version]
- Yousaf, M.I.; Hussain, K.; Hussain, S.; Ghani, A.; Shehzad, A.; Mumtaz, A.; Arshad, M.; Mehmood, A.; Khalid, M.U.; Akhtar, N.; et al. Seasonal influence, heat unit accumulation and heat use efficiency in relation to maize grain yield in Pakistan. Maydica 2020, 64, 9. [Google Scholar]
Figure 1.
Mean yield (kg ha−1) of 14 maize hybrids over two years. Different letters indicate significant differences (p < 0.01).
Figure 1.
Mean yield (kg ha−1) of 14 maize hybrids over two years. Different letters indicate significant differences (p < 0.01).

Figure 2.
“Which-won-where” pattern of GGE biplot for 14 maize hybrids (G1-G14) evaluated across 10 environments. Genotypes at the vertices of the polygon are responsive to a particular environment: (A) GGE biplot in 2020; (B) GGE biplot in 2021. See genotype and environment codes in Table 1 and Table 2, respectively.

Figure 3.
GGE biplot showing mean and stability of 14 maize hybrids for yield across 10 locations. Genotypes on the extreme right are highest-yielding; those having smaller projection on the ordinate are relatively stable: (A) GGE biplot in 2020; (B) GGE biplot in 2021. See genotype and environment codes in Table 1 and Table 2, respectively.

Figure 4.
GGE biplot for the evaluation of the relationships among the 10 test environments. Environmental vectors having smaller angles are closely related. Environments having longer vectors are discriminating: (A) GGE biplot in 2020; (B) GGE biplot in 2021. See genotype and environment codes in Table 1 and Table 2, respectively.

Figure 5.
Visualization of ‘ideal genotype’ using GGE biplot. Concentric circles show the location of ideal genotypes. Genotypes closer to the ideal spot are ideal genotypes. GGE biplot of ideal hybrids and ranking of hybrids: (A) GGE biplot in 2020; (B) GGE biplot in 2021. See genotype and environment codes in Table 1 and Table 2, respectively.

Figure 6.
Visualization of ‘ideal environment’ using GGE biplot. Concentric circles show the position of ideal environments. Environments closer to the ideal spot are ideal environments. GGE biplot of ideal hybrids and ranking of hybrids: (A) GGE biplot in 2020; (B) GGE biplot in 2021. See genotype and environment codes in Table 1 and Table 2, respectively.


Table 1.
Description of 14 maize hybrids used in the study.
| Hybrids | Abbreviation | Code | Source |
|---|---|---|---|
| Zuyu-811 | ZY-811 | G1 | Yunnan Zu Feng Seed Industry Co., Ltd. |
| Yuanyu-1503 | YY-1503 | G2 | Yunnan Yun Dan Seed Industry Co., Ltd. |
| Diyu-201 | DY-201 | G3 | Yunnan Di Yu Seed Industry Co., Ltd. |
| Ludan-18 | LD-18 | G4 | Yunnan Shi Feng Seed Industry Co., Ltd. |
| Linxin-1 | LX-1 | G5 | Yunnan Lin Feng Seed Industry Co., Ltd. |
| Ludan-19 | LD-19 | G6 | Yunnan Shi Feng Seed Industry Co., Ltd. |
| Ludan-29 | LD-29 | G7 | Yunnan Shi Feng Seed Industry Co., Ltd. |
| Diyu-502 | DY-502 | G8 | Yunnan Di Yu Seed Industry Co., Ltd. |
| Diyu-602 | DY-602 | G9 | Yunnan Di Yu Seed Industry Co., Ltd. |
| Zuyu-607 | ZY-607 | G10 | Yunnan Zu Feng Seed Industry Co., Ltd. |
| Zuyu-809 | ZY-809 | G11 | Yunnan Zu Feng Seed Industry Co., Ltd. |
| Yuanyu-1506 | YY-1506 | G12 | Yunnan YUN Dan Seed Industry Co., Ltd. |
| Jinli-118 | JL-118 | G13 | Yunnan Jin li Seed Industry Co., Ltd. |
| Haihe-2 (CK) | HH-2 | G14 | Liaoning Haihe Seed Industry Co., Ltd. |
Table 2.
The characteristics of test environments.
| Location | Code | Latitude (N) | Longitude (E) | Altitude (m) |
|---|---|---|---|---|
| Shiling | SL | 24°41′ | 103°27′ | 1927 |
| Binchuan | BC | 25°48′ | 100°35′ | 1430 |
| Lijiang | LJ | 100°3′ | 26°58′ | 1819 |
| Yanshan | YS | 23°07′ | 104°34′ | 1490 |
| Mile | ML | 24°27′ | 103°31′ | 1543 |
| Chuxiong | CX | 25°08′ | 101°18′ | 1767 |
| Zhaotong | ZT | 27°19′ | 103°42′ | 1920 |
| Xuanwei | XW | 26°15′ | 104°8′ | 1980 |
| Gengma | GM | 23°74′ | 99°62′ | 1340 |
| Baoshan | BS | 25°09′ | 99°13′ | 1592 |
Table 3.
Mean squares for hybrid grain yield under genotype by environment interaction study in 2020.
Table 3.
Mean squares for hybrid grain yield under genotype by environment interaction study in 2020.
| Source of Variation | Degrees of Freedom (DF) | Sum of Squares (SS) | Mean Squares | F-Calculated | Proportion of SS (%) |
|---|---|---|---|---|---|
| Block (B) | 20 | 52,315.42969 | 2615.77148 | 0.68 | |
| Environments (E) | 9 | 5,665,275.5 | 629,475.0625 | 83.47784 ** | 73.49 |
| Genotypes (G) | 13 | 577,943.4375 | 44,457.1875 | 5.89569 ** | 7.50 |
| G × E Interaction | 117 | 882,253.0625 | 7540.62451 | 3.68901 ** | 11.44 |
| Error | 260 | 531,460.5625 | 2044.0791 | 6.89 | |
| Total | 419 | 7,709,248 | 100.00 |
Table 4.
Mean squares for hybrid grain yield under genotype by environment interaction study in 2021.
Table 4.
Mean squares for hybrid grain yield under genotype by environment interaction study in 2021.
| Source of Variation | Degrees of Freedom (DF) | Sum of Squares (SS) | Mean Squares | F-Calculated | Proportion of SS (%) |
|---|---|---|---|---|---|
| Block (B) | 20 | 774,893.6875 | 38,744.68359 | 10.81 | |
| Environments (E) | 9 | 4,780,375 | 531,152.75 | 97.98611 ** | 66.74 |
| Genotypes (G) | 13 | 414,385.0625 | 31,875.77344 | 5.88039 ** | 5.79 |
| G × E Interaction | 117 | 634,221.25 | 5420.69434 | 2.52029 ** | 8.85 |
| Error | 260 | 559,213 | 2150.81934 | 7.81 | |
| Total | 419 | 7,163,088 | 100.00 |
Table 5.
Mean yield (kg ha−1) of 14 maize hybrids across 10 environments in 2020.
| Locations/ Hybrids | Gengma | Binchuan | Lijiang | Yanshan | Mile | Chuxiong | Baoshan | Zhaotong | Xuanwei | Shiling | Mean |
|---|---|---|---|---|---|---|---|---|---|---|---|
| ZY-811 | 11,352 | 15,733 | 13,444 | 13,070 | 11,751 | 13,698 | 10,307 | 9593 | 14,949 | 14,343 | 12,824 |
| YY-1503 | 10,224 | 15,395 | 13,223 | 13,136 | 12,047 | 12,620 | 10,512 | 9429 | 14,027 | 13,551 | 12,416 |
| DY-201 | 10,226 | 14,914 | 12,016 | 12,092 | 10,178 | 11,987 | 11,306 | 9663 | 13,865 | 11,885 | 11,813 |
| LD-18 | 9506 | 16,543 | 14,023 | 13,500 | 13,287 | 12,703 | 10,529 | 9495 | 17,703 | 14,660 | 13,195 |
| LX-1 | 9125 | 14,444 | 12,686 | 12,867 | 11,042 | 12,876 | 11,423 | 8978 | 13,979 | 13,575 | 12,099 |
| LD-19 | 11,516 | 14,528 | 13,522 | 12,642 | 9869 | 13,578 | 11,534 | 9690 | 15,183 | 14,775 | 12,684 |
| LD-29 | 10,926 | 15,529 | 11,485 | 12,775 | 13,913 | 13,806 | 12,384 | 9573 | 15,611 | 12,825 | 12,883 |
| DY-502 | 9054 | 13,323 | 12,548 | 12,333 | 10,901 | 12,851 | 11,087 | 9045 | 14,099 | 13,676 | 11,892 |
| DY-602 | 9564 | 14,175 | 11,411 | 11,836 | 11,192 | 11,873 | 10,839 | 8493 | 13,526 | 12,368 | 11,528 |
| ZY-607 | 10,793 | 16,409 | 13,520 | 13,581 | 11,240 | 13,065 | 11,853 | 8832 | 14,782 | 13,926 | 12,800 |
| ZY-809 | 9423 | 15,694 | 13,612 | 12,889 | 10,928 | 13,026 | 11,990 | 9417 | 14,960 | 13,526 | 12,546 |
| YY-1506 | 9245 | 14,943 | 13,403 | 12,767 | 12,209 | 12,998 | 11,834 | 9465 | 12,223 | 13,476 | 12,256 |
| JL-118 | 9437 | 14,877 | 12,140 | 11,242 | 12,974 | 13,484 | 12,192 | 8798 | 12,517 | 12,959 | 12,062 |
| HH-2 (CK) | 8042 | 14,398 | 11,709 | 11,356 | 10,370 | 11,326 | 10,459 | 8637 | 12,976 | 12,109 | 11,138 |
| Mean | 9888 | 15,065 | 12,767 | 12,577 | 11,564 | 12,849 | 11,303 | 9222 | 14,314 | 13,404 | 12,295 |
Note: values in bold and underlined are the top three highest grain yield (kg ha−1) of maize hybrids at each test environment.
Table 6.
Mean yield (kg ha−1) of 14 maize hybrids across 10 environments in 2021.
| Locations/ Hybrids | Gengma | Binchuan | Lijiang | Yanshan | Mile | Chuxiong | Baoshan | Zhaotong | Xuanwei | Shiling | Mean |
|---|---|---|---|---|---|---|---|---|---|---|---|
| ZY-811 | 10,115 | 11,869 | 12,095 | 11,696 | 9153 | 12,168 | 9284 | 8054 | 11,342 | 13,584 | 10,936 |
| YY-1503 | 8389 | 11,854 | 13,259 | 11,001 | 9956 | 12,152 | 9233 | 8484 | 11,147 | 12,938 | 10,841 |
| DY-201 | 9011 | 12,420 | 12,269 | 11,168 | 9509 | 12,227 | 9328 | 7835 | 11,789 | 12,543 | 10,810 |
| LD-18 | 8996 | 13,817 | 12,459 | 13,001 | 9414 | 12,393 | 9234 | 7920 | 12,681 | 14,126 | 11,404 |
| LX-1 | 8606 | 11,574 | 12,822 | 11,084 | 9231 | 12,875 | 9172 | 7890 | 11,114 | 14,187 | 10,855 |
| LD-19 | 10,324 | 11,690 | 11,973 | 12,195 | 9153 | 13,175 | 9183 | 8745 | 10,876 | 13,490 | 11,080 |
| LD-29 | 9584 | 11,646 | 12,300 | 10,584 | 8898 | 11,609 | 7800 | 8348 | 12,381 | 14,120 | 10,727 |
| DY-502 | 8402 | 11,677 | 11,998 | 9557 | 9515 | 12,792 | 9117 | 7668 | 9738 | 12,032 | 10,249 |
| DY-602 | 8178 | 11,651 | 10,905 | 9890 | 9287 | 11,717 | 9134 | 7853 | 10,764 | 12,459 | 10,184 |
| ZY-607 | 8999 | 11,762 | 10,954 | 9501 | 9392 | 12,302 | 9634 | 7968 | 10,822 | 12,978 | 10,431 |
| ZY-809 | 8232 | 11,599 | 12,399 | 10,751 | 9381 | 12,251 | 9851 | 8108 | 9955 | 13,620 | 10,614 |
| YY-1506 | 8606 | 11,712 | 11,944 | 10,473 | 9234 | 12,726 | 11,051 | 7754 | 9988 | 13,310 | 10,680 |
| JL-118 | 8532 | 12,982 | 10,860 | 10,334 | 9935 | 11,534 | 9234 | 9248 | 12,056 | 12,717 | 10,743 |
| HH-2 (CK) | 7234 | 11,234 | 9939 | 9167 | 8262 | 11,095 | 8825 | 7048 | 9042 | 11,487 | 9333 |
| Mean | 8800 | 11,963 | 11,870 | 10,743 | 9308 | 12,215 | 9291 | 8066 | 10,978 | 13,113 | 10,635 |
Note: values in bold and underlined are the top three highest grain yield (kg ha−1) of maize hybrids at each test environment.
Table 7.
Mean yield (kg ha−1) of 14 maize hybrids across 10 environments over two years.
| Locations/ Hybrids | Gengma | Binchuan | Lijiang | Yanshan | Mile | Chuxiong | Baoshan | Zhaotong | Xuanwei | Shiling | Mean |
|---|---|---|---|---|---|---|---|---|---|---|---|
| ZY-811 | 10,733 | 13,801 | 12,769 | 12,383 | 10,452 | 12,933 | 9795 | 8823 | 13,145 | 13,964 | 11,880 |
| YY-1503 | 9307 | 13,624 | 13,241 | 12,069 | 11,001 | 12,386 | 9873 | 8957 | 12,587 | 13,244 | 11,629 |
| DY-201 | 9618 | 13,667 | 12,142 | 11,630 | 9843 | 12,107 | 10,317 | 8749 | 12,827 | 12,214 | 11,311 |
| LD-18 | 9251 | 15,180 | 13,241 | 13,250 | 11,351 | 12,548 | 9881 | 8708 | 15,192 | 14,393 | 12,299 |
| LX-1 | 8865 | 13,009 | 12,754 | 11,975 | 10,136 | 12,875 | 10,297 | 8434 | 12,547 | 13,881 | 11,477 |
| LD-19 | 10,920 | 13,109 | 12,747 | 12,418 | 9511 | 13,376 | 10,358 | 9218 | 13,029 | 14,132 | 11,882 |
| LD-29 | 10255 | 13,587 | 11,893 | 11,680 | 11,405 | 12,707 | 10,092 | 8960 | 13,996 | 13,472 | 11,805 |
| DY-502 | 8728 | 12,500 | 12,273 | 10,945 | 10,208 | 12,821 | 10,102 | 8357 | 11,918 | 12,854 | 11,070 |
| DY-602 | 8871 | 12,913 | 11,158 | 10,863 | 10,239 | 11,795 | 9986 | 8173 | 12,145 | 12,413 | 10,856 |
| ZY-607 | 9896 | 14,085 | 12,237 | 11,541 | 10,316 | 12,683 | 10,743 | 8400 | 12,802 | 13,452 | 11,616 |
| ZY-809 | 8827 | 13,647 | 13,005 | 11,820 | 10,154 | 12,638 | 10,920 | 8762 | 12,458 | 13,573 | 11,580 |
| YY-1506 | 8925 | 13,328 | 12,673 | 11,620 | 10,721 | 12,862 | 11,442 | 8609 | 11,106 | 13,393 | 11,468 |
| JL-118 | 8984 | 13,929 | 11,500 | 10,788 | 11,454 | 12,509 | 10,713 | 9023 | 12,287 | 12,838 | 11,402 |
| HH-2 (CK) | 7638 | 12,816 | 10,824 | 10,262 | 9316 | 11,210 | 9642 | 7842 | 11,009 | 11,798 | 10,236 |
| Mean | 9344 | 13,514 | 12,318 | 11,660 | 10,436 | 12,532 | 10,297 | 8644 | 12,646 | 13,259 | 11,465 |
Note: values in bold and underlined are the top three highest grain yield (kg ha−1) of maize hybrids at each test environment.
Publisher’s Note: MDPI stays neutral with regard to jurisdictional claims in published maps and institutional affiliations. |
© 2022 by the authors. Licensee MDPI, Basel, Switzerland. This article is an open access article distributed under the terms and conditions of the Creative Commons Attribution (CC BY) license (https://creativecommons.org/licenses/by/4.0/).
Share and Cite
MDPI and ACS Style
Liu, C.; Ma, C.; Lü, J.; Ye, Z. Yield Stability Analysis in Maize Hybrids of Southwest China under Genotype by Environment Interaction Using GGE Biplot. Agronomy 2022, 12, 1189. https://0-doi-org.brum.beds.ac.uk/10.3390/agronomy12051189
AMA Style
Liu C, Ma C, Lü J, Ye Z. Yield Stability Analysis in Maize Hybrids of Southwest China under Genotype by Environment Interaction Using GGE Biplot. Agronomy. 2022; 12(5):1189. https://0-doi-org.brum.beds.ac.uk/10.3390/agronomy12051189
Chicago/Turabian StyleLiu, Chaorui, Chenyu Ma, Jianguo Lü, and Zhilan Ye. 2022. "Yield Stability Analysis in Maize Hybrids of Southwest China under Genotype by Environment Interaction Using GGE Biplot" Agronomy 12, no. 5: 1189. https://0-doi-org.brum.beds.ac.uk/10.3390/agronomy12051189
Note that from the first issue of 2016, this journal uses article numbers instead of page numbers. See further details here.