Article

Long-Term Optimal Management of Rapeseed Cultivation Simulated with the CROPGRO-Canola Model

1
Macro Agriculture Research Institute, College of Plant Science and Technology, Huazhong Agricultural University, Wuhan 430070, China
2
Department of Inspection and Quarantine Technology Communication, Shanghai Customs College, Shanghai 201204, China
3
Biosystems Engineering, Auburn University, Auburn, AL 36849, USA
4
Macro Agriculture Research Institute, College of Resources and Environment, Huazhong Agricultural University, Wuhan 430070, China
5
College of Plant Science and Technology, Huazhong Agricultural University, Wuhan 430070, China
*
Author to whom correspondence should be addressed.
Submission received: 16 March 2022 / Revised: 8 May 2022 / Accepted: 12 May 2022 / Published: 15 May 2022

Abstract

:
Rapeseed (Brassica napus L.) is an important oilseed crop grown worldwide with a planting area of 6.57 million ha in China, which accounts for about 20% of the world’s total rapeseed planting area. However, in recent years, the planting area in China has decreased by approximately 12.2% due to the low yield and economic benefits. Thus, to ensure oil security, it is necessary to develop high-efficiency cultivation for rapeseed production. Crop growth models are powerful tools to analyze and optimize the yield composition of crops under certain environmental and management conditions. In this study, the CROPGRO-Canola model was first calibrated and evaluated using the rapeseed planting data of four growing seasons in Wuhan with nine nitrogen fertilizer levels (from 120 to 360 kg ha−1) and five planting densities (from 15 to 75 plants m−2). The results indicated that the CROPGRO-Canola model simulated rapeseed growth well under different nitrogen rates and planting densities in China, with a simulation error of 0–3 days for the anthesis and maturity dates and a normalized root mean square error lower than 7.48% for the yield. Furthermore, we optimized the management of rapeseed by calculating the marginal net return under 10 nitrogen rates (from 0 to 360 kg ha−1 at an increasing rate of 40 kg ha−1) and 6 planting densities (from 15 to 90 plant m−2 at an increasing rate of 15 plant m−2) from 1989 to 2019. The results indicated that the long-term optimal nitrogen rate was 120–160 kg N ha−1, and the optimal planting density was 45–75 plants m−2 under normal fertilizer prices. The optimal nitrogen rate decreased with increasing fertilizer price within a reasonable range. In conclusion, long-term rapeseed management can be optimized based on rapeseed and nitrogen cost using long-term weather records and local soil information.

1. Introduction

Rapeseed (Brassica napus L.) is the third largest oilseed crop in the world and the second largest oilseed crop in China [1]. It is mainly used in the mass production of animal feed and vegetable oil [2]. In 2019, the planting area of rapeseed in China was approximately 6.57 million ha, which accounts for nearly 20% of the world’s total rapeseed planting area [1]. However, the rapeseed planting area in China has decreased by about 11.2% in the past five years relative to that in 2010 (about 7.4 million ha) [3]. Moreover, China’s edible vegetable oil self-sufficiency decreased from 54% in 2010 to 31% in 2021 [3,4]. The domestic supply of edible oil has decreased due to the COVID-19 pandemic, which restricted rural labor and edible oil shipments and affected the rapeseed processing enterprises [5]. Recently, China has increased the number of large-scale rapeseed growers and promoted rapeseed production [5]. However, the yield of on-farm rapeseed is typically one-third less than that under regional demonstration projects, which indicates that farmers need more information about optimum management.
The Yangtze River Basin (90°13′~122°19′ E, 24°27′~35°54′ N) is the main production area of winter rapeseed in China, due to flat terrain and sufficient light and water supply. Moreover, winter rapeseed production has great potential in this region, as most fields are typically fallow in the winter [6,7]. Statistical data in this region show that rapeseed yield is approximately 2000 kg ha−1, which is only 65.4% of that in the United States and 58.1% of that in European countries [1]. Demonstration plots under optimum management in this region yield over 3000 kg ha−1, which is higher than on-farm yields [8]. Nitrogen and planting density management play important roles in regulating the development of rapeseed at both individual and population levels [9,10]. Rapeseed responds positively to optimum nitrogen fertilizer and plant population. For example, high nitrogen application can increase the essential components (such as cellulose and lignin) of the stem to improve the resistance of the plants to lodging [11]. However, excessive nitrogen may increase the lodging risk due to decreases in root neck diameter and root dry biomass [12,13]. In addition, a higher planting density can also cause decreases in root neck diameter and root dry biomass [12]. Therefore, optimization of nitrogen and planting population management can help to reduce the application of nitrogen fertilizer as well as improve the yield and overall economic benefits.
In the post-epidemic era, mechanized production, unmanned farms and smart farms are inseparable from efficient management decisions. Long-term optimal management of nitrogen rate and planting density is critical for maximizing the marginal net return (MNR) [14]. However, the optimization must be performed at different spatial scales, considering multiple factors such as fertilizers and seed cost and management cost. Therefore, precise methodologies or tools are needed to combine these factors to make optimal pre-season decisions. The CERES-Rice model has been used to simulate long-term optimal nitrogen management for rice in Northeast China [15]. The CSM-Barley model has been employed to reduce nitrate leaching while improving grain yield and quality in malting barley [16]. Currently, the models used to simulate rapeseed growth include APSIM-Canola [17], CROPGRO-Canola [18] and AquaCrop-Canola [19]. Among them, the APSIM-Canola model has mainly been used to simulate the effect of climate change and soil on crop growth, but this model is not appropriate for simulating the flowering period of spring rapeseed under different sowing dates [20]. The AquaCrop-Canola model is a water-driven model mainly focused on the influence of water on crop biomass and yield [21]. The CROPGRO-Canola model [18] simulates crop growth and development and is open source. This model has been evaluated under irrigation, rainfed and nitrogen stress conditions, as well as calibrated and evaluated to simulate the yield and biomass of rapeseed in eastern Canada (Jing et al., 2016). This model is part of the Decision Support System for Agrotechnology Transfer software [22,23,24]. However, the CROPGRO-Canola model has not been evaluated in China.
In this study, the CROPGRO-Canola model was used to determine the long-term optimal management of rapeseed in the Yangtze River Basin. The specific objectives of this study were to: (1) calibrate the CROPGRO-Canola model for two seasons of N rate and density experiments conducted in Wuhan, China, (2) evaluate the model at the same site for two additional seasons of data, and (3) use the model to estimate the long-term economic optimum N rate and density for this area for different N prices. The results of this work will provide recommendations to farmers on optimum N and population to maximize long-term marginal net return (MNR), and it can serve as a case study to optimize rapeseed management in advance according to rapeseed futures, climate and soil conditions in the future.

2. Materials and Methods

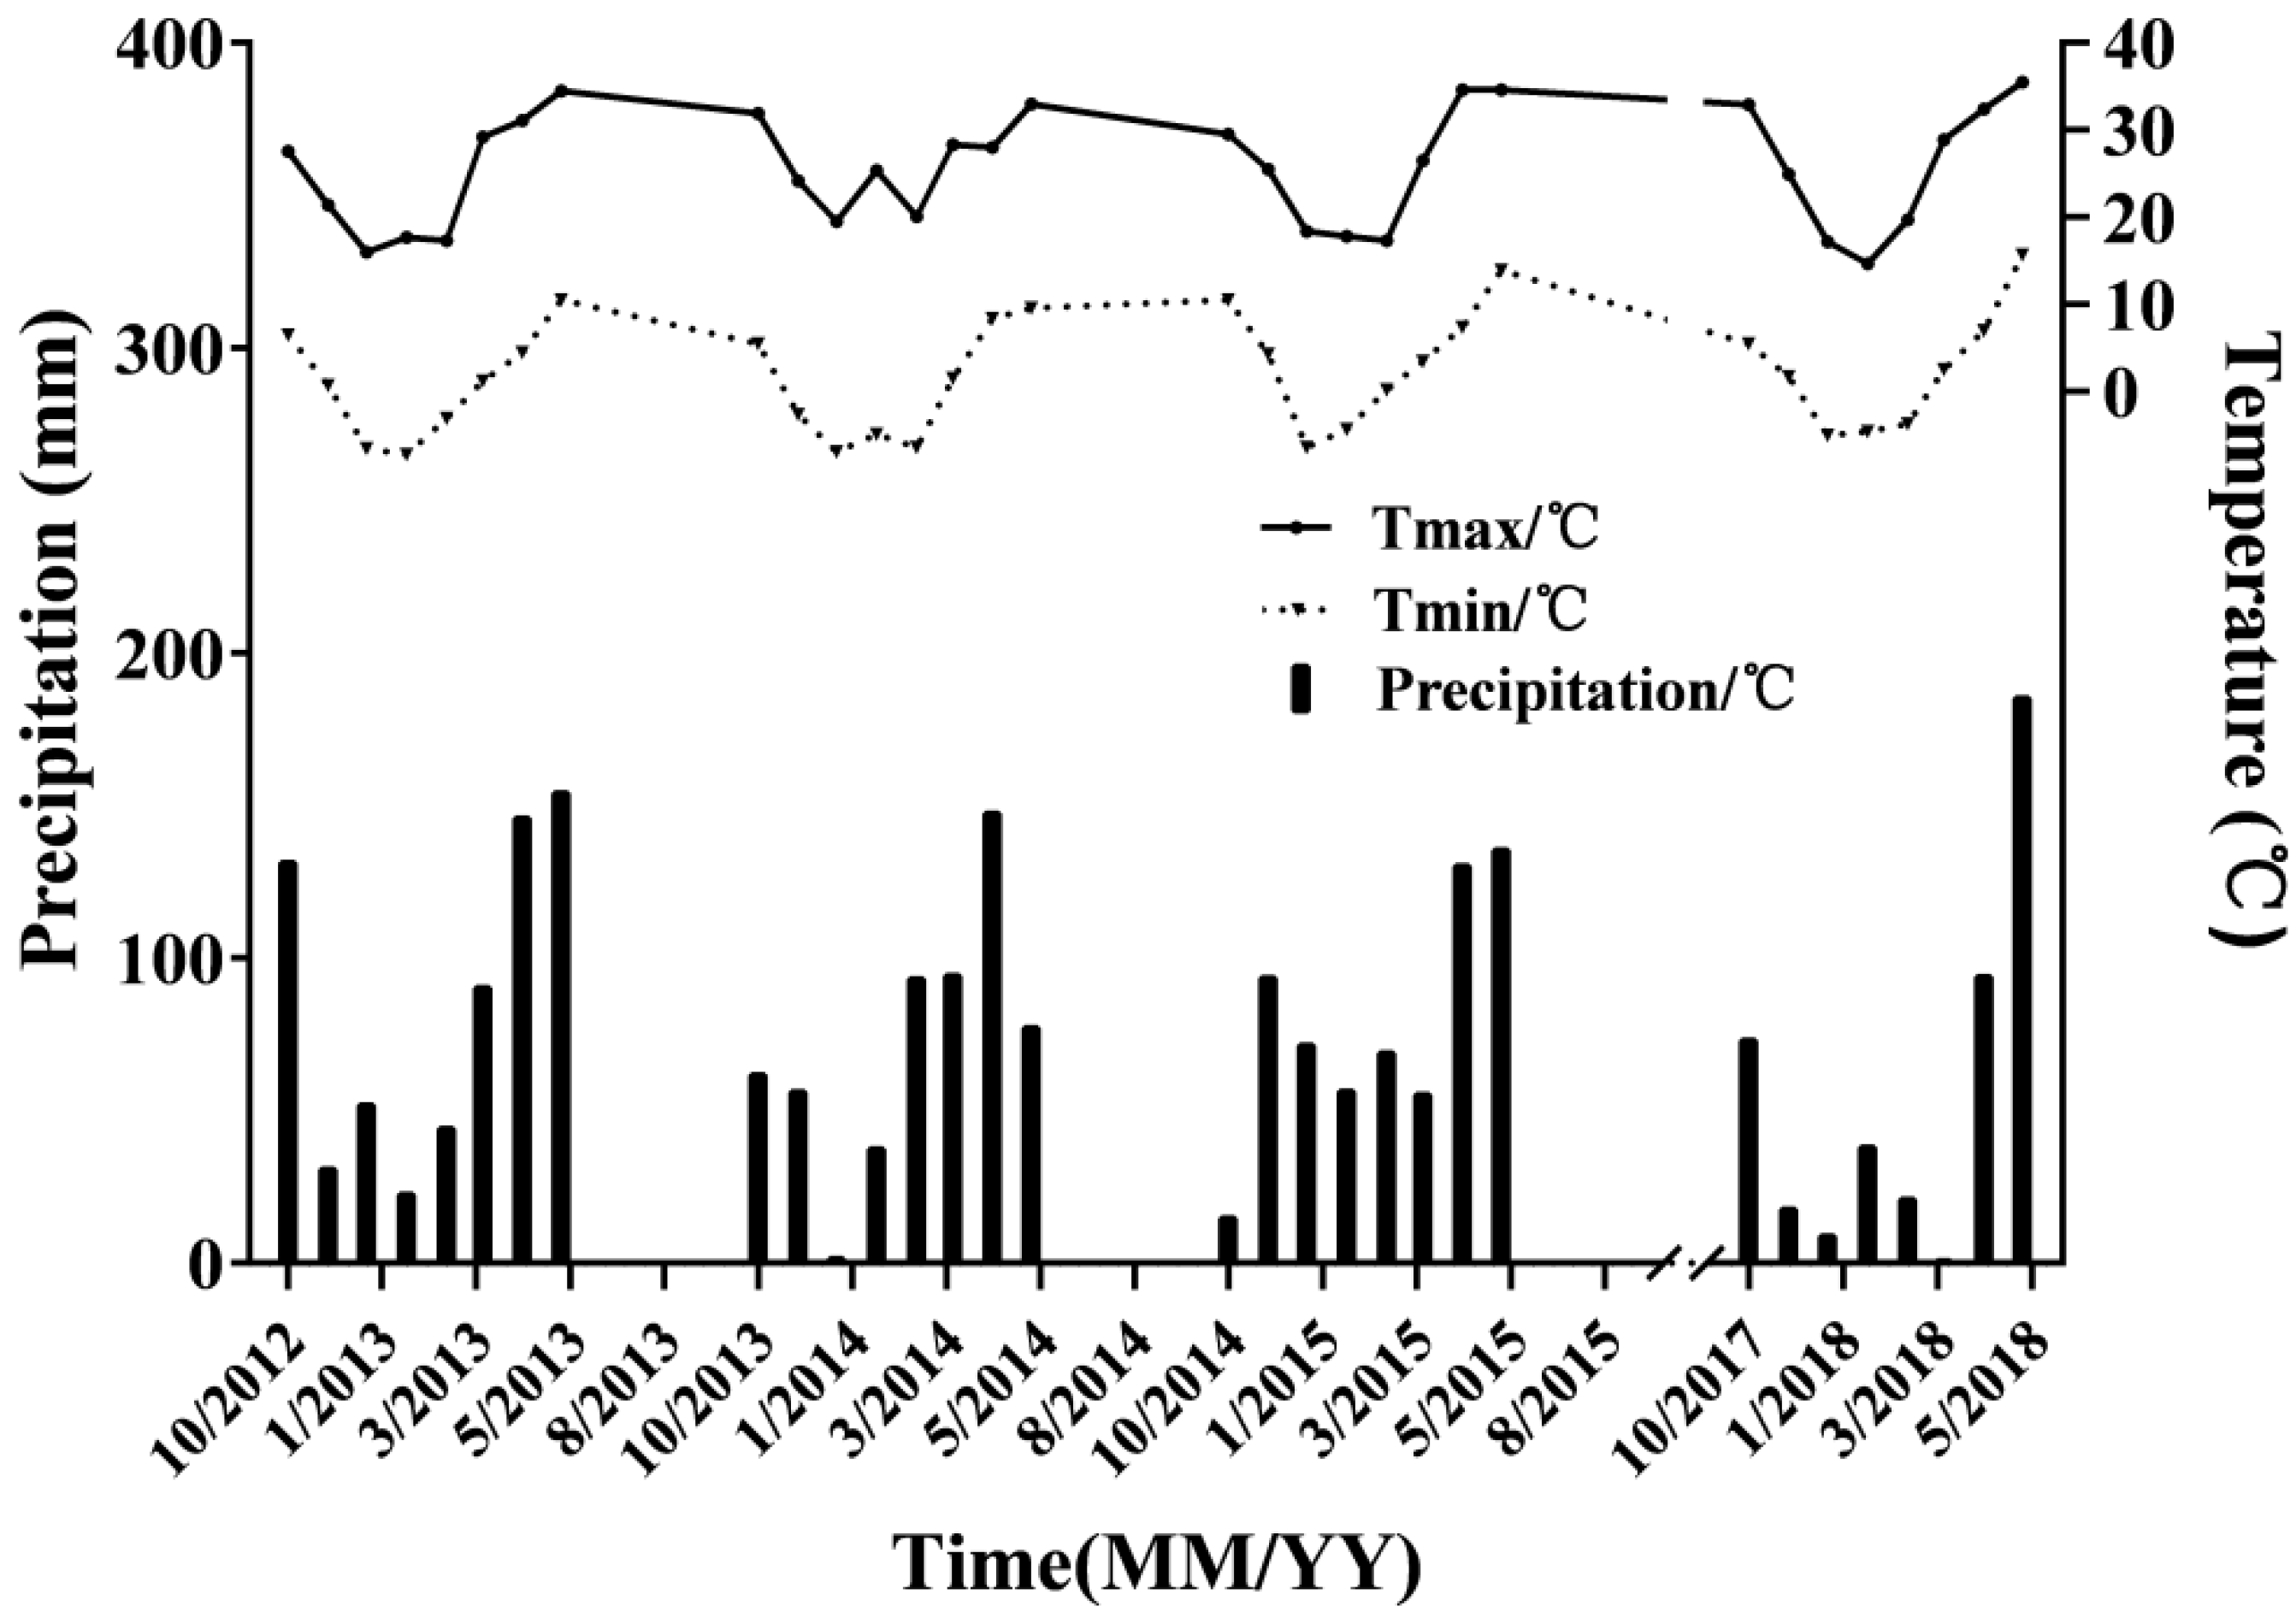
2.1. Experimental Data

Rapeseed experiments were conducted in 2013, 2014, 2015 and 2017 in Wuhan, China, with the variety of Huayouza62, which is a half-winter Brassica rapeseed hybrid bred by Huazhong Agricultural University using Polima cytoplasmic male sterile line “2063A” and the restorer line “05-P71-2”. Huayouza62 has been approved and numbered as National Certified Oil 2011021 and is one of the most common varieties planted in the Yangtze River Basin. Different planting densities and nitrogen rates were applied each year using a split plot design with three replications, with the nitrogen rate being set as the main plot (Table 1). The anthesis day was recorded as the day when 50% of the plants have open flowers on any node, and the maturity day was recorded as the day when 95% of plants reach a yellow color. Samples were collected from each plot at the overwintering, flowering and the mature stage. After removal of the roots, individual plants were separately bagged, heated at 105 °C and baked at 80 °C to constant weight, and the dry matter weight was determined. The plots were harvested separately, and the actual yield was measured.
The CROPGRO-Canola model requires properties and daily weather data, including daily maximum and minimum temperature and total precipitation, which were collected from a meteorological station near the test site (Figure 1). Daily solar radiation was calculated based on sunshine hours using the method of Angstrom et al. [25]. The soil data used in the study were derived from the Chinese soil dataset in the global soil database HWSD (Harmonized World Soil Database). The soil properties for each soil layer are shown in Table 2.

2.2. Model Description and Calibration

The CROPGRO model is a generic crop growth model with a daily time step that computes canopy photosynthesis at hourly time steps using leaf-level photosynthesis parameters and hedgerow light interception calculations. The model provides documentation that defines the parameters of species, ecotype and cultivar traits, making it possible to simulate a new cultivar in a new environment by adjusting the cultivar and ecotype parameters. In this study, a set of appropriate parameters for winter rapeseed growth simulation in Wuhan were obtained by calibrating the default parameters.
The default parameters were defined by the model and updated based on previous research. The anthesis day, maturity day, yield and above-ground biomass were the main outputs for calibration and evaluation. Datasets in 2012 and 2014 (Table 1) were randomly selected to be used for calibration. First, the Genotype Coefficient Calculator and GLUE coefficient estimator within DSSAT were used for preliminary calibration [28,29,30]. In this step, the parameters were adjusted through thousands of iterations to reduce the error of the simulated values. Sensitivity analysis was then performed to determine the main parameters that affect the output variables, and a “trial and error” method was used to adjust these parameters to minimize the error [7]. For example, the anthesis day was the most sensitive to EM-FL (time between plant emergence and flower appearance), OPTBI (minimum daily temperature above which there is no effect on slowing normal development toward flowering), RWDTH (relative width of this ecotype in comparison to the standard width per node (YVSWH) defined in the species file), SLAVR (specific leaf area of the cultivar under standard growth conditions) and SLOBI (slope of relationship reducing progress toward flowering if TMIN for the day is less than OPTBI). Thus, when simulated, anthesis day was calibrated by adjusting combinations of these parameters. Finally, all parameters were checked to determine if they were within the normal expected range. The calibrated parameter values are shown in Table 3.

2.3. Model Evaluation

The model was first run for 2013 and 2017 experiments with the datasets in Table 1 to evaluate its performance. Differences between the simulated and measured anthesis day, maturity day, yield and above-ground biomass were quantified with the following statistical indicators.
RMSE (root mean square error) and normalized RMSE (nRMSE) between simulated ( P i ) and measured ( O i ) values were calculated using Equations (1) and (2), where n is the number of observations, and O ¯ is the average of the measured value O i .
RMSE = 1 n i = 1 n ( O i P i ) 2
nRMSE = R M S E O ¯ × 100
Model simulation efficiency (EF), mean error (ME) and its relative value rME between the simulated and measured values were calculated using Equations (3)–(5).
E F = 1 i = 1 n ( O i P i ) 2 i = 1 n ( O i O ¯ ) 2
M E = 1 n i = 1 n ( P i O i )
r M E = M E O ¯ × 100 %
An optimal model gives a good fit to experimental data when RMSE and nRMSE values are small (for winter rapeseed, the nRMSE of the growth period, yield and above-ground biomass were lower than 10%, 15% and 30%, respectively), EF is close to 1, and ME and rME are close to 0 [31].

2.4. Long-Term Optimal Management Strategies

After calibration and evaluation, the model was used to estimate the long-term optimal nitrogen rate and planting density of winter rapeseed in this area. Meteorological data of 1989–2019 from Wuhan were used to simulate the response of yield to 10 nitrogen rates (from 0 to 360 kg ha−1 at an increasing rate of 40 kg ha−1) and six planting densities (from 15 to 90 plant m−2 at an increasing rate of 15 plant m−2). The marginal net return (MNR) was computed for each scenario to evaluate the economic benefits of each treatment:
MNR i j = Δ Y i e l d P r i c e Δ N r a t e N c o s t Δ P o p P c o s t
In the equation, M N R i j is the marginal net return in year i and experiment j ; Δ Y i e l d is the difference between the simulated yield and yield at the nitrogen rate of 0 kg ha−1 and the planting density of 15 plants m−2;   P r i c e is the price for rapeseed, which is usually 4.2 CNY kg−1; Δ N r a t e is the nitrogen rate minus 0 (kg ha−1); N c o s t is the cost of N (CNY kg−1); Δ P o p is the planting density minus 15 (plants m−2); P c o s t is the cost of seed, which is usually 40 CNY kg−1. N c o s t is calculated based on the typical price of NPK = 2 CNY kg−1 and urea = 2 CNY kg−1. Based on the historical fluctuations of price, there were six possible combinations of fertilizers, which included three NPK fertilizer prices (2, 4 and 6 CNY kg−1) and two urea prices (2 and 4 CNY kg−1).
M N R = 1 n M N R i j
Equation (7) shows the formula used to compute the long-term average MNR of the same experiment from 1989–2019, where n is the number of years. The optimal nitrogen rate and planting density are the levels that maximize the long-term MNR.

3. Results

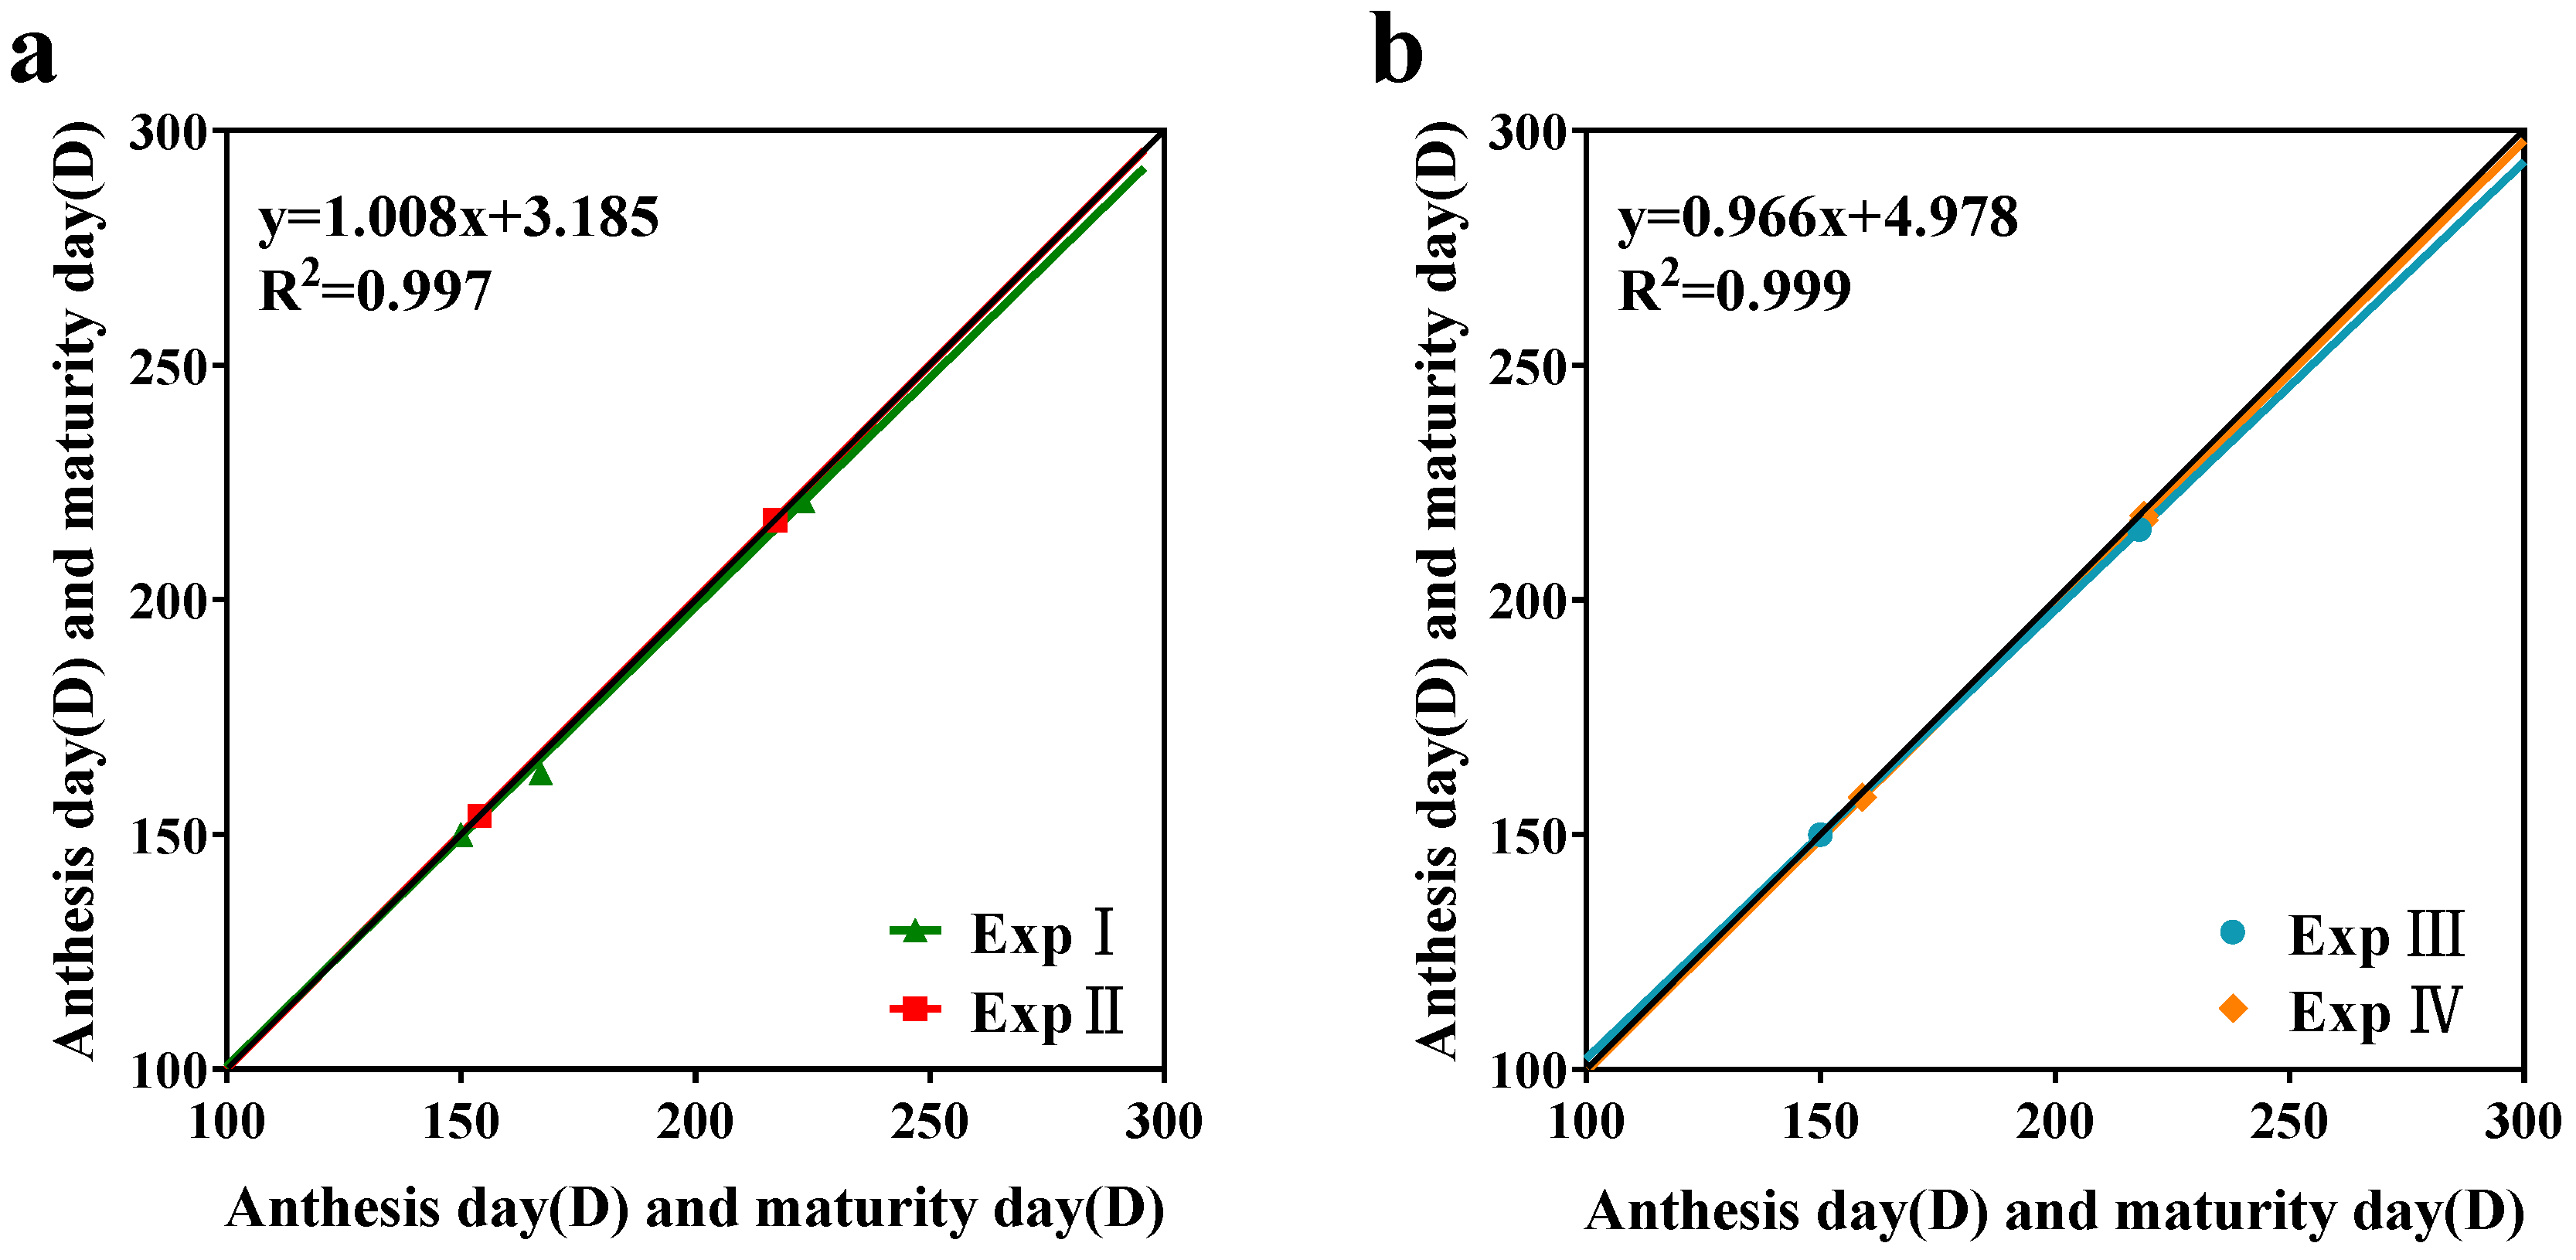
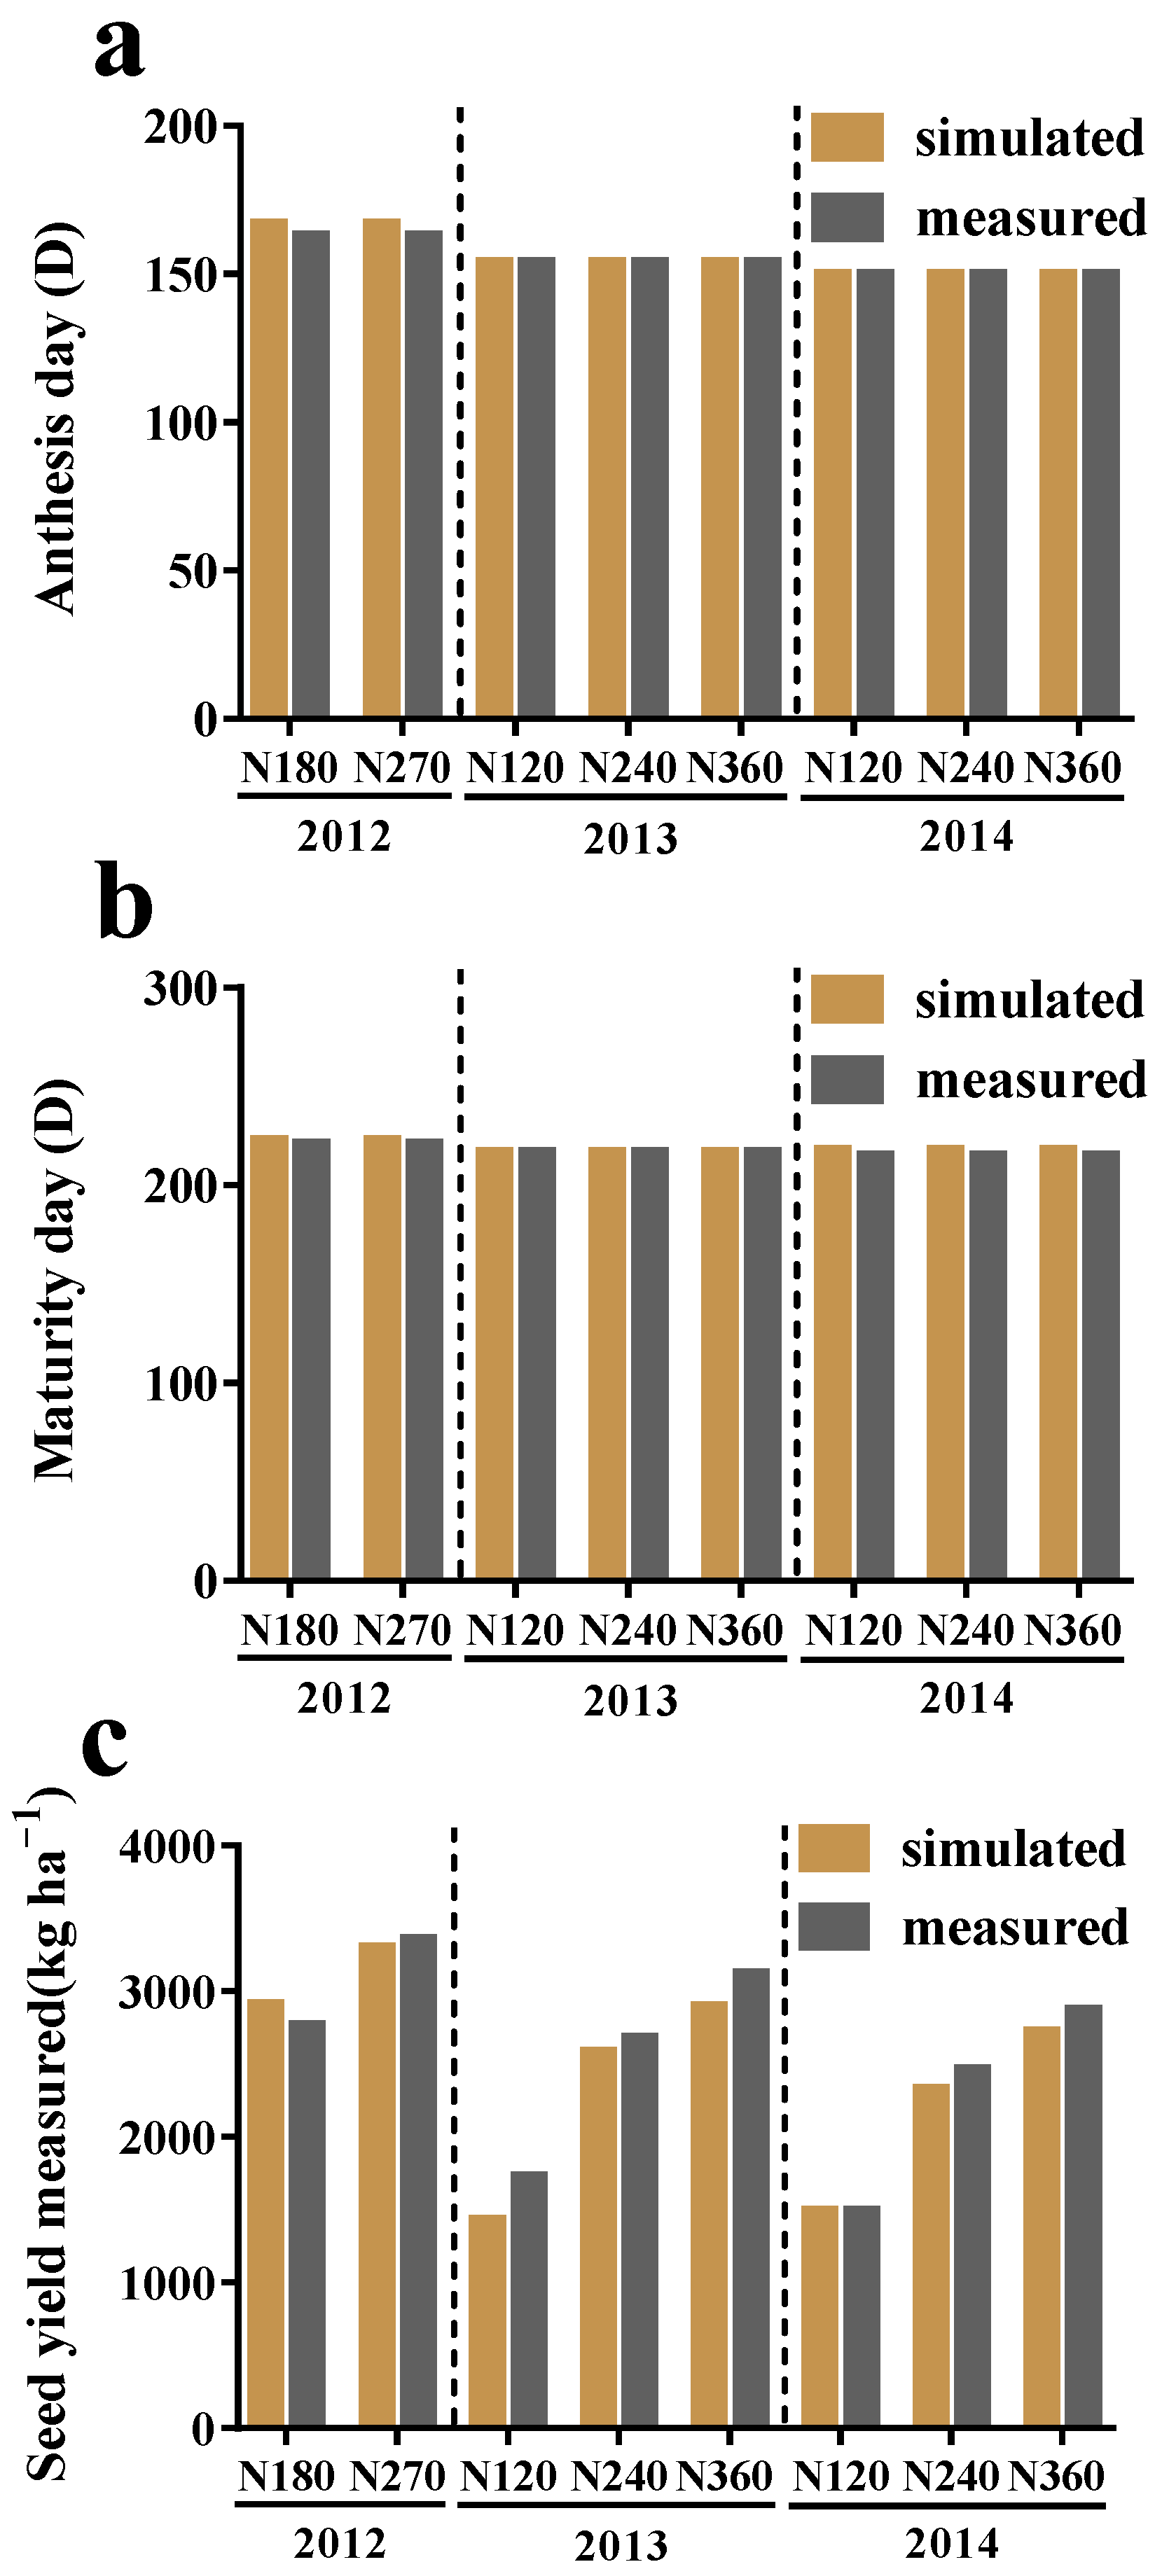
3.1. Model Calibration and Evaluation

The model cultivar coefficients gave a good fit between simulated and measured anthesis day, maturity day, yield and above-ground biomass for the calibration years (datasets I and II) and evaluation years (datasets III and IV) (Figure 2a,b and Figure 3a,b).
In the calibration years, the RMSE of the anthesis day was 2.90 d and the model gave an nRMSE of 1.85%, an rME of 1.34% and an EF of 0.80, while the maturity day had an RMSE of 2.52 d, an nRMSE of 1.16%, an rME of 1.13% and an EF of 0.29 (Figure 2a). Additionally, to evaluate the model performance for the yield, the simulation results for the yield were presented with the determination coefficient of 1:1 regression plot (Figure 3a). Combined with other evaluation criteria, the nRMSE of yield in the calibration years was 6.25%, with an RMSE of 150.07 kg ha−1, an rME of −0.83% and an EF of 0.94.
The calibrated model was then evaluated using datasets III and IV. In the evaluation years, the RMSE of the anthesis day was 0.55 d, and the model generated an nRMSE of 0.36%, an rME of 0.20% and an EF of 0.91, while the maturity day had an RMSE of 0.88 d, an nRMSE of 0.40%, an rME of 0.21% and an EF of −4.91. Combined with other evaluation criteria, the nRMSE of yield in evaluation years was 6.58%, with an RMSE of 154.76 kg ha−1, an rME of −1.72% and an EF of 0.93. A graph of the results is shown in Figure 2b and Figure 3b. These results suggested that the growth period and yield of crops can be accurately predicted.
The calibration and evaluation results demonstrated that the model could duplicate historical test results, indicating that the model is appropriate for simulating the long-term optimal management of Huayouza62. Moreover, the model produced an RMSE of 3184.52 kg ha−1, an nRMSE of 29.62%, an ME of −1717.69 kg ha−1, an rME of −15.98% and an EF of −0.12 for above-ground biomass in the evaluation years. The dynamic simulation of the above-ground biomass in this study resulted in a lower nRMSE than that reported by Deligios et al. [18]. In addition, these results are consistent with those of other evaluations with the CROPGRO-Canola model in colder environments [32], indicating that the model can simulate N yield response under a warm climate as well. Model evaluation criteria (Table 4) showed a good agreement between the simulated and observed anthesis day, maturity day, yield and above-ground biomass.

3.2. Impact of Rapeseed Management on Model Prediction

In addition to reasonable simulation of the yield, the model could also accurately simulate responses to nitrogen rate and planting density (Table 4).
Figure 4 shows good agreements between the simulated and observed anthesis day, maturity day and yield for different nitrogen rates. Specifically, under different nitrogen rates, the RMSE of anthesis day was 2.00 d, and the model generated an nRMSE of 1.29%, an ME of 1.00 d, an rME of 0.65% and an EF of 0.84 (Figure 4a). The maturity day had an RMSE of 2.09 d, an nRMSE of 0.96%, an ME of 1.63 d, an rME of 0.75% and an EF of 0.20 (Figure 4b). The yield had an RMSE of 138.23 kg ha−1, an nRMSE of 5.39%, an ME of −64.75 kg ha−1, an rME of −2.53% and an EF of 0.95 (Figure 4c). These results indicated that the model simulated the response of growth period and yield to nitrogen rate well.
The model also predicted the response to planting density well (Figure 5a,b). Specifically, under different planting densities, the RMSE for anthesis day was 2.37 d, and the model generated an nRMSE of 1.50%, an ME of 1.60 d, an rME of 1.02% and an EF of 0.76 (Figure 5a). The maturity day had an RMSE of 1.95 d, an nRMSE of 0.89%, an ME of 1.67 d, an rME of 0.76% and an EF of 0.26 (Figure 5b). In addition, the yield had an RMSE of 182.10 kg ha−1, an nRMSE of 7.48%, an ME of 22.47 kg ha−1, an rME of 0.92% and an EF of 0.61 (Figure 5c).
All the above results suggest that the model can simulate the response of different indices to nitrogen rate and planting density well, particularly the yield. Overall, the model simulated most of the variations in yield under different nitrogen rates (nRMSE = 5.39%) and planting densities (nRMSE = 7.48%) (Figure 4c and Figure 5c). In contrast to the simulation of yield, the simulation of above-ground biomass was rather insufficient, with an nRMSE of about 30% (Table 4). However, the results regarding the yield and growth period were sufficient to support our optimization of rapeseed management.

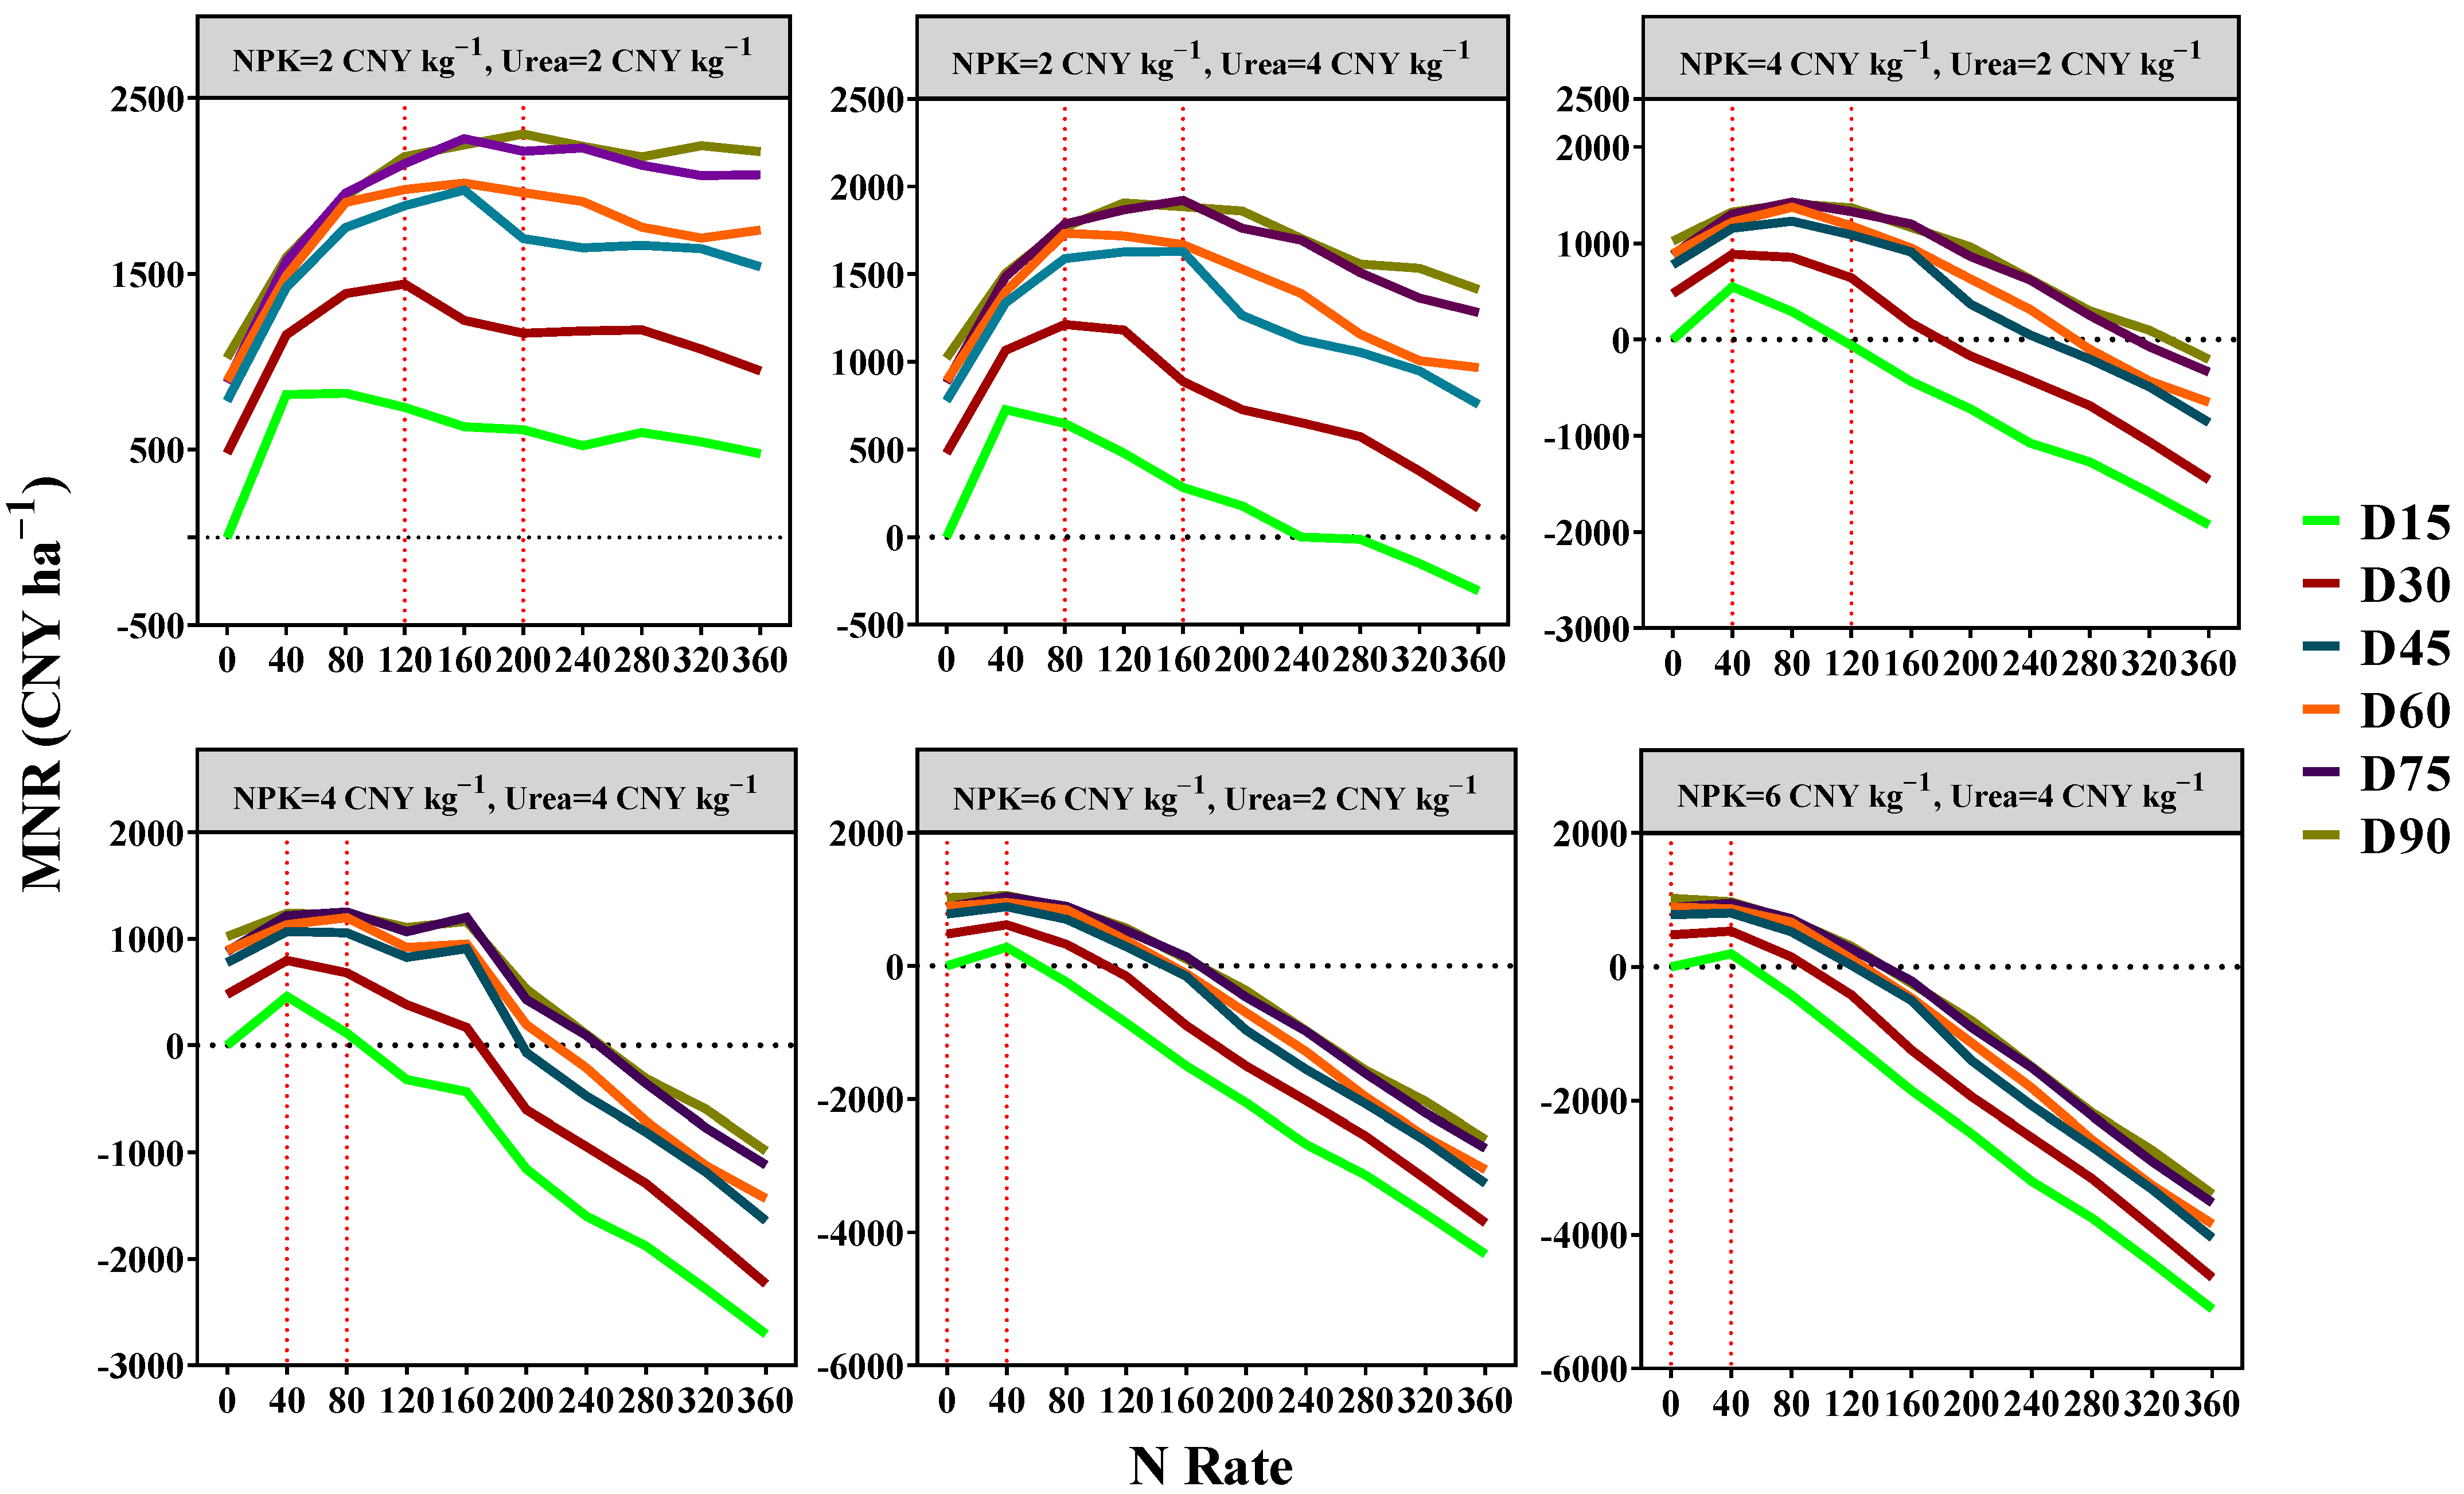
3.3. Long-Term Optimal Management

Table 5 shows the yield, soil N and MNR of winter rapeseed Huayouza62 under ten nitrogen rates averaged over 30 seasons. Figure 6 shows a sensitivity analysis of yield and MNR to different N prices. Generally, an increase in nitrogen rate led to increases in the yield of winter rapeseed and soil N. However, an increase in yield did not necessarily increase the MNR. Hence, MNR should be fully considered to maximize the economic and ecological benefits.
Changes in the price of N fertilizer were also considered. The lines with different colors in Figure 6 represent the changes in MNR under different nitrogen fertilizer prices. As the nitrogen rate increased, the MNR at normal N fertilizer price (NPK = 2 CNY kg−1; urea = 2 CNY kg−1) first rose and reached the maximum at 120–160 kg N ha−1. However, the MNR was strongly influenced by the price of N fertilizer. With increasing price of the N fertilizer, the difference between the minimum MNR (the lowest point of the curve) and maximum MNR (the highest point of the curve) increased. For instance, when the price of NPK compound fertilizer was < 2 CNY kg−1 and that of urea was < 4 CNY kg−1, the MNR tended to reach the maximum at the nitrogen rate of 120–160 kg N ha−1. However, when the price of N fertilizer increased, the optimal nitrogen rate was lower than 120 kg N ha−1, and MNR even became negative with increasing nitrogen rate.
The model was also run for ten nitrogen rates, six planting densities and six N fertilizer prices over thirty seasons of historical weather to determine the long-term optimal nitrogen rate for this area. In Figure 7, the range in between the red dotted lines represents the optimal nitrogen rate. At the NPK fertilizer price of 2 CNY kg−1 and the urea price of 2 CNY kg−1, the MNR reached the maximum at the nitrogen rates of 120–200 kg N ha−1 and plant densities of 75–90 plants m−2, and then decreased slightly with further increases in nitrogen rate; at the NPK fertilizer price of 2 CNY kg−1 and the urea price of 4 CNY kg−1, the optimal range of nitrogen rate was 80–160 kg N ha−1. Moreover, a further increase in the price of NPK fertilizer and urea would lead to a decrease in the optimal nitrogen rate. Overall, the optimal planting density of rapeseed in this area is 45–75 plants m−2 with a reasonable nitrogen rate, because rapeseed is prone to lodging at high planting densities, and dense planting may not necessarily bring greater economic benefits. Yield reduction due to lodging is not considered in the model.

4. Discussion

4.1. Simulation Performance of the CROPGRO-Canola Model

In general, the simulation error of the model for the growth stages was less than 3 days, which is consistent with the measured growth period in the field experiments, indicating an accurate simulation of the growth stages by the model. For the yield, the simulated nRMSE of the model was below 8%, which is lower than 15% (acceptable standard). The model also simulates the response to nitrogen rate and planting density well. The CROPGRO-Canola model may be highly appropriate to simulate optimum management of rapeseed. However, the nRMSE for the simulation of the model on the above-ground biomass was nearly 30%, which was not as good as the simulation of yield. Although the simulated above-ground biomass under different nitrogen rates and planting densities also showed a similar trend to the measured data (Figure 8), the accuracy of this model for the above-ground biomass needs to be further improved.

4.2. Reduction in Uncertainty in Calibration

Uncertainty has always been a major problem in the application of crop growth models. In the calibration of the CROPGRO-Canola model, it is necessary to determine the optimization targets and strategies, which requires a better understanding of the mechanism of the model. We conducted a sensitivity analysis by employing the Extended Fourier Amplitude Test (EFAST), and found the key parameters for growth period, yield and above-ground biomass [7]. We then used the Genotype Coefficient Calculator and GLUE coefficient estimator within DSSAT to iteratively adjust the parameters to make the output variables as close to the measured data as possible [28,29,30]. Finally, the main parameters were slightly adjusted to improve the calibration. In this process, if the simulated anthesis day was later than the measured anthesis day, it was necessary to adjust the parameters related to the development, such as EM-FL and PPSEN. Generally, the parameters are adjusted in the order of development, distribution of carbon and nitrogen (the biomass of different parts) and yield components, which can reduce the uncertainty of the simulation process to some extent.
Simulating growth and development of winter rapeseed could be further enhanced by measurements such as LAI (leaf area index), plant height and biomass allocation [18]. However, these measurements were not conducted in this experiment. To improve qualitative simulation of crop growth, crop models have been combined with remote sensing, which can be a surrogate for LAI measurements [21,33,34]. Thus, incorporating remote sensing with model calibrations could likely improve the calibration process.

4.3. Practical Value of Long-Term Optimization Results

In previous studies, the optimal management was usually judged based on the yield. For instance, most recent studies have indicated that the optimal nitrogen rate in this area is 120–200 kg N ha−1 [11,26], which is consistent with our results at conventional fertilizer prices. However, when the price of the fertilizer increases, this optimal nitrogen rate may not be adopted by the farmers, since their prior concern is still the economic benefits, which may be affected by many factors such as investment in seeds, fertilizer, irrigation, labor and machinery cost for field operations [35]. Because the irrigation cost is generally low for the wet climate and low temperature in the growing season of rapeseed [36], the mechanization of rapeseed production has not been widely promoted, and the rapeseed farming labor is highly mobile and difficult to quantify. Thus, we only considered the most important inputs in the cultivation of rapeseed in future studies. However, more factors affecting MNR may be incorporated into Equation (6) later to make the optimization more reliable.
The results of this study would be affected by other possible external factors. Specifically, fertilizer prices were defined considering normal fluctuations in this study, but many other factors affect fertilizer prices, such as pandemic and regional conflicts [37]. Our results indicated the relationship between fertilizer inputs and fertilizer prices in Figure 7. Thus, it could be served as a basis for reducing fertilizer supplies when fertilizer prices rise above the upper end of the range in the study. The effect of climate change and extreme climate were not considered in this study; however, crop yield is highly sensitive to this [38]. Thus, more possible external factors could be considered and make the results of long-term optimal management have greater reference value to practical application.

5. Conclusions

In this study, the long-term optimal management of winter rapeseed cultivation was studied. The results considered long-term historical climate, yield, fertilizer (i.e., price, amount and types), rapeseed population, and seed prices. The major results can be concluded as follows: (1) the CROPGRO-Canola model was robustly calibrated and evaluated in Wuhan, China; (2) fertilizer input increased rapeseed yield within a certain range, but decreased when it exceeded the range; (3) long-term optimal nitrogen rate was 120–160 kg N ha−1, and the optimal planting density was 45–75 plants m−2 under normal fertilizer prices.
Although the main factors were considered, some possible external factors (i.e., pandemic and climate change) may influence the results. Some uncertainty of the model results exists due to incomplete datasets, calibration method and potential errors in the model growth and development theory.
In conclusion, this study optimized the CROPGRO-Canola model and provided researchers and decision-makers with references to take adaptive management to ensure oil security in future.

Author Contributions

Conceptualization, L.L.; methodology, W.D.B.; software, C.W. and M.X.; validation, C.W.; resources, J.K., J.Z.; data curation, C.W., M.X. and J.K.; original draft preparation, C.W. and Y. W.; writing—review and editing, Y.W. L.L. and W.D.B.; funding acquisition, L.L. and W.D.B. All authors have read and agreed to the published version of the manuscript.

Funding

This research was funded by the National Key Research and Development Project (2020YFD1000901), the Fundamental Research Funds for the Central Universities (project No. 2662021JC002), the National Institute of Food and Agriculture, U.S. Department of Agriculture, Hatch project (ALA014-1-16016), and by the Starting Research Fund from Shanghai Customs College (KYQD202214).

Institutional Review Board Statement

Not applicable.

Informed Consent Statement

Not applicable.

Data Availability Statement

All data are provided as tables and figures.

Acknowledgments

We appreciate the two anonymous reviewers improving this manuscript with their careful and insightful reviews. We appreciate Liangzhi You and Guangsheng Zhou for their help and suggestions in this study.

Conflicts of Interest

The authors declare no conflict of interest.

References

  1. FAOSTAT. FAOSTAT Database; Food and Agriculture Organization of the United Nations: Rome, Italy, 2019; Available online: https://www.fao.org/faostat (accessed on 20 December 2021).
  2. Raza, A.; Su, W.; Hussain, M.A.; Mehmood, S.S.; Zhang, X.; Cheng, Y.; Zou, X.; Lv, Y. Integrated Analysis of Metabolome and Transcriptome Reveals Insights for Cold Tolerance in Rapeseed (Brassica napus L.). Front. Plant Sci 2021, 12, 721681. [Google Scholar] [CrossRef] [PubMed]
  3. FAOSTAT. FAOSTAT Database; Food and Agriculture Organization of the United Nations: Rome, Italy, 2010; Available online: https://www.fao.org/faostat (accessed on 20 December 2021).
  4. CNFIA. China Food Industry Yearbook. Available online: http://www.cnfia.cn (accessed on 20 December 2021).
  5. Zhang, Q.; Leng, B.; Chen, X.; Chen, Z.; Wei, M.; Feng, Z.; Li, X. Effects of COVID-19 on China’s rape industry and strategies. Chin. J. Oil Crop. Sci. 2021, 43, 551–561. [Google Scholar] [CrossRef]
  6. Tian, Z.; Ji, Y.; Xu, H.; Qiu, H.; Sun, L.; Zhong, H.; Liu, J. The potential contribution of growing rapeseed in winter fallow fields across Yangtze River Basin to energy and food security in China. Resour. Conserv. Recycl. 2021, 164. [Google Scholar] [CrossRef]
  7. Xu, M.; Wang, C.; Ling, L.; Batchelor, W.D.; Zhang, J.; Kuai, J. Sensitivity analysis of the CROPGRO-Canola model in China: A case study for rapeseed. PLoS ONE 2021, 16, e0259929. [Google Scholar] [CrossRef] [PubMed]
  8. MOA. Available online: http://www.zys.moa.gov.cn (accessed on 20 December 2021).
  9. Deligios, P.; Carboni, G.; Farci, R.; Solinas, S.; Ledda, L. Low-Input Herbicide Management: Effects on Rapeseed Production and Profitability. Sustainability 2018, 10, 2258. [Google Scholar] [CrossRef] [Green Version]
  10. Li, H.; Cong, R.; Ren, T.; Li, X.; Ma, C.; Zheng, L.; Zhang, Z.; Lu, J. Yield response to N fertilizer and optimum N rate of winter oilseed rape under different soil indigenous N supplies. Field Crops Res. 2015, 181, 52–59. [Google Scholar] [CrossRef]
  11. Yingying, S. Effects of Different Cultivation Measures on Rapessed Yield and Lodging Resistance. M.Agr. Thesis, Huazhong Agricultural University, Wuhan, China, 2016. Available online: http://lib.hzau.edu.cn/zwsjk/884.jhtml (accessed on 15 March 2022). (In Chinese).
  12. Khan, S.; Anwar, S.; Kuai, J.; Noman, A.; Shahid, M.; Din, M.; Ali, A.; Zhou, G. Alteration in yield and oil quality traits of winter rapeseed by lodging at different planting density and nitrogen rates. Sci. Rep. 2018, 8, 634. [Google Scholar] [CrossRef] [PubMed]
  13. Kuai, J.; Li, X.-y.; Yang, Y.; Zhou, G.-s. Effects of paclobutrazol on biomass production in relation to resistance to lodging and pod shattering in Brassica napus L. J. Integr. Agric. 2017, 16, 2470–2481. [Google Scholar] [CrossRef] [Green Version]
  14. Memic, E.; Graeff, S.; Claupein, W.; Batchelor, W.D. GIS-based spatial nitrogen management model for maize: Short- and long-term marginal net return maximising nitrogen application rates. Precis. Agric. 2018, 20, 295–312. [Google Scholar] [CrossRef]
  15. Zhang, J.; Miao, Y.; Batchelor, W.D. Evaluation of the CERES-Rice Model for Precision Nitrogen Management for Rice in Northeast China. Adv. Anim. Biosci. 2017, 8, 328–332. [Google Scholar] [CrossRef]
  16. Cammarano, D.; Basso, B.; Holland, J.; Gianinetti, A.; Baronchelli, M.; Ronga, D. Modeling spatial and temporal optimal N fertilizer rates to reduce nitrate leaching while improving grain yield and quality in malting barley. Comput. Electron. Agric. 2021, 182. [Google Scholar] [CrossRef]
  17. Robertson, M.J.; Holland, J.F.; Kirkegaard, J.A.; Smith, C.J. Simulation growthand development of canola in Australia. In Proceedings of the 10th International Rapeseed Congress, Canberra, Australia, 26–29 September 1999. [Google Scholar]
  18. Deligios, P.A.; Farci, R.; Sulas, L.; Hoogenboom, G.; Ledda, L. Predicting growth and yield of winter rapeseed in a Mediterranean environment: Model adaptation at a field scale. Field Crops Res. 2013, 144, 100–112. [Google Scholar] [CrossRef]
  19. Steduto, P.; Hsiao, T.C.; Raes, D.; Fereres, E. AquaCrop—The FAO Crop Model to Simulate Yield Response to Water: I. Concepts and Underlying Principles. Agron. J. 2009, 101, 426–437. [Google Scholar] [CrossRef] [Green Version]
  20. He, D.; Wang, E.; Wang, J.; Lilley, J.; Luo, Z.; Pan, X.; Pan, Z.; Yang, N. Uncertainty in canola phenology modelling induced by cultivar parameterization and its impact on simulated yield. Agric. For. Meteorol. 2017, 232, 163–175. [Google Scholar] [CrossRef]
  21. Jin, X.; Kumar, L.; Li, Z.; Feng, H.; Xu, X.; Yang, G.; Wang, J. A review of data assimilation of remote sensing and crop models. Eur. J. Agron. 2018, 92, 141–152. [Google Scholar] [CrossRef]
  22. Hoogenboom, G.; Porter, C.H.; Boote, K.J.; Shelia, V.; Wilkens, P.W.; Singh, U.; White, J.W.; Asseng, S.; Lizaso, J.I.; Moreno, L.P.; et al. The DSSAT Crop Modeling Ecosystem; Burleigh Dodds Science Publishing: Cambridge, UK, 2019; pp. 173–216. [Google Scholar]
  23. Hoogenboom, G.; Porter, C.H.; Shelia, V.; Boote, K.J.; Singh, U.; White, J.W.; Hunt, L.A.; Ogoshi, R.; Lizaso, J.I.; Koo, J.; et al. Decision Support System for Agrotechnology Transfer (DSSAT) Version 4.7.5; DSSAT Foundation: Gainesville, FL, USA, 2019. [Google Scholar]
  24. Jones, J.W.; Hoogenboom, G.; Porter, C.H.; Boote, K.J.; Batchelor, W.D.; Hunt, L.A.; Wilkens, P.W.; Singh, U.; Gijsman, A.J.; Ritchie, J.T. DSSAT Cropping System Model. Eur. J. Agron. 2003, 18, 235–265. [Google Scholar] [CrossRef]
  25. Angstrom, A. Solar and terrestrial radiation, Report to the international commission for solar research on actinometric investigations of solar and atmospheric radiation. Q. J. R. Meteorol. Soc. 1924, 50, 121–126. [Google Scholar] [CrossRef]
  26. Shifen, Y. Effect of Nitrogen Fertilizer and Planting Density on Canopy Structure and Population Characteristic of Winter Rapeseed with Direct Seeding Treatment. Mater’ Thesis, Huazhong Agricultural University, Wuhan, China, 2014. Available online: http://lib.hzau.edu.cn/zwsjk/884.jhtml (accessed on 15 March 2022). (In Chinese).
  27. Yuan, Y. Study on the Difference between Lodging Resistance of Rapeseed and Wheat at Different Density. Mater’ Thesis, Huazhong Agricultural University, Wuhan, China, 2020. Available online: http://lib.hzau.edu.cn/zwsjk/884.jhtml (accessed on 15 March 2022). (In Chinese).
  28. He, J.; Jones, J.W.; Graham, W.D.; Dukes, M.D. Influence of likelihood function choice for estimating crop model parameters using the generalized likelihood uncertainty estimation method. Agric. Syst. 2010, 103, 256–264. [Google Scholar] [CrossRef]
  29. Li, Z.; He, J.; Xu, X.; Jin, X.; Huang, W.; Clark, B.; Yang, G.; Li, Z. Estimating genetic parameters of DSSAT-CERES model with the GLUE method for winter wheat (Triticum aestivum L.) production. Comput. Electron. Agric. 2018, 154, 213–221. [Google Scholar] [CrossRef] [Green Version]
  30. Tooley, B.E.; Mallory, E.B.; Porter, G.A.; Hoogenboom, G. Predicting the response of a potato-grain production system to climate change for a humid continental climate using DSSAT. Agric. For. Meteorol. 2021, 307. [Google Scholar] [CrossRef]
  31. Ji, J.; Cai, H.; He, J.; Wang, H. Performance evaluation of CERES-Wheat model in Guanzhong Plain of Northwest China. Agric. Water Manag. 2014, 144, 1–10. [Google Scholar] [CrossRef]
  32. Jing, Q.; Shang, J.L.; Qian, B.D.; Hoogenboom, G.; Huffman, T.; Liu, J.G.; Ma, B.L.; Geng, X.Y.; Jiao, X.F.; Kovacs, J.; et al. Evaluation of the CSM-CROPGRO-Canola Model for Simulating Canola Growth and Yield at West Nipissing in Eastern Canada. Agron. J. 2016, 108, 575–584. [Google Scholar] [CrossRef] [Green Version]
  33. Newman, S.J.; Furbank, R.T. Explainable machine learning models of major crop traits from satellite-monitored continent-wide field trial data. Nat. Plants 2021, 7, 1354–1363. [Google Scholar] [CrossRef] [PubMed]
  34. Shahhosseini, M.; Hu, G.; Huber, I.; Archontoulis, S.V. Coupling machine learning and crop modeling improves crop yield prediction in the US Corn Belt. Sci. Rep. 2021, 11, 1606. [Google Scholar] [CrossRef]
  35. Rathore, V.S.; Nathawat, N.S.; Bhardwaj, S.; Yadav, B.M.; Kumar, M.; Santra, P.; Praveen, K.; Reager, M.L.; Yadava, N.D.; Yadav, O.P. Optimization of deficit irrigation and nitrogen fertilizer management for peanut production in an arid region. Sci. Rep. 2021, 11, 5456. [Google Scholar] [CrossRef]
  36. Sepaskhah, A.R.; Tafteh, A. Yield and nitrogen leaching in rapeseed field under different nitrogen rates and water saving irrigation. Agric. Water Manag. 2012, 112, 55–62. [Google Scholar] [CrossRef]
  37. World Bank. Commodity Markets Outlook; World Bank: Washington, DC, USA, 2022; p. 15. [Google Scholar]
  38. Chen, X.; Wang, L.; Niu, Z.; Zhang, M.; Li, C.a.; Li, J. The effects of projected climate change and extreme climate on maize and rice in the Yangtze River Basin, China. Agric. For. Meteorol. 2020, 282–283, 107867. [Google Scholar] [CrossRef]
Figure 1. Monthly maximum and minimum temperature and precipitation in Wuhan during the four growing seasons. The solid and dashed lines represent the monthly maximum and minimum temperature, respectively, and the bar indicates the precipitation.
Agronomy 12 01191 g001
Figure 2. Relationship between simulated and measured anthesis day and maturity day for the calibration datasets I and II (a) and the evaluation datasets III and IV (b).
Agronomy 12 01191 g002
Figure 3. Relationship between simulated and measured yield for the calibration datasets I and II (a) and the evaluation datasets III and IV (b).
Agronomy 12 01191 g003
Figure 4. Measured and simulated anthesis day (a), maturity day (b) and yield (c) of Huayouza62 under different nitrogen rates.
Agronomy 12 01191 g004
Figure 5. Measured and simulated anthesis day (a), maturity day (b) and yield (c) of Huayouza62 under different planting densities.
Agronomy 12 01191 g005
Figure 6. Simulated yield and soil N under different N rates (a) and marginal net return (MNR) under different nitrogen rates and N fertilizer prices (b) over 30 seasons (the normal price was NPK compound fertilizer = 2 CNY kg−1; urea = 2 CNY kg−1).
Agronomy 12 01191 g006
Figure 7. Simulated marginal net return under different nitrogen rates, N fertilizer prices and planting densities over 30 seasons (the normal price was NPK compound fertilizer = 2 CNY kg−1; urea = 2 CNY kg−1; and the range in between the red dotted lines represents the optimal nitrogen rate).
Agronomy 12 01191 g007
Figure 8. Measured and simulated above-ground biomass under different nitrogen rates (a) and planting densities (b) of Huayouza62.
Agronomy 12 01191 g008
Table 1. Datasets for model calibration (I–II) and evaluation (III–IV) of the model.
DatasetGrowing SeasonN Rate (kg ha−1)Planting Density (Plants m−2)Source of Data
I2012/10–2013/05180, 27015, 30, 45, 60, 75Yang, 2014 [26]
II2014/09–2015/04120, 240, 36015, 30, 45Sun, 2016 [11]
III2013/09–2014/04120, 240, 36015, 30, 45Sun, 2016 [11]
IV2017/09–2018/0515915, 30, 45Yuan, 2020 [27]
Table 2. Soil properties of the experimental site.
Depth (cm)Clay (%)Silt (%)Lower Limit (v v−1)Drained Upper Limit (v v−1)Sat. Hydraulic Conduct (cm h−1)pHOrganic Carbon (%)Bulk Density (g cm−3)
521500.1530.340.4477.81.121.22
1521500.1530.340.4477.81.121.22
3021500.1530.340.4477.81.121.22
6021450.1440.3140.4147.90.821.31
8021450.1440.3140.4147.90.821.31
10021450.1440.3140.4147.90.821.31
12021450.1440.3140.4147.90.821.31
15021450.1440.3140.4147.90.821.31
18021450.1440.3140.4147.90.821.31
20021450.1440.3140.4147.90.821.31
Table 3. Calibrated parameters in CROPGRO-Canola for rapeseed with default values and calibrated values for cultivar Huayouza62.
ParameterDefinition DefaultCalibrated
CSDLCritical short day length below which reproductive development progresses with no daylength effect (h)2415.59
PPSENSlope of the relative response of development to photoperiod with time (1 h−1)−0−0.06
EM-FLTime between plant emergence and flower appearance (R1) (PD)2938.51
FL-SHTime between first flower and first pod (R3) (PD)1510.4
FL-SDTime between first flower and first seed (R5) (PD)3115.9
SD-PMTime between first seed (R5) and physiological maturity (R7) (PD)2526.55
FL-LFTime between first flower (R1) and end of leaf expansion (PD)30.81
LFMAXMaximum leaf photosynthesis rate at 30 C, 350 vpm CO2 and high light (mg CO2 m−2 s−1)10.814
SLAVRSpecific leaf area of cultivar under standard growth conditions (cm2 g−1)250329.2
SIZLFMaximum size of full leaf (three leaflets) (cm−2)10052.79
XFRTMaximum fraction of daily growth that is partitioned to seed-shell11
WTPSDMaximum weight per seed (g)00.003
SFDURSeed filling duration for pod cohort at standard growth conditions (PD)2015.02
SDPDVAverage seed per pod under standard growing conditions (no pod−1)2214
PODURTime required for cultivar to reach final pod load under optimal conditions (PD)105.435
SDPROFraction protein in seeds (g g−1)0.20.23
SDLIPFraction oil in seeds (g g−1)0.50.48
PD, photothermal days.
Table 4. Model statistical criteria.
AttributeStatistical Criteria
NRMSEnRMSEMErMEEF
Calibration years
Anthesis day (D)19.002.901.852.111.340.80
Maturity day (D)19.002.521.162.471.130.29
Seed yield (kg ha−1)19.00150.076.25−20.05−0.830.94
Above-ground biomass (kg ha−1)19.003051.0730.53−293.42−2.94−0.47
Evaluation years
Anthesis day (D)13.000.550.360.310.200.91
Maturity day (D)13.000.880.400.460.21−4.91
Seed yield (kg ha−1)13.00154.766.58−40.38−1.720.93
Above-ground biomass (kg ha−1)13.003184.5229.62−1717.69−15.98−0.12
Different nitrogen applications
Anthesis day (D)8.002.001.291.000.650.84
Maturity day (D)8.002.090.961.630.750.20
Seed yield (kg ha−1)8.00138.235.39−64.75−2.530.95
Above-ground biomass (kg ha−1)8.004582.2536.24−3454.00−27.31−1.25
Different planting densities
Anthesis day (D)15.002.371.501.601.020.76
Maturity day (D)15.001.950.891.670.760.26
Seed yield (kg ha−1)15.00182.107.4822.470.920.61
Above-ground biomass (kg ha−1)15.003138.8230.54−1330.13−12.94−0.50
Table 5. Yield, marginal net return (MNR) of winter rapeseed and soil N under different nitrogen rates. The values are mean of 30 seasons.
TreatmentsYield (kg ha−1)MNR (CNY ha−1)Soil N (kg ha−1)
N01453.900153.13
N401691.90645.8151.87
N801857.20986.26153.58
N1201970.971110.28156.22
N1602076.331199.02159.36
N2002094.93923.34163.20
N2402166.70870.36167.73
N2802254.43885.64172.75
N3202333.87865.46176.77
N3602393.73763.1183.39
The MNR is for rapeseed price of 4.2 CNY kg−1 and N price of 2 CNY kg−1. N0: 0 kg N ha−1; N40: 40 kg N ha−1; N80: 80 kg N ha−1; N120: 120 kg N ha−1; N160: 160 kg N ha−1; N200: 200 kg N ha−1; N240: 240 kg N ha−1; N280: 280 kg N ha−1; N320: 320 kg N ha−1; N360: 360 kg N ha−1.
Publisher’s Note: MDPI stays neutral with regard to jurisdictional claims in published maps and institutional affiliations.

