
Canopy Segmentation Method for Determining the Spray Deposition Rate in Orchards


1
Institute of Agricultural Facilities and Equipment, Jiangsu Academy of Agricultural Sciences, Nanjing 210014, China
2
Key Laboratory of Agricultural Engineering in the Middle and Lower Reaches of Yangtze River, Nanjing 210014, China
3
College of Engineering, Huazhong Agricultural University, Wuhan 430070, China
4
M3-BIORES—Measure, Model & Manage Bioresponses, KU Leuven, B-3001 Leuven, Belgium
*
Author to whom correspondence should be addressed.
Agronomy 2022, 12(5), 1195; https://0-doi-org.brum.beds.ac.uk/10.3390/agronomy12051195
Submission received: 6 April 2022
/
Revised: 30 April 2022
/
Accepted: 11 May 2022
/
Published: 16 May 2022
(This article belongs to the Special Issue Agricultural Environment and Intelligent Plant Protection Equipment)
Abstract
:The effective quantification of deposition rate is of vital importance in optimizing the application performance and the utilization of pesticides; meanwhile, the canopies of fruit tree orchards are large, with dense branches and leaves shading each other, making it difficult to quantify spraying efficiency. Therefore, it is imperative to develop a facile methodology for assessing the performance of different spraying techniques in terms of distribution and utilization rate in orchards. To evaluate spraying efficacy in orchards, a canopy segmentation method was developed in to be able to determine the spray deposition rate. The distribution and deposition rate of spray liquid applied using three kinds of orchard sprayer were measured in a pear orchard and a peach orchard. The test results showed that the trailer sprayer had the highest deposition rates, with values of 31.54% and 56.92% on peach and pear trees, respectively. The deposition rates of the mounted sprayer in the peach and pear canopies were 21.75% and 40.61%, and the rates of the hand-held sprayer were 25.19% and 29.97%, respectively. The spray gun had the best droplet distribution uniformity, with CVs of the spray in the peach and pear canopies of 20.54% and 25.06%, respectively. The CVs in the peach and pear canopies were 35.98% and 26.54% for the trailer sprayer, and the CVs of the mounted sprayer were 92.52% and 94.90%, respectively. The canopy segmentation method could effectively be used to calculate the deposition rate and drioplet distribution in orchard application, while a great deal of time was consumed by counting the number of leaves in the different areas of the fruit tree canopies. Therefore, research on the density of branches and leaves in fruit tree canopies should be carried out in order to improve the efficiency of fruit tree canopy information extraction.
1. Introduction
China is a major producer and consumer of fruits, and the planting area of orchards has ranked first in the world for a number of consecutive years. According to official data from the National Bureau of Statistics, China’s fruit output totaled 256.88 million tons, and the orchard planting area reached 11.87 million hectares [1]. The stable development of the rural orchard planting industry has made outstanding contributions to increasing farmers’ income, optimizing the industrial structure, and accelerating the construction of new rural areas [2]. Meanwhile, due to the diversity of planting patterns and complicated ecological conditions, pests and diseases are infecting and spreading seriously in orchards, leading to large numbers of insects and diseases in orchards.
In current orchard cultivation systems, pests and diseases are primarily controlled using pesticides that are applied to the canopy with different types of sprayers [3,4]. Off-target losses of sprayed pesticide is a common phenomenon in tree-fruit orchards [5]. During pesticide application in orchards, only about 30% of the pesticide liquid is effectively deposited on the canopy, and a great deal of spray liquid runs into the soil and the environment [6], with such losses causing a serious waste of pesticide, which is harmful to the environment and to residents [7,8,9].
With the increasing emphasis on the negative impacts of pesticides, the Chinese government has issued several successive policies, making agricultural non-point source pollution a priority for the improvement of the agricultural ecological environment [10]. It is urgently necessary to improve the pesticide utilization rate and reduce pesticide usage in pesticide application. In 2015, the Chinese Ministry of Agriculture implemented a policy that sought to achieve zero growth in the use of pesticide by 2020. After five years of implementation, the utilization rate of pesticides in China’s three major grain crops (rice, wheat, and maize) reached 40.6% in 2020, achieving the expected goal of reducing the amount of pesticide used, and increasing their efficiency.
The utilization rate (also called the deposition rate) of pesticides is a basic parameter for measuring the quality of pesticide application, which is expressed as the ratio of pesticide deposited on the crop after spraying to the total amount applied [11]. Therefore, the effective quantification of the deposition rate is of vital importance for optimizing the application performance and utilization of pesticides. The method for measuring the deposition rate of cereal crops and vegetables is relatively simple. The deposition rate can be calculated on the basis of the deposition volume of a single plant, the application volume per unit area, and the plant density [12,13]. Gao et al. developed an ultra-performance liquid chromatography (UPLC) analytical method for determining the deposition amount of Allura Red on rice plants. Laboratory testing and field trials confirmed that the developed method for assessing spray deposition rate was feasible and practicable [14]. Wang et al. evaluated the deposition rate for pesticide application on tomato crop using knapsack sprayers, mist sprayers, thermal foggers, and handheld spray guns [15].
Compared with cereal crops and vegetables, the canopy of tree-fruit orchards is large, with dense branches and leaves shading each other, making it difficult to quantify the spraying efficiency. Vercruysse et al. [16] measured the ground deposits in the orchard and downwind from the target area of pesticides applied with an air-blast sprayer on semi-dwarf pears and apples, and the total off-target deposits were used to evaluate application efficiency. However, this method does not calculate the specific utilization rate of spray liquid in orchard application. Zhang et al. [17] developed a new method for measuring the pesticide deposition rate on fruit trees using canopy characteristics and deposition. The new method quantified the canopy structure of orchard into “leaf area index”, “canopy shadow area”, and other indicators; however, it did not take the differences in leaf density of canopy regions into account.
Therefore, it is imperative to develop a facile methodology for assessing the performance of different spraying techniques in terms of distribution and utilization rate in orchards [18,19,20]. To evaluate spraying efficacy in orchards, a canopy segmentation method was developed to determine the spray deposition rate in orchards. The distribution and deposition rate of the sprayed liquid applied using three kinds of orchard sprayers were measured in a pear orchard and a peach orchard, respectively. This study can be used as a reference for the quantification of deposition rate in orchards, and can also provide guidance for the application of pesticides in orchards.
2. Materials and Methods
2.1. Sprayers and Orchards
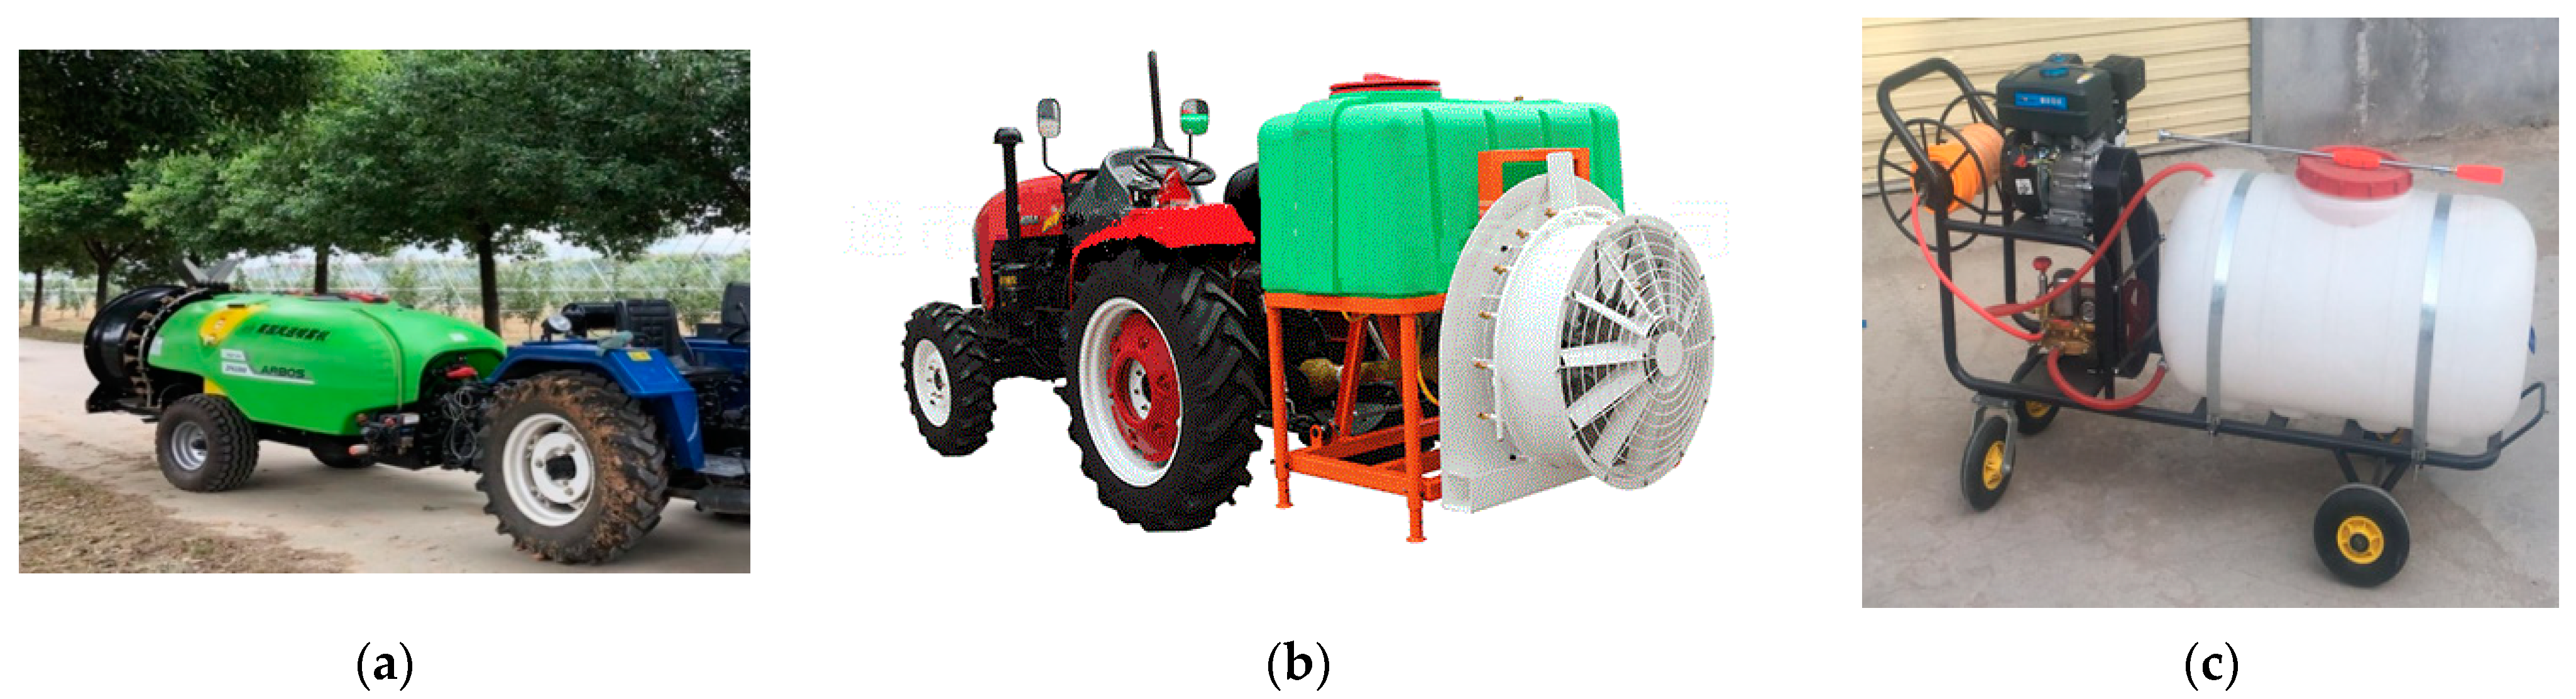
In recent years, China’s orchard sprayers have gradually changed from manual knapsack sprayers to motorized sprayers, with the main development trends for primary spraying equipment being motorized hand-held spray guns, mounted air-assisted orchard sprayers and trailer air-assisted orchard sprayers. Trailer air-assisted orchard sprayers have a large liquid tank and high operating efficiency, but the unit is relatively long as a whole and has a wide turning radius, making it suitable for large-scale orchards on flat ground [21]. The mounted orchard air-assisted sprayer is generally integrated with the tractor at three points. It is characterized by light weight and flexible maneuverability, and it can operate on small plots, but its tank is small and its working efficiency is lower than that of trailer sprayers [22]. Orchard hand-held spray guns have a simple structure and flexible operation, and they are currently the most widely used spraying equipment in orchards in developing countries. They can be transported by manual lifting or using a motorized tricycle, and their movement capacity is basically not limited by terrain or orchard conditions. At the same time, they can additionally be equipped with dozens of meters of spray hose. A handheld rod attached to the end can also expand the spraying range. In this research, a 3WQF-1000 trailer air-assisted sprayer (Figure 1a), a 3WG-500 mounted air-assisted sprayer (Figure 1b) and an orchard motorized handheld spray gun (Figure 1c) were selected for orchard spraying.
The spray deposition rates of the three sprayers were measured in a peach orchard and a pear orchard. The peach orchard test was carried out from 16 to 17 September 2019, and the test site was located at the Experimental Station of the Jiangsu Academy of Agricultural Sciences. The row spacing of the peach orchard was 4 m, and the spacing in the row was 2 m. The average plant height of the peach trees was about 3.0 m, the heading height was 0.6 m, the canopy width of the peach tree was about 2.0 m, the leaf area index of the peach orchard was 1.18, and the transmission coefficient was 0.22. The pear orchard test was carried out from 23 to 24 September 2020, and the test site was located in the modern agricultural industrial park of Xinjie Town, Taixing City, Jiangsu Province. The row spacing of the pear orchard was 5 m, and the spacing in the row was 2 m. The average plant height of the pear tree was about 3.8 m, the heading height was 0.6 m, the canopy width of the pear tree was about 2.5 m, the leaf area index of the pear orchard was 1.43, and the transmission coefficient was 0.29.
2.2. Experimental Design
2.2.1. Operating Parameters of Spraying Equipment
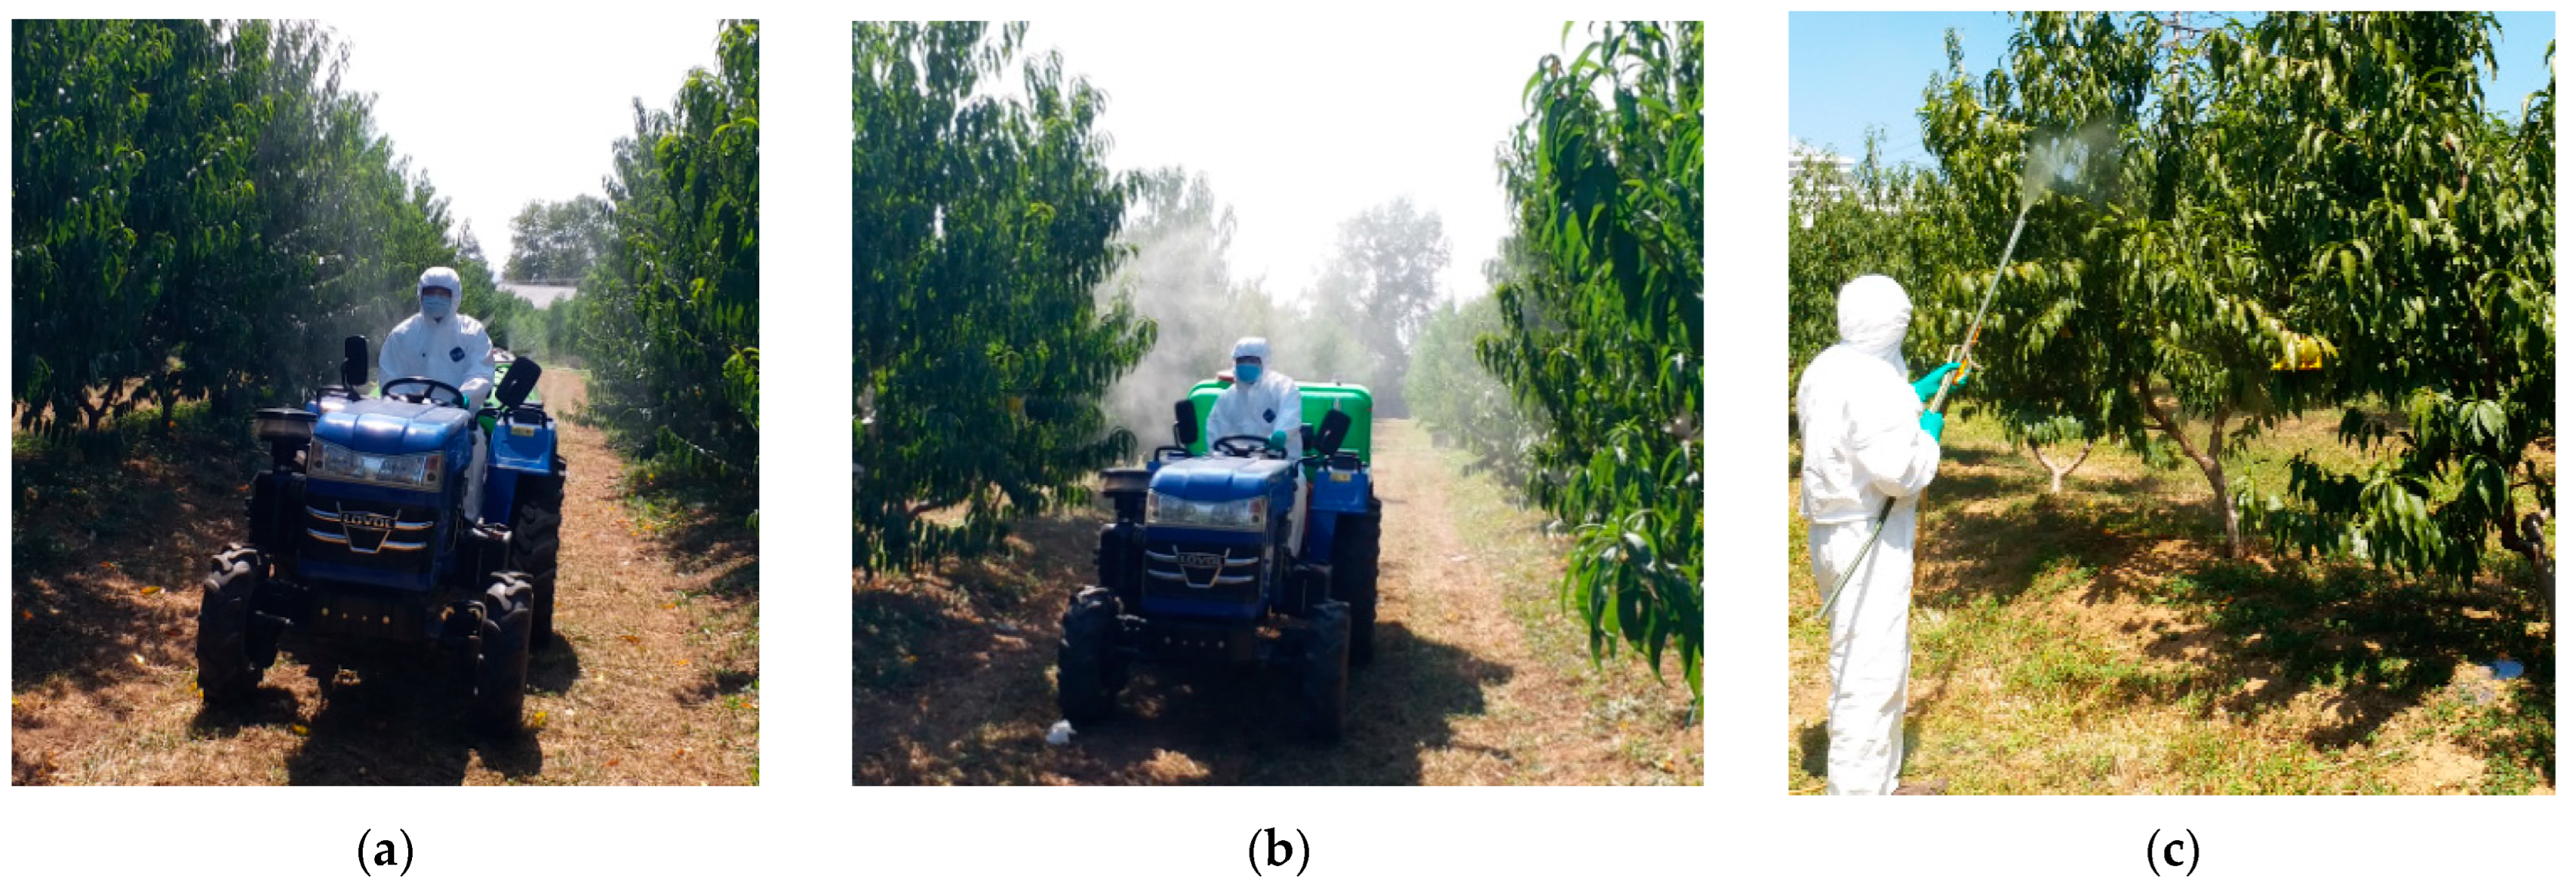
Before field application, the flow rate and travel speed of the three kinds of orchard sprayer were measured, and the preliminary field application parameters of each sprayer were determined. In each treatment, the fruit tree rows were sprayed from both sides, and the application distance was 100 m. All treatments were performed by well-trained pesticide applicators. Figure 2 shows pictures of the sprayers in the peach orchard.
During the test, the operating distance, duration and application volume of each sprayer were accurately recorded, and the actual operating parameters of each sprayer were calculated. The specific operating parameters of the sprayers in the field test are shown in Table 1.
2.2.2. Canopy Segmentation
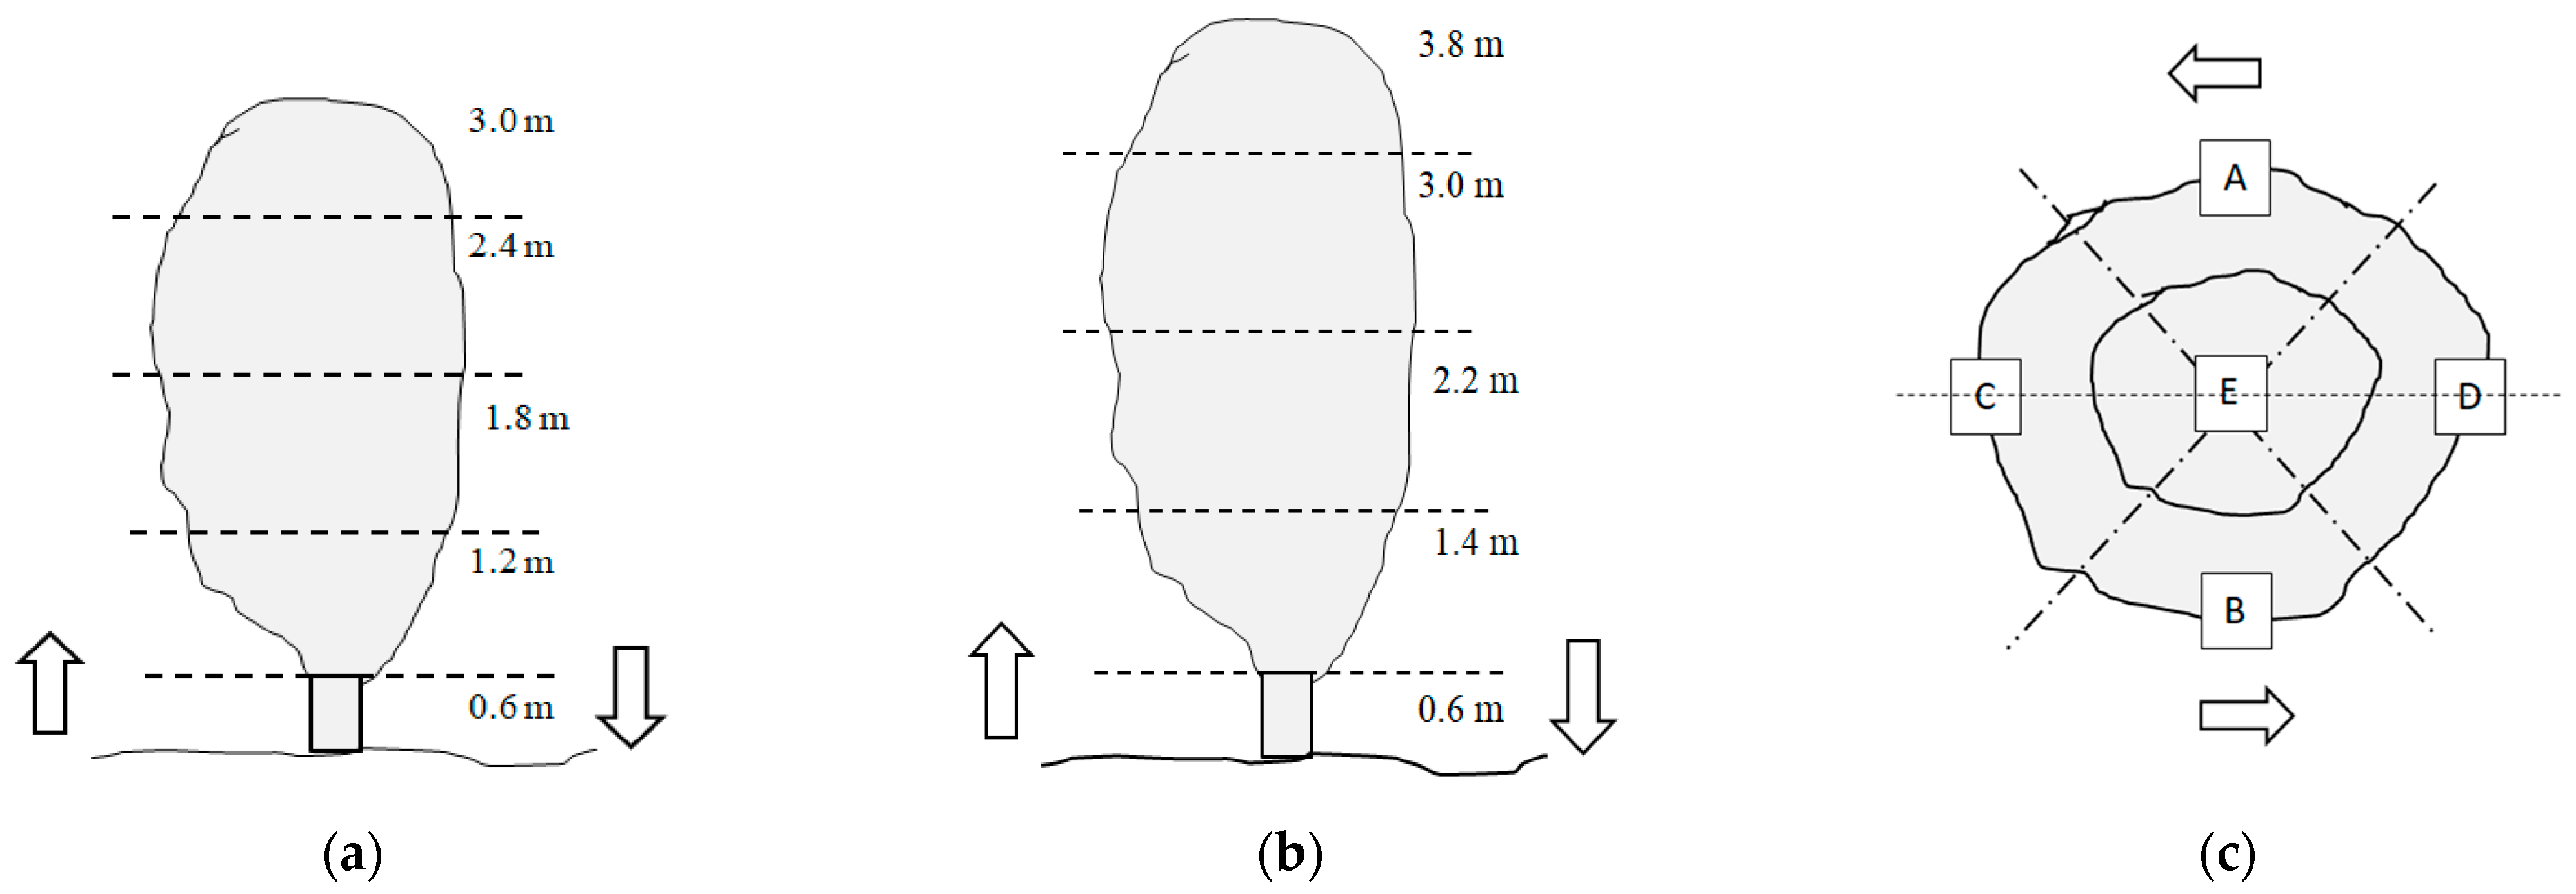
Before the test, three typical peach trees and pear trees were selected in order to perform canopy segmentation and obtain leaf density statistics. Considering the external features of the peach and pear canopies, each canopy was divided into the top, middle upper, middle lower, and bottom layers (Figure 3a,b). Each layer was divided into external and internal sides, where the external side contained four areas A, B, C and D, and the internal side was identified as area E (Figure 3c). Thus, the canopy of each fruit tree was divided into 20 areas. According to the schematic diagram of canopy division in Figure 3, the canopy of the fruit trees was segmented using metallic wire to build a frame, and the number of leaves in each frame-selected area was counted. The average number of leaves of the three fruit trees in each frame-selected area was taken as the number of leaves in the corresponding area.
2.2.3. Spray Liquid and Sample Collection
To quantify the deposition of spray liquid on peach and pear leaves, BSF fluorescence with a mass fraction of 0.1% was added to tap water as a tracer. Photo-degradation tests of BSF verified that the fluorescence degradation after 120 min of solar exposure was less than 3.1% [23]. After spraying, the peach and pear leaves in each canopy area were randomly collected and individually placed in labeled plastic zip-lock bags (140 × 200 × 0.05 mm3). To evaluate the droplet distribution and deposition of each sprayer, 5 fruit trees were selected from the application row as repetitions. Ten pieces of leaves were picked for each area of the segmented canopy and placed in a zip-lock bag. In this study, the deposition rate of the spray liquid was calculated based on the number of leaves, regardless of the area of a single leaf. Therefore, leaves of different sizes were randomly selected in each area to eliminate the influence of leaf area on the detection results. To reduce the photolysis of BSF, all of the leaf samples were collected within 1 h after application and then stored in the dark at −20 °C until analysis.
2.2.4. Meteorological Conditions
A portable meteorological station (WatchDog, Spectrum Technologies, Inc., Aurora, CO, USA) was used to measure the weather conditions during the field experiments, and the station was located upwind of the peach and pear orchards at a height of 2 m. The temperature, relative humidity, wind speed and wind direction were collected at 1 Hz and averaged across the period of each treatment. The wind direction was expressed as the angle between the wind and the forward direction of the sprayers. The meteorological conditions of the treatments are shown in Table 2.
2.3. Sample Processing and Calculation
2.3.1. Deposition on the Samples
A quantitative volume of deionized water was used to elute the collected leaves, and a fluorescence spectrometer (LS55, PerkinElmer Instruments, Waltham, MA, USA) was used to determine the amount of droplet deposition. In addition, the fluorescence value of each original spray liquid diluted 1000 times was also measured to calculate the volume of liquid on the samples. The deposition of the spray liquid was calculated using the following equation:
where : deposition on a single leaf, μL; : volume of eluent, mL; FLs: fluorescence value of eluent; FLa: fluorescence value of diluted liquid; n: number of leaves in sampling area; : dilution times of spray liquid.
2.3.2. Deposition Rates in Orchard
The deposition rate of the spray liquid of each sprayer was calculated according to the number of leaves in the sampling area, the applied volume in the treatment area, and the fruit tree density. The deposition volume for a single plant was calculated using Equation (2), and the effective deposition rate of the spray liquid was calculated using Equation (3).
where is the deposition of the spray liquid on a single tree, mL; is the deposition of the liquid in the i-th sampling area; and is the number of leaves in the i-th sampling area.
where R is the deposition rate of the spray liquid, %; is the unit area of the orchard, ha, m2; V0 is the total spraying volume of the unit area, L; is the row spacing, m; and is the spacing in the row, m.
3. Results
3.1. Leaf Density of Fruit Trees
Table 3 shows the number of leaves in the different areas of the peach tree canopy. Compared to other areas of the canopy, the top layer of the canopy has a smaller volume and the least number of leaves. The number of leaves in the external area of the top layer was about 500, which was slightly lower than the number of leaves in the upper middle, lower middle, and lower layers. The number of leaves in the internal area of the top canopy was only 223, which was significantly lower than the number of leaves in the upper middle, lower middle, and lower layers. The number of leaves in the internal region of the middle and upper layers was 705, which was significantly higher than the values of 459 and 400 found for the internal region of the middle lower and bottom layers, respectively. The numbers of leaves in the middle upper, middle lower and external regions of the bottom layer were not much different, but the numbers of leaves in the A and B regions of the same layer were higher than those in the C and D regions. This may be due to the fact that areas A and B were closer to the application row, and the orchard has a row spacing that was larger than its plant spacing in the row, so areas A and B have better light, ventilation and more room for growth.
Table 4 shows the numbers of leaves in the different areas of the pear canopy. The results were similar to the leaf distribution in the canopy of the peach trees. The top layer of the pear canopy was smaller in volume and had the lowest number of leaves, and the numbers of leaves in each area of the top layer were all less than 100. The numbers of leaves in the middle upper and the middle lower layers of the pear canopy were larger than those in the top and bottom layers. The number of leaves in the middle lower layer was the highest, with the four external regions (A, B, C, and D) of the canopy having about 300 leaves, while the number of leaves in the internal region reached up to 463. Compared with the middle upper and middle lower layers, the number of leaves in the bottom layer of the canopy was lower, being in the range of 133 to 201. In contrast to the distribution of leaves in the peach trees, the density of the pear branches was lower, thus having less negative effect on ventilation and light transmission; therefore, the numbers of leaves in areas A and B of the pear canopy were similar to those in areas C and D.
3.2. Liquid Distribution in the Canopy
Table 5 shows the deposition amount and average deposition of spray liquid in the peach canopy. The difference in the deposition amount of the liquid sprayed by the trailer sprayer in the four extenal areas of the top layer, the middle upper layer and the middle lower layer of the peach canopy is small. However, the deposition amounts of spray liquid in the internal area of the top layer and the middle lower layers were 2.09 μL and 2.02 μL, respectively, which were values significantly lower than that found for the external area of the corresponding layer. This might be caused by the occlusion of the peripheral blades. In the bottom layer of the peach trees, the deposition of the spray liquid in areas A and B was 6.07 μL and 5.11 μL, respectively, which was much larger than the 3.14 μL and 3.31 μL found for areas C and D. This is because the height of the spraying unit was similar to the height of the bottom layer of the tree canopy, and areas A and B of the bottom layer were closer to the operation row, increasing the adhesion probability of the spray liquid. In general, there was little difference between the deposition in each area of peach canopy and the average deposition in the whole canopy, and the deposition of the spray liquid applied by the trailer sprayer in the peach canopy was relatively uniform.
The deposition amount of the liquid spray when using the mounted sprayer showed a downward trend with increasing canopy height. Taking area A as an example, the deposition amounts of the spray liquid in the bottom, middle lower, middle upper and top layers of the peach canopy were 8.38, 7.49, 6.15 and 3.17 μL, respectively. Due to the lower air speed of the mounted orchard air-assisted sprayer, the deposition amounts of the spray solution in areas A and B were greater than those in areas C and D in the same layer of the peach canopy. Compared with the deposition amounts on the external areas, the deposition amounts of the liquid in the internal areas of the the canopy were lower, and the deposition amounts in the top, middle upper, middle lower and bottom layers were 0.45, 1.14, 0.36 and 1.56 μL, respectively, all of which were much lower than the average deposition of 3.21 μL.
Since the application volume of the spray gun is much greater than those of the trailer sprayer and the mounted sprayer, the average deposition of the spray gun throughout the whole peach canopy was 61.24 μL, which was also much higher than those of the other two sprayers. Meanwhile, the adhesive capacity of droplets applied using the high-volume spray gun exceeded the maximum retention of the leaves, causing a large amount of spray liquid runoff from the leaves of the fruit trees. Therefore, the deposition amount of the spray gun sprayed in different areas of the peach canopy was relatively uniform, and the deposition amounts of the liquid were greater than 50 μL in almost all areas. The differences in the deposition amounts in each area of the peach canopy when using spray gun application were mainly determined on the basis of leaf inclination and density in the area.
Table 6 shows the deposition amounts and the average deposition of spray liquids in the pear canopy. Since the leaf area of pear trees is larger than that of peach trees, the deposition amounts of the three sprayers on single pear leaves were greater than those on peach leaves. The deposition and distribution trends of liquids applied using the three sprayers in the pear canopy were similar to those in the peach canopy. Relatively speaking, the deposition amount of spray liquid applied by the trailer sprayer was lower in the top layer of the canopy, but the differences in the deposition amount of liquid between each of the layers were small. The deposition amounts of the liquid sprayed by the trailer sprayer in the internal areas of the pear canopy were the lowest, and the deposition amounts in the top, middle upper, middle lower and bottom layers of the pear canopy were 29.07, 28.91, 43.02 and 43.22 μL, respectively. All of these values were lower than the average deposition of 52.65 μL found throughout the whole canopy.
Similar to the deposition results on peach trees, the deposition amount of liquid applied using the mounted sprayer in the pear canopy also decreased with increasing canopy height. The highest deposition of liquid was found in the bottom layer, and the lowest deposition of liquid was found in the top layer. The liquid applied using mounted sprayer was relatively uniformly deposited in the bottom areas of the pear canopy, while the liquid in the other three layers was mainly deposited in the external areas. The deposition amounts of spray liquid in the internal regions of the top, middle upper, and middle lower layers were 0.60, 3.11, and 10.57 μL, respectively, which were significantly lower values than the average canopy deposition volume of 17.32 μL. The spray gun had the highest deposition amount of liquid in the pear canopy, and the deposition amount of the spray gun sprayed in different areas of the pear canopy was relatively uniform.
3.3. Deposition Rate and Variable Coefficient
Table 7 shows the deposition rates and coefficients of variation of spray liquid in the peach and pear canopies. The results showed that the deposition rate of the spray liquid applied using the trailer sprayer was the highest, with the deposition rate of liquid in peach and pear canopies being 31.54% and 56.92%, respectively. The deposition rates of liquid applied using the mounted sprayer in the peach and pear canopies were 21.75% and 40.61%, respectively. The deposition rates of liquid applied using the hand-held spray gun in the peach and pear canopies were relatively close, with the deposition rates of the pesticide solution being 25.19% and 29.97%, respectively.
The uniformity of spray droplet distribution on the targets is commonly described by the coefficient of variation (CV) [24]. The lower the CV is, the better the uniformity of droplet distribution [25]. The spray gun with high volume spray had the best droplet distribution uniformity, and the CVs of the spray on peach and pear trees were 20.54% and 25.06%, respectively. The uniformity of the liquid distribution of the trailer sprayer was second, where the CVs of the spray liquid deposited on the peach and pear trees were 35.98% and 26.54%, respectively. The mounted sprayer had the worst performance in terms of the deposition and distribution of the liquid, with the CVs of the liquid deposited on the peach and pear trees being 92.52% and 94.90%, respectively.
4. Discussion
Pesticide application aims at depositing the highest possible amount of the active ingredient onto the target surface [26]. The performance of the sprayer, the meteorological conditions, the structure of the plant canopy, and the surface properties of the leaves all have an impact on this during the deposition of the pesticide solution from the nozzle to the surface of the leaves [27,28,29,30]. The orchards have the characteristics of continuous planting, large canopies, and dense foliage. To improve the penetration of the spray liquid, air-assisted sprayers are used to apply pesticides in orchards [16].
In this study, the assisted air speed of the trailer sprayer was higher than that of the mounted sprayer and the non-air-assisted spray gun, and its delivery performance was better for droplets, ensuring that more droplets were deposited on the target canopy and penetrated into the interior of the canopy. However, the assisted air speed of the mounted orchard sprayer was relatively lower, and its ability to transport droplets to the target canopy was weak, resulting in a large number of droplets being deposited under the canopy or in the operation row during the spraying process. Therefore, the deposition rate of spray liquid obtained when using the trailer sprayer was the highest, with a deposition rate on peach trees that was 1.45 times and 1.40 times those of the mounted sprayer and the hand-held spray gun, respectively. Similarly, the deposition rate of the trailer sprayer on pear trees was 1.40 times and 1.90 times those obtained using the mounted sprayer and the hand-held spray gun, respectively.
The leaf area index and canopy volume of fruit trees also have a significant effect on the deposition rate of spraying solution [16,31]. The peach trees selected in this experiment had a maximum width of 2.0 m, a plant height of 3.0 m, and a leaf area index of 1.18. The maximum width of the pear trees was 2.5 m, the plant height was 3.8 m, and the leaf area index was 1.43, which were all larger than the values obtained of the peach trees. Therefore, compared to the deposition rate of spraying solution on peach trees, the deposition rate of liquid sprayed using the trailer sprayer and the mounted sprayer on pear trees increased by about 20%. However, the deposition rates of the high volume applied using the hand-held spray gun on the two fruit trees only increased by about 5%.
Hand-held spray guns are used for spraying without air assistance. Its operation efficiency is low, the amount of runoff liquid is large, and the risk of the operator’s exposure to pesticide is greatly increased [21]. Michael et al. [31] assessed the deposition on leaves and the losses to the ground for four different spraying treatments in trellis and goblet viticulture. The high-volume sprayer exhibited in the highest normalized deposit on the ground, suggesting that runoff is excessive compared to the other types of sprayers. Compared with hand-held spray gun, the air-assisted sprayers were highly efficient, showing the potential for replacing high-volume pesticide sprayings with low-volume applications. However, motorized air-assisted sprayers are not able to meet the requirements of mountainous orchards and non-standardized orchards. Therefore, hand-held spray guns are still the optimal choice for pesticide application in these areas.
In addition to the deposition rate of the pesticide solution, the uniformity of the liquid distribution in the canopy is another important indicator for evaluating the performance of spraying, and is of great significance for optimizing the spray parameters of equipment and improving the utilization rate of the chemical solution [32]. The airflow generated by air-assisted orchard sprayers is able to toss the branches and leaves of the fruit tree canopy, so that the droplets entrained by the airflow penetrate into the target, thereby greatly increasing the penetration of the droplets [33]. Compared with the trailer air-assisted sprayer, the weaker air speed of the mounted air-assisted sprayer resulted in a greater concentration of the spray liquid on the external and lower areas of the fruit tree canopy. Therefore, the CVs of the deposition amount of the spray liquid in the peach and pear canopy were 92.52% and 94.90%, respectively. The trailer air-assisted sprayer was able to blow the droplets to various areas of the fruit tree canopy, so the CVs of pesticide solution deposition in the peach and pear canopies were 35.98% and 26.54%, respectively, values which were much lower than the CVs of the mounted sprayer. It is worth mentioning that when the airflow of the air-assisted orchard sprayer is too weak, this will lead to deficient deposition in the canopies of fruit trees, while excessive airflow will result in the droplets being blown through the canopy, resulting in pesticide runoff and environmental pollution [3,30]. Therefore, in order to ensure the spraying performance of the air-assisted orchard sprayer, research should be carried out on airflow demand in the context of fruit tree canopies, and the air supply rate of sprayers should be regulated accordingly.
Admittedly, a great deal of time was consumed by counting the number of leaves in different areas of the fruit tree canopies. To study the distribution of the droplet penetration rate inside the tree canopy during air-assisted spraying, Sun et al. [34] chose cube-shaped frames to divide the canopy area of the fruit trees, and counted the number of leaves in each frame area. This method for the determination of the statistics of leaves in the fruit tree canopy also consumes a lot of time. At present, the most widely used target detection methods for fruit tree canopies are mainly aimed at calculating the outline and volume of the fruit tree [35,36,37,38]. Therefore, research on the density of branches and leaves in fruit tree canopies should be carried out to improve the efficiency of fruit tree canopy information extraction.
The quantitative indicators of the density of branches and leaves in the canopy of fruit trees include the leaf area index, leaf area density, point quadrat analysis and biomass density. Zhang et al. [39] developed a calculation method for leaf area density based on a three-dimensional laser point cloud, which provided a function relationship between the leaf number and the laser point. Sanz-Cortiella et al. [40] used the SICK LMS200 two-dimensional LiDAR sensor to scan the fruit tree canopy bilaterally, and obtained a three-dimensional structure map of the canopy. In addition, the linear relationship equation between the number of laser point clouds falling on the canopy branches and the leaf area was determined using statistical methods. Sanz et al. [41] found a linear relationship between the canopy leaf area density and the logarithm of the canopy volume based on the statistical results of the orchard test data and established a mathematical equation between the leaf area density and the canopy volume. The above studies could provide reference for the determination of fruit tree canopy information when determining the utilization rate of new orchard spray liquids.
5. Conclusions
To evaluate spraying efficacy in orchards, a canopy segmentation method was developed to determine the deposition rate and droplet distribution in orchard application. The distribution and deposition rate of spray liquid applied using three kinds of orchard sprayer were measured in a pear orchard and a peach orchard. The test results showed that the trailer sprayer had the highest deposition rates, with values of 31.54% and 56.92% on peach and pear trees, respectively. The spray gun had the best droplet distribution uniformity, and the CVs of the spray in the peach and pear canopies were 20.54% and 25.06%, respectively. Nevertheless, a great deal of time was consumed in counting the number of leaves in the different areas of the fruit tree canopies. Therefore, research on the density of branches and leaves in fruit tree canopies should be carried out to improve the efficiency of fruit tree canopy information extraction.
Author Contributions
S.W. (Shilin Wang), X.L. (Xue Li) and S.W. (Shuangshuang Wang) conceived the research idea and designed the experiments; S.W. (Shilin Wang), W.W. and X.L. (Xiaohui Lei) performed the experiments and analyzed the data; S.W. (Shilin Wang) and X.L. (Xue Li) wrote the paper; X.L. (Xue Li) and T.N. reviewed and revised the paper. All authors have read and agreed to the published version of the manuscript.
Funding
This research was funded by the Natural Science Foundation of Jiangsu Province (BK20200280) and the China Postdoctoral Science Foundation (2020M671390).
Institutional Review Board Statement
Not applicable.
Informed Consent Statement
Not applicable.
Data Availability Statement
The data presented in this study are available on request from the corresponding author.
Acknowledgments
The authors would like to give special thanks to the staff of Yejia pear orchard Co., Ltd. (Taizhou, China) and department of experiment station of JAAS for providing trial fields and operating sprayers.
Conflicts of Interest
The authors declare no conflict of interest.
References
- Yearbook, C.S. National Bureau of Statistics of China; China Statistical Yearbook: Beijing, China, 2018.
- Li, L. Research on Design and Application of Automatic Profiling Precision Variable-Rate Orchard Sprayer Based on LIDAR Detection. Doctor’s Thesis, China Agricultural University, Beijing, China, 2018. [Google Scholar]
- Jensen, P.K.; Olesen, M.H. Spray mass balance in pesticide application: A review. Crop Prot. 2014, 61, 23–31. [Google Scholar] [CrossRef]
- He, X.; Yan, K.; Chu, J.; Wang, J.; Zeng, A.; Liu, Y. Design and Testing of the Automatic Target Detecting, Electrostatic, Air assisted, Orchard sprayer. Trans. Chin. Soc. Agric. Eng. 2003, 19, 78–80. [Google Scholar]
- Sinha, R.; Ranjan, R.; Khot, L.R.; Hoheisel, G.-A.; Grieshop, M.J. Comparison of within canopy deposition for a solid set canopy delivery system (SSCDS) and an axial–fan airblast sprayer in a vineyard. Crop. Prot. 2020, 132, 105124. [Google Scholar] [CrossRef]
- Ministry of Agriculture and Rural Affaies. China’s Pesticide Fertilizer Utilization Rate of about 30% to Be Improved [EB/OL]. Available online: http://politics.people.com.cn/n/2015/0414/c1001-26843054.html (accessed on 14 April 2015).
- Pivato, A.; Barausse, A.; Zecchinato, F.; Palmeri, L.; Raga, R.; Lavagnolo, M.C.; Cossu, R. An integrated model-based approach to the risk assessment of pesticide drift from vineyards. Atmos. Environ. 2015, 111, 136–150. [Google Scholar] [CrossRef]
- Lammoglia, S.-K.; Kennedy, M.C.; Barriuso, E.; Alletto, L.; Justes, E.; Munier-Jolain, N.; Mamy, L. Assessing human health risks from pesticide use in conventional and innovative cropping systems with the BROWSE model. Environ. Int. 2017, 105, 66–78. [Google Scholar] [CrossRef] [PubMed]
- Yang, L.Z.; Feng, Y.F.; Shi, W.M.; Xue, L.H.; Wang, S.Q.; Song, X.F.; Chang, Z.Z. Review of the advances and development trends in agricultural non-point source pollution control in China. Chin. J. Eco-Agric. 2013, 21, 96–101. [Google Scholar] [CrossRef]
- Cui, Y.Z.; Gao, Y.; Zhao, G.S. Progress of differentiated ecological compensation policies related to agricultural non-point source pollution. J. Agro-Environ. Sci. 2017, 36, 1232–1241. [Google Scholar] [CrossRef]
- Yuan, H.; Yang, D.; Yan, X. Pesticide efficiency and the way to optimize the spray application. Plant. Prot. 2011, 37, 14–20. [Google Scholar] [CrossRef]
- Gu, Z.; Xu, G.; Xu, D. Analysis of pesticide efficiency of insecticides against brown planthopper, Nilaparvata lugens Stal. Chin. J. Pestic. Sci. 2018, 20, 704–714. [Google Scholar] [CrossRef]
- Ebert, T.A.; Downer, R.A. A different look at experiments on pesticide distribution. Crop. Prot. 2006, 25, 299–309. [Google Scholar] [CrossRef]
- Gao, S.; Wang, G.; Zhou, Y.Y.; Wang, M.; Yang, D.; Yuan, H.; Yan, X. Water-soluble food dye of Allura Red as a tracer to determine the spray deposition of pesticide on target crops. Pest Manag. Sci. 2019, 75, 2592–2597. [Google Scholar] [CrossRef] [PubMed]
- Wang, S.; Li, X.; Liu, Y.; Lv, X.; Zheng, W. Comparison of a new knapsack mist sprayer and three traditional sprayers for pesticide application in plastic tunnel greenhouse. Phytoparasitica 2021, 50, 177–190. [Google Scholar] [CrossRef]
- Vercruysse, F.; Steurbaut, W.; Drieghe, S.; Dejonckheere, W. Off target ground deposits from spraying a semi-dwarf orchard. Crop. Prot. 1999, 18, 565–570. [Google Scholar] [CrossRef]
- Zhang, P.; Gao, Y.; Liu, Z.; Zhao, J.; Yang, J.; Fan, J.; Fan, R. Method for calculation of pesticide deposition rate using spraying machinery in the orchard. Chin. J. Pestic. Sci. 2020, 22, 277–284. [Google Scholar] [CrossRef]
- Hoffmann, W.C.; Hewitt, A.J. Comparison of three imaging systems for water-sensitive papers. Appl. Eng. Agric. 2005, 21, 961–964. [Google Scholar] [CrossRef]
- Hong, S.-W.; Zhao, L.; Zhu, H. CFD simulation of pesticide spray from air-assisted sprayers in an apple orchard: Tree deposition and off-target losses. Atmos. Environ. 2018, 175, 109–119. [Google Scholar] [CrossRef]
- Wang, P.; Yu, W.; Ou, M.; Gong, C.; Jia, W. Monitoring of the Pesticide Droplet Deposition with a Novel Capacitance Sensor. Sensors 2019, 19, 537. [Google Scholar] [CrossRef] [Green Version]
- Wang, S.; Fan, D.; Li, X.; Zhou, H.; Zhang, M.; Yan, T.; Lv, X. Effect of Orchard Sprayers on Dermal Exposure of Operators. J. Ecol. R. Environ. 2020, 36, 1612–1618. [Google Scholar] [CrossRef]
- He, X. Yaoxie Yu Shiyao Jishu, 1st ed.; China Agricultural University Press: Bejing, China, 2013; pp. 167–172. [Google Scholar]
- You, K.; Zhu, H.; Abbott, J.P. Assessment of Fluorescent Dye Brilliant Sulfaflavine Deposition on Stainless Steel Screens as Spray Droplet Collectors. Trans. ASABE 2019, 62, 495–503. [Google Scholar] [CrossRef]
- Qin, W.-C.; Qiu, B.-J.; Xue, X.-Y.; Chen, C.; Xu, Z.-F.; Zhou, Q.-Q. Droplet deposition and control effect of insecticides sprayed with an unmanned aerial vehicle against plant hoppers. Crop. Prot. 2016, 85, 79–88. [Google Scholar] [CrossRef]
- Smith, D.B. Uniformity and Recovery of Broadcast Sprays Using Fan Nozzles. Trans. ASAE 1992, 35, 39–44. [Google Scholar] [CrossRef]
- Matthews, G.; Bateman, R.; Miller, P. Pesticide Application Methods, 4th ed.; Wiley & Blackwell: Hoboken, NJ, USA, 2014. [Google Scholar]
- Delele, M.A.; Nuyttens, D.; Duga, A.T.; Ambaw, A.; Lebeau, F.; Nicolai, B.M.; Verboven, P. Predicting the dynamic impact behaviour of spray droplets on flat plant surfaces. Soft Matter 2016, 12, 7195–7211. [Google Scholar] [CrossRef] [PubMed] [Green Version]
- Li, L.; He, X.; Song, J.; Liu, Y.; Zeng, A.; Liu, Y.; Liu, C.; Liu, Z. Design and experiment of variable rate orchard sprayer based on laser scanning sensor. Int. J. Agric. Biol. Eng. 2018, 11, 101–108. [Google Scholar] [CrossRef] [Green Version]
- Li, H.; Zhai, C.; Weckler, P.; Wang, N.; Yang, S.; Zhang, B. A Canopy Density Model for Planar Orchard Target Detection Based on Ultrasonic Sensors. Sensors 2016, 17, 31. [Google Scholar] [CrossRef] [PubMed] [Green Version]
- Zhai, C.; Zhu, R.; Sui, S.; Xue, S.; Shangguan, Z. Design and experiment of control system of variable pesticide application machine hauled by tractor. Trans. Chin. Soc. Agric. Eng. 2009, 25, 105–109. [Google Scholar] [CrossRef]
- Michael, C.; Gil, E.; Gallart, M.; Stavrinides, M. Influence of Spray Technology and Application Rate on Leaf Deposit and Ground Losses in Mountain Viticulture. Agriculture 2020, 10, 615. [Google Scholar] [CrossRef]
- Sun, C.; Qiu, W.; Ding, W.; Gu, J. Parameter optimization and experiment of air-assisted spraying on pear trees. Trans. Chin. Soc. Agric. Eng. 2015, 31, 30–38. [Google Scholar] [CrossRef]
- Wiles, T.L.; Sharp, D.G.; Dobson, H. Guidelines on Minimum Requirements for Agricultural Pesticide Application Equipment; Food & Agriculture Org.: Rome, Italy, 2004; Volume 4. [Google Scholar]
- Sun, C.; Liu, C. Construction and application of droplet canopy penetration model for air-assisted spraying pattern. Trans. Chin. Soc. Agric. Eng. 2019, 35, 25–32. [Google Scholar] [CrossRef]
- Miranda-Fuentes, A.; Llorens, J.; Gamarra-Diezma, J.L.; Gil-Ribes, J.A.; Gil Moya, E. Towards an Optimized Method of Olive Tree Crown Volume Measurement. Sensors 2015, 15, 3671–3687. [Google Scholar] [CrossRef] [Green Version]
- Liu, H.; Zhu, H. Evaluation of a Laser Scanning Sensor in Detection of Complex-Shaped Targets for Variable-Rate Sprayer Development. Trans. ASABE 2016, 59, 1181–1192. [Google Scholar] [CrossRef]
- Gil, E.; Escolà, A.; Rosell-Polo, J.R.; Planas, S.; Val, L. Variable rate application of plant protection products in vineyard using ultrasonic sensors. Crop. Prot. 2007, 26, 1287–1297. [Google Scholar] [CrossRef] [Green Version]
- Maghsoudi, H.; Minaei, S.; Ghobadian, B.; Masoudi, H. Ultrasonic sensing of pistachio canopy for low-volume precision spraying. Comput. Electron. Agric. 2015, 112, 149–160. [Google Scholar] [CrossRef]
- Tao, Q.; Xin, S.; Yan, L.; Xu, H. Cavitation Process and Flow Characteristics inside Diesel Injector Nozzle. Trans. Chin. Soc. Agric. Mach. 2016, 47, 359–365. [Google Scholar] [CrossRef]
- Sanz-Cortiella, R.; Llorens-Calveras, J.; Escolà, A.; Arnó-Satorra, J.; Ribes-Dasi, M.; Masip-Vilalta, J.; Camp, F.; Gràcia-Aguilá, F.; Solanelles-Batlle, F.; Planas-DeMartí, S.; et al. Innovative LIDAR 3D dynamic measurement system to estimate fruit-tree leaf area. Sensors 2011, 11, 5769–5791. [Google Scholar] [CrossRef] [PubMed]
- Sanz, R.; Rosell, J.; Llorens, J.; Gil, E.; Planas, S. Relationship between tree row LIDAR-volume and leaf area density for fruit orchards and vineyards obtained with a LIDAR 3D Dynamic Measurement System. Agric. For. Meteorol. 2013, 171–172, 153–162. [Google Scholar] [CrossRef] [Green Version]
Figure 1.
Orchard sprayers used for pesticide application. (a) 3WQF-1000 trailer air-assisted sprayer, (b) 3WG-500 mounted air-assisted sprayer, (c) handheld spray gun.
Figure 1.
Orchard sprayers used for pesticide application. (a) 3WQF-1000 trailer air-assisted sprayer, (b) 3WG-500 mounted air-assisted sprayer, (c) handheld spray gun.

Figure 2.
Photos of the sprayers in the peach orchard during the experiment. (a) Trailer air-assisted orchard sprayer, (b) mounted air-assisted orchard sprayer, (c) orchard spray gun.
Figure 2.
Photos of the sprayers in the peach orchard during the experiment. (a) Trailer air-assisted orchard sprayer, (b) mounted air-assisted orchard sprayer, (c) orchard spray gun.

Figure 3.
Schematic diagram of fruit tree canopy segmentation. (a) Height division of the peach canopy, (b) height division of the pear canopy, (c) horizontal division of the canopy.
Figure 3.
Schematic diagram of fruit tree canopy segmentation. (a) Height division of the peach canopy, (b) height division of the pear canopy, (c) horizontal division of the canopy.


Table 1.
Operating parameters of the sprayers in the field test.
| Spraying Parameters of Sprayer | Peach Orchard | Pear Orchard | ||||
|---|---|---|---|---|---|---|
| Trailer Sprayer | Mounted Sprayer | Spray Gun | Trailer Sprayer | Mounted Sprayer | Spray Gun | |
| Forward velocity/(m·s−1) | 1.14 | 1.20 | - | 1.04 | 1.07 | - |
| Flow rate/(L·min−1) | 4.96 | 6.30 | 6.25 | 11.28 | 5.49 | 6.83 |
| Application volume/(L·ha−1) | 180 | 220 | 3220 | 360 | 165 | 1920 |
Table 2.
Meteorological conditions during spraying in the field test.
| Meteorological Parameter | Peach Orchard | Pear Orchard | ||||
|---|---|---|---|---|---|---|
| Trailer Sprayer | Mounted Sprayer | Spray Gun | Trailer Sprayer | Mounted Sprayer | Spray Gun | |
| Relative humidity (%) | 47.5 | 43.7 | 42.6 | 73.8 | 65.9 | 54.8 |
| Temperature (°C) | 29.7 | 30.9 | 31.6 | 27.1 | 27.3 | 30.9 |
| Mean wind velocity (m·s−1) | 1.23 | 1.16 | 1.37 | 0.81 | 0.84 | 0.93 |
| Wind direction (°) | 110.3 | 112.3 | 111.7 | 18.75 | 11.56 | 3.83 |
Table 3.
The numbers of leaves in different areas of the peach canopy.
| Layer of Canopy | A | B | C | D | E |
|---|---|---|---|---|---|
| Top | 512 | 465 | 485 | 442 | 223 |
| Middle upper | 655 | 711 | 440 | 434 | 705 |
| Middle lower | 754 | 682 | 561 | 442 | 459 |
| Bottom | 702 | 668 | 455 | 406 | 400 |
Table 4.
The numbers of leaves in the different areas of the pear canopy.
| Layer of Canopy | A | B | C | D | E |
|---|---|---|---|---|---|
| Top | 65 | 74 | 70 | 61 | 82 |
| Middle upper | 179 | 195 | 165 | 150 | 239 |
| Middle lower | 280 | 326 | 301 | 264 | 463 |
| Bottom | 181 | 133 | 152 | 201 | 164 |
Table 5.
Deposition amount (μL) and average deposition (μL) of spray liquids in the peach canopy.
| Area of Canopy | Trailer Sprayer | Mounted Sprayer | Spray Gun | |
|---|---|---|---|---|
| Top | A | 3.86 ± 1.03 | 3.17 ± 2.38 | 49.10 ± 2.54 |
| B | 3.74 ± 0.13 | 2.67 ± 2.09 | 73.60 ± 3.69 | |
| C | 3.14 ± 0.59 | 0.34 ± 0.22 | 59.05 ± 13.15 | |
| D | 2.50 ± 0.82 | 1.27 ± 0.61 | 66.73 ± 0.91 | |
| E | 2.09 ± 0.27 | 0.45 ± 0.38 | 53.49 ± 16.26 | |
| Middle upper | A | 5.98 ± 1.60 | 6.15 ± 1.69 | 55.58 ± 5.57 |
| B | 4.73 ± 1.61 | 5.63 ± 2.78 | 68.26 ± 16.18 | |
| C | 5.56 ± 2.17 | 0.88 ± 0.58 | 62.63 ± 10.82 | |
| D | 5.15 ± 1.75 | 1.91 ± 1.36 | 68.71 ± 5.65 | |
| E | 4.56 ± 1.31 | 1.14 ± 0.92 | 59.00 ± 11.67 | |
| Middle lower | A | 4.65 ± 0.73 | 7.49 ± 5.26 | 65.67 ± 24.01 |
| B | 4.53 ± 1.10 | 4.59 ± 3.09 | 67.34 ± 11.94 | |
| C | 3.92 ± 0.81 | 1.45 ± 1.02 | 65.01 ± 19.08 | |
| D | 4.24 ± 0.44 | 4.20 ± 2.05 | 70.65 ± 3.42 | |
| E | 2.02 ± 0.76 | 0.36 ± 0.24 | 58.63 ± 12.80 | |
| Bottom | A | 6.07 ± 1.18 | 8.38 ± 2.21 | 49.98 ± 3.64 |
| B | 5.11 ± 1.13 | 4.21 ± 2.77 | 55.40 ± 19.05 | |
| C | 3.14 ± 0.88 | 4.14 ± 2.49 | 48.00 ± 13.07 | |
| D | 3.31 ± 0.31 | 4.20 ± 2.73 | 68.83 ± 4.12 | |
| E | 3.46 ± 0.90 | 1.56 ± 1.18 | 59.12 ± 13.32 | |
| Average deposition | 4.09 | 3.21 | 61.24 | |
Table 6.
Deposition amount (μL) and average deposition (μL) of spray liquids in pear canopy.
| Area of Canopy | Trailer Sprayer | Mounted Sprayer | Spray Gun | |
|---|---|---|---|---|
| Top | A | 59.03 ± 4.55 | 12.24 ± 4.41 | 176.75 ± 28.66 |
| B | 44.41 ± 15.32 | 1.20 ± 0.58 | 141.77 ± 22.80 | |
| C | 49.60 ± 11.60 | 0.68 ± 0.24 | 144.82 ± 76.52 | |
| D | 47.14 ± 0.92 | 2.08 ± 1.77 | 200.17 ± 29.48 | |
| E | 29.07 ± 2.02 | 0.60 ± 0.28 | 161.21 ± 13.99 | |
| Middle upper | A | 81.52 ± 15.12 | 39.23 ± 12.74 | 170.14 ± 30.32 |
| B | 77.06 ± 18.29 | 3.47 ± 3.35 | 209.66 ± 13.21 | |
| C | 55.79 ± 8.28 | 5.50 ± 5.22 | 147.32 ± 71.69 | |
| D | 61.28 ± 1.36 | 10.94 ± 11.67 | 251.93 ± 53.22 | |
| E | 28.91 ± 7.40 | 3.11 ± 3.36 | 129.31 ± 23.51 | |
| Middle lower | A | 71.29 ± 15.13 | 25.40 ± 8.08 | 126.10 ± 48.10 |
| B | 57.21 ± 13.97 | 5.09 ± 3.68 | 168.17± 73.50 | |
| C | 47.38 ± 8.79 | 11.47 ± 6.25 | 122.91 ± 64.15 | |
| D | 50.18 ± 3.74 | 18.69 ± 11.76 | 183.85 ± 8.33 | |
| E | 43.02 ± 7.33 | 10.57 ± 7.04 | 128.74 ± 54.17 | |
| Bottom | A | 70.35 ± 24.00 | 41.00 ± 20.93 | 140.94 ± 29.82 |
| B | 60.76 ± 10.64 | 41.57 ± 23.29 | 162.38 ± 26.48 | |
| C | 57.22 ± 3.32 | 28.29 ± 4.87 | 76.53 ± 13.70 | |
| D | 57.20 ± 11.16 | 50.90 ± 10.74 | 189.40 ± 29.39 | |
| E | 43.22 ± 11.75 | 32.80 ± 13.26 | 130.54 ± 31.39 | |
| Average deposition | 52.65 | 17.32 | 152.42 | |
Table 7.
Deposition rates (%) and coefficients of variation (%) of spray liquid in the peach and pear canopies.
Table 7.
Deposition rates (%) and coefficients of variation (%) of spray liquid in the peach and pear canopies.
| Sprayer | Peach Orchard | Pear Orchard | ||
|---|---|---|---|---|
| CV of Deposition | Deposition Rate | CV of Deposition | Deposition Rate | |
| Trailer sprayer | 35.98 | 31.54 | 26.54 | 56.92 |
| Mounted sprayer | 92.52 | 21.75 | 94.90 | 40.61 |
| Spray gun | 20.54 | 25.19 | 25.06 | 29.97 |
Publisher’s Note: MDPI stays neutral with regard to jurisdictional claims in published maps and institutional affiliations. |
© 2022 by the authors. Licensee MDPI, Basel, Switzerland. This article is an open access article distributed under the terms and conditions of the Creative Commons Attribution (CC BY) license (https://creativecommons.org/licenses/by/4.0/).
Share and Cite
MDPI and ACS Style
Wang, S.; Wang, W.; Lei, X.; Wang, S.; Li, X.; Norton, T. Canopy Segmentation Method for Determining the Spray Deposition Rate in Orchards. Agronomy 2022, 12, 1195. https://0-doi-org.brum.beds.ac.uk/10.3390/agronomy12051195
AMA Style
Wang S, Wang W, Lei X, Wang S, Li X, Norton T. Canopy Segmentation Method for Determining the Spray Deposition Rate in Orchards. Agronomy. 2022; 12(5):1195. https://0-doi-org.brum.beds.ac.uk/10.3390/agronomy12051195
Chicago/Turabian StyleWang, Shilin, Wei Wang, Xiaohui Lei, Shuangshuang Wang, Xue Li, and Tomas Norton. 2022. "Canopy Segmentation Method for Determining the Spray Deposition Rate in Orchards" Agronomy 12, no. 5: 1195. https://0-doi-org.brum.beds.ac.uk/10.3390/agronomy12051195
Note that from the first issue of 2016, this journal uses article numbers instead of page numbers. See further details here.