
Fecundity Allocation in Some European Weed Species Competing with Crops


1
Department of Invertebrate Pests and Weeds in Forestry, Agriculture and Horticulture, Division of Biotechnology and Plant Health, Norwegian Institute of Bioeconomy Research (NIBIO), Høgskoleveien 7, 1433 Ås, Norway
2
Department of Plant and Environmental Sciences, Faculty of Science, University of Copenhagen, Hoejbakkegaard Allé 13, 2630 Taastrup, Denmark
*
Author to whom correspondence should be addressed.
Agronomy 2022, 12(5), 1196; https://0-doi-org.brum.beds.ac.uk/10.3390/agronomy12051196
Submission received: 30 March 2022
/
Revised: 12 May 2022
/
Accepted: 12 May 2022
/
Published: 16 May 2022
(This article belongs to the Special Issue Weed Population Dynamics)
Abstract
:Seed production is an important element of weed population dynamics, and weed persistence relies upon the soil seed bank. In 2017 and 2018, we studied the relationship between the aboveground dry biomass of common weed species and their seed production. Weeds were selected randomly in the fields, and we surrounded the plants with a porous net to collect shed seeds during the growth season. Just before crop harvest, weeds were harvested, the plants’ dry weights were measured, and the number of seeds retained on the weeds was counted. A linear relationship between the biomass and the number of seeds produced was estimated. This relationship was not affected by year for Avena spica-venti, Chenopodium album, Galium aparine, or Persicaria maculosa. Therefore, the data of the two seasons were pooled and analysed together. For Alopecurus myosuroides, Anagallis arvensis, Capsella bursa-pastoris, Geranium molle, Polygonum aviculare, Silene noctiflora, Sonchus arvensis, Veronica persica, and Viola arvensis, the relationship varied significantly between the years. In 2017, the growing season was cold and wet, and the slope of the regression lines was less steep than in the dry season in 2018 for most species. Capsella bursa-pastoris was the most prolific seed producer with the steepest slope.
1. Introduction
A plant’s ability to produce seeds depends on the plant’s size and its ability to survive to reproductive maturity [1,2,3]. Plants often need to reach a specific size before they can devote energy to reproductive tissues [4]. Above this size threshold, many plants allocate a constant proportion of additional biomass to reproductive tissues. Therefore, a plot representing the reproductive output against size would be linear with a positive slope and x-intercept [4,5,6]. While there may be no single unified concept of size for plants, aboveground dry biomass is a widely used measure [4,7,8].
The relationship between aboveground plant biomass and seed production has predominantly been described by linear regression models for both crops and weeds [1,8,9,10,11]. The x-axis intercept (minimum plant biomass threshold) and the slope are crucial parameters, as the intercept corresponds to the plant biomass where the plant species is unable to produce seeds, and the slope is a measure of how fast the seed production increases with increasing biomass [1,8,9,10,11]. Guglielmini (2019) studied the reproductive allometry of four annual weed species (Digitaria sanguinalis L. (Scop.), Amarathus hybridus L., Setaria verticillata (L) P.Beauv., and Chenopodium album L.) in greenhouse experiments. Reproduction allocation changes allometrically under highly competitive stress, as small plants failed to set seeds unless a plant biomass threshold was attained [9]. The required minimum biomass to set seeds varies considerably between species [6,11,12]. Competition between plants may alter their growth, survival, reproductive output [13], and pattern of biomass allocation [6]. If the competition for light is strong due to a high plant density, the plant will allocate resources to become tall at the expense of seed production [8].
The soil seed bank in the uppermost 20 cm in most agricultural soils includes millions of weed seeds per ha and is the source of yearly weed problems [14]. Seed production is a major determinant of the seed bank’s magnitude. For some annual weeds with short seed viability, it is probably the single most important determinant [15].
Weed seed data, representing quantification of a population, can be used in modelling and weed management decisions and might be adequate to make rough predictions of the magnitude of the weed problem in the next year [16].
Seed production by weeds under artificial conditions, e.g., pot experiments in greenhouses [9,15] may differ from plant performance under field conditions.
This project aims to estimate model parameters to describe the relationship between the biomass and seed production of fifteen common weed species growing in Europe and elsewhere. The plants were studied in wheat and oat fields in Denmark over two growing seasons. It was hypothesized that the relationship between the biomass and seed production is linear and that the slope and the intercept of the linear regression vary between weed species and between the years. Such data are valuable and necessary for creating population models, which can be used to predict the development of plant populations—for example, the development of a herbicide-resistant weed population [17,18] or invasive species [19,20].
2. Materials and Methods
2.1. Weeds in Oat Fields
The relationship between biomass and seed production of Anagallis arvensis L., Capsella bursa-pastoris (L.) Medik., Chenopodium album L., Geranium molle L., Persicaria maculosa Gray, Polygonum aviculare L., Silene noctiflora L., Sonchus arvensis L., Veronica persica Poir., and Viola arvensis Murray was assessed during the growing season of 2017 and 2018 in spring oat (Avena sativa L.) in two fields with sandy soils at the research station in Taastrup (55.38° N, 12.17° E), Denmark. The species were chosen because they are among the most common weeds in Denmark and Europe [14,21,22]. One field was sown on 19 April and harvested on 29 August 2017. The other field was sown on 28 April and harvested on 2 August 2018. The row spacing was 12 cm in both years. The oat cultivar was Dominik. The sowing rate was 170 kg ha−1 in both years, which is the recommended seeding rate for farmers. The fields were grown organically without applying any pesticides or fertilizer.
2.2. Weeds in Wheat Fields
The same relationship was examined for Alopecurus myosuroides Huds., Apera spica-venti (L.) P. Beauv., Bromus hordeaceus L., Cirsium arvense (L.) Scop., and Galium aparine L. during the growing season of winter wheat (Triticum aestivum L.) in two fields with clay soils at the same research station. The weed species were chosen because they are among the most common weeds in Denmark and Europe [14,21,22]. One field was sown on 27 September 2016 and harvested on 25 August, 2017. The field was fertilized with 150 kg ha−1 of a combination of NPKS (22-3-8-3) on 27 September 2016, 500 kg ha−1 of NPKS (22-3-10-2) on 16 March 2017, and 250 kg ha−1 NPKS (33-3-10-2) on 25 April 2017. The amount of applied fertilizer is recommended to Danish farmers because of the high yield potential. The other field was unfertilized, sown on 18 October 2017, and harvested on 31 July 2018. The wheat cultivars were Elixer and KWS Cleveland in 2017 and 2018, respectively, with a sowing rate of 210 and 180 kg ha−1. The fields were grown without applying pesticides.
2.3. Seed Collection
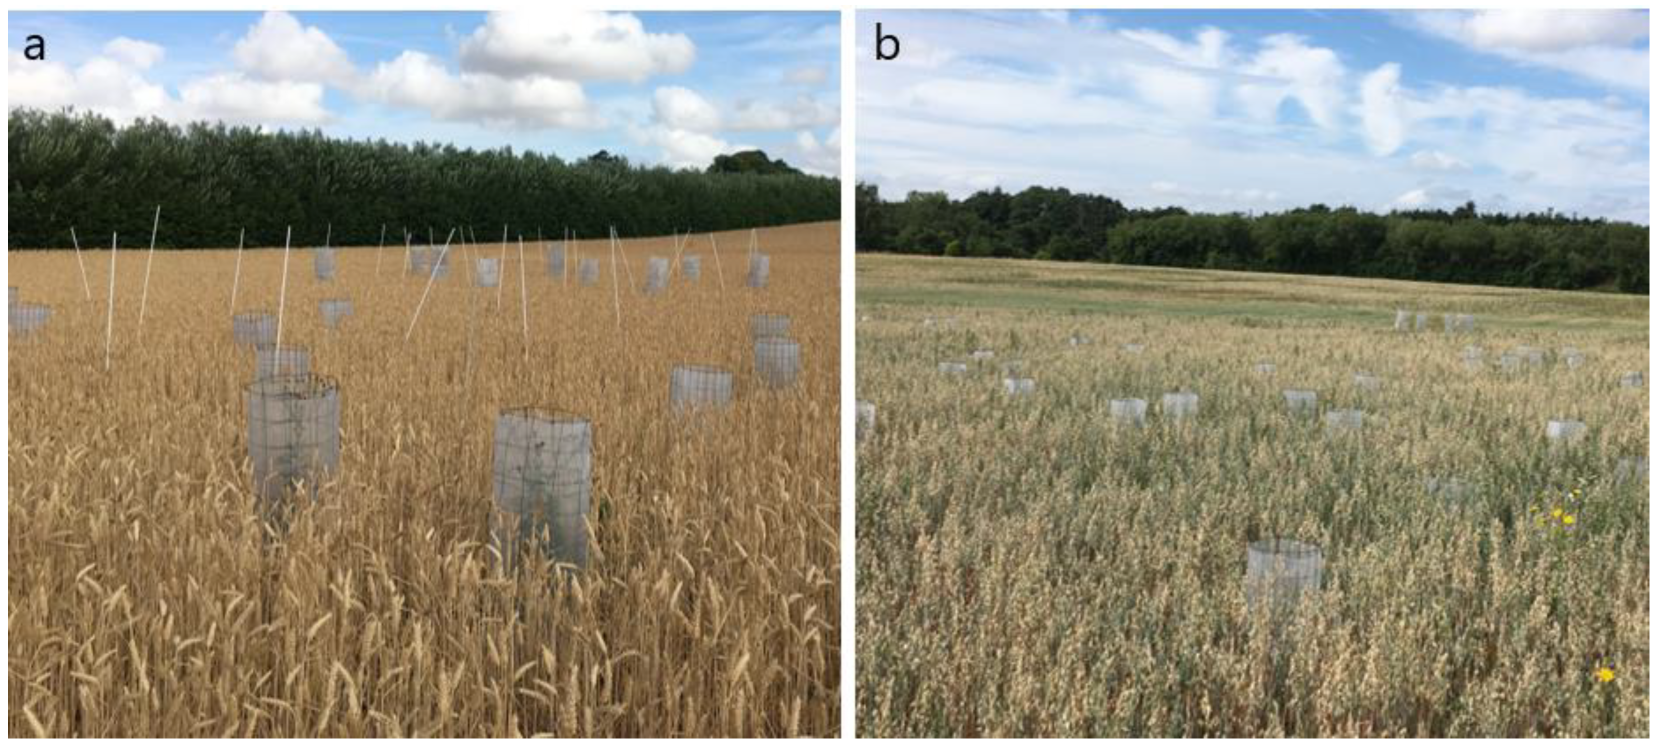
Before flowering, ten plants of each species were chosen randomly in the fields and surrounded by a trap consisting of a porous net (precision woven open mesh fabrics: SEFAR NITEX 06-475/56, Sefar, Germany; mesh opening: 475 μm-opening area: 56%) covering an area of approximately 710 cm2 (Figure 1). Ten plants with approximately the same size outside the porous net were visually observed during the season to see if they developed differently than the plants inside the traps. Twenty plants were chosen of A. myosuroides and A. spica-venti. Traps were checked each week, and seeds were collected using a portable vacuum cleaner. Every collected seed was counted until crop harvest. Just before crop harvest, weed plants were removed, the number of seeds retained on the weed plants was counted, and the aboveground plant dry weight without seeds was measured. The sum of the number of seeds shed and seeds retained on the plant was considered the total seed production.
2.4. Weather Data
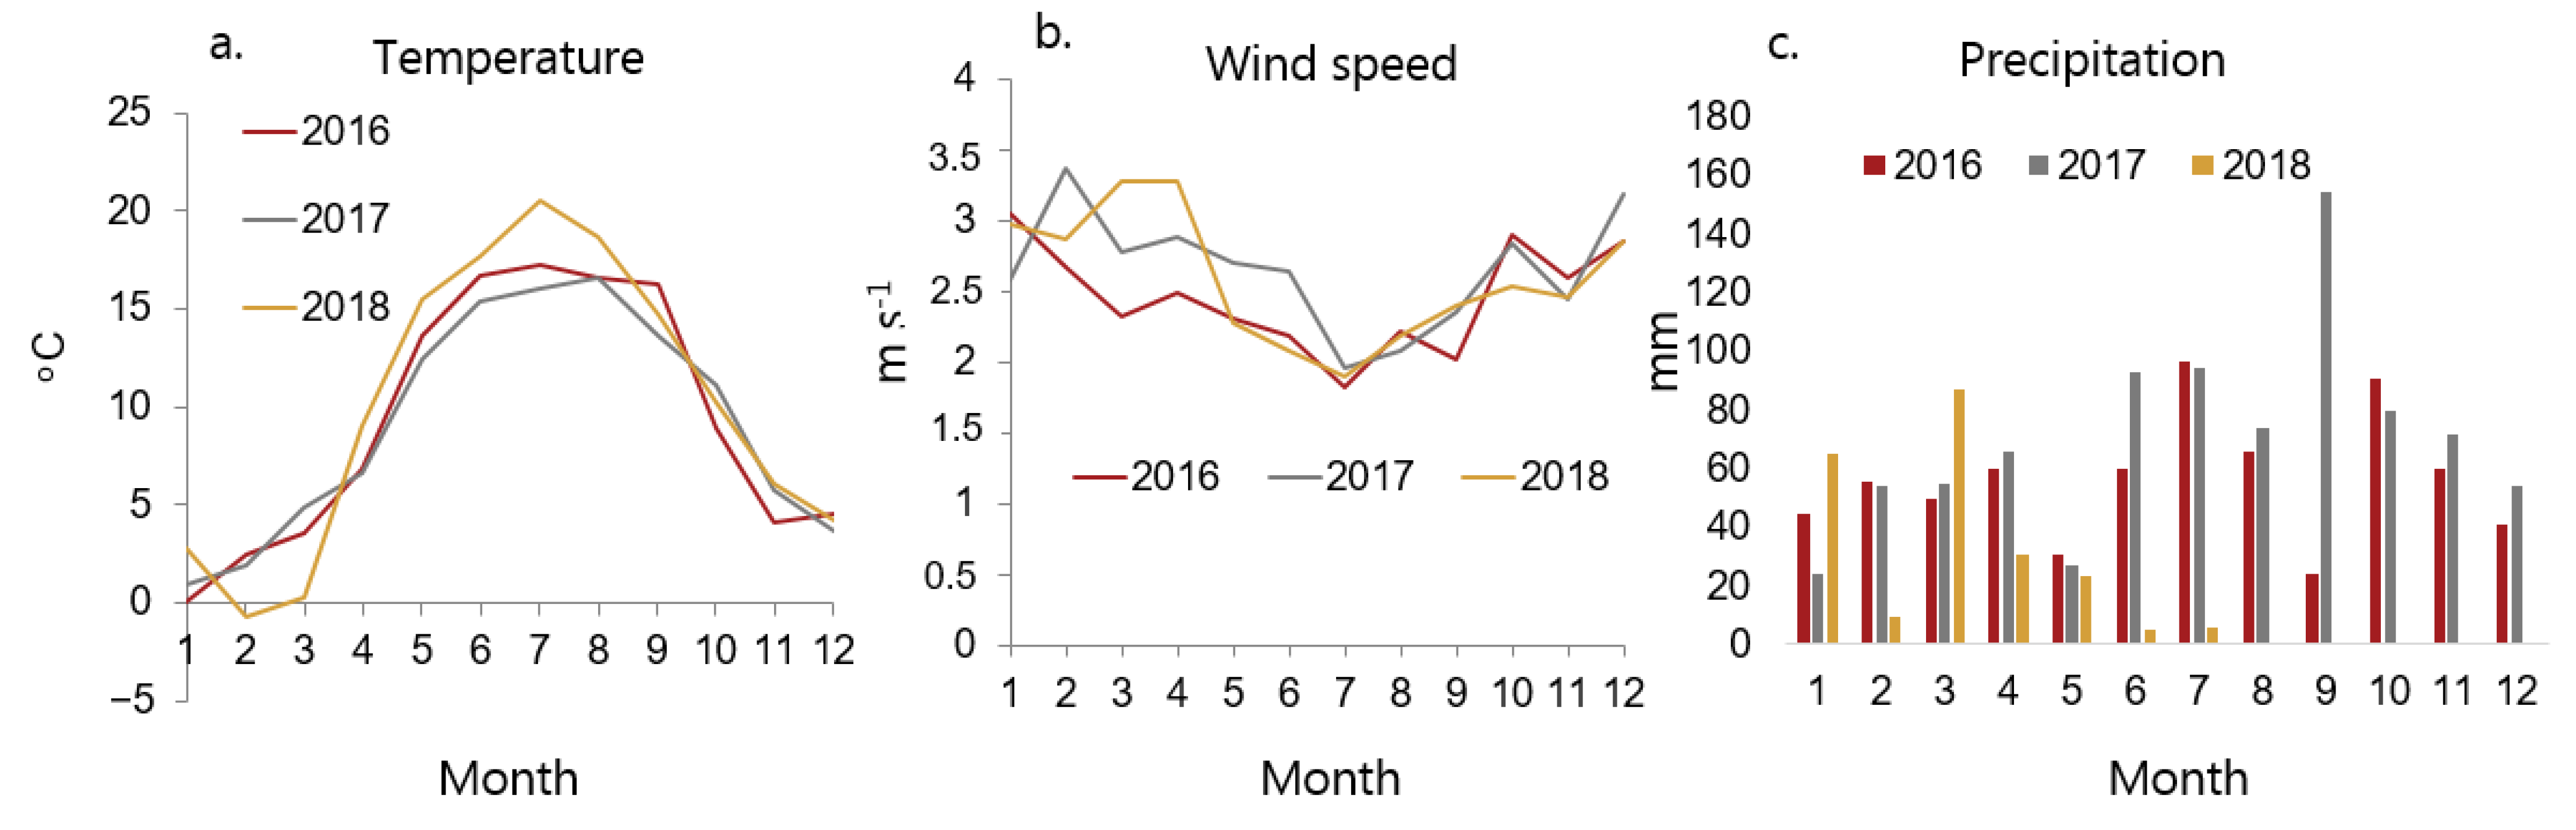
Weather data were provided from the research weather station in the area (55.67° N, 12.30° E). Figure 2 shows temperature, wind speed, and precipitation during the growth periods.
2.5. Statistical Analysis
One-way ANOVA followed by Fisher’s least significant difference (LSD) test for means separation was performed using the GLM package in R version 3.6.1 (The R foundation for statistical computing, Vienna, Austria, http://R-project.org (accessed on 14 February 2022)) to test whether the total seed production and above ground dry weight of the plants varied significantly between the years. Variance homogeneity was assessed by visual inspection of residual plots. The significance level was set to 0.05. Visual inspection of the plotted data indicated a linear relationship between dry biomass and seed production for all species. The relationship between the seed production and biomass was assessed using linear regression analysis for the data from each year for each species separately (1):
where y is the seed production, x is the biomass, α is the slope, and β is the point where the line cuts the y-axis. Data from the two years were pooled if the relationship was the same in the two years (no significant difference between the years for the slope and intercept).
y = αx + β
3. Results
The weed plants outside the nets did not differ in size or growth shape from the plants inside, indicating that nets did not significantly affect the plants in the traps.
3.1. Weeds in Oat Fields
The average plant dry weight at crop harvest was significantly different between the years for S. noctiflora, V. persica, and V. arvensis (Table 1). The total seed production was significantly different between the years for G. molle, P. aviculare, S. noctiflora, S. arvensis, V. persica, and V. arvensis (Table 1).
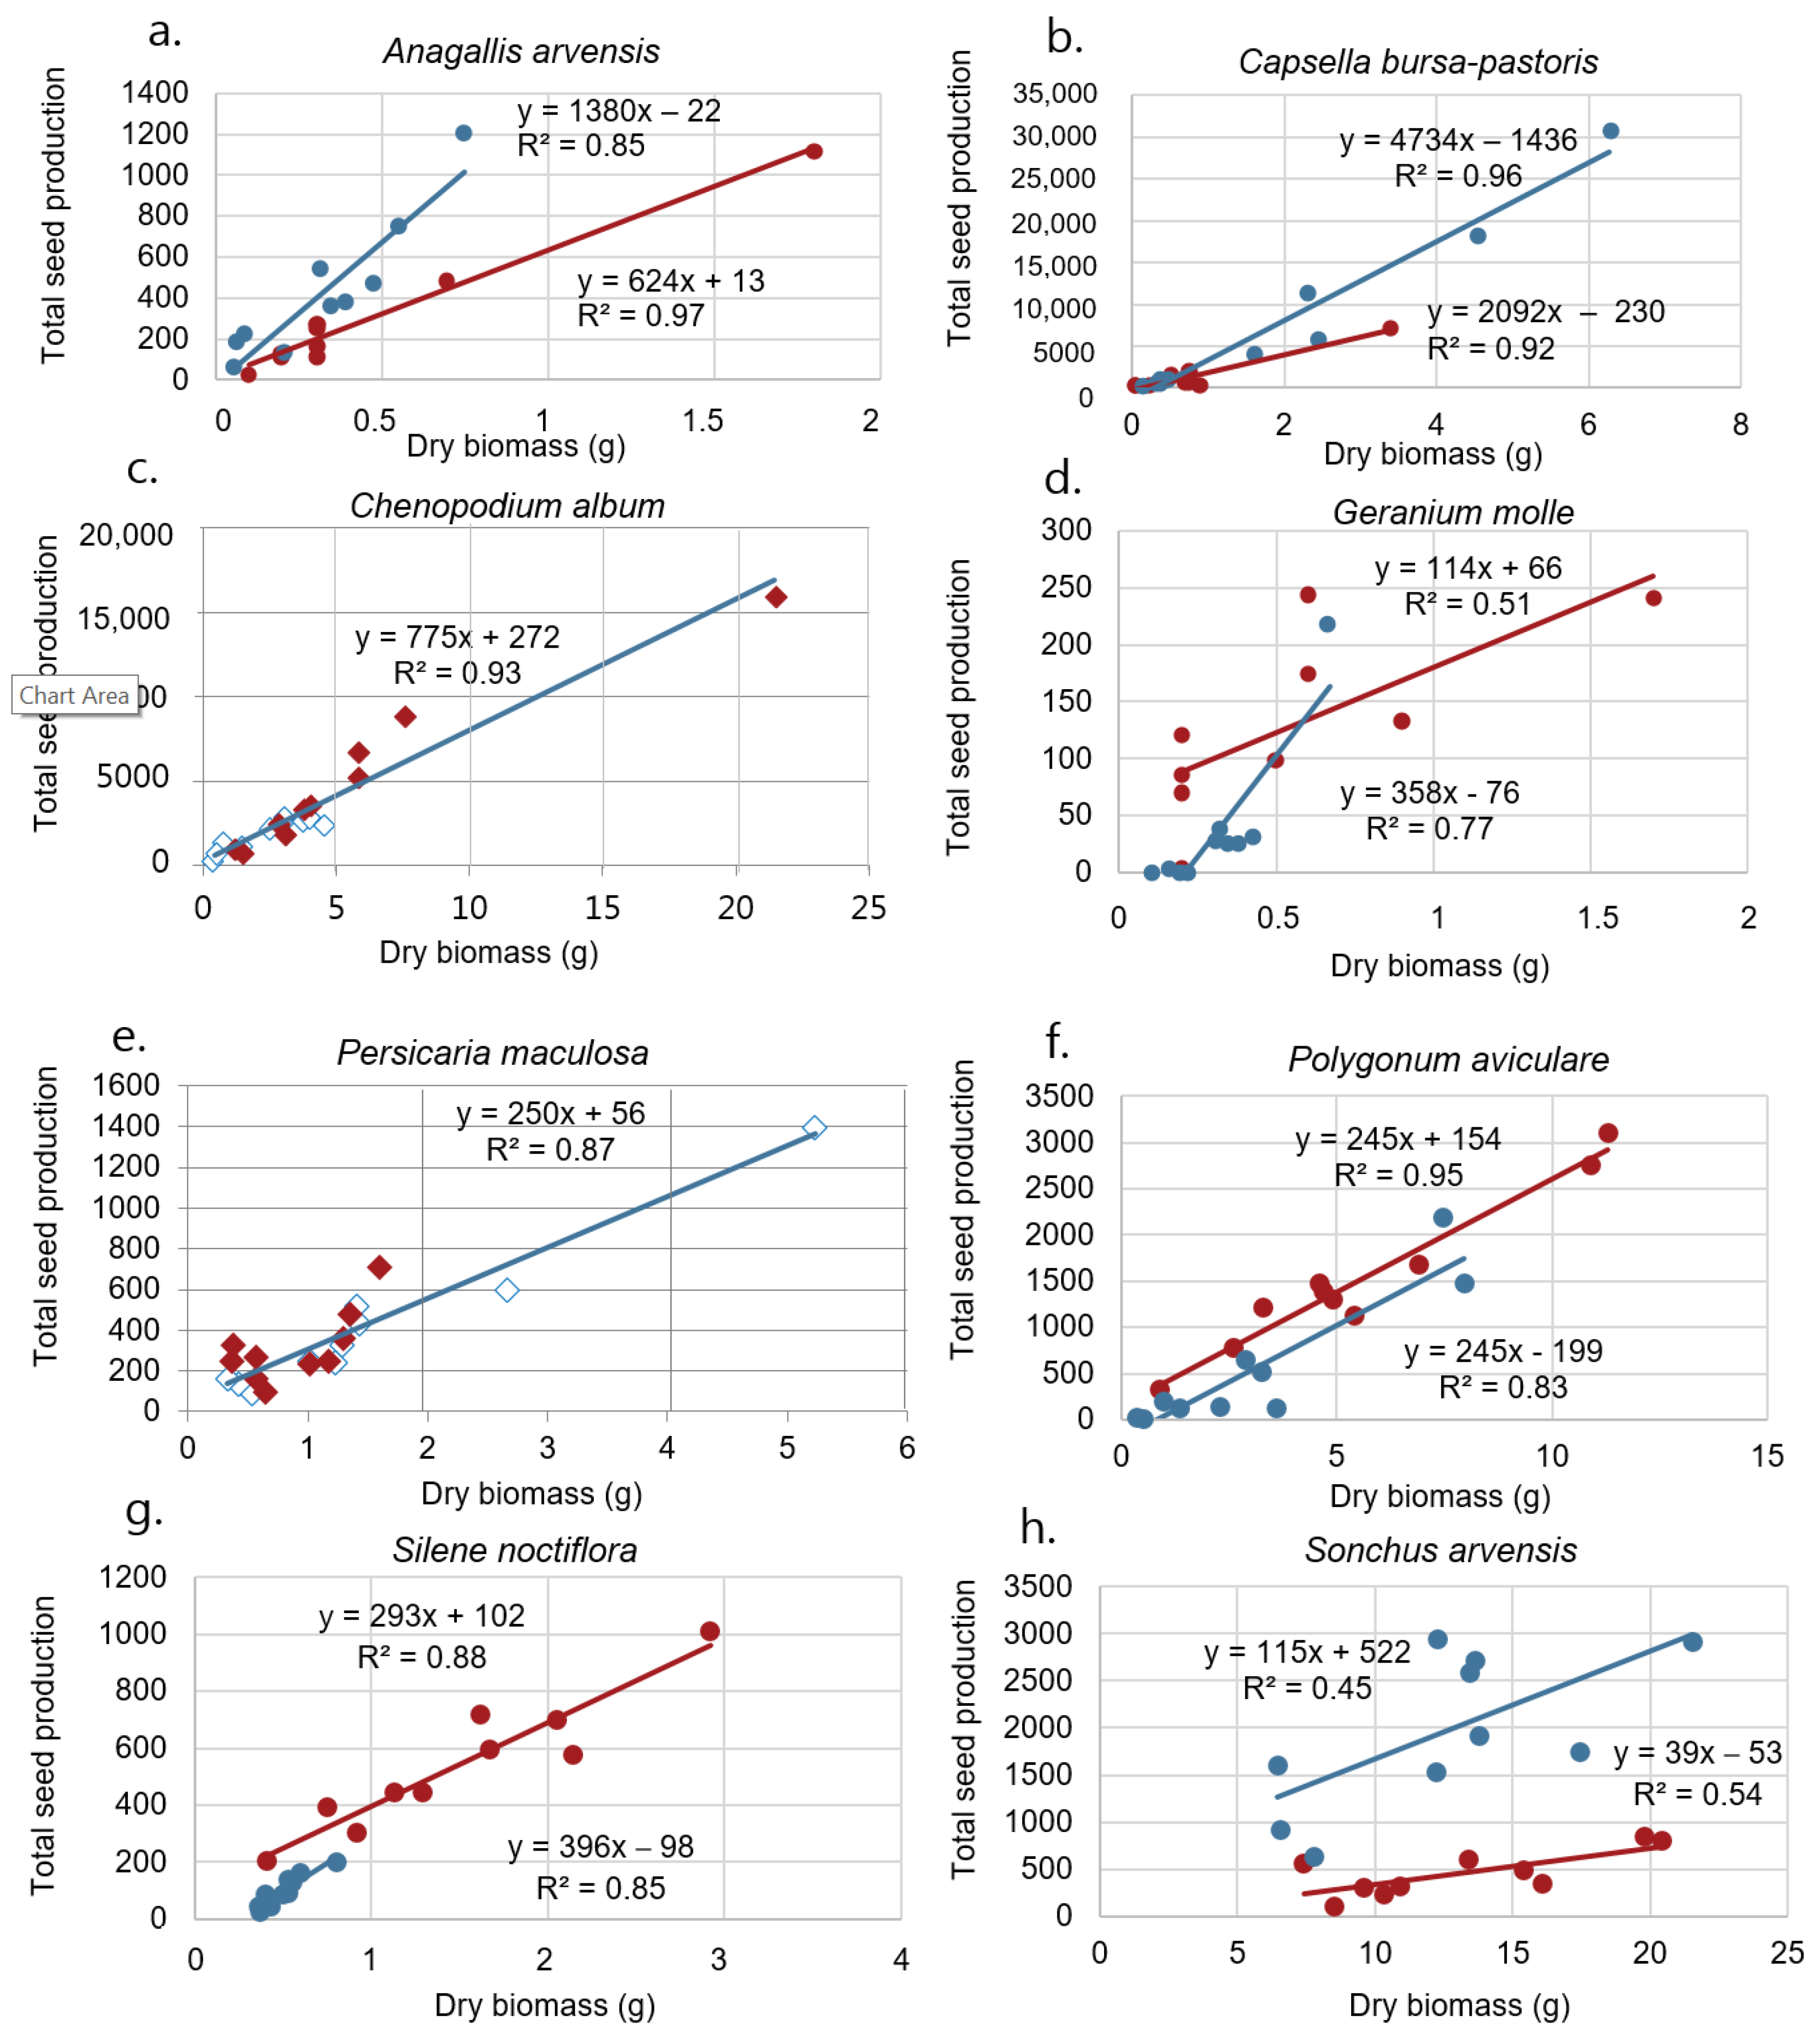
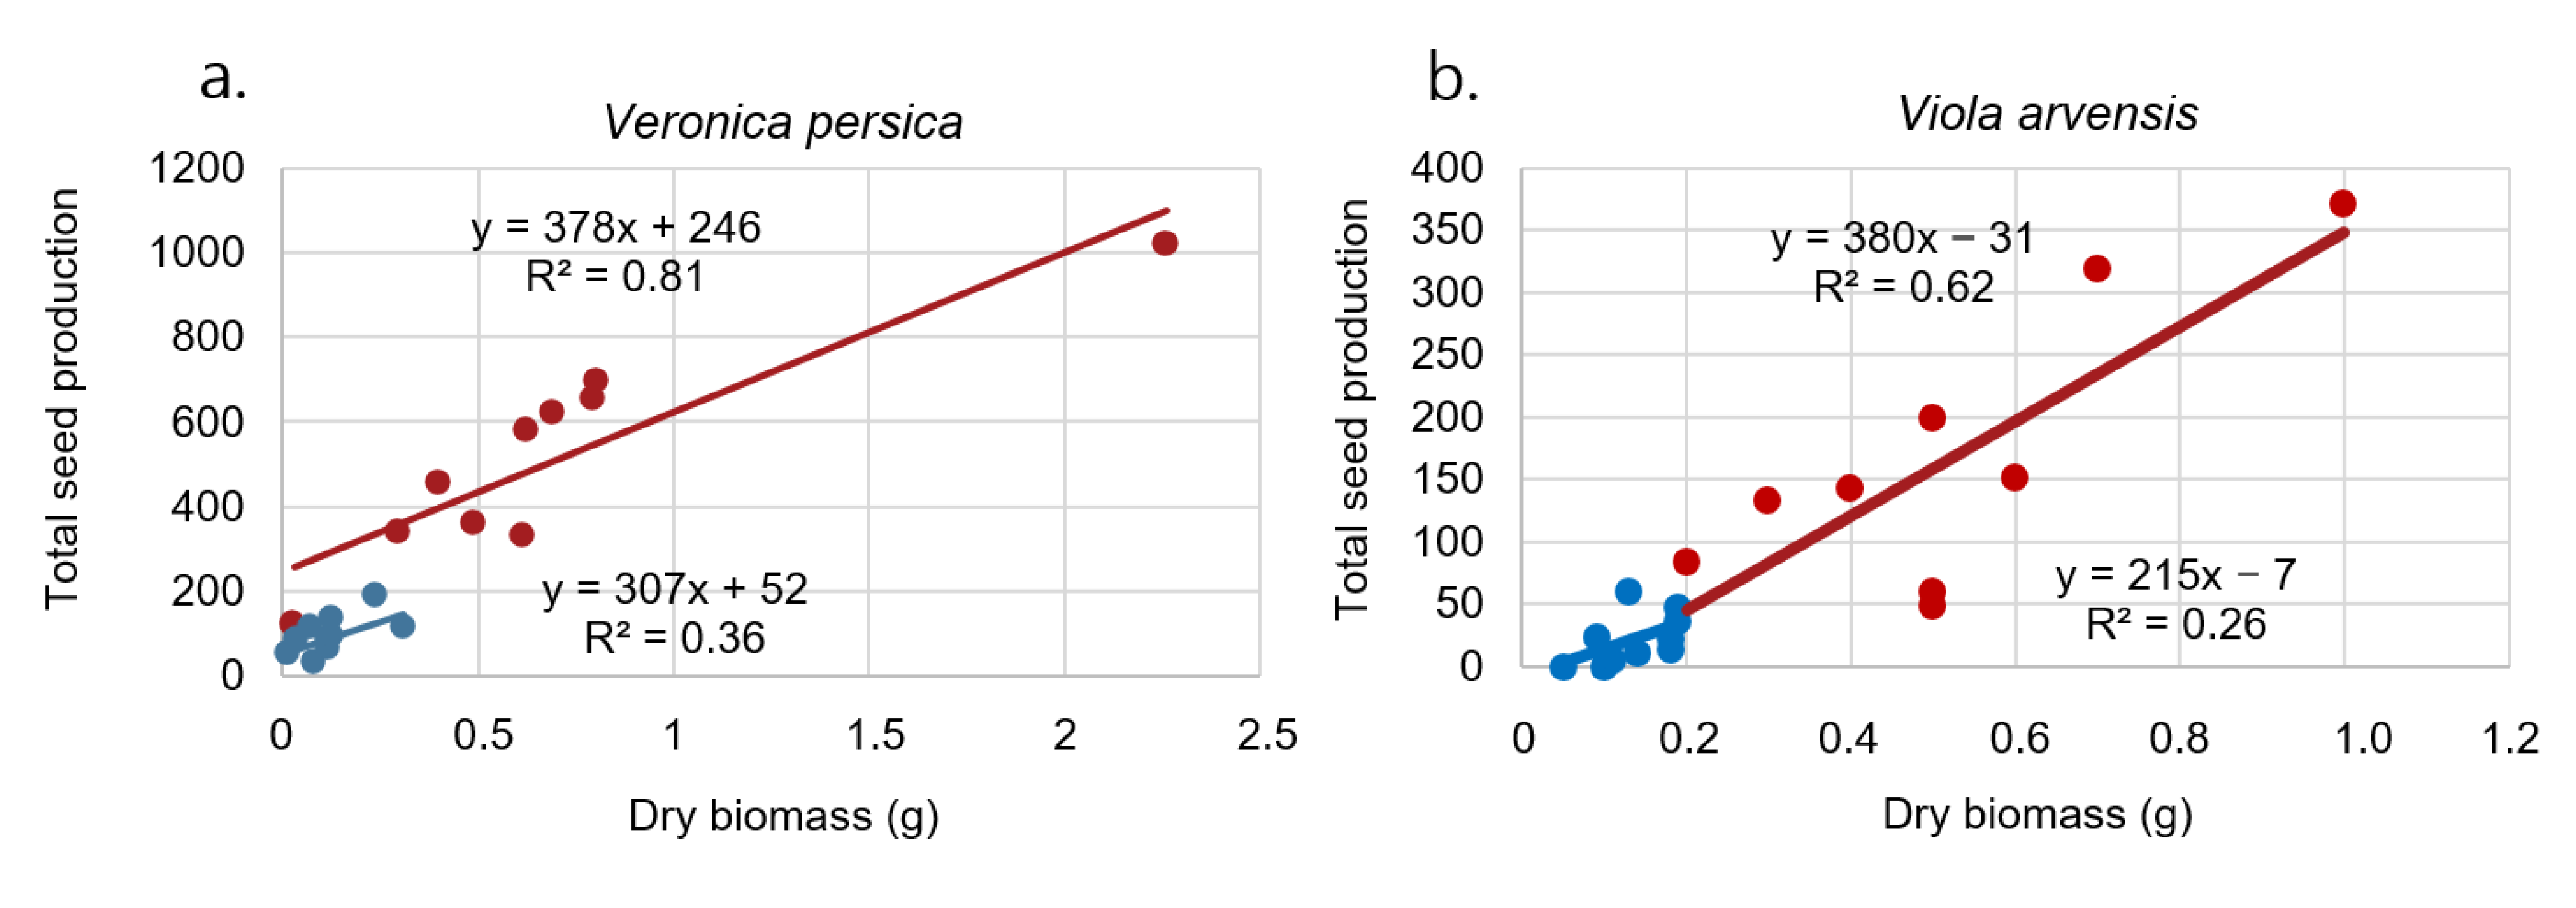
A positive correlation was observed between biomass and seed production for all species (Figure 3 and Figure 4). The slope of the linear regression (α parameter in model 1) was significantly different between the years for A. arvensis (p ≤ 0.001), C. bursa-pastoris (p ≤ 0.001), and G. molle (p = 0.043). The intercept (β parameter in model 1) was significantly different between the years for A. arvensis (p = 0.004), P. aviculare (p = 0.012), S. noctiflora (p = 0.0013), S. arvensis (p ≤ 0.001), V. persica (p ≤ 0.001), and V. arvensis (p = 0.014). Differences in slopes and intercepts of the regression line of the species in each year were also tested. In both years, they were significantly different between the species (2017: both slope and intercept (p ≤ 0.01); 2018: both slope and intercept (p ≤ 0.001)). The intercept was positive for some species and negative for others (Figure 3 and Figure 4).
In the first year, the regression line for A. arvensis, C. bursa-pastoris, P. maculosa, and P. aviculare had an R2 of 0.9. The lowest R2 was related to G. molle and S. arvensis (both R2 = 0.5). In the second year, the regression line for C. album and C. bursa-pastoris had the highest R2 (both R2 = 0.9), and the lowest R2 was related to V. arvensis (R2 = 0.2) (Figure 3 and Figure 4).
Different weed species responded differently to the weather conditions. The perennial weed, S. arvensis, had larger biomass and seed production in the dry season. Seed production was significantly higher in the rainy season (2017) compared to the dry season (2018) for G. molle, P. aviculare, S. noctiflora, V. persica, and V. arvensis, while biomass was significantly increased for S. noctiflora, V. persica, and V. arvensis. Some species showed more variation between seasons than others did. Biomass was similar between both years for G. molle and P. aviculare. The season affected neither biomass nor seed production of A. arvensis, C. album, C. bursa-pastoris, and P. maculosa (Table 1).
3.2. Weeds in Wheat Fields
The average plant dry weight at crop harvest was significantly different between the years for A. myosuroides, A. spica-venti, C. arvense, and G. aparine (Table 2). The total seed production was significantly different between the years for A. myosuroides, A. spica-venti, and G. aparine (Table 2). We only found B. hordeaceus in the wheat field in 2017.
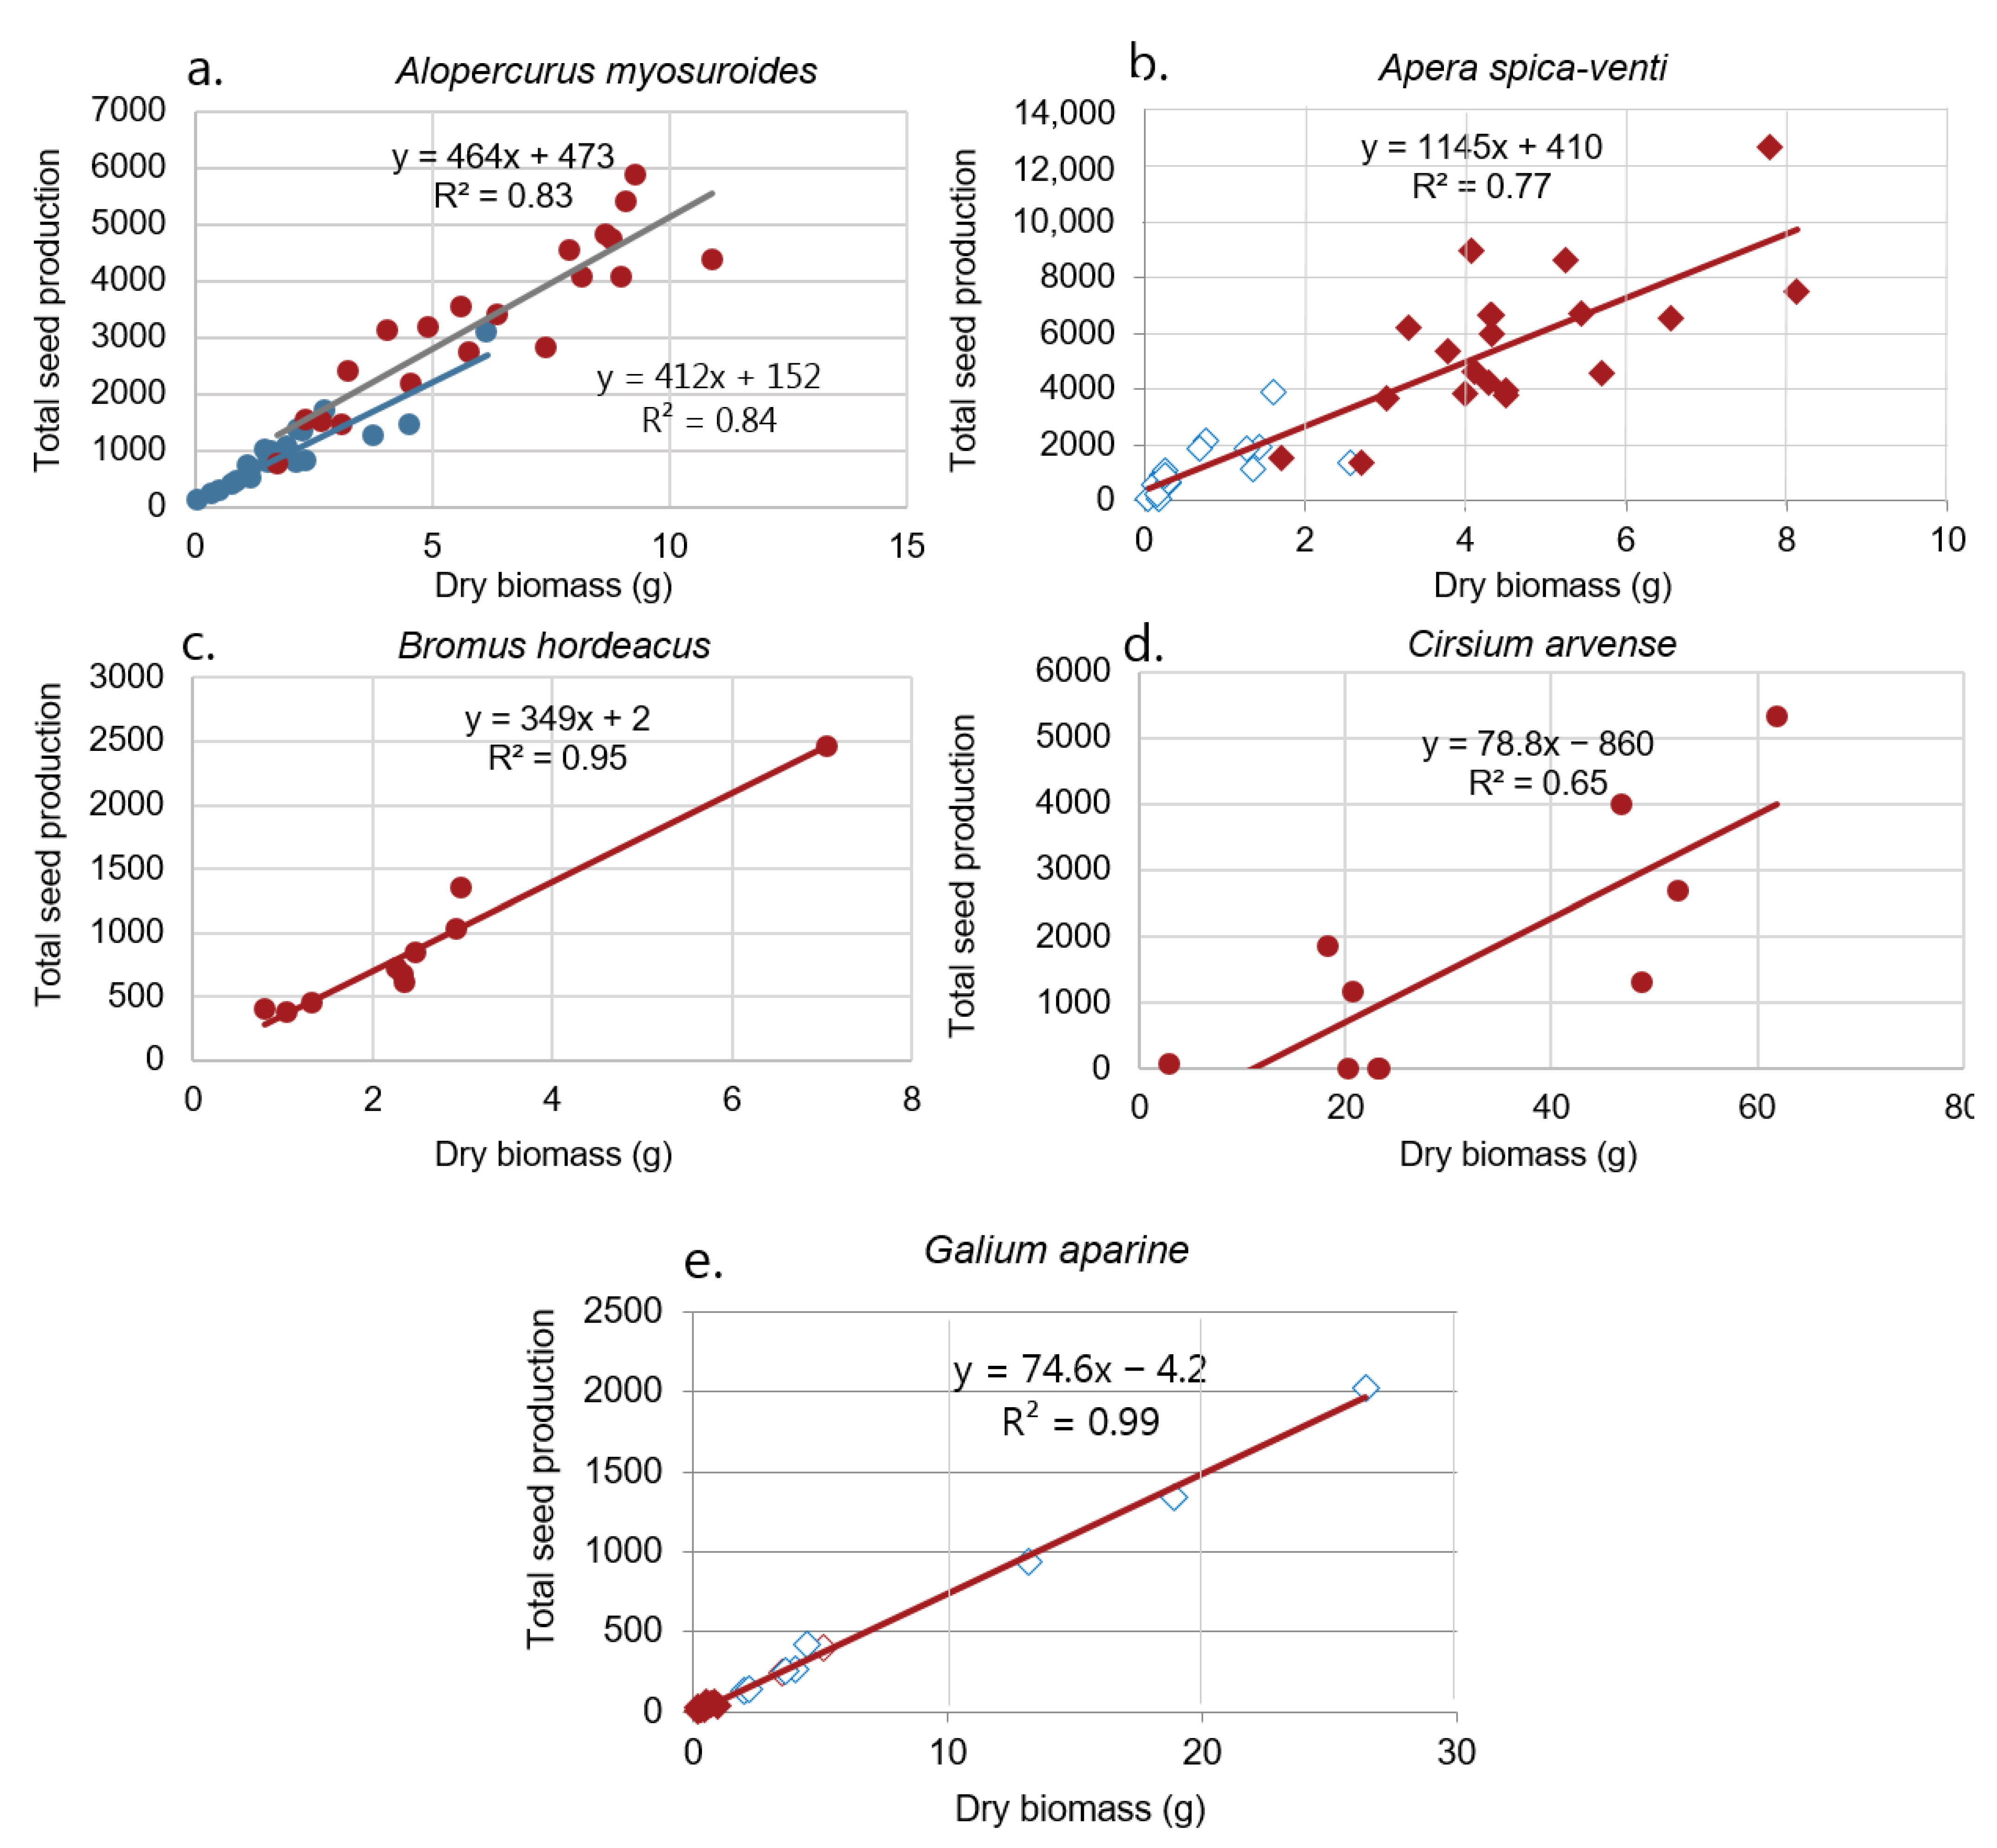
Cirsium arvense did not produce any seeds in 2017. We observed a positive correlation between biomass and seed production for all five species (Figure 5). The intercept was only significantly different between years for A. myosuroides (p = 0.03). The intercept was positive for some species and negative for others (Figure 5).
The dry season enhanced the growth and seed production of the two grass weeds A. myosuroides and A. spica-venti, which produced significantly more biomass and seeds than the rainy season. Biomass and seed production was substantially higher in the rainy season (2017) compared to the dry season (2018) for G. aparine.
4. Discussion
4.1. Weather Conditions
Figure 1 shows seed traps in the fields. Different weather conditions in the two growing seasons resulted in different biomass and seed production of the weed species in the two years. In 2017, the summer in Denmark was cold, wet, and cloudy with no days with temperatures > 30 °C. In 2018, the summer was unusually dry, warm and sunny, with many days having temperatures higher than 30 °C (Figure 2). It was the warmest summer since 1874 [23].
In the dry and warm weather in 2018, the wheat and oat plants became drought-stressed, resulting in less growth and thinner stands, creating more space and light for the weeds. Irrigation was not an option on the fields. Wheat and oat plants, along with weeds, matured earlier in 2018, resulting in harvest occurring two and four weeks earlier, respectively, than in 2017.
In 2018, the growth period was about 37 days longer than in 2017, which contributed to explaining why the size of weeds and seed production were significantly higher, as most weeds continue to set flowers and seeds if growth is not interrupted.
Wind may cool the leaf surface and reduce growth rate or supplement plants with carbon dioxide, enhancing their growth. The wind is also a major disturbance in many plant ecosystems and can play a crucial role in plant regeneration. Cereals and other herbaceous crops can often recover after wind damage [24]. However, the wind speed did not differ much between the two seasons (Figure 2). Therefore, we assume that the wind only contributed insignificantly to the observed variation in plant growth between the two years.
4.2. Regression Models
The graphical representation of the raw data suggested the application of a linear model in all the cases. For all species, a linear model described the data relatively well. The linear regressions varied widely in slope, intercept, and R2 between weed species (Figure 3, Figure 4 and Figure 5). Several species had positive x-intercepts, indicating a threshold size for reproduction, while there were also populations with negative x-intercepts (positive y-intercept) (Figure 3, Figure 4 and Figure 5). Thompson et al. [25] have recorded similar results. However, a line does not describe the relationship correctly at low biomasses because the plant must produce a certain amount of biomass before producing seeds. Genetic variation within the species and different growing conditions within the fields may affect the estimation of the model parameters.
4.3. Weeds
Only a few scientific references were found about the relationship between biomass and seed production under field conditions for the studied common European weeds, probably because most weeds shatter their seed continuously during the summer months and the seeds need to be collected continuously. Otherwise, seeds might be spread by the wind or moved or eaten by seed predators [26,27].
4.3.1. Weeds in Oat Fields
Anagallis arvensis
Anagallis arvensis was the only species in the oat field where the slopes and the intercepts were significantly different in the two seasons (Figure 3a). It is a relatively small plant species with small seed production. The weed has declined significantly in Danish fields during the last century [28].
Capsella bursa-pastoris
Capsella bursa-pastoris was the most prolific seed producer, with a slope of 4734 (Figure 3b). Very small plants are able to produce seeds, and if the growth season is long, as it was in 2018, the plants become large and produce a huge number of small seeds (seed weight 0.1 mg). Hence, the variation in plant size and seed production was very large (Table 1). Its occurrence has increased significantly in Danish fields [28], probably due to the immense shift from summer to winter annual crops, which favor winter annual species. Capsella bursa-pastoris is mostly a summer or winter annual tetraploid and is predominantly inbreeding [29]. It has a worldwide distribution, avoiding only the hot and wet tropics. It is one of the most frequent and widespread flowering plants on earth [30].
Chenopodium lbum
For C. album, the slopes and the intercepts did not vary significantly between the seasons and, consequently, data were pooled for the two years (Figure 3c). Like Capsella-bursa-pastoris, C. album is able to produce seeds on very small plants, and plants having a long growth season may become large and produce a large number of seeds (Table 1). The largest plant weighed 21.46 g and produced 15,932 seeds. Several researchers have studied the size dependency of sexual reproduction of C. album. Grundy et al. [31] also found a linear relationship between seed production of C. album and aboveground dry weight. Seed production was mostly independent of planting density, crop competition, and growing season. The linear relationships were consistent from population to population. Relatively stable biomass and seed production offer some indications that a general relationship may be possible for use as a predictor of seed production for C. album [29]. Similar stability of the biomass/seed production relationship has also been shown by Rasmussen [32] for C. album competing with barley, even when herbicides had been used at sublethal rates. Guglielmini et al. [9] also found that seed production increased linearly with higher biomass and lower competition for C. album. They found, like us, that the linear regression was not different between the years for C. album even though plant growth and seed production were higher in the first year. They reported an intercept of zero (y-axis intercept when x = 0 was zero) and a slope of 1122. Aarssen and Taylor [8] studied the fecundity allocation of 21 herbaceous plant species of natural populations in Canada, including C. album. They estimated almost the same slope and R2 for C. album (0.95 and 857.5, respectively) as we did (0.93 and 775.07, respectively). Aarssen and Taylor [8] estimated the intercept to be −3.5, which is considerably different from what we found (272.2).
Geranium molle
The regression lines did not fit well for G. molle (R2 = 0.77 in 2017, R2 = 0.50 in 2018) (Figure 3d). Geraniums produce about five seeds per flower and disperse the seeds by forcibly ejecting them for several meters (1–4 m) [33]. The dispersal mechanism may explain the poor fit of the regression lines. Some seeds have probably escaped by being ejected out of the seed nets. A lid on the seed net would have prevented the seeds from leaving the nets but may have reduced light and hence plant growth compared to plants outside the nets.
Persicaria maculosa
The growing season did not significantly affect biomass and seed production (Figure 3e). The biomass variation and seed production were about the same for the two years despite the different weather conditions. Genotypes in this species express a wide range of functionally appropriate phenotypic plasticity in response to light, moisture, and nutrient conditions [34,35].
Polygonum aviculare
Polygonum aviculare is an annual weedy species showing extensive genetic variation in seed and leaf size. The variation in cell size and/or gibberellin content might be the mediators of the correlation found between seed size, leaf size, and growth parameters within this species [36]. The hot summer in 2018 favored the species (Figure 3f). Polygonum aviculare colonizes a wide range of open, man-made habitats, which differ in the type and intensity of disturbance regime [36,37]. In western Europe, genotypes with tiny seeds and small leaves tend to occur in trampled sites such as footpaths and cart tracks [38]. Plants with larger leaves occur in two kinds of untrampled habitats: in sites subject to frequent weeding activities, they are represented by short-lived genotypes with a high biomass allocation to seed; in more stable sites with a denser plant cover, they are represented by genotypes with a longer life span and a higher biomass allocation to vegetative organs [38,39].
Silene noctiflora
There was a large difference in biomass and seed production between the two years (Figure 3g). Silene noctiflora thrived well in the warm summer in 2018 but poorly in the wet and cold summer in 2017. Salisbury [40] reported that in plants of S. noctiflora examined in England, the mean number of seeds per capsule was 182 (SE = 3) and the mean number per plant was 2587 (SE = 206), which is a considerable higher seed number per plant than we observed.
Sonchus arvensis
Sonchus arvensis is a perennial species propagating by seeds, but it also produces vegetative shoots from rhizomes. Perennials’ above- and belowground biomass allocation strategies may affect the aboveground biomass/seed production relationship. However, we only included the aboveground biomass. Still, we observed a positive correlation between aboveground plant biomass and seed production (Figure 3h). A positive correlation between seed production and aboveground biomass has been reported for many herbaceous perennials e.g., [8,41,42,43].
Veronica persica
There was a significant difference between biomass and seed production in 2017 and 2018 (Figure 4a). The cold summer resulted in small plants and low seed production. Lutman et al. [44] studied seed production by V. persica and other weed species in 12 experiments in England. These species were grown in the field either on their own or in competition with a range of arable crops, though mainly winter wheat. Using the average plant weights in the different crops and these regression parameters, it was calculated that V. persica growing in all the tested crops would produce 700–1400 seeds plant−1 (plant dry weights 0.7–1.5 g). The data for the weight of V. persica in winter wheat (1.2 g) indicated that it would produce 1115 seeds plant−1. In contrast, when growing without intra- or interspecific competition from the crop or other weeds, V. persica produced 4100 seeds per plant (plant dry weight 5.5 g). Accordingly, the seed production was, in general, larger than we recorded.
Viola arvensis
Viola arvensis plants were all small, producing a small number of seeds in 2017 (Figure 4b). Lutman et al. [45] found a linear relation (R2 = 0.956). The slope of the line for the plants growing without competition was over 1.0 and was significantly higher than for the samples from within the winter wheat crops, which were <1.0. Plants of this weed growing alone had an average dry weight of 29.3 g plant−1 and thus produced 3714 seeds. Viola arvensis growing in normal density winter wheat weighed 2.6 g and produced 465 seeds, which is about the same relationship as we found (Figure 4b). Plants competing with each other as well as with the wheat, weighed <1 g, and consequently, their seed production was low—97–169 seeds per plant. Integrating the highest weed populations in the normal density wheat crop (c. 200 plants m−2) into these calculations resulted in an estimated seed production of c. 7400 seeds m−2 [44].
4.3.2. Weeds in Wheat Fields
Alopecurus myosuroides
Even plants with little biomass produced seeds, and the linear regression fitted the data for both years well (Figure 5a). Moss [45] found that head numbers and head length were significantly correlated with total seed production. Head length, but not head number assessments, were also significantly correlated with viable seed production. Moss [46] suggested a quantitative model for the population development of A. myosuroides based on seed cycle data from field experiments. The model includes a density dependent relationship between plant and head numbers. Heads m−2 (y) were found to be related to plants m2 (x) by the equation: y = B × (1 + αx), where B = 3.88 and α = 0.0018.
Apera spica-venti
For A. spica-venti the slopes and the intercepts did not vary significantly between the seasons and, consequently, data were pooled (Figure 5b). Even tiny plants were able to produce seeds. Seeds are small (2.4 mm × 0.6 mm) and weigh about 0.1 mg. Thompson et al. [25] reported some evidence of nonlinearity of size-dependent reproductive output for A. spica-venti. Although the linear regression did not fit our data well (R2 = 0.77), our data showed no indication of nonlinearity.
Bromus hordeaceus
Unfortunate, the B. hordeaceus was only observed in the dry and warm year (2018) (Figure 5c). The linear regression fitted well to the data (R2 = 0.95). Ewing and Menke [47] found that drought treatments diminished seed production, but some germinable seeds were produced under severe drought. Drought effects were carried over to the next generation because stressed plants produced smaller seedlings.
Cirsium arvense
In 2017, the plants did not produce any seeds (Figure 5d). The low temperatures and high precipitation in the summer months seemed to have blocked seed setting. Cirsium arvense is a perennial weed, the success and persistence of which derive from an extensive, far-creeping, and deep rooting system which ensures survival and rapid vegetative spread under a wide range of soil and management conditions. Therefore, it does not exclusively depend on seed production for surviving unto the following season. In general, C. arvense has the reputation of producing only a few viable seeds per flowerhead [48]. Klinkhamer et al. [49] found that seed production of flowering plants of Cirsium vulgare varied strongly between years. The percentage of plants that were noticeably damaged by herbivores also varied between years and caused a reduction of the seed production by 80% in 1982 and 15% in 1984.
Galium aparine
The linear regression fitted the data ideally for G. aparine (R2 = 0.9959). One reason could be that all seeds were still on the plants at harvest. In 2018, the plants did not produce much biomass, but could still produce seeds (Figure 5e). In a study of population dynamics of G. aparine in West Germany, seed counts were higher on sites that had been cropped with sugar beet than on sites under grain production [50]. Seed production was lowest in spring barley (9 seeds plant−1) and highest in sugar beet (2170 seeds plant−1, corresponding to the same range as we recorded depending on the plant biomass.
5. Conclusions
The relationship between biomass and seed production could be described with a linear function for all weed species. The slope and the intercept of the linear regression varied between species and between the years.
This biomass/seed production relationship was not affected by year for A. spica-venti, C. album, G. aparine, and P. maculosa. Therefore, the data of the two seasons were pooled and analyzed together. For A. myosuroides, A. arvensis, C. bursa-pastoris, G. molle, P. aviculare, S. noctiflora, S. arvensis, V. persica, and V. arvensis, the relationship varied significantly between the years. In 2017, the growing season was cold and wet, and the slope of the regression lines was less steep than in the dry season in 2018 for most species. Capsella bursa-pastoris was the most prolific seed producer with the steepest slope.
We have provided information on seed production of several common weed species. Such data are valuable and necessary for creating population models. The collected data can be used to predict the development of plant populations in combination with other data—for example, the development of a herbicide-resistant weed population or invasive species.
It would be valuable to study other populations of the same weed species in other regions and under other environmental conditions, as the genetic variation in weed populations can be large and ecological factors significantly influence seed production. Therefore, the data from one single location cannot be used to generalize the relationship between biomass and seed production for a weed species adapted to a wide range of environments and a large area of distribution.
Author Contributions
C.A. was responsible for funding acquisition and the design of the experiment. Z.B. conducted the practical work, processed the data and wrote the first draft of the manuscript. All authors have read and agreed to the published version of the manuscript.
Funding
This work was a part of the project: 105 SWEEDHART-Separation of weeds during harvesting and hygienisation to enhance crop productivity in the long term. The activity was conducted under the “Joint European research projects in the field of Sustainable and Resilient Agriculture” under ERA-NET Cofund FACCE SURPLUS 2015. We thank Innovation Fund Denmark for financial support.
Data Availability Statement
Data are available from the corresponding author.
Conflicts of Interest
The authors declare no conflict of interest. The funders had no role in the design of the study; in the collection, analyses, or interpretation of data; in the writing of the manuscript, or in the decision to publish the results.
References
- Aarssen, L.W. On size, fecundity, and fitness in competing plants. In Reproductive Allocation in Plants; Reekie, E.G., Bazzaz, F.A., Eds.; Academic Press: Cambridge, MA, USA, 2005; pp. 215–244. [Google Scholar] [CrossRef]
- Aarssen, L.W. Death without sex—The ‘problem of the small’ and selection for reproductive economy in flowering plants. Evol. Ecol. 2008, 22, 279–298. [Google Scholar] [CrossRef]
- Aarssen, L.W.; Clauss, M.J. Genotypic variation in fecundity allocation in Arabidopsis thaliana. J. Ecol. 1992, 80, 109–114. [Google Scholar] [CrossRef]
- Weiner, J.; Campbell, L.G.; Pino, J.; Echarte, L. The allometry of reproduction within plant populations. J. Ecol. 2009, 97, 1220–1233. [Google Scholar] [CrossRef]
- Weiner, J. The influence of competition on plant reproduction. In Plant Reproductive Ecology: Patterns and Strategies; Lovett Doust, J., Ed.; Oxford University Press: New York, NY, USA, 1988; pp. 228–245. [Google Scholar]
- Weiner, J. Allocation, plasticity and allometry in plants. Perspect. Plant Ecol. Evol. Syst. 2004, 6, 207–215. [Google Scholar] [CrossRef]
- Weiner, J.; Thomas, S.C. Competition and allometry in three species of annual plants. Ecology 1992, 73, 648–656. [Google Scholar] [CrossRef] [Green Version]
- Aarssen, L.W.; Taylor, D.R. Fecundity allocation in herbaceous plants. Oikos 1992, 65, 225–232. [Google Scholar] [CrossRef]
- Guglielmini, A.C.; Verdú, A.M.C.; Satorre, E.H. Reproductive allometry in four annual weeds. Aust. J. Bot. 2019, 67, 99–105. [Google Scholar] [CrossRef]
- Prihar, S.S.; Stewart, B.A. Sorghum harvest index in relation to plant size, environment and cultivar. Agron. J. 1991, 83, 603–608. [Google Scholar] [CrossRef]
- Vega, C.R.C.; Sadras, V.O.; Andrade, F.H.; Uhart, S.A. Reproductive allometry in soybean, maize and sunflower. Ann. Bot. 2000, 85, 461–468. [Google Scholar] [CrossRef] [Green Version]
- Samson, D.A.; Werk, K.S. Size-dependent effects in the analysis of reproductive efforts in plants. Am. Nat. 1986, 127, 667–680. [Google Scholar] [CrossRef]
- Harper, J.L. Population Biology of Plants; Academic Press: London, UK, 1977; p. 892. [Google Scholar]
- Andreasen, C.; Jensen, H.A.; Jensen, S.M. Decreasing diversity in the soil seed bank after 50 years in Danish arable fields. Agric. Ecosyst. Environ. 2018, 259, 61–71. [Google Scholar] [CrossRef]
- Norris, R.F. Weed fecundity: Current status and future needs. Crop. Prot. 2007, 26, 182–188. [Google Scholar] [CrossRef]
- Schwartz-Lazaro, L.M.; Copes, J.T. A review of the soil seedbank from a weed scientist’s perspective. Agronomy 2019, 9, 369. [Google Scholar] [CrossRef] [Green Version]
- Comont, D.; Hicks, H.; Crook, L.; Hull, R.; Cocciantelli, E.; Hadfield, J.; Childs, D.; Freckleton, R.; Neve, P. Evolutionary epidemiology predicts the emergence of glyphosate resistance in a major agricultural weed. New Phytol. 2019, 223, 1584–1594. [Google Scholar] [CrossRef] [PubMed]
- Neve, P. Simulation modelling to understand the evolution and management of glyphosate resistance in weeds. Pest Manag. Sci. 2008, 64, 392–401. [Google Scholar] [CrossRef] [PubMed]
- Blacklow, M.; Andreasen, C. Computer simulation of population dynamics: Phenology and control of Portulaca oleracea. In Proceedings of the EWRS Symposium, Quantitative Approaches in Weed and Herbicide Research and their Practical Application; European Weed Research Society: Braunschweig, Germany, 1993; pp. 601–608. [Google Scholar]
- Raghu, S.; Dhileepan, K.; Scanlan, J.C. Risk and benefit a priori in biological control of invasive plant species: A systems modelling approach. Ecol. Model. 2007, 208, 247–262. [Google Scholar] [CrossRef]
- Andreasen, C.; Stryhn, H. Increasing weed flora on Danish arable fields and its importance for biodiversity. Weed Res. 2008, 48, 1–9. [Google Scholar] [CrossRef]
- Kraehmer, H.J.; Andreasen, C.; Economou-Antonaka, G.; Holec, J.; Kalivas, D.; Kolářová, M.; Novak, R.; Panozzo, S.; Pinke, G.; Salonen, J.; et al. Weed surveys and weed mapping in Europe: State of the art and future tasks. Crop Prot. 2020, 129, 105010. [Google Scholar] [CrossRef]
- DMI (Danish Metrological Institute). Vejr, klima og hav. Available online: https://www.dmi.dk/vejr/arkiver/maanedsaesonaar/ (accessed on 1 February 2020).
- Gardiner, B.; Berry, P.; Moulia, B. Review: Wind impacts on plant growth, mechanics and damage. Plant Sci. 2016, 245, 94–118. [Google Scholar] [CrossRef]
- Thompson, B.K.; Weiner, J.; Warwick, S.I. Size-dependent reproductive output in agricultural weeds. Can. J. Bot. 1991, 69, 442–446. [Google Scholar] [CrossRef]
- Bitarafan, Z.; Andreasen, C. Seed production and retention at maturity of blackgrass (Alopecurus myosuroides) and silky windgrass (Apera spica-venti) at wheat harvest. Weed Sci. 2020, 2, 151–156. [Google Scholar] [CrossRef]
- Bitarafan, Z.; Andreasen, C. Harvest weed seed control: Seed production and retention of Fallopia convolvulus, Sinapis arvensis, Spergula arvensis and Stellaria media at spring oat maturity. Agronomy 2020, 10, 46. [Google Scholar] [CrossRef] [Green Version]
- Andreasen, C.; Streibig, J.C. Evaluation of changes in weed flora in arable fields of Nordic countries—Based on Danish long-term surveys. Weed Res. 2010, 51, 214–226. [Google Scholar] [CrossRef]
- Neuffer, B.; Hurka, H. Colonization history and introduction dynamics of Capsella bursa-pastoris (Brassicaceae) in North America: Isozymes and quantitative traits. Mol. Ecol. 1999, 8, 1667–1681. [Google Scholar] [CrossRef] [PubMed]
- Coquillat, M. Sur Les Plnates Les Plus Communes de La Surface du Globe; Bulletin Mensual Societé Linnéenne: Lyon, France, 1951; Volume 20, pp. 165–170. [Google Scholar]
- Grundy, A.C.; Mead, A.; Burston, S.; Over, T. Seed production of Chenopodium album in completion with field vegetables. Weed Res. 2004, 44, 271–281. [Google Scholar] [CrossRef]
- Rasmussen, I.A. Seed production of Chenopodium album in spring barley sprayed with different herbicides in normal to very low doses. In Proceedings of the 8th EWRS Symposium: Quantitative Approaches in Weed and Herbicide Research and Their Practical Application; European Weed Research Society: Braunschweig, Germany, 1993; pp. 639–646. [Google Scholar]
- Stamp, N.E.; Lucas, J.R. Ecological correlates of explosive seed dispersal. Oecologia 1983, 59, 272–278. [Google Scholar] [CrossRef]
- Sultan, S.E.; Bazzaz, R.A. Phenotypic plasticity in Polygonum persicaria. I. Diversity and uniformity in genotypic norms of reaction to light. Evolution 1993, 47, 1009–1031. [Google Scholar] [CrossRef]
- Sultan, S.E.; Bazzaz, R.A. Phenotypic plasticity in Polygonum persicaria. II. Norms of reaction to soil moisture, ecological breadth, and the maintenance of genetic diversity. Evolution 1993, 47, 1032–1049. [Google Scholar] [CrossRef]
- Meerts, P.; Garnier, E. Variation in relative growth rate and its components in the annual Polygonum aviculare in relation to habitat disturbance and seed size. Oecologia 1996, 108, 438–445. Available online: https://link.springer.com/content/pdf/10.1007/BF00333719.pdf (accessed on 29 March 2022). [CrossRef]
- Grime, J.P.; Hodgson, J.G.; Hunt, R. Comparative Plant Ecology; Allen and Unwin: London, UK, 1988. [Google Scholar]
- Meerts, P. Phenotypic plasticity in the annual weed Polygonum aviculare. Bot. Acta 1995, 108, 414–424. [Google Scholar] [CrossRef]
- Meerts, P. An experimental investigation of life history and plasticity in two cytotypes of Polygonum aviculare subsp. aviculare that coexist in an abandoned arable field. Oecologia 1992, 92, 442–449. Available online: https://0-link-springer-com.brum.beds.ac.uk/content/pdf/10.1007/BF00317471.pdf (accessed on 29 March 2022). [CrossRef] [PubMed]
- Salisbury, E. Weeds and Aliens; Collins: London, UK, 1961; 384p. [Google Scholar]
- Cheplick, G.P. Life-history variation in a native perennial grass (Tridens flavus): Reproductive allocation, biomass partitioning, and allometry. Plant Ecol. 2020, 221, 103–115. [Google Scholar] [CrossRef]
- Kawano, S. Trade-off relationships between some reproductive characteristics in plants with special reference to life history strategy. Bot. Mag. 1981, 94, 285–294. [Google Scholar] [CrossRef]
- Schmid, B.; Bazzaz, F.A.; Weiner, J. Size dependency of sexual reproduction and of clonal growth in two perennial plants. Can. J. Bot. 1995, 73, 1831–1837. [Google Scholar] [CrossRef] [Green Version]
- Lutman, P.J.W.; Wright, K.J.; Berry, K.; Freeman, S.E.; Tatnell, L. Estimation of seed production by Myosotis arvensis, Veronica hederifolia, Veronica persica and Viola arvensis under different competitive conditions. Weed Res. 2011, 51, 499–507. [Google Scholar] [CrossRef]
- Moss, S.R. The production and shedding of Alopecurus myosuroides Huds. seeds in winter cereals crops. Weed Res. 1983, 23, 45–51. [Google Scholar] [CrossRef]
- Moss, S.R. The seed cycle of Alopecurus myosuroides in winter cereals: A quantitative analysis. In Symposium on Integrated Weed Management in Cereals. Proceedings of the EWRS Symposium, Helsinki, Finland, 4–6 June 1990; European Weed Research Society: Wageningen, The Netherlands, 1990; pp. 27–35. [Google Scholar]
- Ewing, A.L.; Menke, J.W. Reproductive potential of Bromus mollis and Avena barbata under drought conditions. Madroño 1983, 30, 159–167. Available online: https://0-www-jstor-org.brum.beds.ac.uk/stable/41424422 (accessed on 29 March 2022).
- Heimann, B.; Cussans, G.W. The importance of seeds and sexual reproduction in the population biology of Cirsium arvense—A literature review. Weed Res. 1996, 36, 493–503. [Google Scholar] [CrossRef]
- Klinkhamer, P.G.L.; De Jong, T.J.; Van der Meijden, E. Production, dispersal and predation of seeds in the biennial Cirsium Vulgare. J. Ecol. 1988, 76, 403–414. Available online: https://0-www-jstor-org.brum.beds.ac.uk/stable/2260602 (accessed on 29 March 2022). [CrossRef]
- Rottele, M.A. Population Dynamics of Cleavers (Galium aparine L.). Ph.D. Thesis, University of Hohenheim, Stuttgart, Germany, 1980; p. 133. [Google Scholar]
Figure 1.
Seed traps placed in (a) wheat and (b) oat fields in 2018.

Figure 2.
Weather data during the experiments: (a) daily average temperature, (b) wind speed, and (c) precipitation. Measurement height: 2, 2, and 1.5 m above ground level for temperature, wind speed, and precipitation, respectively.
Figure 2.
Weather data during the experiments: (a) daily average temperature, (b) wind speed, and (c) precipitation. Measurement height: 2, 2, and 1.5 m above ground level for temperature, wind speed, and precipitation, respectively.

Figure 3.
Relationship between plant dry biomass and seed number per plant for (a) Anagallis arvensis, (b) Capsella bursa-pastoris, (c) Chenopodium album, (d) Geranium molle, (e) Persicaria maculosa, (f) Polygonum aviculare, (g) Silene noctiflora, and (h) Sonchus arvensis. The red points correspond to observations in 2018, and the blue points correspond to observations in 2017. Regression lines are shown for both years. Where year did not affect the relationship significantly, the data from the two years were pooled together (c,e).

Figure 4.
Relationship between plant dry biomass and seed number per plant for (a) Veronica persica and (b) Viola arvensis. The red points correspond to observations in 2018, and the blue points correspond to observations in 2017. Regression lines are shown for both years.
Figure 4.
Relationship between plant dry biomass and seed number per plant for (a) Veronica persica and (b) Viola arvensis. The red points correspond to observations in 2018, and the blue points correspond to observations in 2017. Regression lines are shown for both years.

Figure 5.
Relationship between plant dry weight and seed number per plant for (a) Alopecurus myosuroides, (b) Apera spica-venti, (c) Bromus hordeaceus, (d) Cirsium arvense, and (e) Galium aparine growing in two wheat fields. The red points correspond to observations in 2018 and the blue points correspond to observations in 2017. Regression lines are shown for both years. Where year did not affect the relationship significantly, the data from the two years were pooled together (b,e). Bromus hordeaceus was only observed in 2017 and C. arvense only produced seeds in 2018.


Table 1.
Average plant dry weight (g) with standard deviation (SD) and total seed production (number per plant) of weed species in oat fields in 2017 and 2018. p values shown for difference between the years.
Table 1.
Average plant dry weight (g) with standard deviation (SD) and total seed production (number per plant) of weed species in oat fields in 2017 and 2018. p values shown for difference between the years.
| Weed Species | Plant Dry Weight (g) (±SD) | Total Seed Production (±SD) | ||||
|---|---|---|---|---|---|---|
| 2017 | 2018 | p-value | 2017 | 2018 | p-value | |
| Anagallis arvensis | 0.45 (0.49) | 0.32 (0.22) | p = 0.484 | 293.2 (316.0) | 428.1 (341.4) | p = 0.371 |
| Capsella bursa-pastoris | 0.80 (0.96) | 1.87 (2.08) | p = 0.156 | 1456 (2091.8) | 7444 (10053.5) | p = 0.081 |
| Chenopodium album | 2.40 (1.53) | 5.64 (5.90) | p = 0.109 | 1875.8 (944.1) | 4910.1 (4660.6) | p = 0.058 |
| Geranium molle | 0.51 (0.49) | 0.31 (0.16) | p = 0.256 | 117.3 (85.1) | 37.3 (65.5) | p ≤ 0.050 |
| Persicaria maculosa | 1.55 (1.45) | 0.89 (0.44) | p = 0.189 | 413.9 (383.2) | 311.4 (173.6) | p = 0.451 |
| Polygonum aviculare | 5.55 (3.34) | 3.05 (2.69) | p = 0.082 | 1514.8 (841.4) | 549.9 (727.5) | p ≤ 0.050 |
| Silene noctiflora | 1.49 (0.74) | 0.50 (0.13) | p ≤ 0.001 | 539.8 (233.8) | 102.6 (56.6) | p ≤ 0.001 |
| Sonchus arvensis | 13.18 (4.60) | 12.48 (4.76) | p = 0.744 | 460.6 (243.5) | 1954.5 (819.0) | p ≤ 0.001 |
| Veronica persica | 0.70 (0.59) | 0.12 (0.08) | p ≤ 0.010 | 511.7 (251.0) | 90.5 (45.4) | p ≤ 0.001 |
| Viola arvensis | 0.81 (0.93) | 0.13 (0.04) | p ≤ 0.050 | 203.7 (156.8) | 22.0 (20.4) | p ≤ 0.010 |
Table 2.
Average plant dry weight (g) with standard deviation (SD) and total seed production of weed species in wheat fields in 2017 and 2018. p-values shown for difference between the years.
Table 2.
Average plant dry weight (g) with standard deviation (SD) and total seed production of weed species in wheat fields in 2017 and 2018. p-values shown for difference between the years.
| Weed Species | Plant Dry Weight (g) (±SD) | Total Seed Production (±SD) | ||||
|---|---|---|---|---|---|---|
| 2017 | 2018 | p-value | 2017 | 2018 | p-value | |
| Alopecurus myosuroides | 1.95 (1.47) | 6.17 (2.75) | p ≤ 0.001 | 953.3 (663.8) | 3337.6 (1415.1) | p ≤ 0.001 |
| Apera spica-venti | 0.69 (0.71) | 4.59 (1.56) | p ≤ 0.001 | 1191.9 (952.4) | 5678.7 (2610.5) | p ≤ 0.001 |
| Bromus hordeaceus | 2.55 (1.75) | No plants | --- | 894.2 (627.9) | No plants | --- |
| Cirsium arvense | 31.84 (19.03) | 16.97 (7.65) | p ≤ 0.05 | None | 1647.6 (588.4) | --- |
| Galium aparine | 8.34 (8.36) | 0.53 (0.25) | p ≤ 0.01 | 616.5 (627.9) | 37.3 (16.4) | p ≤ 0.01 |
Publisher’s Note: MDPI stays neutral with regard to jurisdictional claims in published maps and institutional affiliations. |
© 2022 by the authors. Licensee MDPI, Basel, Switzerland. This article is an open access article distributed under the terms and conditions of the Creative Commons Attribution (CC BY) license (https://creativecommons.org/licenses/by/4.0/).
Share and Cite
MDPI and ACS Style
Bitarafan, Z.; Andreasen, C. Fecundity Allocation in Some European Weed Species Competing with Crops. Agronomy 2022, 12, 1196. https://0-doi-org.brum.beds.ac.uk/10.3390/agronomy12051196
AMA Style
Bitarafan Z, Andreasen C. Fecundity Allocation in Some European Weed Species Competing with Crops. Agronomy. 2022; 12(5):1196. https://0-doi-org.brum.beds.ac.uk/10.3390/agronomy12051196
Chicago/Turabian StyleBitarafan, Zahra, and Christian Andreasen. 2022. "Fecundity Allocation in Some European Weed Species Competing with Crops" Agronomy 12, no. 5: 1196. https://0-doi-org.brum.beds.ac.uk/10.3390/agronomy12051196
Note that from the first issue of 2016, this journal uses article numbers instead of page numbers. See further details here.