Article

Assessment of Soil Contamination Using GIS and Multi-Variate Analysis: A Case Study in El-Minia Governorate, Egypt

by
Amr A. Hammam
1,*,
Wagih S. Mohamed
1,
Safa Essam-Eldeen Sayed
1,
Dmitry E. Kucher
2 and
Elsayed Said Mohamed
2,3,*
1
Soil Science Department, Faculty of Agriculture, Minia University, El-Minia 61519, Egypt
2
Department of Environmental Management, Institute of Environmental Engineering, People’s Friendship University of Russia (RUDN University), 6 Miklukho-Maklaya Street, 117198 Moscow, Russia
3
National Authority for Remote Sensing and Space Sciences, Cairo 11843, Egypt
*
Authors to whom correspondence should be addressed.
Submission received: 4 April 2022 / Revised: 12 May 2022 / Accepted: 13 May 2022 / Published: 16 May 2022
(This article belongs to the Special Issue Environmental Ecological Remediation and Farming Sustainability)

Abstract

:
The issue of soil contamination is one of the most important subjects that interests decision-makers all over the world. It is also related to soil fertility and food security. The soils adjacent to the drains in Egypt suffer from increasing concentration of heavy metals, which negatively affects soil and crop quality. Precise spatial distribution maps of heavy metals are an essential key to mitigating the negative impacts on the ecosystem. Sixty random soil locations adjacent to the El-Moheet drainage were chosen on the west side of the Nile River, El-Minia governorate, Egypt. Six heavy metals (Cr, Co, Cu, Cd, Pb, and Zn) were selected to generate their spatial pattern maps using ordinary Kriging (OK). Principal component analysis (PCA) and contamination factors (CF) were applied to evaluate soil contamination levels in the study area. The results showed that the Gaussiang model was a high fit for soil pH, and Pb, the Exponential model was fit for EC, Stable model was fit for OC, Co, Cu, and Cd. In addition, the Spherical model was fit for both Cr and Zn. The MSE values were close to zero in all selected metals, while the values of RMSSE were close to one. The results showed that the soil heavy metal concentrations were grouped into two clusters using PCA. Furthermore, three contamination degrees were obtained (moderate, considerable, and very high), with about 70.7% of the study area characterized by considerable heavy metals concentration, where the average heavy metals concentration (mg kg−1) in this degree was 91.23 ± 19.5, 29.44 ± 5.2, 53.83 ± 10.2, 1.12 ± 0.3, 36.04 ± 18.0, and 101.29 ± 35 for Cr, Co, Cu, Cd, Pb, and Zn, respectively. The current results reflect the mismanagement and use of low-quality water for irrigation in the study area, which increased the toxic element concentration in soil surface layers. In the end, the results of spatial distribution maps of pollutants and their degrees could support decision-makers as a basis for developing appropriate mitigation plans for heavy metals.

1. Introduction

Soil contamination is a serious phenomenon that threatens the ecosystem in most countries, especially third-world countries [1,2]. As the heavy metal concentrations in the soil exceed the permissible limits, negative impacts on the crop quality appear, thereby reflected in the food chain [3]. The Egyptian soils suffered from increasing levels of soil contamination during the last two decades, which caused degradation of soil fertility and quality in the Nile valley and Delta [4,5]. Anthropogenic activities cause negative impacts on natural resources and agricultural activities. Soil contamination is related to some activities such as irrigation with wastewater and intensive use of pesticides, herbicides, and fertilizers [6,7,8]. The deficiency of fresh water for irrigation prompted the farmers to use low-quality water (drainage and sewage) from various sources in irrigation, thereby leading to the accumulation of heavy metals in the rhizosphere zone [9,10]. The increase of salt accumulation and heavy metals in the rhizosphere zone may cause toxicity, especially for sensitive crops, and impacts human health [11,12]. The soils located close to the agricultural drainages in the Nile valley and Delta are susceptible to increasing contamination levels. Many researchers have studied this phenomenon and its negative effects on soil quality, plant production, and biological diversity [9,13]. For instance, the soils located near the drainage of Bahr Al-Baqr are vulnerable to increased heavy metal concentrations such as Cr, Cu, Cd, Mn, Zn, Ni, and Pb, such as the soil adjacent to the rest of the drainages of the north Nile Delta and valley [14]. On the contrary, the soils irrigated by the Nile water were characterized by low to moderate contamination levels in the middle of the Nile [15]. Some authors showed that the concentration of copper, nickel, vanadium, chromium, and zinc does not have high environmental pollution impacts. Hence, soil contamination assessment has become necessary for decision-makers to find appropriate solutions to reduce the impact of rising soil pollution [16]. The first steps toward properly addressing soil contamination are understanding the spatial distribution of heavy metals and knowing the sources of contamination. Hence, geographic information systems (GIS) help mapping soil properties spatial distribution [17,18]. The geostatistical analysis is a technique that allows analyzing spatial data and then predicting the unsampled data’s location. There are various geostatistical analysis methods, such as Kriging and Inverse Distance Weighting (IDW). The semivariogram models of Kriging can calculate the unsampled values with high accuracy. They depend on calculating the inter-sample distances. The models calculate the relationships among the variables and the nugget, sill values, and range of the data parameter [19]. Understanding the relationship among heavy metals is necessary for soil contamination assessment, especially with a large amount of data. In many cases, some elements have a higher impact on pollution than others [20]. Accordingly, principal component analysis (PCA) can solve this issue, as it helps reduce many variables to a few comprehensive principal components to model the regressions between the different variables [7,21]. Many studies have shown the preference for using the PCA to assess soil and water quality. PCA and agglomerative hierarchical clustering (AHC) successfully classified water quality into three categories. The results were satisfactory compared to other models where PCA was more significant than the others. Furthermore, AHC examines distances between samples, where most similar points are grouped, forming one cluster. AHC is an unsupervised classification strategy of merging the closest pair of clusters recursively. Because of the recursive structure, the most critical part of AHC is how to automatically stop the process at the point when the clustering error rate reaches its lowest possible value [22]. In addition, the PCA had the advantage of processing a huge amount of data without being restricted to a specific number [23]. PCA was also used to determine different sources of soil contamination, either industrial or agricultural activities, and the contribution percentage of heavy metals involved in soil contamination [24,25]. On the other hand, other studies used PCA to delineate the soil fertility status to improve the efficiency of fertilizers in the site-specific management zones [26]. The outputs of PCA could help to understand patterns of soil variables and their trends. Identify suitable solutions to remediate soil contamination and make potential ambitious plans to achieve sustainable development and improve the quality of food production. The limitation of fresh irrigation water is one of the most serious problems of agricultural production in Egypt, which makes farmers irrigate their fields from unsafe sources, or in a more precise sense, polluted sources, such as agricultural drains and renewable groundwater [27]. Moreover, the excessive use of chemical fertilizers to increase the yield is one of the sources of pollution in Egyptian lands [28].
The current study aims to assess soil contamination with some selected heavy metals by mapping the spatial distribution of heavy metals in the study area, delineating the contamination levels using PCA, and determining the contamination degree of the study area. The objectives are to study some soil properties and total concentrations of Cr, Co, Cu, Cd, Pb, and Zn in an area subject to irrigation with wastewater from El-Moheet drainage.

2. Materials and Methods

2.1. Discerption of the Study Area

The area under study is adjacent to the El-Moheet drainage on the west side of the Nile River, El-Minia governorate, Egypt. El-Moheet drainage is located a few kilometers to the west of Minya Governorate and passes through Abu Qurqas district from the south to Samalut in the north. For nearly 100 years, southern parts have received wastes generated from the Abu Qurqas sugar plant. The study area covers about 2894 hectares and is located between 30°43′09″ to 30°48′51″ Longitude and 27°56′30″ to 82°04′35″ Latitude (Figure 1). The surface of the study area is flat to almost flat as the elevation ranges between 38 and 41 m above sea level toward the north. The study area is under an arid climate with a hot summer, warm winter, high evaporation, and low rainfall intensity. The meteorological station of El Minia Governorate (EMA, 2020) was recorded for 35 years (1985–2020) as follows: the average monthly temperature ranges between 12.9 °C in January and 30.2 °C in August. Rainfall is rare throughout this region; the total mean precipitation is 28.0 mL per year [29]. The studied area is alluvial deposits from the Nile River, and the dominant soil texture ranges between silt and clay.

2.2. Anthropogenic Activities in the Study Area

An administered questionnaire and meetings with farmers have been done to stand on common crops and irrigation sources in the study area. The most common cultivated crops in the study area are wheat, maize, and sugar beet. The freshwater from the Nile is the main irrigation source in the agricultural sector. The Egyptian farmer usually depends on his personal experience in determining the quantities of added chemical and organic fertilizers without considering the recommendations issued by the responsible authorities [30,31]. The farming system in the study area is dependent on a surface irrigation system using freshwater and groundwater. As a result of freshwater deficiency, some farmers illegally consumed water from El-Moheet drainage for irrigation.
Figure 2 shows the steps of the integration methodology between the inputs and outputs throughout the current work.

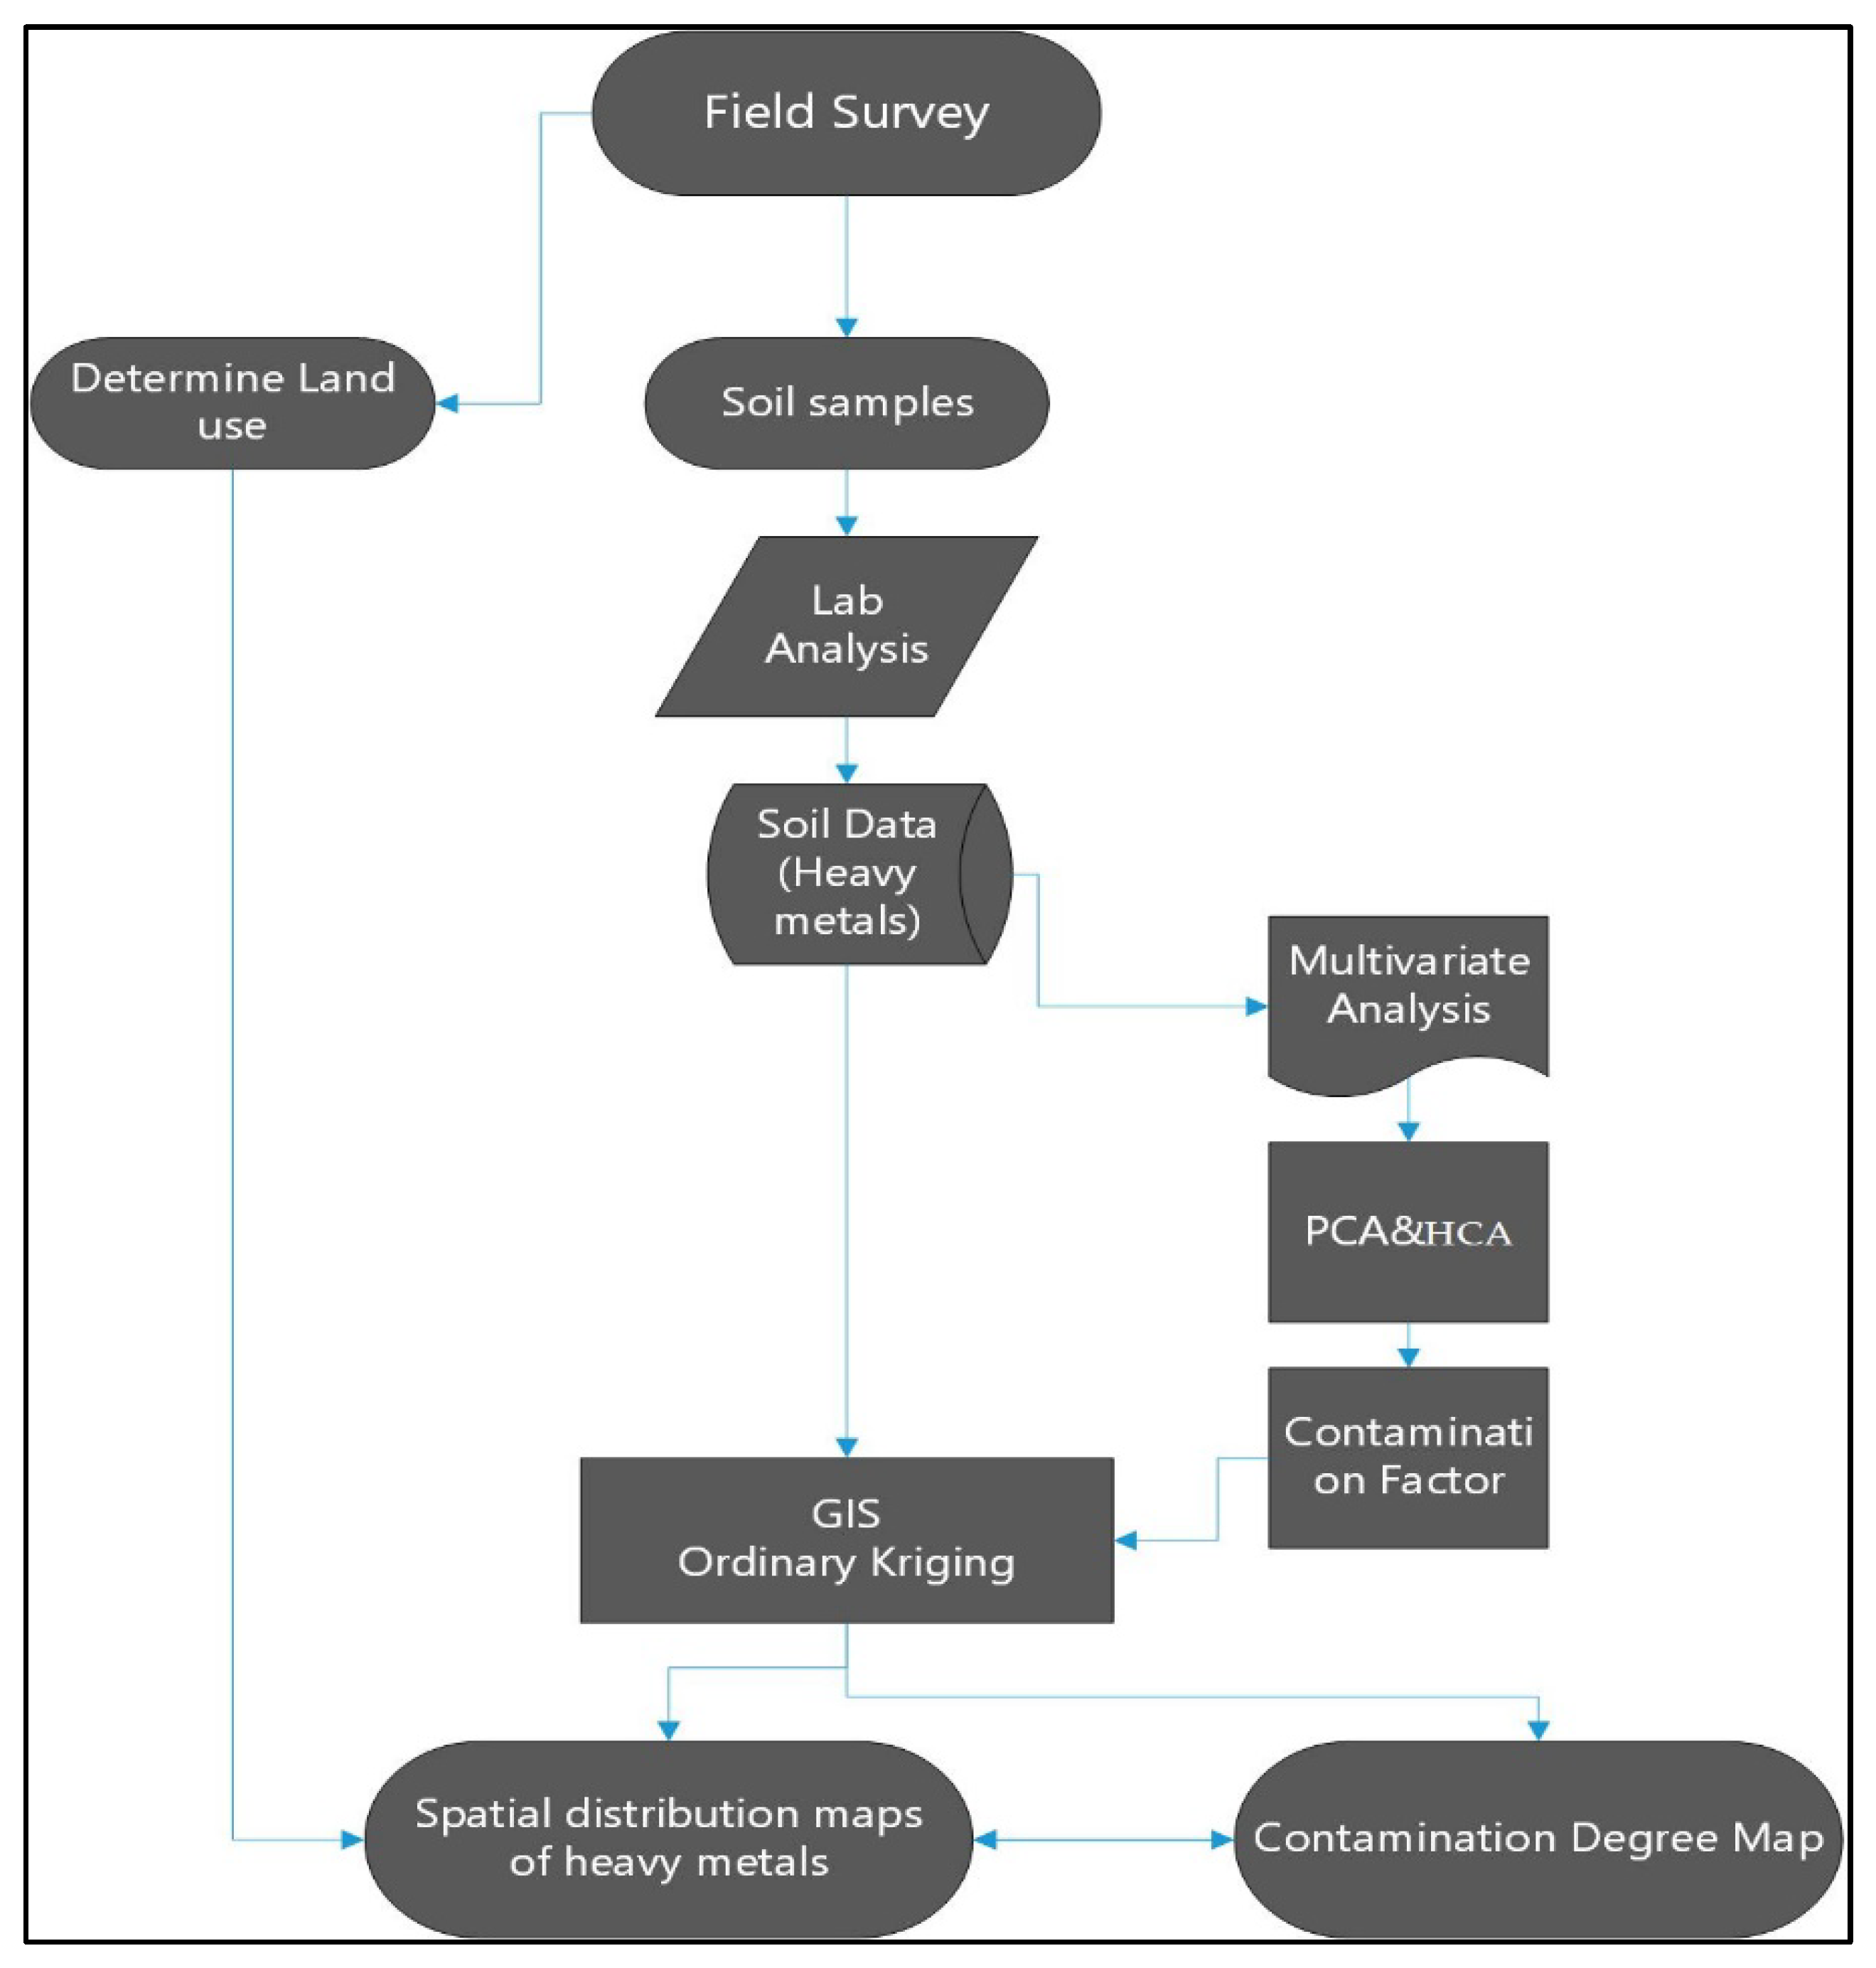
2.3. Field Study and Soil Analysis

Sixty random soil locations adjacent to the El-Moheet drainage, were selected to test the soil contamination degree. The coordinates of each location have been recorded using GPS. Collected soil samples were air-dried and ground to pass through a 2-mm-sieve and stored at approximately 4 °C in plastic bags until analysis. The Bouyoucous hydrometer method was used to determine particle size distribution [32]. Soil pH was measured in soil suspension at 1:2.5 (soil:water) using the pH-meter Jenway. Soil electrical conductivity (ECe) was measured in soil paste extract using an EC-meter Jenway. The dichromate oxidation method was used to determine soil organic carbon (OC) according to the Walkley and Black procedure [33]. Concentrations of Cr, Co, Cu, Cd, Pb, and Zn were determined in 0.25 g of soil samples. Soil samples were digested with 7 mL of concentrated nitric acid and 3 mL of hydrofluoric acid [34] at 200 °C in ETHOS UP microwave digester unit using the inductively coupled plasma mass spectrometry (Thermo ICP-MS model iCAP-RQ).

2.4. Contamination Indices

The contamination factor (CF) of each metal of the studied heavy metals was calculated by dividing each measured heavy metal’s total concentration by the background value (chemical composition of the upper continental crust) according to Taylor and Mclennan (1995) [35]. The background values of the studied heavy metals were Cr = 35, Co = 10, Cu = 25, Cd = 0.1, Pb = 20, and Zn = 71 mg kg−1.
Hakanson [36] distinguished four levels of CF as follows: CF ≤ 1 (low contamination), 1 < CF ≤ 3 (moderate contamination), 3 < CF ≤ 6 (considerable contamination), and 6 ≤ CF (high contamination). Degree of contamination (DC) according to Hakanson [36] indicates contamination of multi-metal and was calculated as: for each sample. There are four levels of contamination based on the value of the degree of contamination: DC < 8 (low contamination), 8 ≤ DC < 16 (moderate contamination), 16 ≤ DC < 32 (considerable contamination), and 16 ≤ DC < 32 (very high contamination).

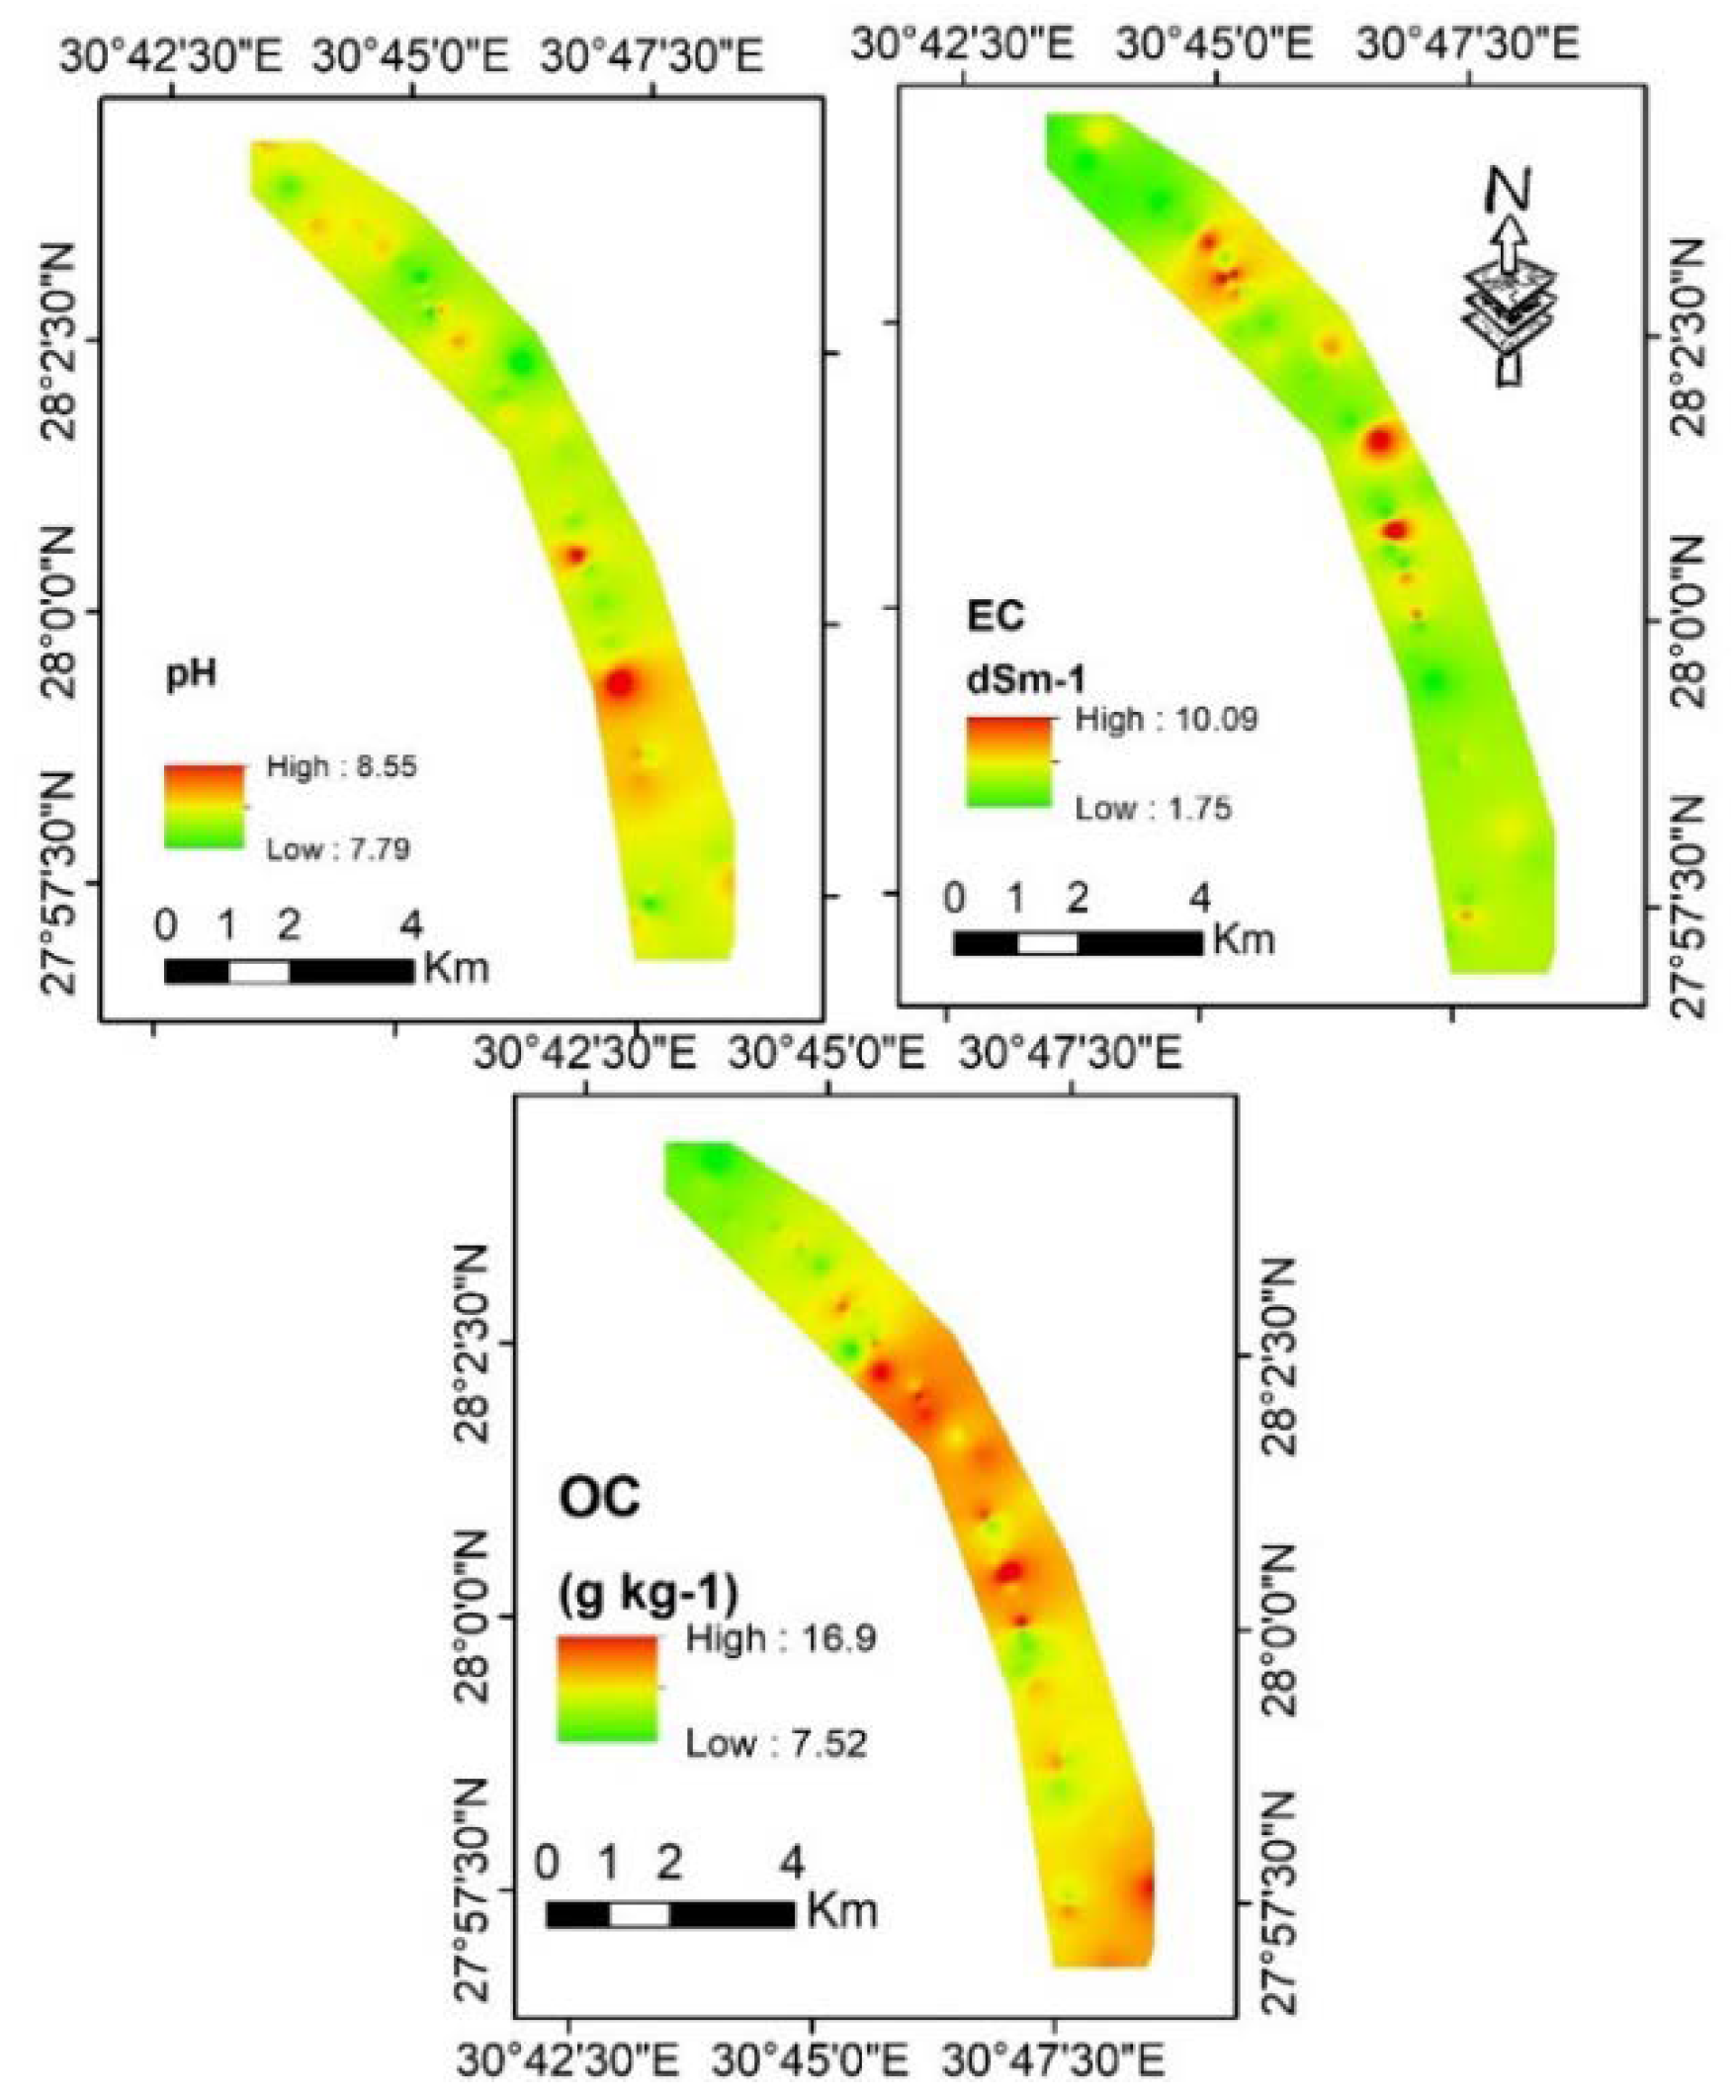
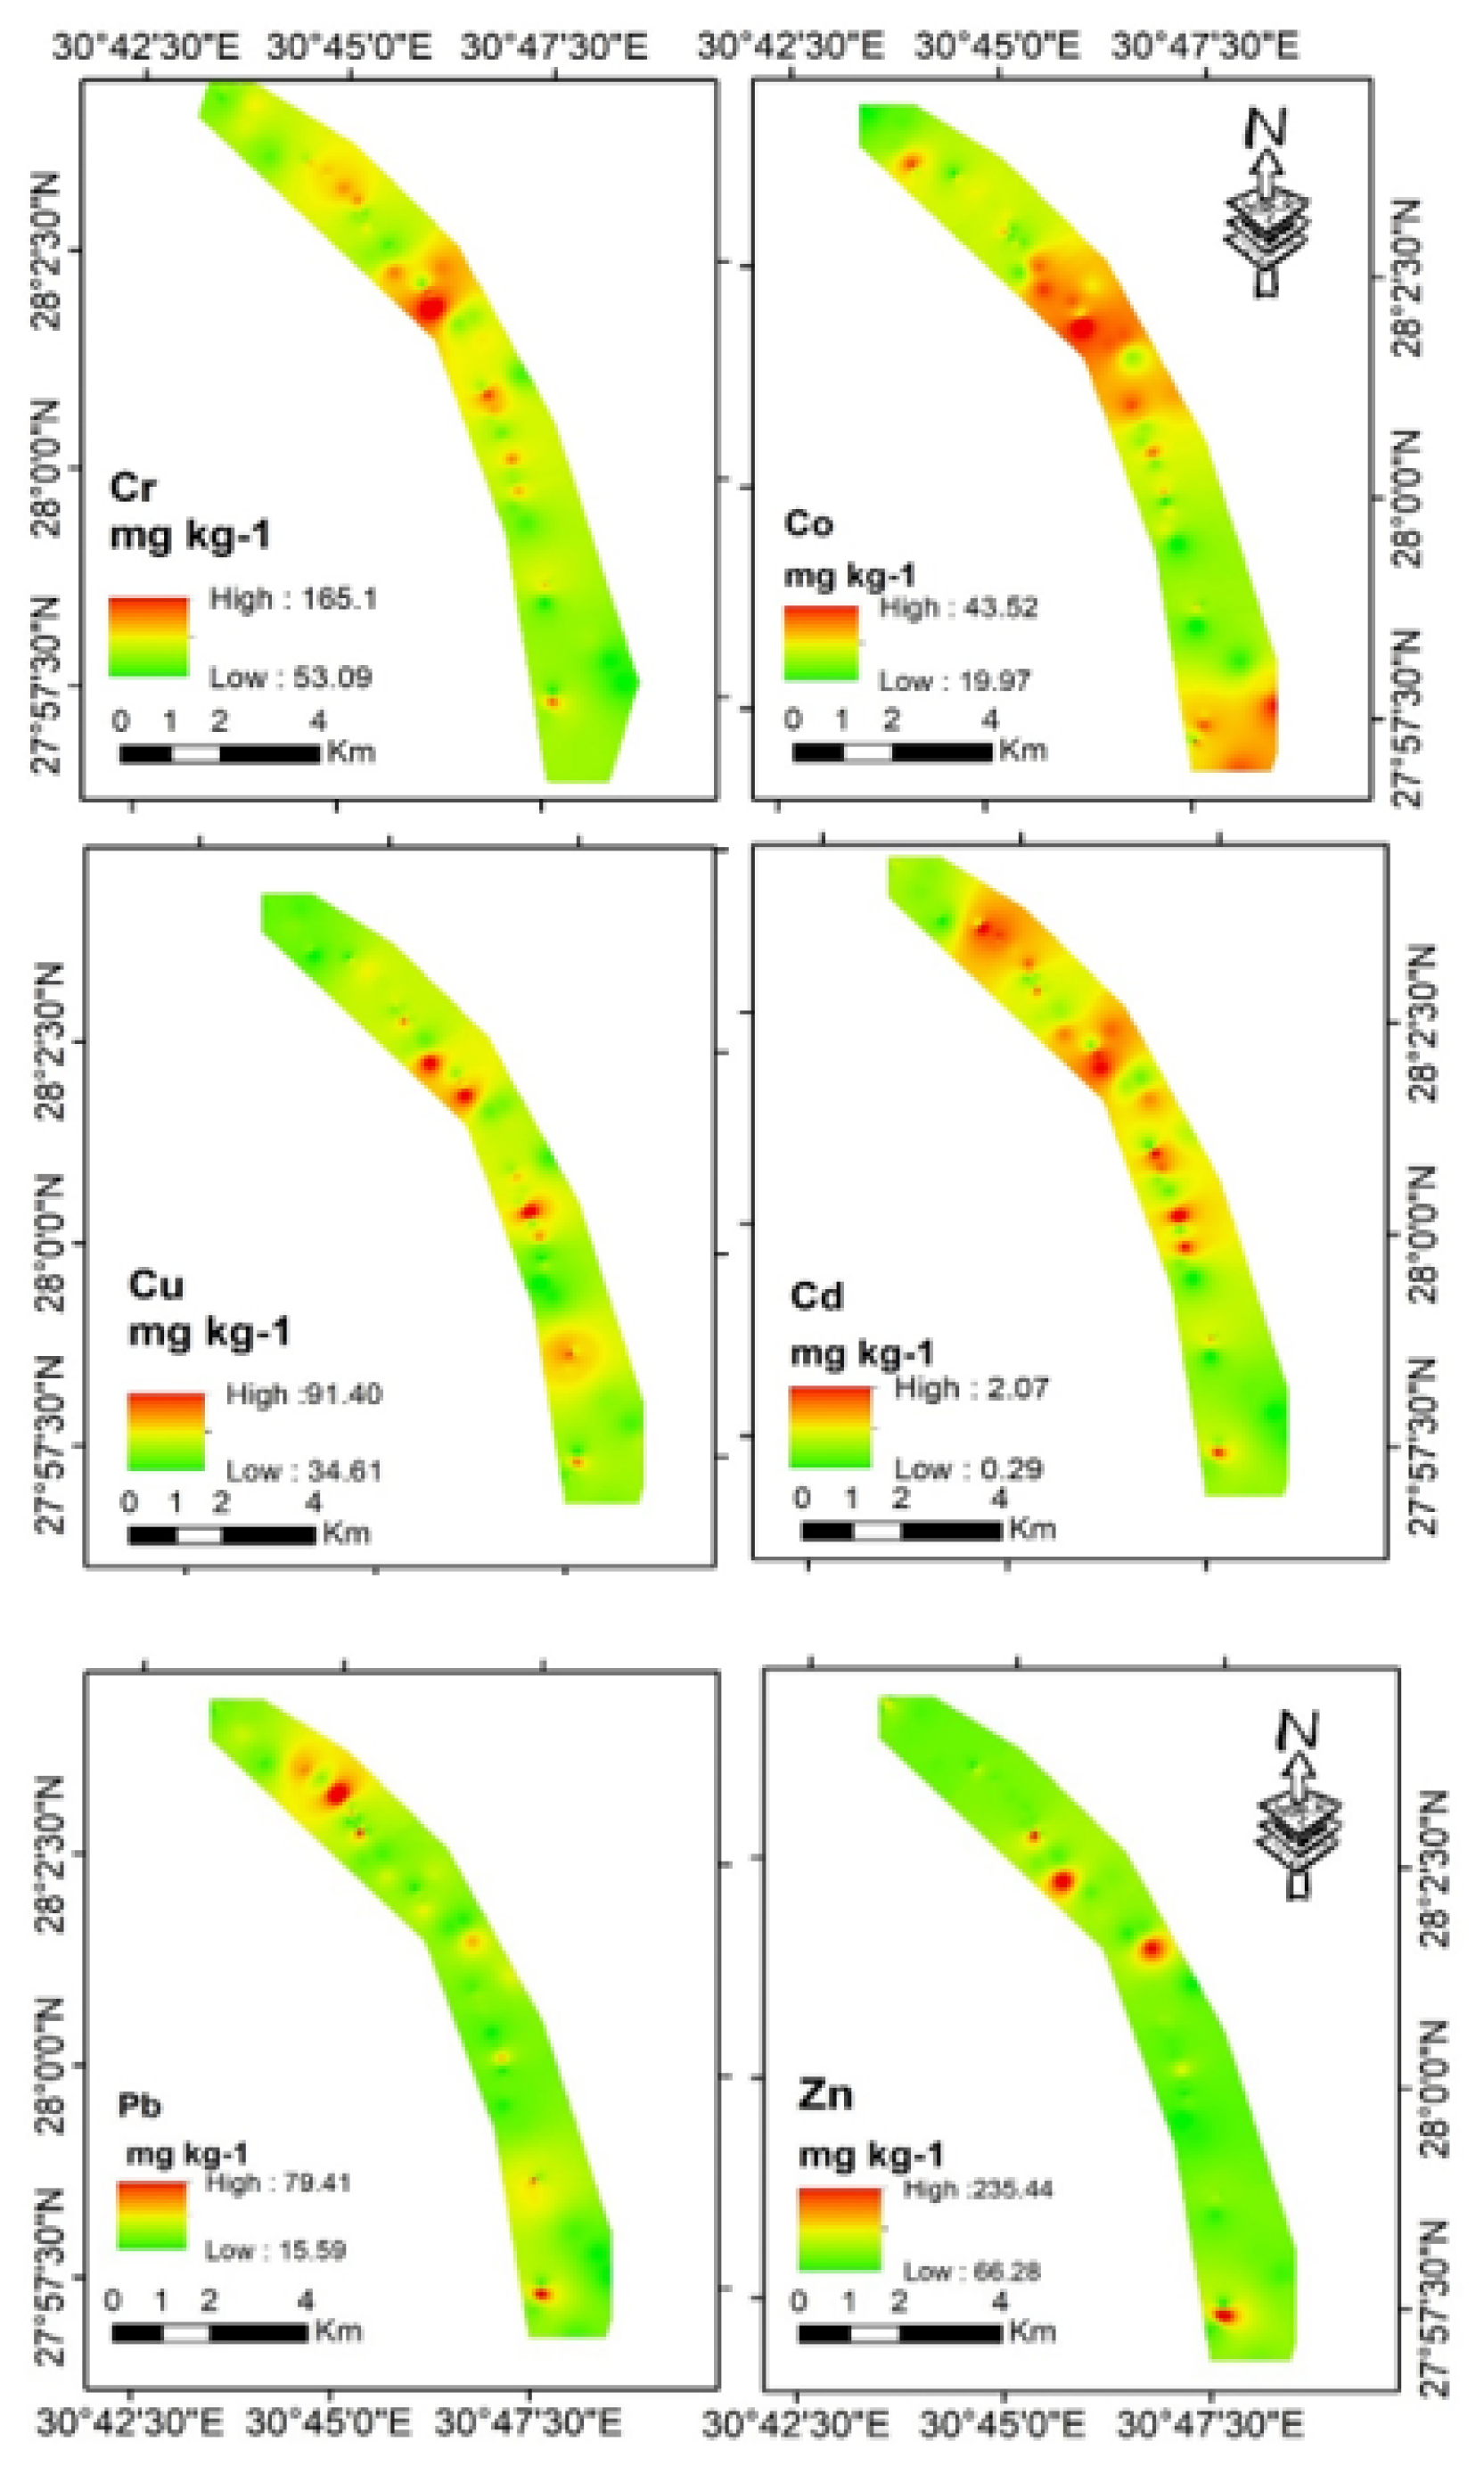
2.5. Spatial Variability Maps of Some Soil Properties and Heavy Metals

The spatial distribution maps of soil parameters were carried out using the interpolation Kriging method to identify the various patterns of ECe, pH, OC, and selected soil heavy metals (Cr, Co, Cu, Cd, Pb, and Zn). The Kriging interpolation method [37] is involved in the geostatistical analyses in ArcGIS software 10.4. Descriptive statistical analyses were done to identify the normal distribution of the data using the Shapiro–Wilk test, and the upper and lower values and outlier values using SPSS software version 22. Since the data were not subject to a normal distribution, based on histogram and normal QQPlots, the transformations were applied using logarithmic methods to make the data as possible as close to the normal distribution, so that the data would be suitable for derivation and statistical analysis and suitable for the assumption of equal variance. The unmeasured values of soil heavy metals were predicted using a suitable model among the semivariogram models according to their accuracy. Three parameters were used to test the model’s strength; the nugget, the sill, and the range [38].
Semi-variogram models (Gaussian, Exponential, Stable, and Spherical) were used in the current study to determine the best model fitted for the selected heavy metals. The accuracy of the different models has been evaluated based on the mean standardized error (MSE), root-mean-square error (RMSE), and average standard error (ASE), according to Johnston et al., 2001 [39]. The closer values of ASE to zero and the nearest values of RMSSE to one indicated the higher accuracy of the model and vice versa [40].

2.6. Statistical and Principal Component Analysis

All statistical analyses were conducted operating the XLSTAT 2021 add-in for Microsoft Office Excel. Principal component analysis is reducing data into groups named; principal components (PCs) or factors. XLSTAT 2021 was used to achieve PCA to reduce the selected variables in the current study to a new dimension using orthogonal transformation to demonstrate most of the variance. PCA produces some PCs equal to the number of variables, and the selection of PCs is based on eigenvalues [41]. The resulting PCs could estimate the correlations between them using factor loading. Hierarchical cluster analysis (HCA) was used for clustering the heavy metal data to study their behavior, origins, and sources. This analysis facilitates understanding the correlation between the different heavy metals [23].

2.7. Remote Sensing and Image Processing

The supervised imaging classification of the study area around the El-Moheet drainage was carried out using the satellite image of the Operational Land Imager (OLI), which acquired data on 20 June 2021, with a spatial resolution of 30 m. The image preprocessing was done based on the radiometric and atmospheric calibrations using the ENVI software 5.3. The satellite image was classified using the supervised maximum likelihood classification to obtain a land-use map [42].

3. Results and Discussion

3.1. Soil Properties and Heavy Metals of the Study Area

The soil texture of the study area is clay. Quantitative data described in Table 1 and Figure 3 showed soil pH, EC, and OC. Soil pH ranged between 7.79 and 8.56, with an average of 8.12 ± 0.14. Regarding ECe values, descriptive data indicated that the study area has a wide range of ECe varying from 1.76 to 10.1 dS m−1 (4.04 ± 1.8 dS m−1). The ECe values < 4 dS m−1 relatively occupied 66.7% of the study area and the rest 33.3% recorded ECe values > 4 dS m−1 [43]. Meanwhile, according to the agronomic classification of soil salinity [12,43], only one sample had ECe < 2 dS m−1 (non-saline), 65% of the samples classified as slightly saline soils (2–4 dS m−1), 26.7% recorded ECe between 4 and 8 dS m−1 (saline soils), and 6.7% with ECe values 8–16 dS m−1 classified as strongly saline soils. The obtained data revealed that soil organic carbon varied between 7.52 and 16.9 (12.64 ± 2.63) mg kg−1.
Descriptive statistics for total concentrations of the investigated Cr, Co, Cu, Cd, Pb, and Zn are detailed in Table 1. The chromium total concentration ranged between 53.09 and 165.96 with a mean of 82.63 ± 22.29 mg kg−1. Cobalt concentration varied from 19.97 to 43.52 with an average of 28.62 ± 5.59 mg kg−1. The range of total cadmium concentration was between 0.29 and 2.07, with an average of 0.88 ± 0.46 mg kg−1. The total content of lead has an average of 31.54 ± 16.44 mg kg−1. Total concentrations of copper and zinc as microelements were 34.61–91.4 (51.57 ± 11.43) mg kg−1 and 66.28–235.44 (93.91 ± 32.4) mg kg−1, respectively (Figure 4).
The obtained results agreed with other investigations in the Abo-Korkas district [30,44]. All means of the studied heavy metals were higher than the chemical composition of the upper continental crust according to Taylor and Mclennan, 1995 [35]; and the natural concentration of heavy metals in rocks according to Bradl, 2005 [45]. The wide range of heavy metal concentrations in the study area is related to the great diversity in the quantities used of chemical and organic fertilizers by farmers [30,46], in addition to the use of polluted water from “El-Moheet drainage” in the irrigation process [44].
Chromium is one of the toxic heavy metals found in the soil naturally from the processes of weathering minerals in the earth’s crust or because of industrial residues reaching the soil [47]. Cobalt is an important element in plant nutrition because of its important role in the growth of leguminous plants when it is available in low concentration. The increase in cobalt concentration in soil causes many problems for the growing plants, such as deficiencies in photosynthesis and nitrogen metabolism in plants [48]. Fertilization is one of the most important sources of cobalt contamination [49]. Copper and zinc are essential microelements in plant nutrition. However, high concentrations of them cause a reduction in plant production. Soil contaminated with cadmium is linked with the intensive use of phosphate fertilizers, pesticides, and sewage sludge [50]. El-Moheet drainage contains those heavy metals and other salts generated through the agricultural drainage process. Therefore, using such a water in irrigating the neighboring soils is a source of contamination with the studied heavy metals. Moreover, El-Moheet drainage receives the waste generated from the Abu Qurqas sugar plant.

3.2. Geostatistical Analysis and Mapping

Table 2 illustrates the parameters of semi-variogram modeling. The accuracy parameter of the best fit model among the semi-variograms was calculated using RMSE, MSE, RMSSE, and ASE. The results showed that the Gaussiang model was highly fit for soil pH, and Pb, the Exponential model was fit for EC, and the Stable model was fit for OC, Co, Cu, and Cd. Furthermore, the spherical model was fit for both Cr and Zn. The MSE values were close to zero for all selected parameters, while the values of RMSE and RMSSE were close to one. However, values of ASE were small in all the resulted models.
The results of the Semi-variogram showed that the nugget values of pH, EC, OC, Cr, Cu, Cd, Pb, and Zn ranged between 0 and 0.12 for all models, except for the Stable model of Co as the nugget was 0.61. The nugget/sill ratio of all models’ parameters ranged between 0 and 0.68. In addition, the results showed a strong spatial dependence (SDC) of all models, which varied between moderate and strong predictions.
The spatial distribution maps of the studied heavy metals showed their high concentrations observed in the northern parts of the study area. These parts are adjacent to urban areas, where the irrigation channels and drainages are subject to various pollution sources. These findings are consistent with similar studies in the Nile valley and Delta [14,23,51]. On the other hand, southern parts of the study area were characterized by low concentrations of most of the selected elements except for Co, as its concentrations were significantly high, which may be associated with the human activities and the agricultural management practices in these areas in terms of fertilization use [30,46].

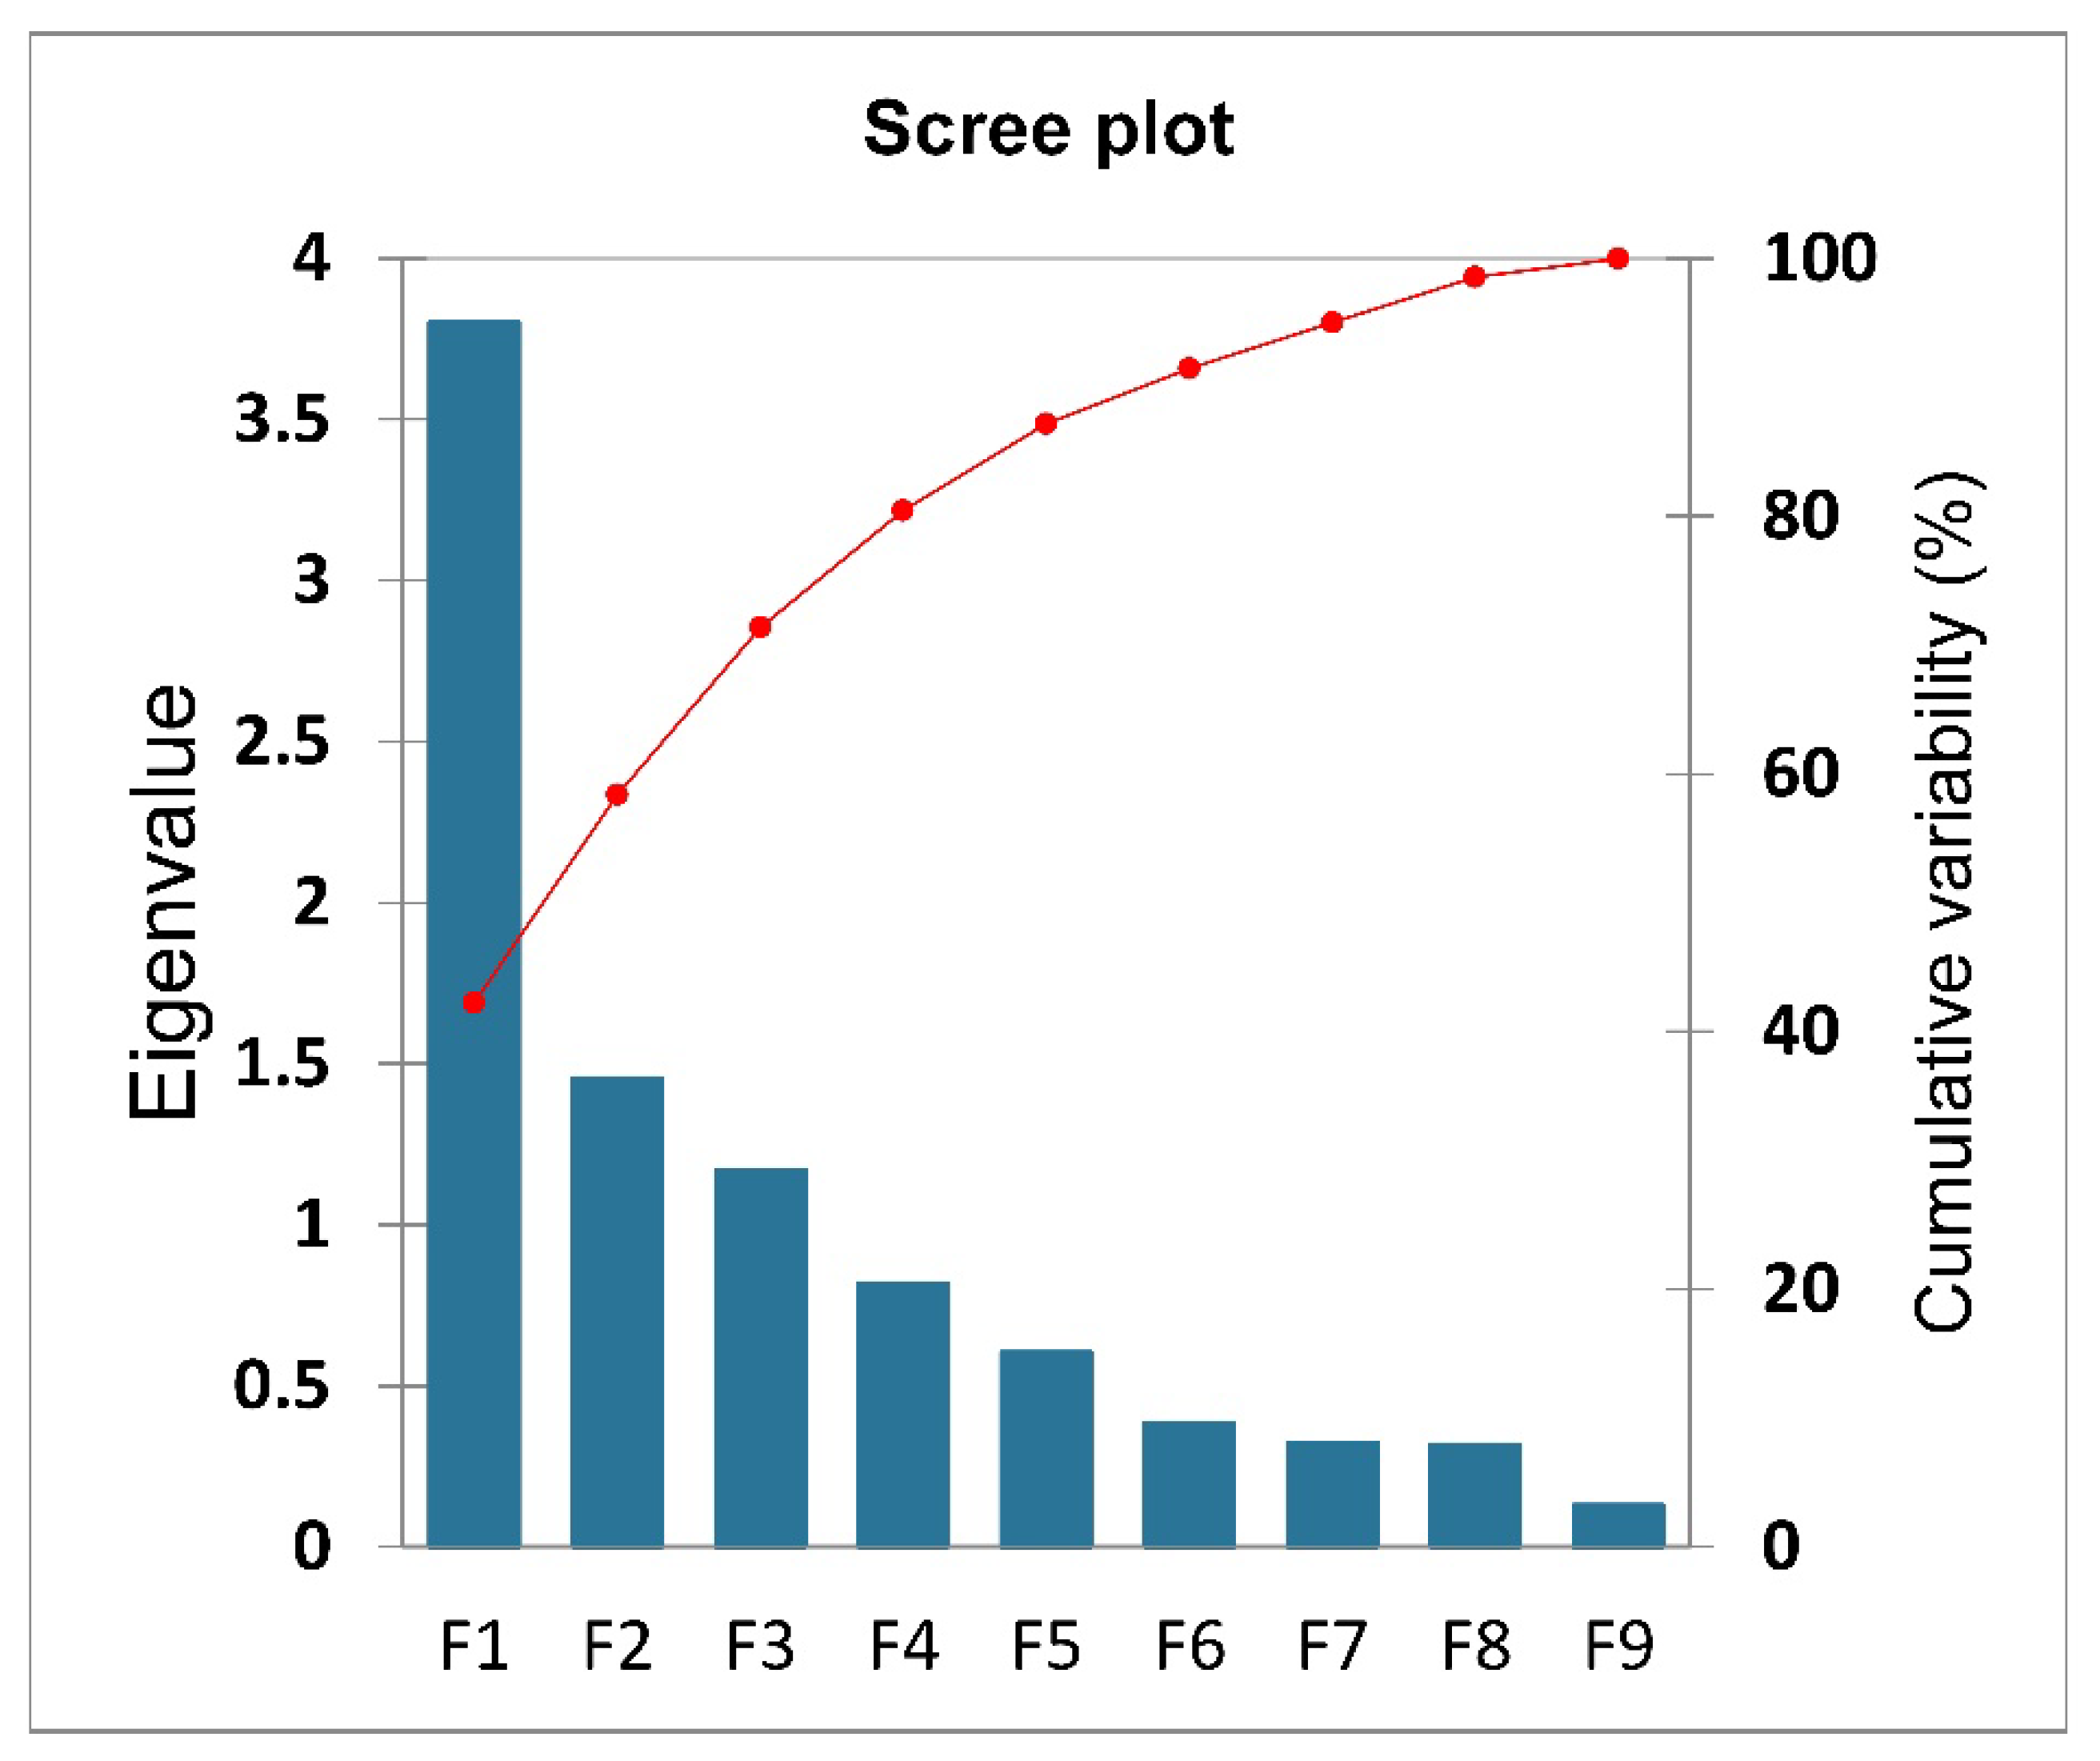
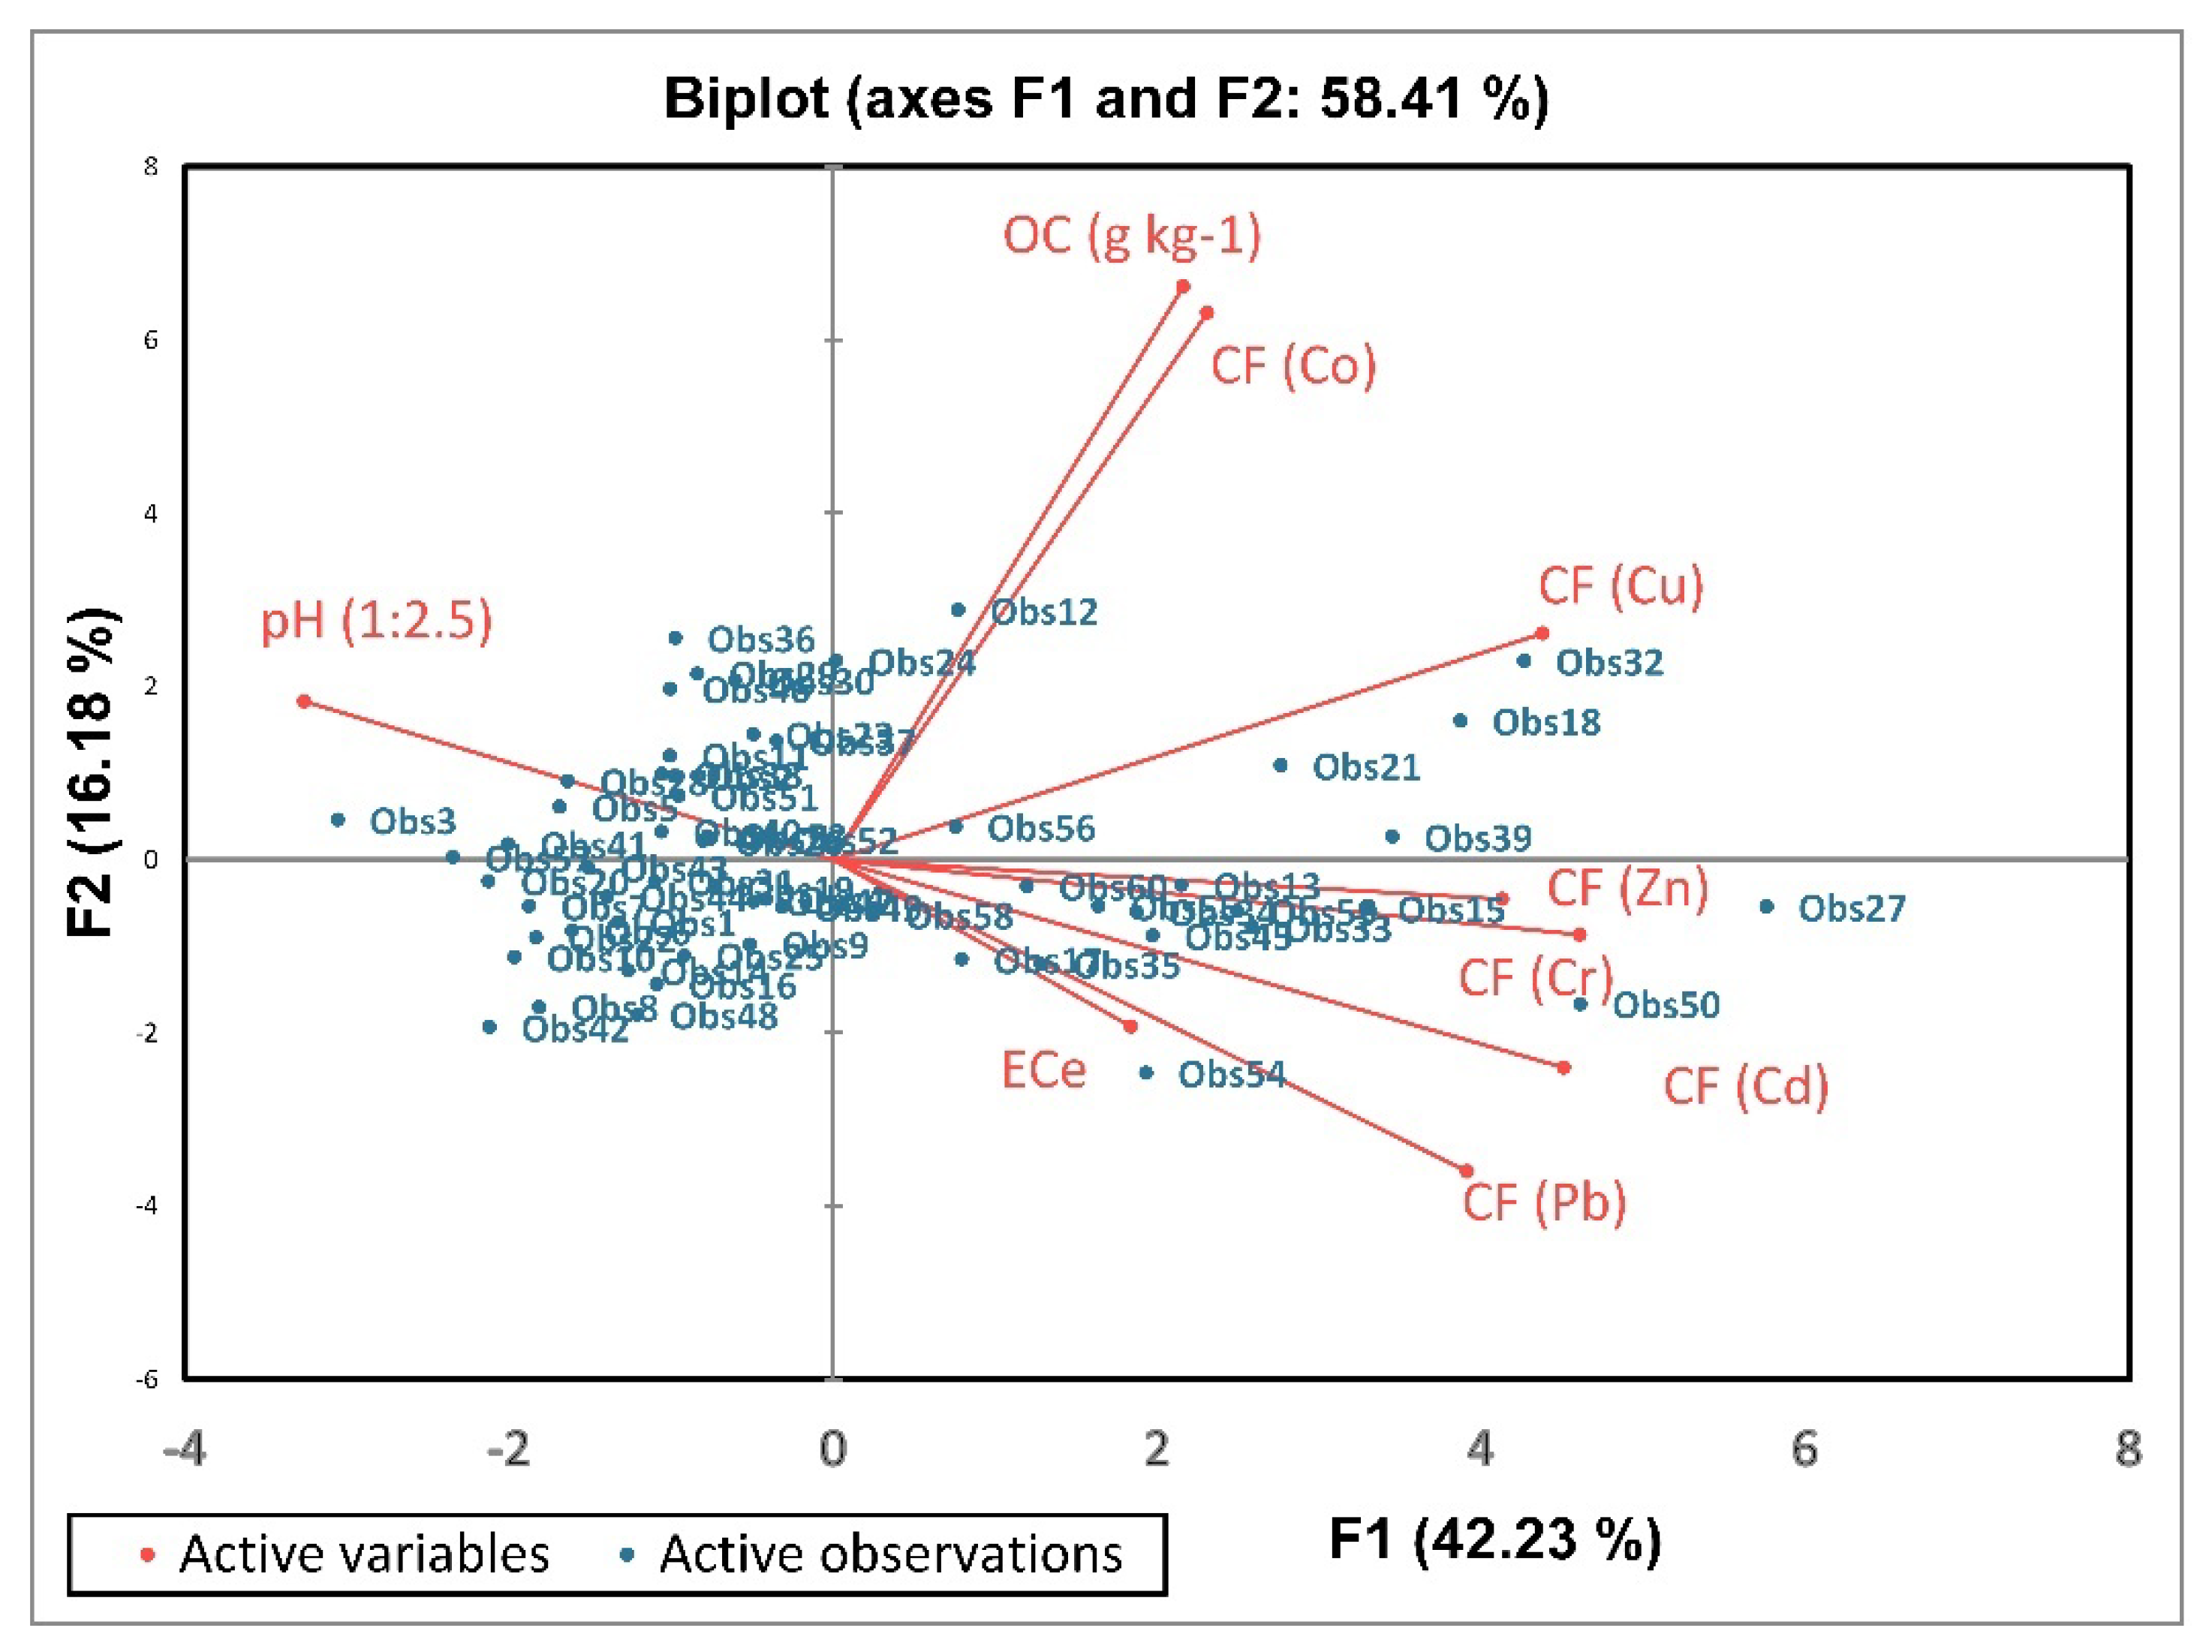
3.3. Principal Component Analysis (PCA)

The correlation matrix (person) of studied variables, is shown in Table 3. Regardless of correlation significance, soil pH negatively correlated with all the variables. There were significant negative correlations between soil pH and the total concentration of Cr, Cd, Pb, and Zn. However, the soil content of Co and Cu positively correlated with soil organic carbon (OC). A higher correlation was found between Cd and Cr.
Principal component analysis (PCA) is used as a mathematical process to extract the variables from the original data and group them into factors (principal components) [52,53]. PCA was applied to assess soil contamination with some selected heavy metals in other studies [54,55].
The Kaiser–Meyer–Olkin (KMO) test was used to determine the adequacy of sampling for all variables before principal component analysis (PCA) [56]. The KMO value was 0.729 and indicated that soil sampling was acceptable as the KMO value was >0.6. A PCA was achieved based on 60 observations and 9 variables. The Scree plot illustrates the eigenvalue and cumulative variability (%) of different principal components or factors (Figure 5). Data detailed in Table 4 showed that only three factors with cumulative variability of 71.39% have eigenvalues > 1, and the rest of the factors were ignored according to Kaiser [57]. The first factor F1 has the highest eigenvalue and variability (3.8 and 42.23%) and showed a significant negative correlation with soil pH and a highly significant negative correlation with the total concentration of Cr, Cu, Cd, Pb, and Zn according to factor loadings values. The second factor, F2, was highly positively correlated with soil organic carbon and Co content, with eigenvalues and variability of 1.46 and 16.18%, respectively. The third factor, F3, has the lowest eigenvalue and variability (1.17 and 12.98%) and was strongly correlated with EC as the factor loading value was 0.835 (Table 4).
Figure 6 shows the principal component analysis biplot of F1 (42.23%) and F2 (16.18%), which rescales the score plot and the loadings plot to overlay both on a single plot. In the biplot, the variables are illustrated as arrows, and the correlation between each pair of variables is configured by the cosine of the angle between the arrows. The smaller the angle between each pair of arrows, the stronger the correlation between variables [58]. However, a variable such as pH was linked with other variables at an angle close to 180°, indicating a negative correlation [59].
PCA was used to study the pattern of soil contamination with organic pollutants in some countries, such as Spain, China, India, and Russia, over a long period [60]. To assess soil contamination with heavy metals such as Cu, Zn, Ni, Pb, Cr, and Cd in areas adjacent to copper mines, principal component analysis, and geoaccumulation index were used [8,54].

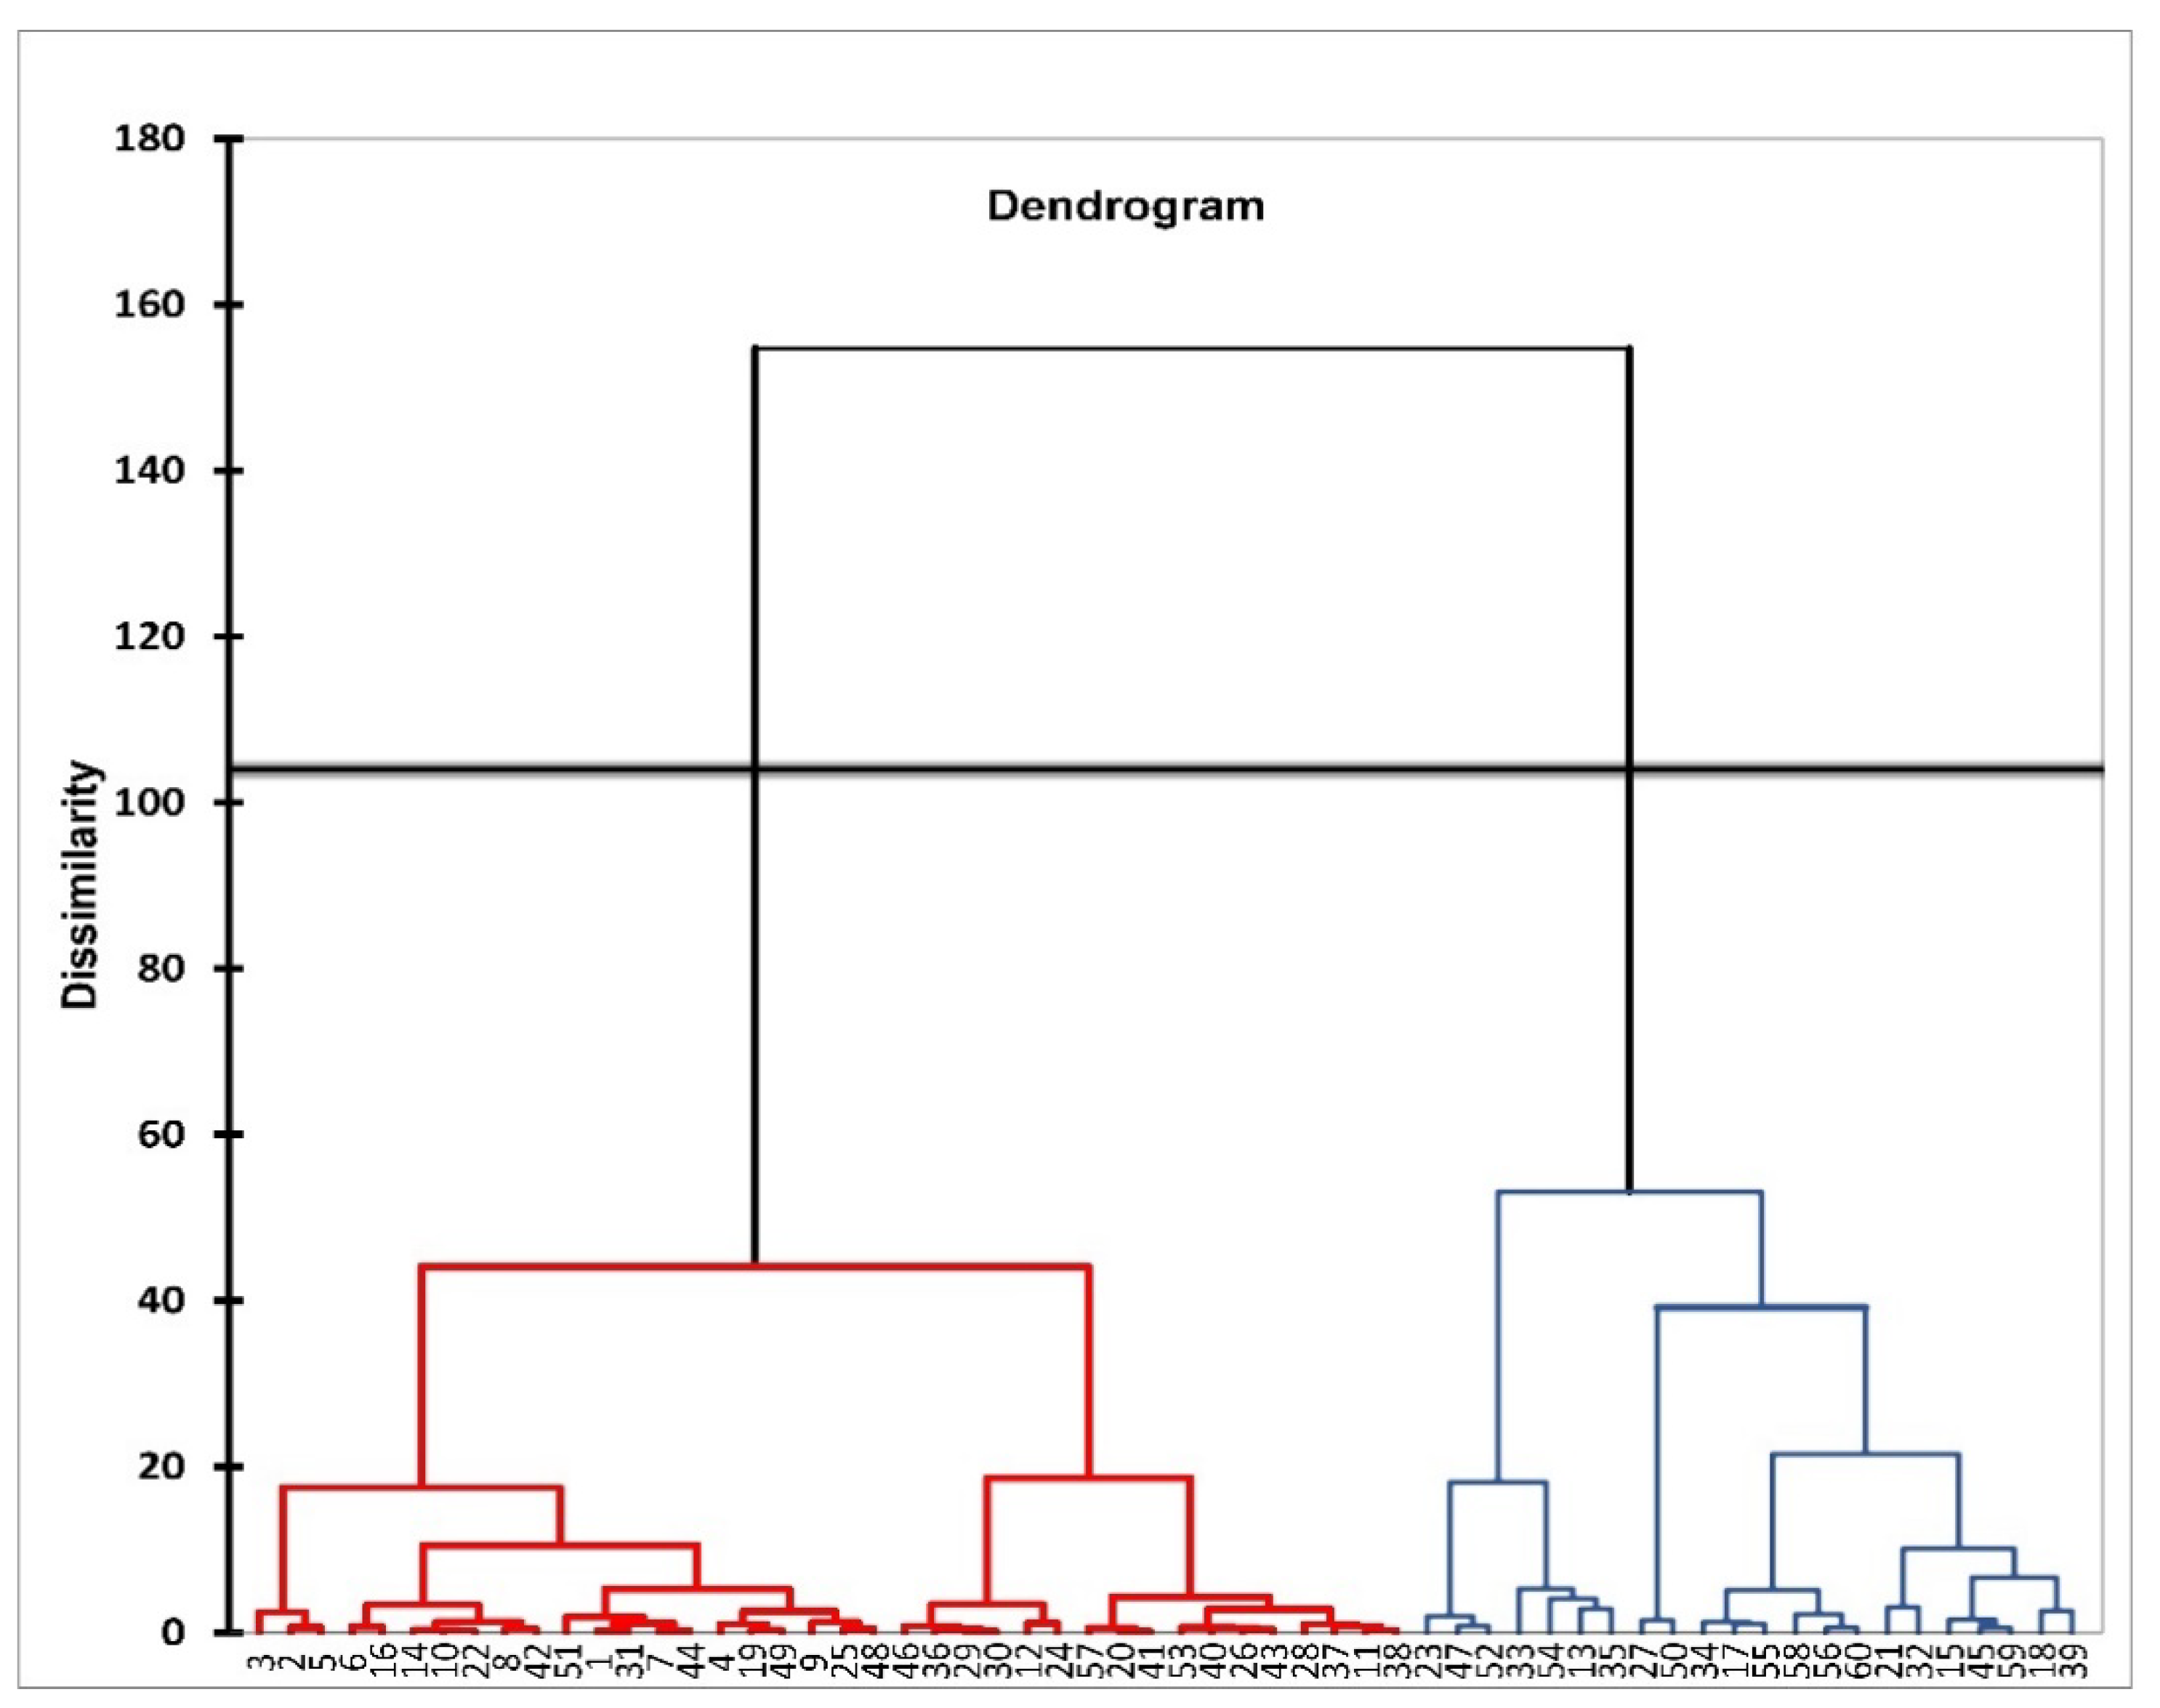
3.4. Cluster Analysis Based on PCA

PCA is used to gather the studied variables into groups, while cluster analysis is used to group observations into clusters. The cluster contains observations that are like each other compared to other clusters [61,62]. In this study, agglomerative hierarchical clustering (AHC) classified the data into two groups (clusters).
The dendrogram shown in Figure 7 illustrates the dissimilarity between the two clusters, each cluster has different characteristics. Descriptive statistics detailed in Table 5 showed that the first cluster has 38 observations, and the second has 22 observations, with different ranges, means, and standard deviations (SD) of all variables. The location of each cluster observation is shown in Figure 8. Those two clusters were extracted from factors (F1, F2, and F3) obtained by PCA. The obtained results showed significant differences between the two clusters on pH, EC, Cr, Cu, Cd, Pb, and Zn. On the other hand, there were no significant differences between the two clusters in soil organic carbon and total concentration of Co. This may be due to the low percentage of organic matter in the study area and the Nile valley [63,64,65].
Consequently, cluster 1 is characterized by higher pH, lower EC, and a lower level of contamination than cluster 2. The clustering analysis resulted in three clusters of soil quality (very good, good, and fair) in a case study of El-Fayoum, Egypt [21,66]. Data from heavy metal-contaminated soil types in India from 1991 to 2018 were subjected to clustering analysis [67].

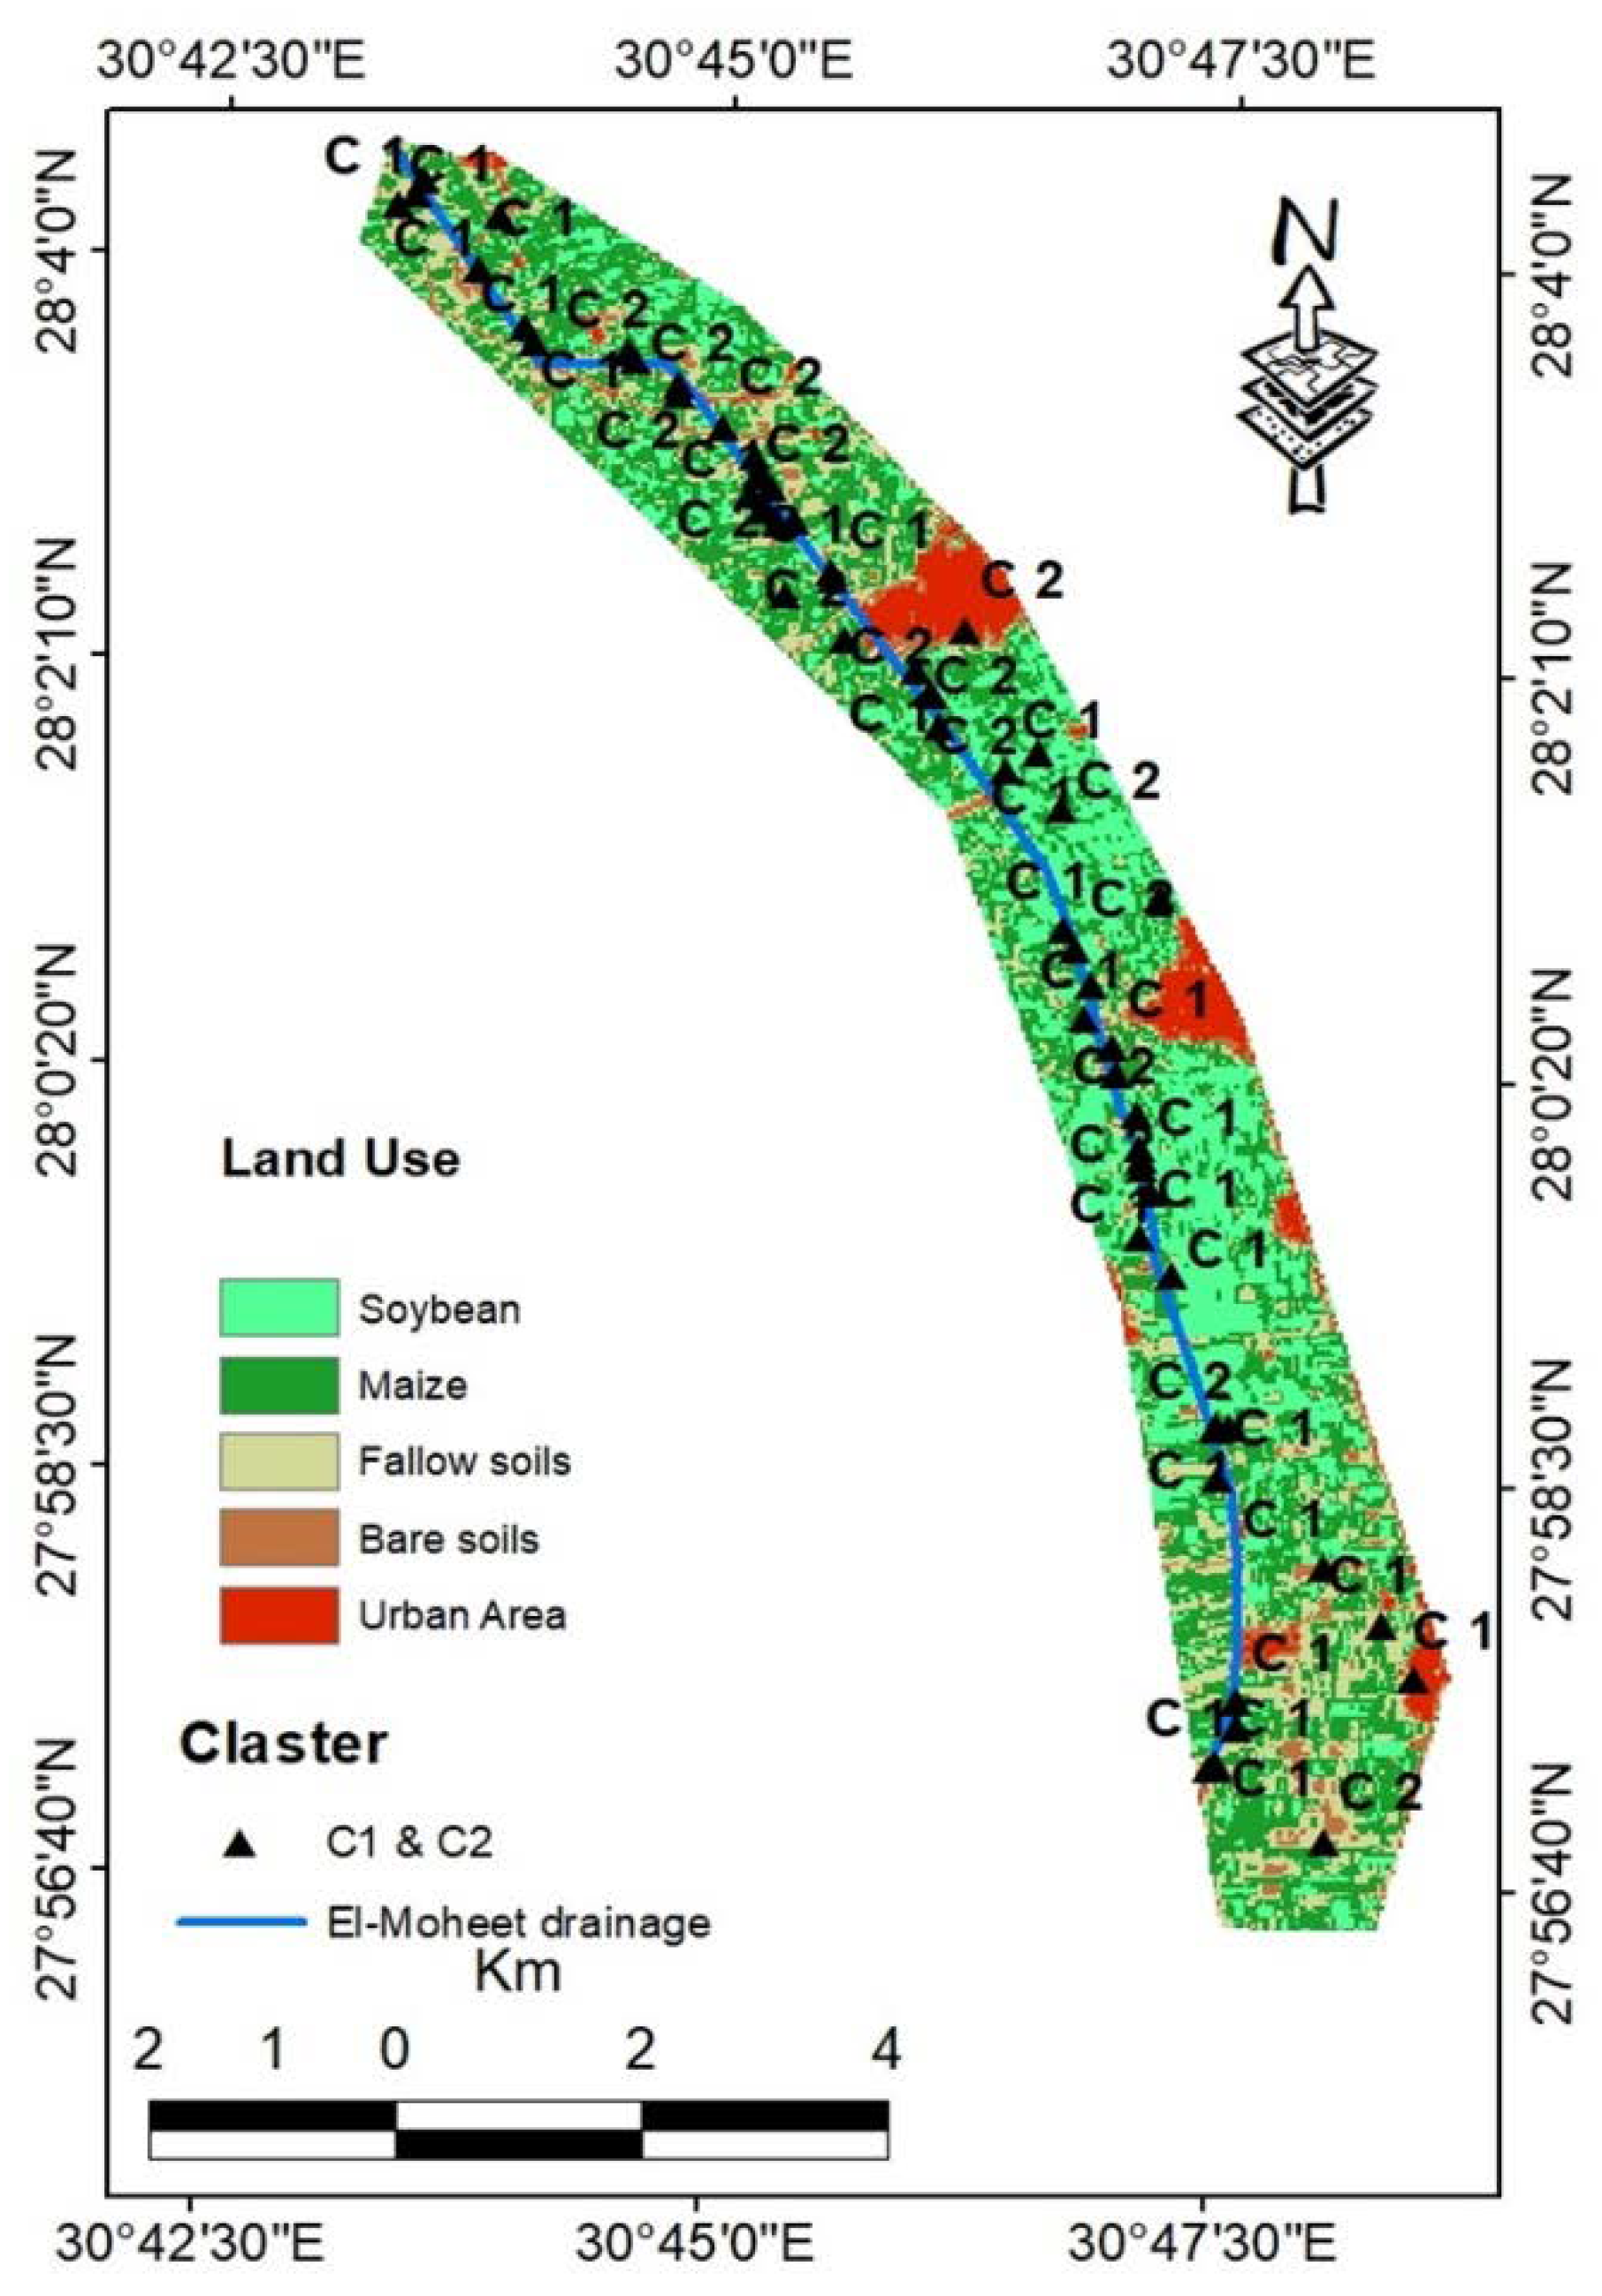
3.5. Land Use of the Study Area

Figure 8 shows the land use of the study area around the El-Moheet drainage—the west side of the Nile River, El-Minia governorate, Egypt. Five classes were observed; agriculture crops (soybean, maize) in the summer season, fallow soils, bare soil, and urban areas that generally represent the main classes in the Nile Value in El-Minia governorate, Egypt [31]. Agriculture field crops (soybean, maize) are the dominant classes that represent about 70% of the total area, and urban (residential buildings and industrial areas) is the second dominant class, as it represents about 15% of the total studied area. The El-Moheet drainage is directed from the south toward the north. El-Moheet drainage is considered a pollution source as some farmers use such water for irrigating their crops due to the deficiency of clean irrigation water [68].

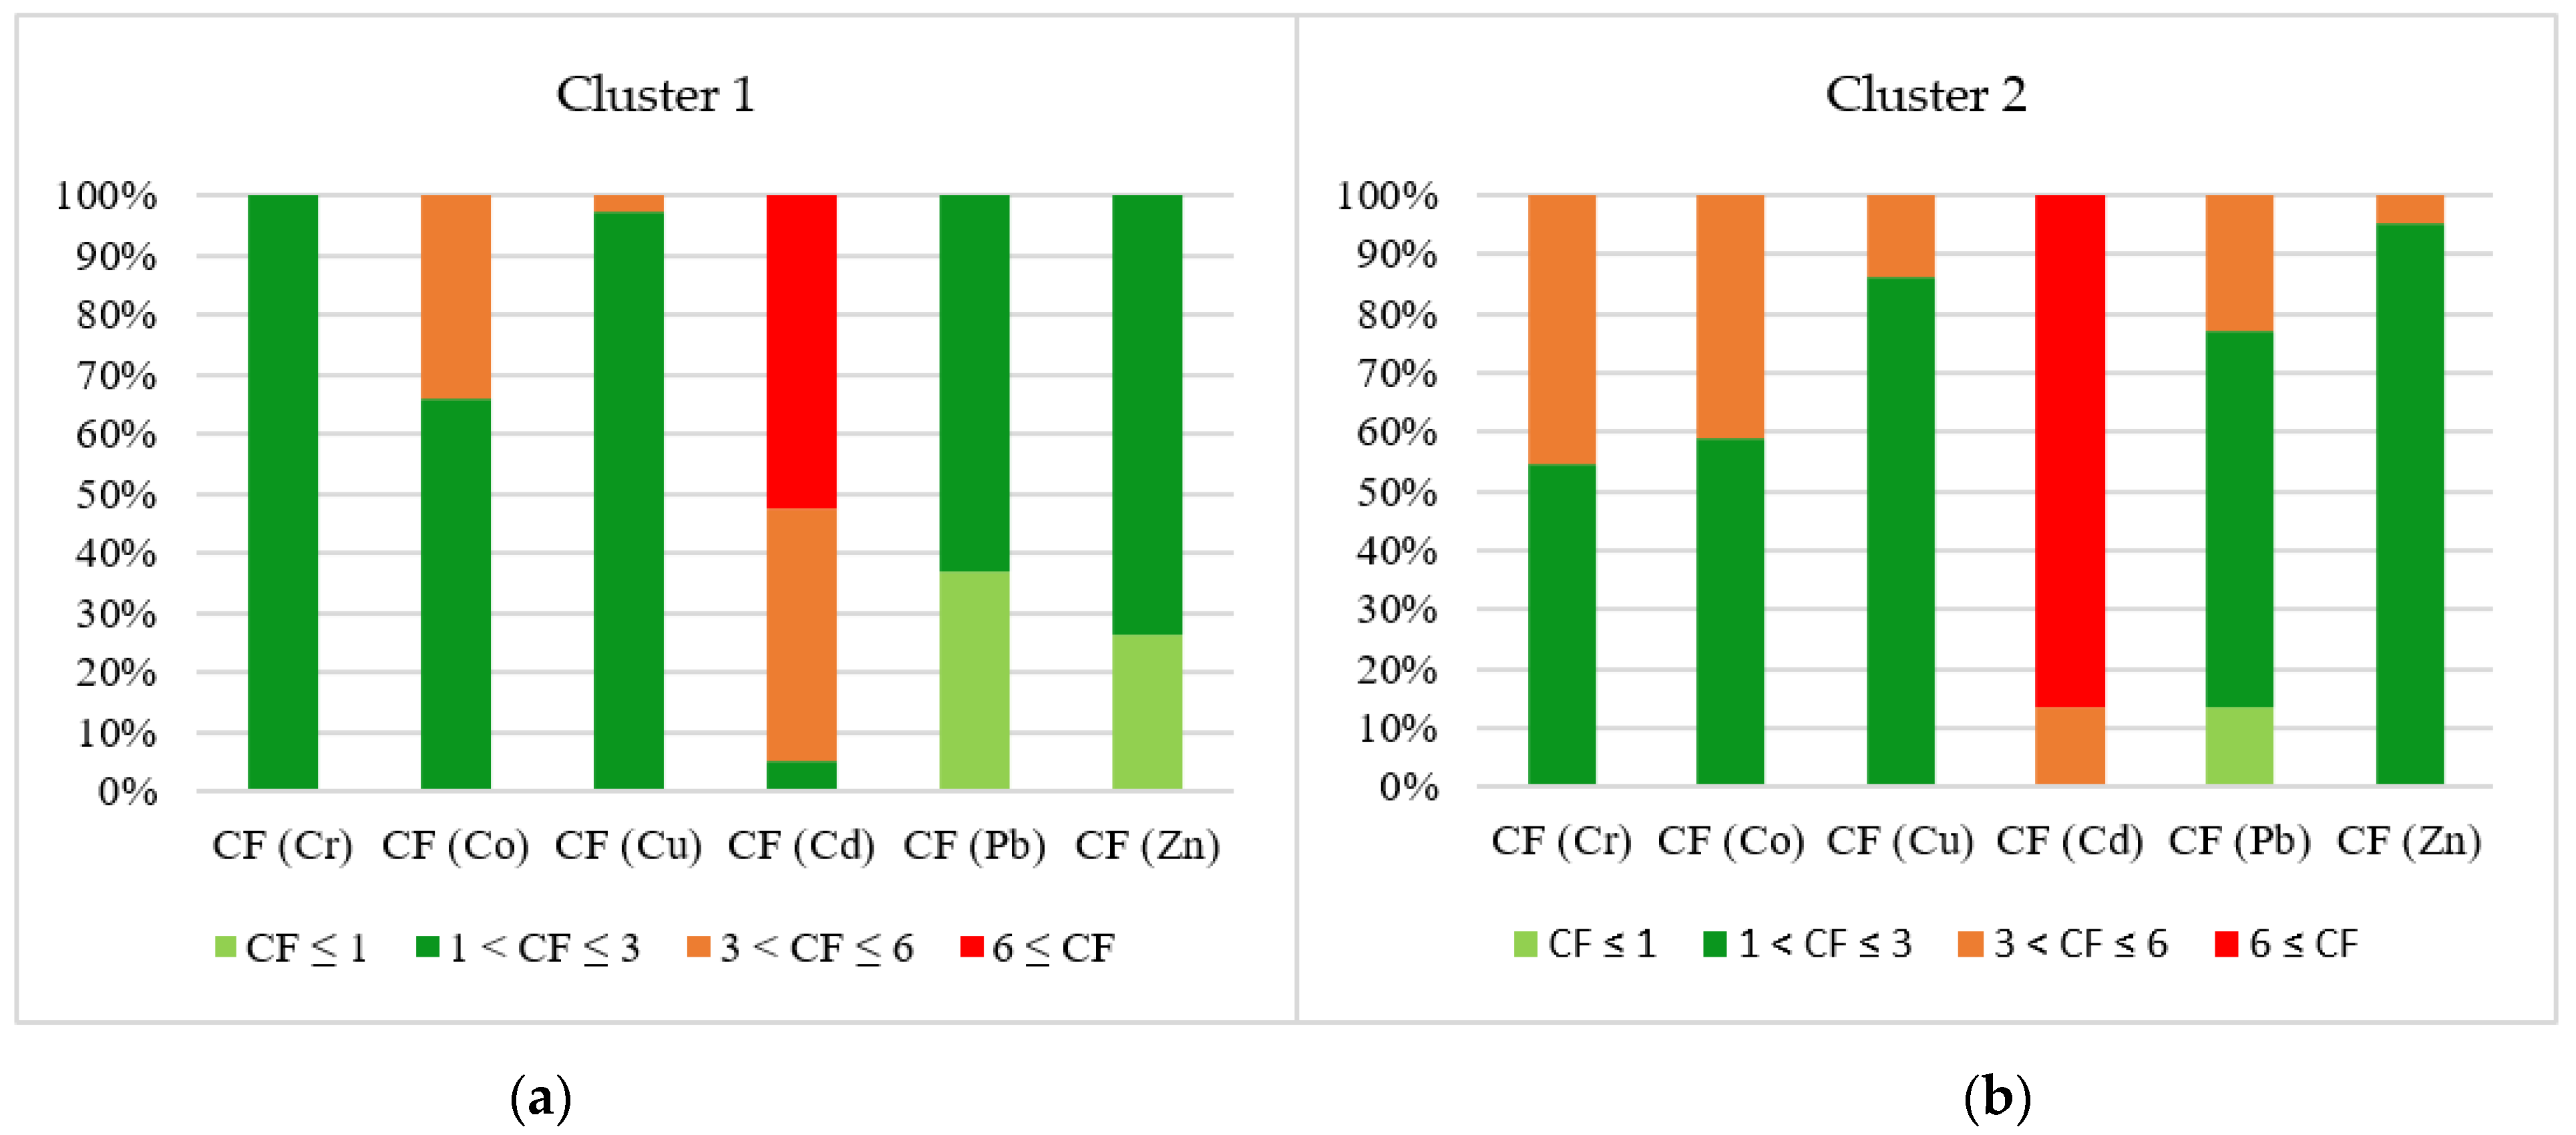
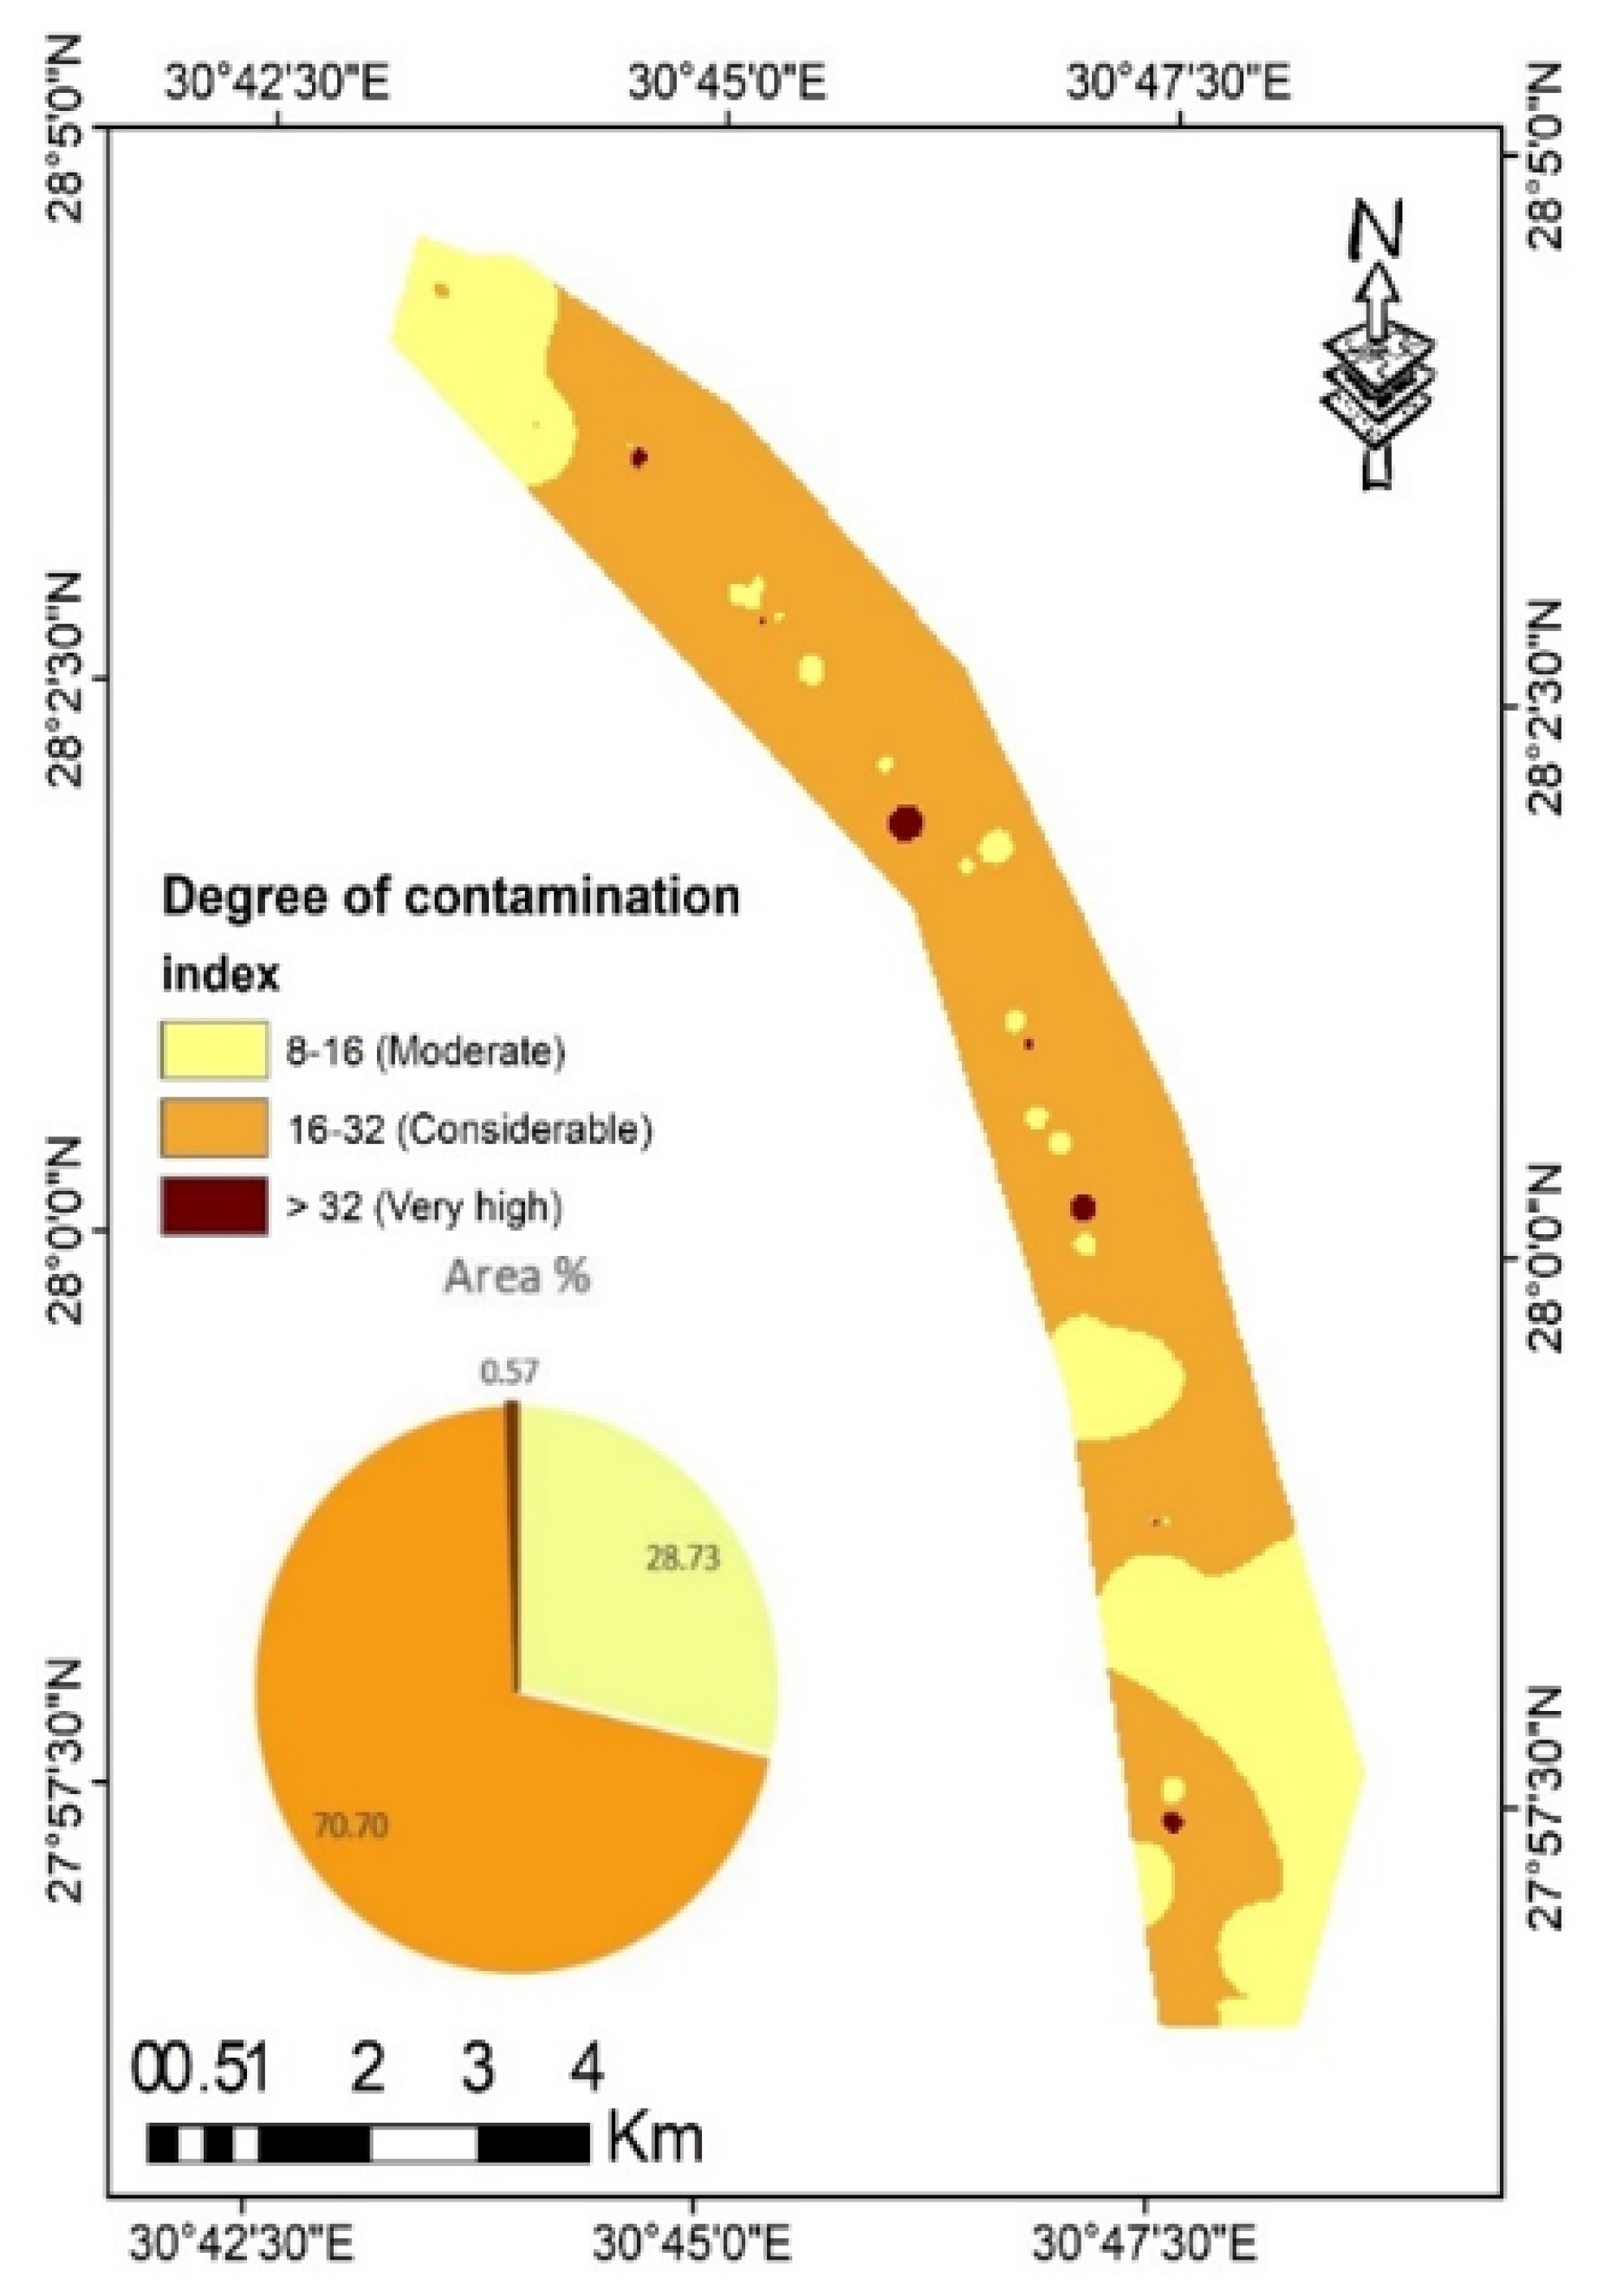
3.6. Contamination Factor (CF) and the Degree of Contamination (DC)

To assess probable ecological risk linked to some heavy metal, contamination factors (CF) were calculated for each cluster. Figure 9 shows the spatial distribution of each site and its cluster classification (C1 or C2). The results showed that the contamination factor of Cr in cluster 1 indicated moderate contamination; meanwhile, cluster 2 was relatively high contamination; it was characterized by 45% moderate contamination and 55% of soil samples had considerable contamination according to Hakanson [36]. Increasing the concentration of chromium in the soil may lead to a decrease in soil quality and this may reflect on human health [69]. The contamination factor of Co demonstrated that cluster 1 has moderate and considerable contamination of 66% and 34%, respectively. Moreover, cluster 2 was moderately and considerably contaminated by Co with a relative percentage of 59 and 41, respectively. Cluster 1 recorded 97% moderate contamination and 3% considerable contamination by Cu, while those contamination levels in cluster 2 were 86 and 14%, respectively.
Regarding Cd, both clusters showed high levels of CF. Cluster 1 showed three different contamination levels by Cd; moderate, considerable, and high, with relatively percentages 5, 42, and 53%, respectively. The increase in Cd concentration in both clusters may be due to human activity and fertilizer application in the study area [70]. Cluster 1 was polluted by Pb and Zn at low and moderate levels, whereas cluster 2 recorded high contamination levels. The degree of contamination (DC) was calculated based on the CF of the studied heavy metals, indicating that cluster 2 was highly contaminated compared to cluster 1 (Table 5).
Table 6 and Figure 10, showed three degrees of contamination in the study area. A 28.73% of the study area showed a moderate contamination degree, and relatively low concentrations of heavy metals that agree with [66,71]. The largest part of the study area was attributed to considerable concentrations of heavy metals where the average of heavy metals to this degree was 91.23 ± 19.5, 29.44 ± 5.2, 53.83 ± 10.2, 1.12 ± 0.3, 36.04 ± 18.0, and 101.29 ± 35 for Cr, Co, Cu, Cd, Pb, and Zn, respectively. This part is the middle of the study area, where the sources of pollution vary between pollution by irrigation water sources and others resulting from human activities during agricultural management [72]. On the other hand, the highest degree occupies about 0.57% of the total area.
Many other researchers used various soil contamination indices, particularly contamination factors and degree of contamination [30,67,73]. The variation in CF and DC between the two clusters may be explained by the disparity between farmers in the irrigation process from drain water or renewable groundwater, in addition to mineral fertilization in different quantities.

4. Conclusions

The current study highlights the assessment of soil contamination by heavy metals in the area adjacent to the El-Moheet drainage, which is considered one of the most important obstacles to sustainable development and food security. This study demonstrated the effective use of the semivariogram models for predicting the spatial distribution maps of heavy metals in the study area. Furthermore, the integration of PCA and HCA provided unconventional results in classifying the study area into two zones, each of which differs from the other in concentration and pattern of heavy metals. The average contamination factor CF for the selected metals has an order of Zn > Cr > Cu > Pb > Co > Cd. On the other hand, Cd has the highest contamination factor among the heavy metals. The results showed three contamination degrees of the heavy metals (moderate, considerable, and very high). About 70.7% of the study area showed considerable contamination, which is a dangerous alarm for ecosystems in the area. All pollution levels were above the threshold of their average concentration in the surface earth crust and parent material. The current results show to the decision-makers and researchers the effects of human negative practices on the land of the study area, such as the use of polluted water in irrigation, the excessive use of mineral fertilizers and pesticides, etc. Finally, the study recommends activating agricultural management laws to reduce human negative practices that lead to increased environmental pollution. Moreover, future studies will focus on ways to manage and mitigate the effects of soil pollution.

Author Contributions

Conceptualization, A.A.H., E.S.M. and W.S.M.; methodology, A.A.H. and E.S.M.; formal analysis, A.A.H. and S.E.-E.S.; investigation, A.A.H., E.S.M. and S.E.-E.S.; writing—original draft preparation, A.A.H. and E.S.M.; writing—review and editing, W.S.M. and D.E.K. All authors have read and agreed to the published version of the manuscript.

Funding

This research received no external funding.

Data Availability Statement

Data are available from the authors upon request.

Acknowledgments

The authors would like to acknowledge soil department, faculty of agriculture, Minia University, and the National Authority for Remote Sensing and Space Sciences for the laboratory analysis and support. This paper has been supported by the RUDN University Strategic Academic Leadership Program.

Conflicts of Interest

The authors declare no conflict of interest.

References

  1. El-Zeiny, A.M.; El-Hamid, H.T.A. Environmental and human risk assessment of heavy metals at northern Nile Delta region using geostatistical analyses. Egypt. J. Remote Sens. Space Sci. 2022, 25, 21–35. [Google Scholar] [CrossRef]
  2. Nascimento, A.R.V.J.D.; Cunha, G.K.G.; Nascimento, C.W.A.D.; da Cunha, K.P.V. Assessing Soil Quality and Heavy Metal Contamination on Scheelite Mining Sites in a Tropical Semi-arid Setting. Water Air Soil Pollut. 2021, 232, 375. [Google Scholar] [CrossRef]
  3. Kayode, A.A.; Akram, M.; Laila, U.; Al-Khashman, O.A.; Omowumi, T.; Elbossaty, W.F.M. Biological implications of atmospheric and pedospheric levels of heavy metals. Adv. Toxicol. Toxic Effects 2021, 5, 1–4. [Google Scholar]
  4. AbdelRahman, M.A.E.; Shalaby, A.; Mohamed, E.S. Comparison of two soil quality indices using two methods based on geographic information system. Egypt. J. Remote Sens. Space Sci. 2019, 22, 127–136. [Google Scholar] [CrossRef]
  5. Baroudy, A.A.E.; Ali, A.M.; Mohamed, E.S.; Moghanm, F.S.; Shokr, M.S.; Savin, I.; Poddubsky, A.; Ding, Z.; Kheir, A.M.S.; Aldosari, A.A.; et al. Modeling Land Suitability for Rice Crop Using Remote Sensing and Soil Quality Indicators: The Case Study of the Nile Delta. Sustainability 2020, 12, 9653. [Google Scholar] [CrossRef]
  6. Karimi, A.; Haghnia, G.H.; Ayoubi, S.; Safari, T. Impacts of geology and land use on magnetic susceptibility and selected heavy metals in surface soils of Mashhad plain, northeastern Iran. J. Appl. Geophys. 2017, 138, 127–134. [Google Scholar] [CrossRef]
  7. Abd-Elmabod, S.; Bakr, N.; Muñoz-Rojas, M.; Pereira, P.; Zhang, Z.; Cerdà, A.; Jordán, A.; Mansour, H.; De La Rosa, D.; Jones, L. Assessment of Soil Suitability for Improvement of Soil Factors and Agricultural Management. Sustainability 2019, 11, 1588. [Google Scholar] [CrossRef] [Green Version]
  8. Elbehiry, F.; Elbasiouny, H.; Cappuyns, V.; Brevik, E.C. Available concentrations of some potentially toxic and emerging contaminants in different soil orders in Egypt and assessment of soil pollution. J. Soils Sediments 2021, 21, 3645–3662. [Google Scholar] [CrossRef]
  9. Mohamed, E.; Abu-Hashim, M.; AbdelRahman, M.; Schütt, B.; Lasaponara, R. Evaluating the Effects of Human Activity over the Last Decades on the Soil Organic Carbon Pool Using Satellite Imagery and GIS Techniques in the Nile Delta Area, Egypt. Sustainability 2019, 11, 2644. [Google Scholar] [CrossRef] [Green Version]
  10. El-Zeiny, A.M.; Effat, H.A. Environmental analysis of soil characteristics in El-Fayoum Governorate using geomatics approach. Environ. Monit. Assess. 2019, 191, 463. [Google Scholar] [CrossRef]
  11. Alengebawy, A.; Abdelkhalek, S.; Qureshi, S.; Wang, M.-Q. Heavy Metals and Pesticides Toxicity in Agricultural Soil and Plants: Ecological Risks and Human Health Implications. Toxics 2021, 9, 42. [Google Scholar] [CrossRef]
  12. Hammam, A.A.; Mohamed, E. Mapping soil salinity in the East Nile Delta using several methodological approaches of salinity assessment. Egypt. J. Remote Sens. Space Sci. 2020, 23, 125–131. [Google Scholar] [CrossRef]
  13. Effat, H.A.; El-Zeiny, A.M. Integration of satellite data and spatial decision models for zoning new urban communities in El-Fayoum Desert. Arab. J. Geosci. 2020, 13, 1093. [Google Scholar] [CrossRef]
  14. Mohamed, E.S.; Ali, A.M.; El Shirbeny, M.A.; El Razek, A.A.A.; Savin, I.Y. Near infrared spectroscopy techniques for soil contamination assessment in the Nile Delta. Eurasian Soil Sci. 2016, 49, 632–639. [Google Scholar] [CrossRef]
  15. Shokr, M.S.; El Baroudy, A.A.; Fullen, M.A.; El-Beshbeshy, T.R.; Ali, R.R.; Elhalim, A.; Guerra, A.J.T.; Jorge, M.C.O. Mapping of heavy metal contamination in alluvial soils of the Middle Nile Delta of Egypt. J. Environ. Eng. Landsc. Manag. 2016, 24, 218–231. [Google Scholar] [CrossRef]
  16. El Behairy, R.A.; El Baroudy, A.A.; Ibrahim, M.M.; Kheir, A.M.S.; Shokr, M.S. Modelling and Assessment of Irrigation Water Quality Index Using GIS in Semi-arid Region for Sustainable Agriculture. Water Air Soil Pollut. 2021, 232, 352. [Google Scholar] [CrossRef]
  17. Mohamed, E.S.; Belal, A.; Shalaby, A. Impacts of soil sealing on potential agriculture in Egypt using remote sensing and GIS techniques. Eurasian Soil Sci. 2015, 48, 1159–1169. [Google Scholar] [CrossRef]
  18. El Nahry, A.H.; Mohamed, E.S. Potentiality of land and water resources in African Sahara: A case study of south Egypt. Environ. Earth Sci. 2010, 63, 1263–1275. [Google Scholar] [CrossRef]
  19. Heuvelink, G.B.M.R.; Webster, M.A. Oliver: Geostatistics for Environmental Scientists. Math. Geosci. 2009, 41, 487–489. [Google Scholar] [CrossRef] [Green Version]
  20. Jolliffe, I. Principal component analysis. Encyclopedia of Statistics in Behavioral Science; John Wiley & Sons: Hoboken, NJ, USA, 2005. [Google Scholar]
  21. Abdel-Fattah, M.K.; Mohamed, E.S.; Wagdi, E.M.; Shahin, S.A.; Aldosari, A.A.; Lasaponara, R.; Alnaimy, M.A. Quantitative Evaluation of Soil Quality Using Principal Component Analysis: The Case Study of El-Fayoum Depression Egypt. Sustainability 2021, 13, 1824. [Google Scholar] [CrossRef]
  22. Irpino, A.; Verde, R. A New Wasserstein Based Distance for the Hierarchical Clustering of Histogram Symbolic Data. In Data Science and Classification; Springer: Berlin/Heidelberg, Germany, 2006; pp. 185–192. [Google Scholar] [CrossRef]
  23. Abdel-Fattah, M.K.; Abd-Elmabod, S.K.; Aldosari, A.A.; Elrys, A.S.; Mohamed, E.S. Multivariate Analysis for Assessing Irrigation Water Quality: A Case Study of the Bahr Mouise Canal, Eastern Nile Delta. Water 2020, 12, 2537. [Google Scholar] [CrossRef]
  24. Yang, Y.; Christakos, G.; Guo, M.; Xiao, L.; Huang, W. Space-time quantitative source apportionment of soil heavy metal concentration increments. Environ. Pollut. 2017, 223, 560–566. [Google Scholar] [CrossRef]
  25. Yang, Y.; Yang, X.; He, M.; Christakos, G. Beyond mere pollution source identification: Determination of land covers emitting soil heavy metals by combining PCA/APCS, GeoDetector and GIS analysis. CATENA 2020, 185, 104297. [Google Scholar] [CrossRef]
  26. Xin-Zhong, W.; Guo-Shun, L.; Hong-Chao, H.; Zhen-Hai, W.; Qing-Hua, L.; Xu-Feng, L.; Wei-Hong, H.; Yan-Tao, L. Determination of management zones for a tobacco field based on soil fertility. Comput. Electron. Agric. 2009, 65, 168–175. [Google Scholar] [CrossRef]
  27. El-Rawy, M.; Abdalla, F.; El Alfy, M. Water Resources in Egypt. In The Geology of Egypt; Springer: Cham, Switzerland, 2020; pp. 687–711. [Google Scholar]
  28. Masoud, A.M.; Moneim, A.A.; Redwan, M. Environmental Impact of Wastewater Inflow on Groundwater Quality, West Girga, Sohag, Egypt. Sohag Eng. J. 2022, 2, 56–65. [Google Scholar] [CrossRef]
  29. Mayhoub, A.; Azzam, A. A survey on the assessment of wind energy potential in Egypt. Renew. Energy 1997, 11, 235–247. [Google Scholar] [CrossRef]
  30. Shelbaya, M.M.A.; El-Azeim, M.M.A.; Menesi, A.M.; El-Mageed, M.M.A. Heavy Metals and Microbial Activity in Alluvial Soils Affected by Different Land-Uses. J. Soil Sci. Agric. Eng. 2021, 12, 165–177. [Google Scholar] [CrossRef]
  31. Zakarya, Y.M.; Metwaly, M.M.; AbdelRahman, M.A.E.; Metwalli, M.R.; Koubouris, G. Optimized Land Use through Integrated Land Suitability and GIS Approach in West El-Minia Governorate, Upper Egypt. Sustainability 2021, 13, 12236. [Google Scholar] [CrossRef]
  32. Gee, G.W.; Bauder, J.W. Particle-size Analysis. In Methods of Soil Analysis; Soil Science Society of America: Madison, WI, USA, 1986; pp. 383–411. [Google Scholar]
  33. Schumacher, B. Methods for the Determination of Total Organic Carbon (TOC) In Soils and Sediments; Ecological Risk Assessment Support Center Office of Research and Development: Washington, DC, USA, 2002. [Google Scholar]
  34. Page, A.L.; Keeney, D. Methods of Soil Analysis; American Society of Agronomy: Madison, WI, USA, 1982. [Google Scholar]
  35. Taylor, S.R.; McLennan, S. The geochemical evolution of the continental crust. Rev. Geophys. 1995, 33, 241–265. [Google Scholar] [CrossRef]
  36. Håkanson, L. An ecological risk index for aquatic pollution control. A sedimentological approach. Water Res. 1980, 14, 975–1001. [Google Scholar] [CrossRef]
  37. Isaaks, E.H.; Srivastava, M.R. Applied Geostatistics; Oxford University Press: New York, NY, USA, 1989. [Google Scholar]
  38. Cambardella, C.A.; Moorman, T.B.; Novak, J.M.; Parkin, T.B.; Karlen, D.L.; Turco, R.F.; Konopka, A.E. Field-Scale Variability of Soil Properties in Central Iowa Soils. Soil Sci. Soc. Am. J. 1994, 58, 1501–1511. [Google Scholar] [CrossRef]
  39. Johnston, K.; Ver Hoef, J.M.; Krivoruchko, K.; Lucas, N. Using ArcGIS Geostatistical Analyst; ESRI: Redlands, CA, USA, 2001; Volume 380. [Google Scholar]
  40. Gundogdu, K.S.; Guney, I. Spatial analyses of groundwater levels using universal kriging. J. Earth Syst. Sci. 2007, 116, 49–55. [Google Scholar] [CrossRef] [Green Version]
  41. Massart, D.L.; Vandeginste, B.G.; Buydens, L.M.C.; De Jong, S.; Lewi, P.J.; Smeyers-Verbeke, J. Handbook of Chemometrics and Qualimetrics: Part B. Applied Spectroscopy; Elsevier: Amsterdam, The Netherlands, 1998; Volume 52, p. 302. [Google Scholar]
  42. Lillesand, T.M.; Kiefer, R.W. Remote Sensing and Image Interpretation; WIley: Hoboken, NJ, USA, 2000. [Google Scholar]
  43. Richards, L. Diagnosis and improvement of saline and alkali soils. Soil Sci. 1954, 78, 154. [Google Scholar] [CrossRef]
  44. El-Rawy, M.; AbdelRahman, M.; Ismail, E. Integrated Use of Pollution Indices and Geomatics to Assess Soil Contamination and Identify Soil Pollution Source in El-Minia Governorate, Upper Egypt. J. Eng. Sci. Technol. 2020, 15, 2223–2238. [Google Scholar]
  45. Bradl, H.B. Source and Origins of Heavy Metals. In Interface Science and Technology; Bradl, H.B., Ed.; Elsevier: Amsterdam, The Netherlands, 2005; pp. 1–27. [Google Scholar] [CrossRef]
  46. El-Azeim, M.A.; Mohamed, W.; Hammam, A. Soil Physiochemical Properties in Relation to Heavy Metals Status of Agricultural Soils in El-Minia Governorate, Egypt. J. Soil Sci. Agric. Eng. 2016, 7, 423–431. [Google Scholar] [CrossRef]
  47. Prasad, S.; Yadav, K.K.; Kumar, S.; Gupta, N.; Cabral-Pinto, M.M.; Rezania, S.; Radwan, N.; Alam, J. Chromium contamination and effect on environmental health and its remediation: A sustainable approaches. J. Environ. Manag. 2021, 285, 112174. [Google Scholar] [CrossRef]
  48. Mahey, S.; Kumar, R.; Sharma, M.; Kumar, V.; Bhardwaj, R. A critical review on toxicity of cobalt and its bioremediation strategies. SN Appl. Sci. 2020, 2, 1279. [Google Scholar] [CrossRef]
  49. Zaborowska, M.; Kucharski, J.; Wyszkowska, J. Biological activity of soil contaminated with cobalt, tin, and molybdenum. Environ. Monit. Assess. 2016, 188, 398. [Google Scholar] [CrossRef] [Green Version]
  50. Wuana, R.A.; Okieimen, F.E. Heavy Metals in Contaminated Soils: A Review of Sources, Chemistry, Risks and Best Available Strategies for Remediation. ISRN Ecol. 2011, 2011, 402647. [Google Scholar] [CrossRef] [Green Version]
  51. AbdelRahman, M.A.E.; Zakarya, Y.M.; Metwaly, M.M.; Koubouris, G. Deciphering Soil Spatial Variability through Geostatistics and Interpolation Techniques. Sustainability 2020, 13, 194. [Google Scholar] [CrossRef]
  52. Jolliffe, I.T.; Cadima, J. Cadima, Principal component analysis: A review and recent developments. Philos. Trans. R. Soc. A Math. Phys. Eng. Sci. 2016, 374, 20150202. [Google Scholar] [CrossRef] [PubMed]
  53. Abdi, H.; Williams, L.J. Principal component analysis. WIREs Comput. Stat. 2010, 2, 433–459. [Google Scholar] [CrossRef]
  54. Zhiyuan, W.; Dengfeng, W.; Huiping, Z.; Zhiping, Q. Assessment of Soil Heavy Metal Pollution with Principal Component Analysis and Geoaccumulation Index. Procedia Environ. Sci. 2011, 10, 1946–1952. [Google Scholar] [CrossRef] [Green Version]
  55. Gergen, I.; Harmanescu, M. Application of principal component analysis in the pollution assessment with heavy metals of vegetable food chain in the old mining areas. Chem. Central J. 2012, 6, 156. [Google Scholar] [CrossRef] [Green Version]
  56. Peres-Neto, P.R.; Jackson, D.A.; Somers, K.M. How many principal components? Stopping rules for determining the number of non-trivial axes revisited. Comput. Stat. Data Anal. 2005, 49, 974–997. [Google Scholar] [CrossRef]
  57. Kaiser, H.F. The Application of Electronic Computers to Factor Analysis. Educ. Psychol. Meas. 1960, 20, 141–151. [Google Scholar] [CrossRef]
  58. Smith, A.; Cullis, B.; Thompson, R. Exploring variety-environment data using random effects AMMI models with adjustments for spatial field trend: Part 1: Theory. In Quantitative Genetics, Genomics and Plant Breeding; CABI: Wallingford, UK, 2002. [Google Scholar]
  59. Suárez, M.H.; Pérez, D.M.; Rodríguez-Rodríguez, E.M.; Romero, C.D.; Borreguero, F.E.; Galindo-Villardón, P. The Compositional HJ-Biplot—A New Approach to Identifying the Links among Bioactive Compounds of Tomatoes. Int. J. Mol. Sci. 2016, 17, 1828. [Google Scholar] [CrossRef] [Green Version]
  60. Skrbic, B.; Durisic-Mladenovic, N. Principal component analysis for soil contamination with organochlorine compounds. Chemosphere 2007, 68, 2144–2152. [Google Scholar] [CrossRef]
  61. Jain, A.K.; Dubes, R.C. Algorithms for Clustering Data; Prentice-Hall, Inc.: Hoboken, NJ, USA, 1988. [Google Scholar]
  62. Penkova, T. Principal component analysis and cluster analysis for evaluating the natural and anthropogenic territory safety. Procedia Comput. Sci. 2017, 112, 99–108. [Google Scholar] [CrossRef]
  63. El-Anwar, A.; Mekky, H.S.; Salman, S.A.; Elnazer, A.A.; Abdel Wahab, W.; Asmoay, A.S. Mineralogical and petrographical studies of agricultural soil, Assiut Governorate, Egypt. Bull. Natl. Res. Cent. 2019, 43, 30. [Google Scholar] [CrossRef]
  64. El-Ramady, H.; Alshaal, T.; Bakr, N.; Elbana, T.; Mohamed, E.; Belal, A.A. (Eds.) The Soils of Egypt; Springer: Cham, Switzerland, 2018. [Google Scholar]
  65. Stockmann, U.; Padarian, J.; McBratney, A.; Minasny, B.; de Brogniez, D.; Montanarella, L.; Hong, S.Y.; Rawlins, B.G.; Field, D.J. Global soil organic carbon assessment. Glob. Food Secur. 2015, 6, 9–16. [Google Scholar] [CrossRef]
  66. Abuzaid, A.S.; AbdelRahman, M.A.E.; Fadl, M.E.; Scopa, A. Land Degradation Vulnerability Mapping in a Newly-Reclaimed Desert Oasis in a Hyper-Arid Agro-Ecosystem Using AHP and Geospatial Techniques. Agronomy 2021, 11, 1426. [Google Scholar] [CrossRef]
  67. Kumar, V.; Sharma, A.; Kaur, P.; Sidhu, G.P.S.; Bali, A.S.; Bhardwaj, R.; Thukral, A.; Cerda, A. Pollution assessment of heavy metals in soils of India and ecological risk assessment: A state-of-the-art. Chemosphere 2019, 216, 449–462. [Google Scholar] [CrossRef] [PubMed]
  68. Heleika, M.A.; Ismail, E.; Ahmed, M. Delineation of contamination zone using geophysical and hydrogeochemical methods around the El Moheet drain in the El Minia district, Upper Egypt. Arab. J. Geosci. 2018, 11, 625. [Google Scholar] [CrossRef]
  69. Rai, V.; Vajpayee, P.; Singh, S.N.; Mehrotra, S. Effect of chromium accumulation on photosynthetic pigments, oxidative stress defense system, nitrate reduction, proline level and eugenol content of Ocimum tenuiflorum L. Plant Sci. 2004, 167, 1159–1169. [Google Scholar] [CrossRef]
  70. Rashed, M. Monitoring of contaminated toxic and heavy metals, from mine tailings through age accumulation, in soil and some wild plants at Southeast Egypt. J. Hazard. Mater. 2010, 178, 739–746. [Google Scholar] [CrossRef]
  71. Abuzaid, A.S.; Jahin, H.S.; Asaad, A.A.; Fadl, M.E.; AbdelRahman, M.A.E.; Scopa, A. Accumulation of Potentially Toxic Metals in Egyptian Alluvial Soils, Berseem Clover (Trifolium alexandrinum L.), and Groundwater after Long-Term Wastewater Irrigation. Agriculture 2021, 11, 713. [Google Scholar] [CrossRef]
  72. Abd-Elmabod, S.K.; Mansour, H.; Hussein, A.A.E.F.; Mohamed, E.S.; Zhang, Z. Influence of irrigation water quantity on the land capability classification. Plant Arch. 2019, 2, 2253–2561. [Google Scholar]
  73. Elgharably, A.; Abdel Mageed, A.; Elgharably, G. Status of heavy metals in soils of Assiut as affected by the long-term use of sewage water in crop irrigation: Case study. Egypt. J. Soil Sci. 2014, 54, 289–304. [Google Scholar]
Figure 1. Location map of the study area.
Agronomy 12 01197 g001
Figure 2. Flowchart methodology of the current work.
Agronomy 12 01197 g002
Figure 3. Spatial distribution of soi pH, EC, and organic carbon (OC).
Agronomy 12 01197 g003
Figure 4. Spatial distribution of heavy metals total concentrations.
Agronomy 12 01197 g004
Figure 5. Scree plot for eigenvalue and cumulative variability (%) of different principal components.
Agronomy 12 01197 g005
Figure 6. Principal component biplot.
Agronomy 12 01197 g006
Figure 7. Dendrogram for the extracted clusters by agglomerative hierarchical clustering (AHC).
Agronomy 12 01197 g007
Figure 8. Land Use of the study and location of cluster 1 (C1) and cluster 2 (C2).
Agronomy 12 01197 g008
Figure 9. Contamination levels for each studied heavy metal in Cluster 1 (a) and Cluster 2 (b).
Agronomy 12 01197 g009
Figure 10. Map of degree of contamination in the study area.
Agronomy 12 01197 g010
Table 1. Descriptive statistics (quantitative data) of the studied variables:.
StatisticpH
1:2.5
ECe
dS m−1
OC
g kg−1
mg kg−1
CrCoCuCdPbZn
Nbr. of observations606060606060606060
Minimum7.791.767.5253.0919.9734.610.2915.5966.28
Maximum8.5610.1016.90165.9643.5291.402.0779.41235.44
Mean8.124.0412.6482.6328.6251.570.8831.5493.91
Standard deviation0.141.802.6322.295.5911.430.4616.4432.40
Skewness (Pearson)0.271.57−0.071.140.401.420.821.702.84
Chemical composition of the upper continental crust
(Taylor and Mclennan,1995)
3510250.12071
Average natural concentration of heavy metals in rocks
(values in mg kg−1) (Bradl, 2005)
15–701.3–109.9–390.1–0.132.6–2737–68
Table 2. Semi-variogram parameters of the spatial data modelling.
VariableModelNugget (C0)Partial sillSill (C0 + C)Nugget/SillMajor RangeSDCRMSEASERMSSEASE
pHGaussiang0.0900.220.310.29270Moderate0.570.0240.950.48
ECExponential0.0060.260.270.02560strong0.650.0100.970.40
OCStable0.0000.240.240.00270strong0.650.0200.920.43
Crspherical0.0200.340.360.05270strong0.910.0200.910.40
CoStable0.6100.290.900.67270Moderate0.500.0010.970.40
CuStable0.1200.200.320.37292Moderate0.500.0300.960.42
CdStable0.0000.340.340.00270strong0.680.0300.880.52
PbGaussiang0.1500.070.220.681615Moderate0.510.0020.980.42
Znspherical0.0000.500.500.00362strong0.720.0701.010.59
Table 3. Correlation matrix (Pearson) of the studied variables:.
VariablespH (1:2.5)ECe
dS m−1
OC
g kg−1
Cr
mg kg−1
Co
mg kg−1
Cu
mg kg−1
Cd
mg kg−1
Pb
mg kg−1
Zn
mg kg−1
pH (1:2.5)1
ECe dS m1−0.402 **1
OC g kg−1−0.0680.1651
Cr mg kg−1−0.391 **0.1600.2111
Co mg kg−1−0.231−0.0380.447 ***0.272 *1
Cu mg kg−1−0.2820.0710.445 ***0.616 ***0.417 **1
Cd mg kg−1−0.437 ***0.1130.0840.839 ***0.1610.535 ***1
Pb mg kg−1−0.320 *0.1730.0040.526 ***0.0270.464 ***0.585 ***1
Zn mg kg−1−0.354 **0.323 *0.285 *0.414 **0.2180.539 ***0.470 ***0.589 ***1
Note: Values in bold are different from 0 with a significance level alpha = 0.05. * p <0.05; ** p < 0.01; *** p < 0.001.
Table 4. Factors extracted by principal component analysis:.
F1F2F3
Eigenvalue 3.8011.4561.168
Variability (%) 42.22816.17812.983
Cumulative % 42.22858.40571.388
pH (1:2.5)Factor loadings or
Correlations between variables and factors
−0.5880.204−0.409
ECe dS m−10.331−0.2150.835
OC g kg−10.3890.7370.231
Cr mg kg−10.830−0.097−0.264
Co mg kg−10.4160.704−0.015
Cu mg kg−10.7890.291−0.196
Cd mg kg−10.812−0.267−0.296
Pb mg kg−10.705−0.402−0.160
Zn mg kg−10.744−0.0510.169
Values in bold correspond for each variable to the factor for which the squared cosine is the largest.
Table 5. Descriptive statistics (quantitative data) of the studied variables for clusters:.
ClusterStatisticpH (1:2.5)ECe
dS m−1
OC
g kg−1
mg kg−1DCDC
Level
CrCoCuCdPbZn
1No. of observations38383838383838383838Moderate
Minimum7.961.767.5253.0919.9734.610.2916.9866.2810.64
Maximum8.566.2316.9090.9043.5291.401.0748.60131.1319.85
Mean8.17 a3.38 b12.13 a69.88 b27.63 a47.00 b0.61 b24.80 b82.12 b15.14 b
SD0.120.942.659.416.089.110.177.3311.811.88
Skewness1.350.810.16−0.070.582.960.381.651.72−0.25
2No. of observations22222222222222222222Considerable
Minimum7.792.399.3763.5122.7243.000.4115.5979.2813.12
Maximum8.2210.1016.80165.9642.5681.332.0779.41235.4433.57
Mean8.02 b5.17 a13.52 a104.64 a30.33 a59.45 a1.35 a43.19 a114.30 a25.70 a
SD0.122.312.3420.904.0910.720.4220.7544.345.68
Skewness−0.310.63−0.400.500.920.67−0.790.591.62−0.93
Means of variables with different letters indicate a significant difference between them.
Table 6. Average of heavy metals contents in each degree of contamination of the study area:.
DCmg kg−1Area, h
(%)
LevelValueCrCoCuCdPbZn
Moderate14.16 ± 1.468.84 ± 9.427.09 ± 5.447.15 ± 10.00.53 ± 0.123.80 ± 7.980.27 ± 8.0830.9 (28.73%)
Considerable22.16 ± 4.891.23 ± 19.529.44 ± 5.253.83 ± 10.21.12 ± 0.336.04 ± 18.0101.29 ± 352045.0 (70.7%)
very high32.85 ± 0.5124.53 ± 24.834.14 ± 5.468.32 ± 8.71.83 ± 0.257.28 ± 13.7143.09 ± 53.716.4 (0.57)
Publisher’s Note: MDPI stays neutral with regard to jurisdictional claims in published maps and institutional affiliations.

