
Root Characterization of Myanmar Upland and Lowland Rice in Relation to Agronomic and Physiological Traits under Drought Stress Condition

 ,
,
Abstract
:1. Introduction
2. Materials and Methods
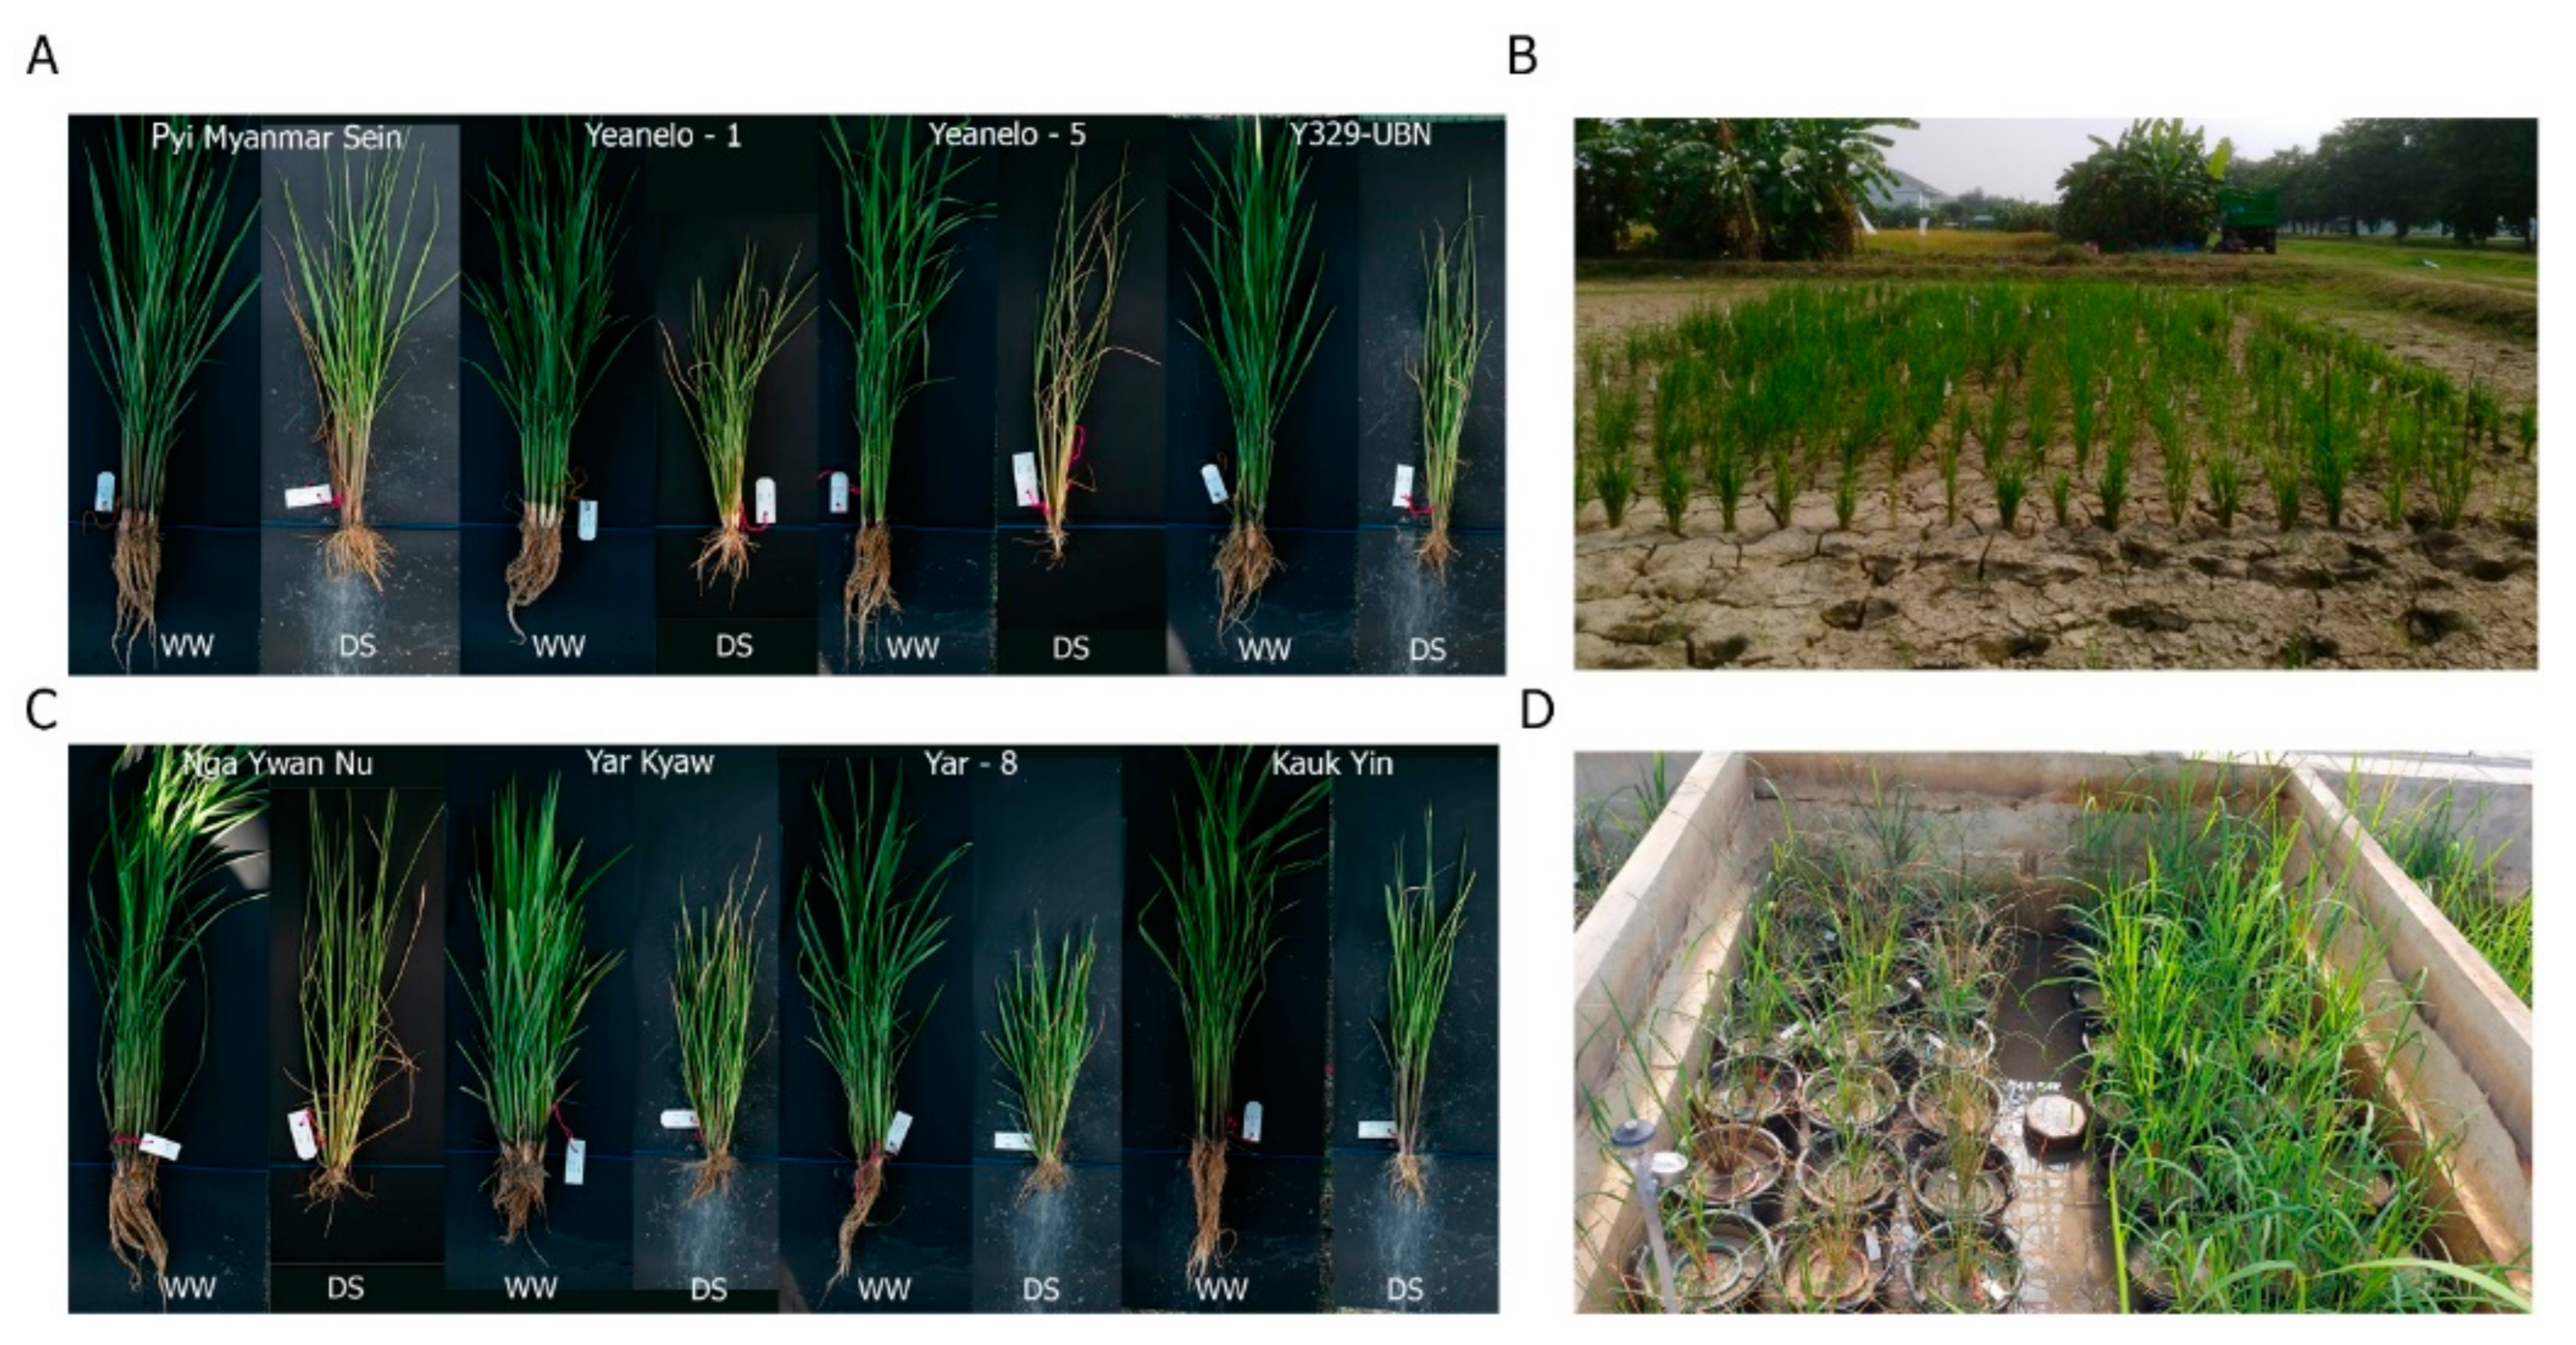
2.1. Plant Materials, Growth Conditions, and Drought Treatment
2.2. Shoot Measurements
2.3. Root Measurements
2.4. Statistical Analysis
3. Results
3.1. Field Experiment
3.2. Pot Experiment
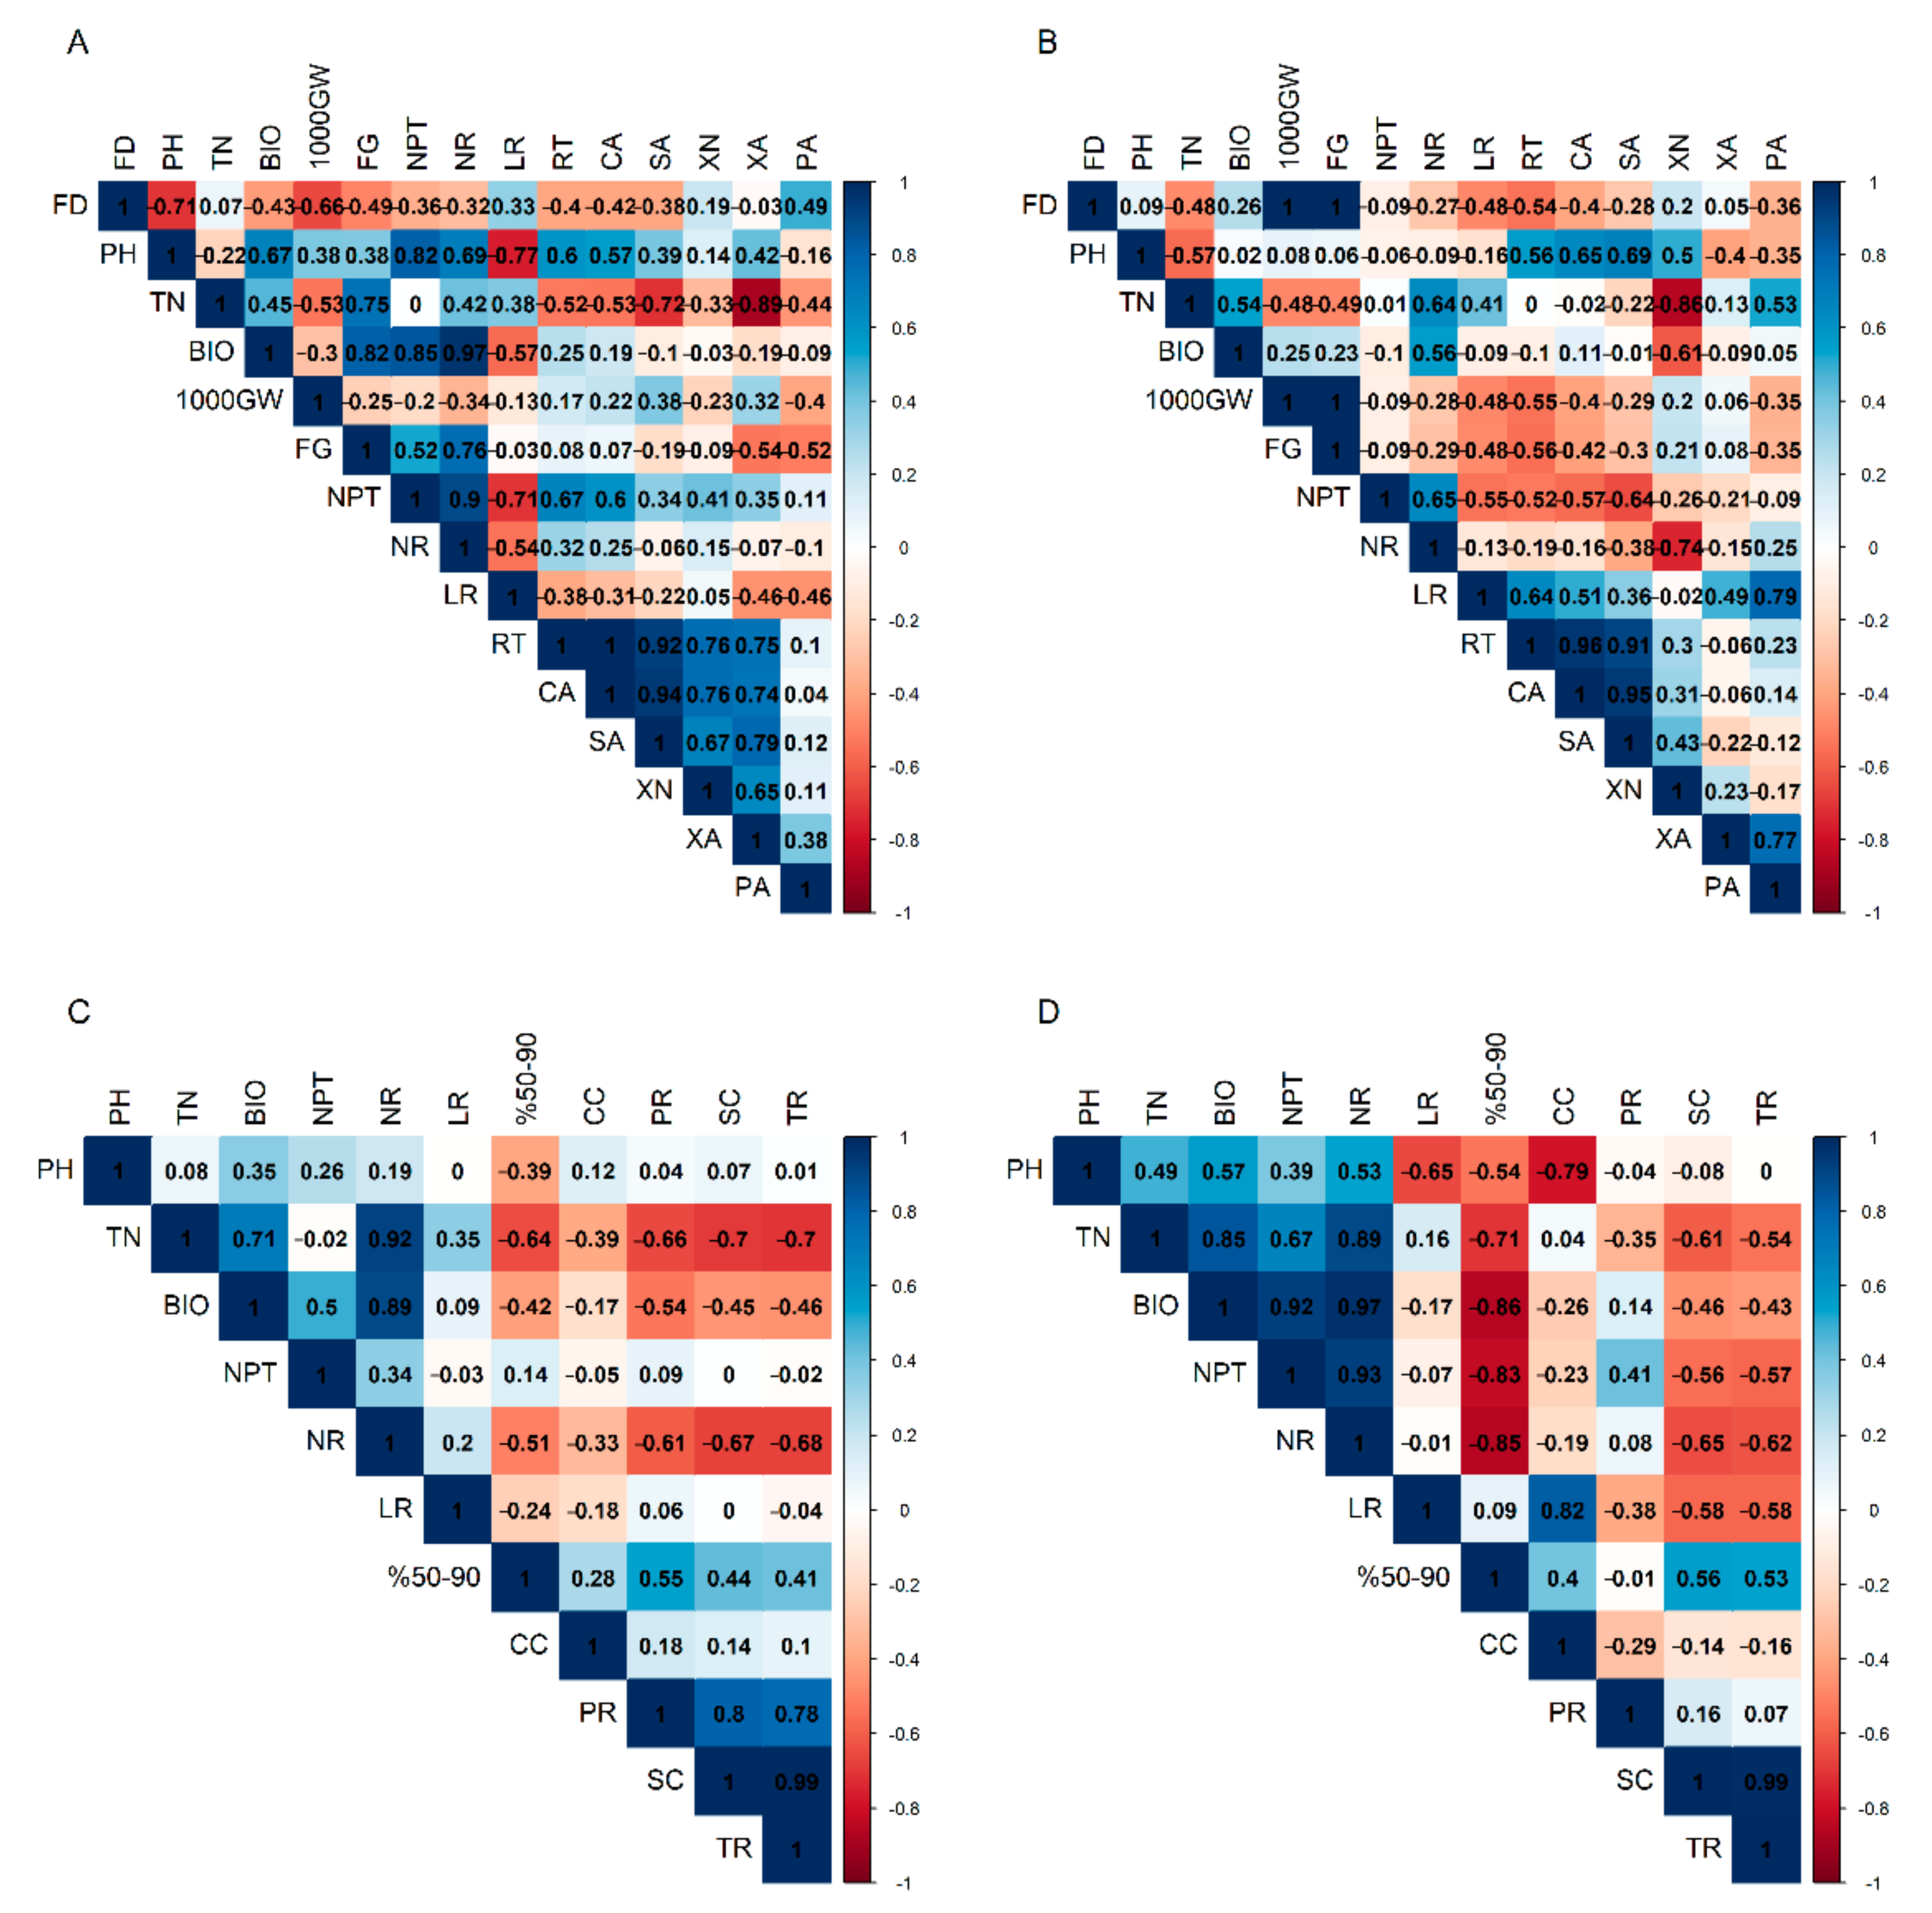
3.3. Correlation of Root Traits and Other Traits under Drought
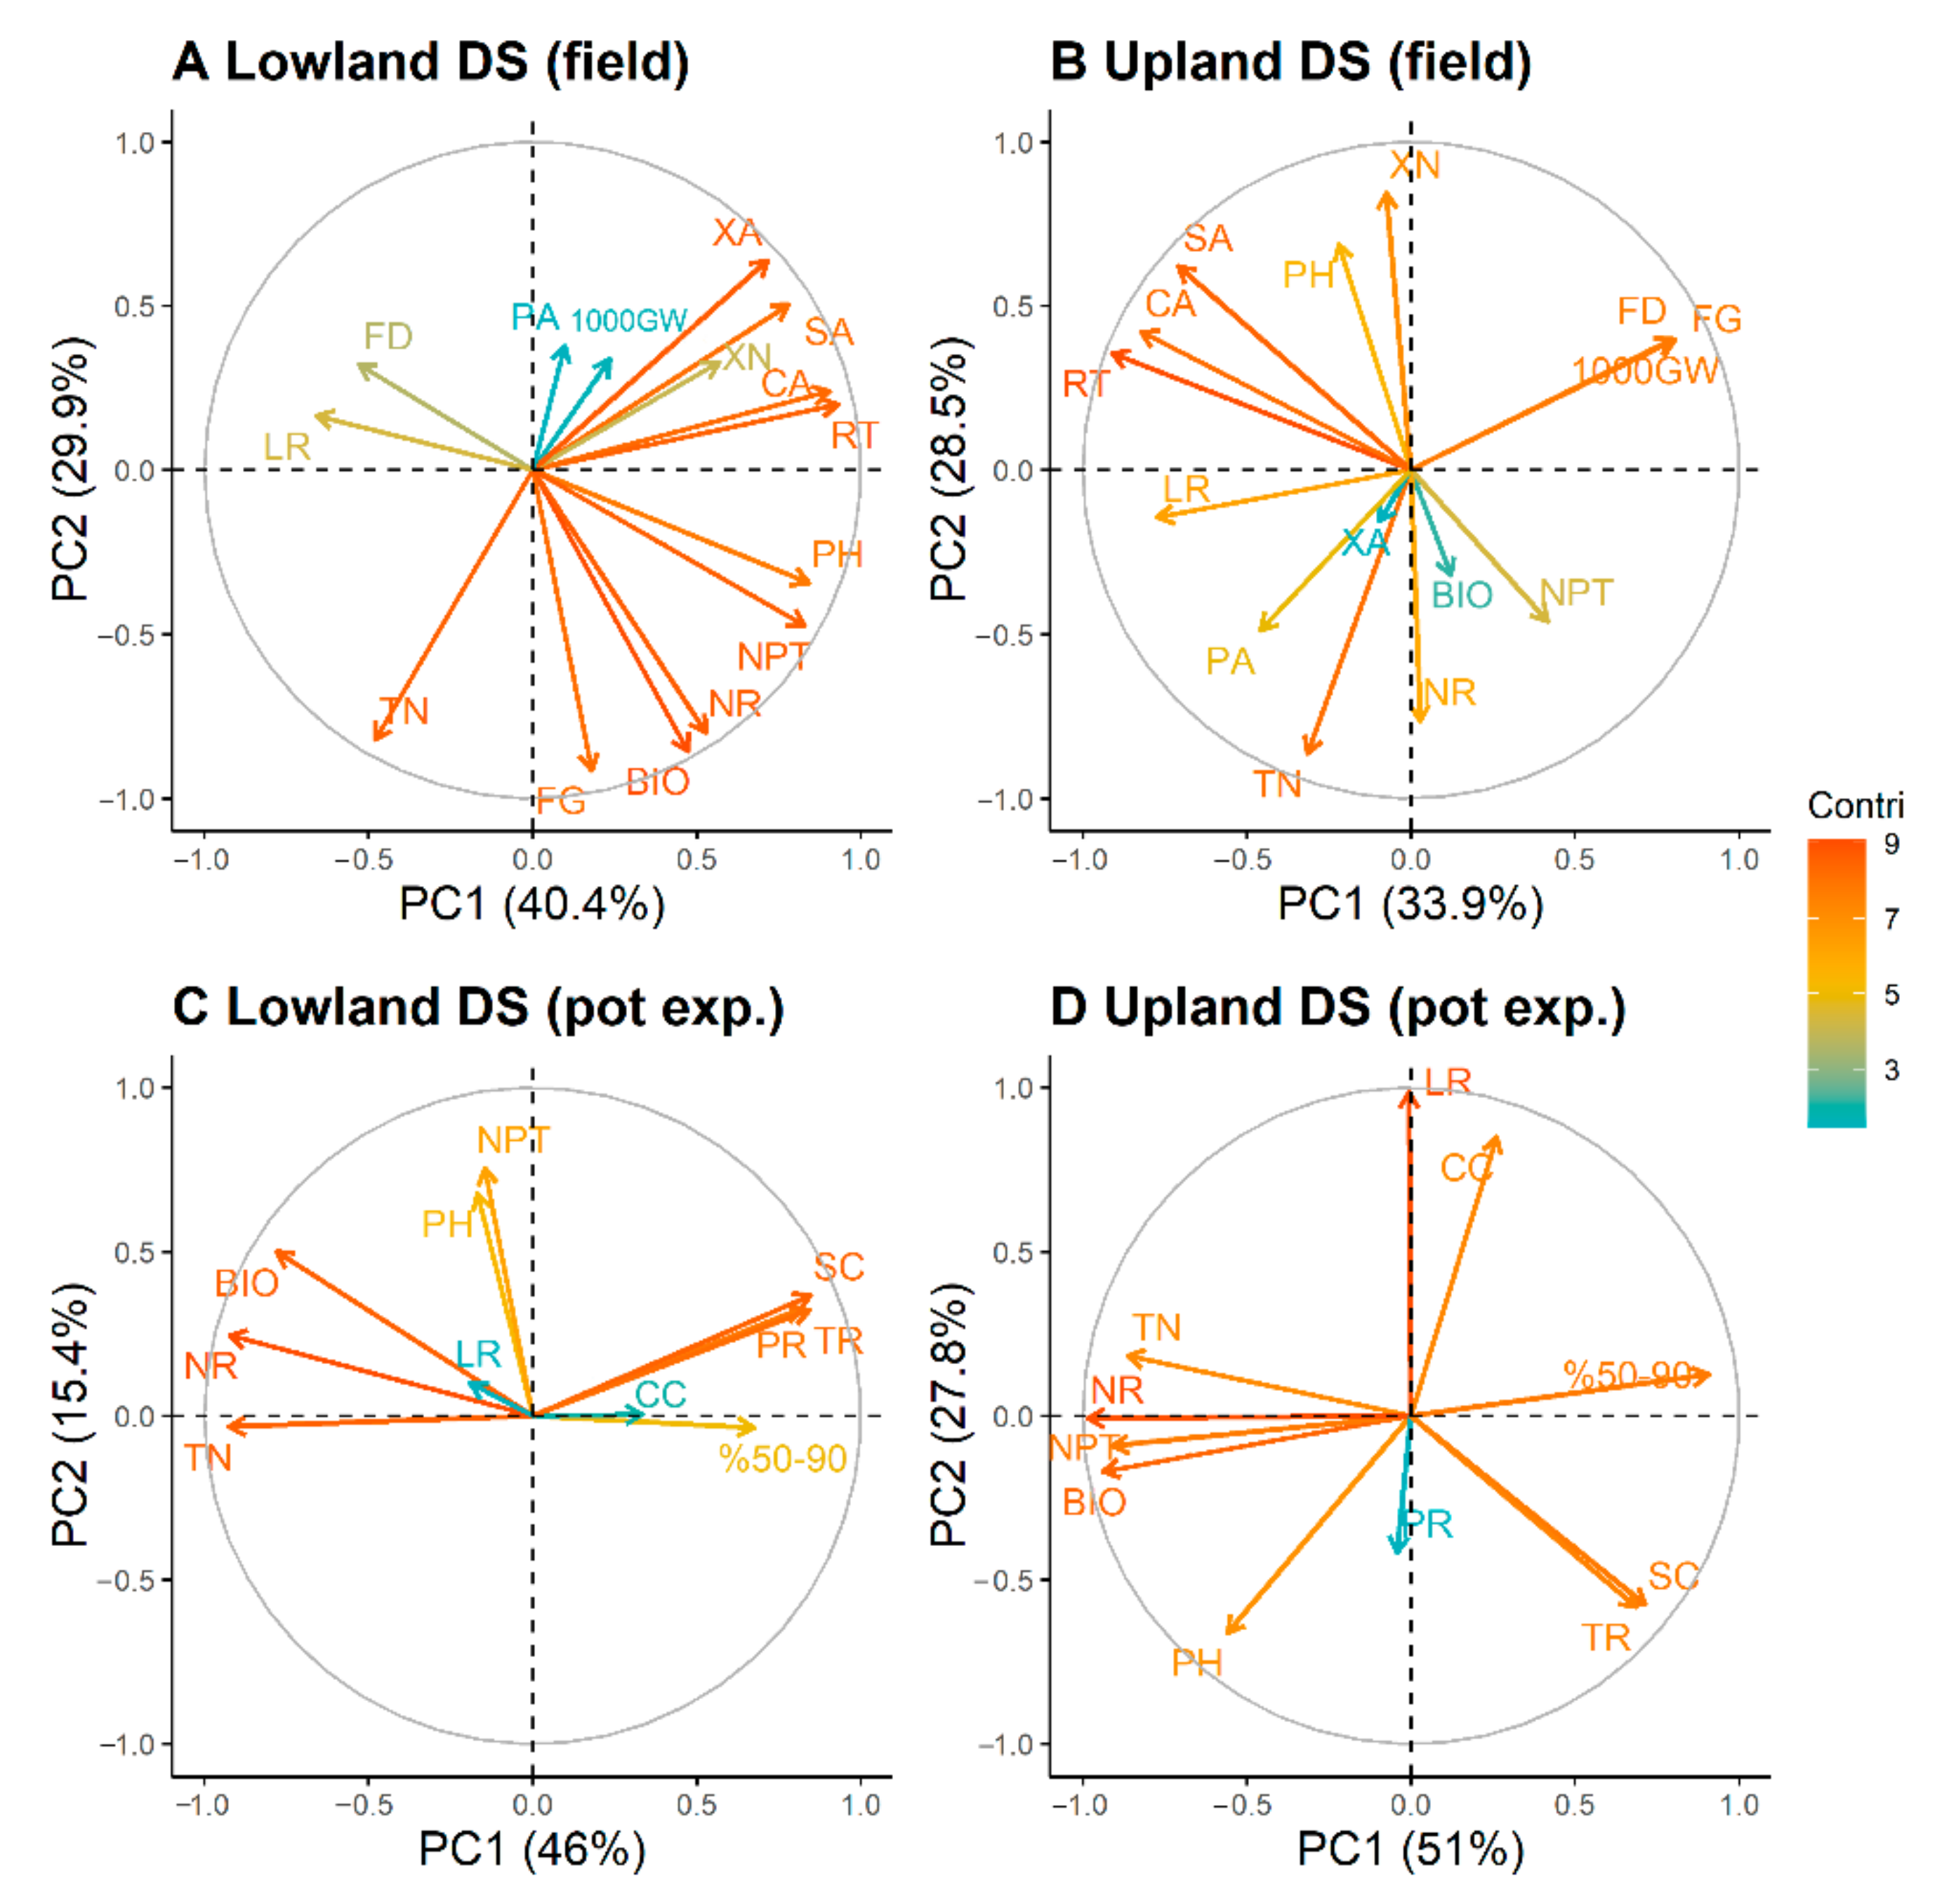
3.4. Principal Component Analysis (PCA)
3.5. Bulk Analysis
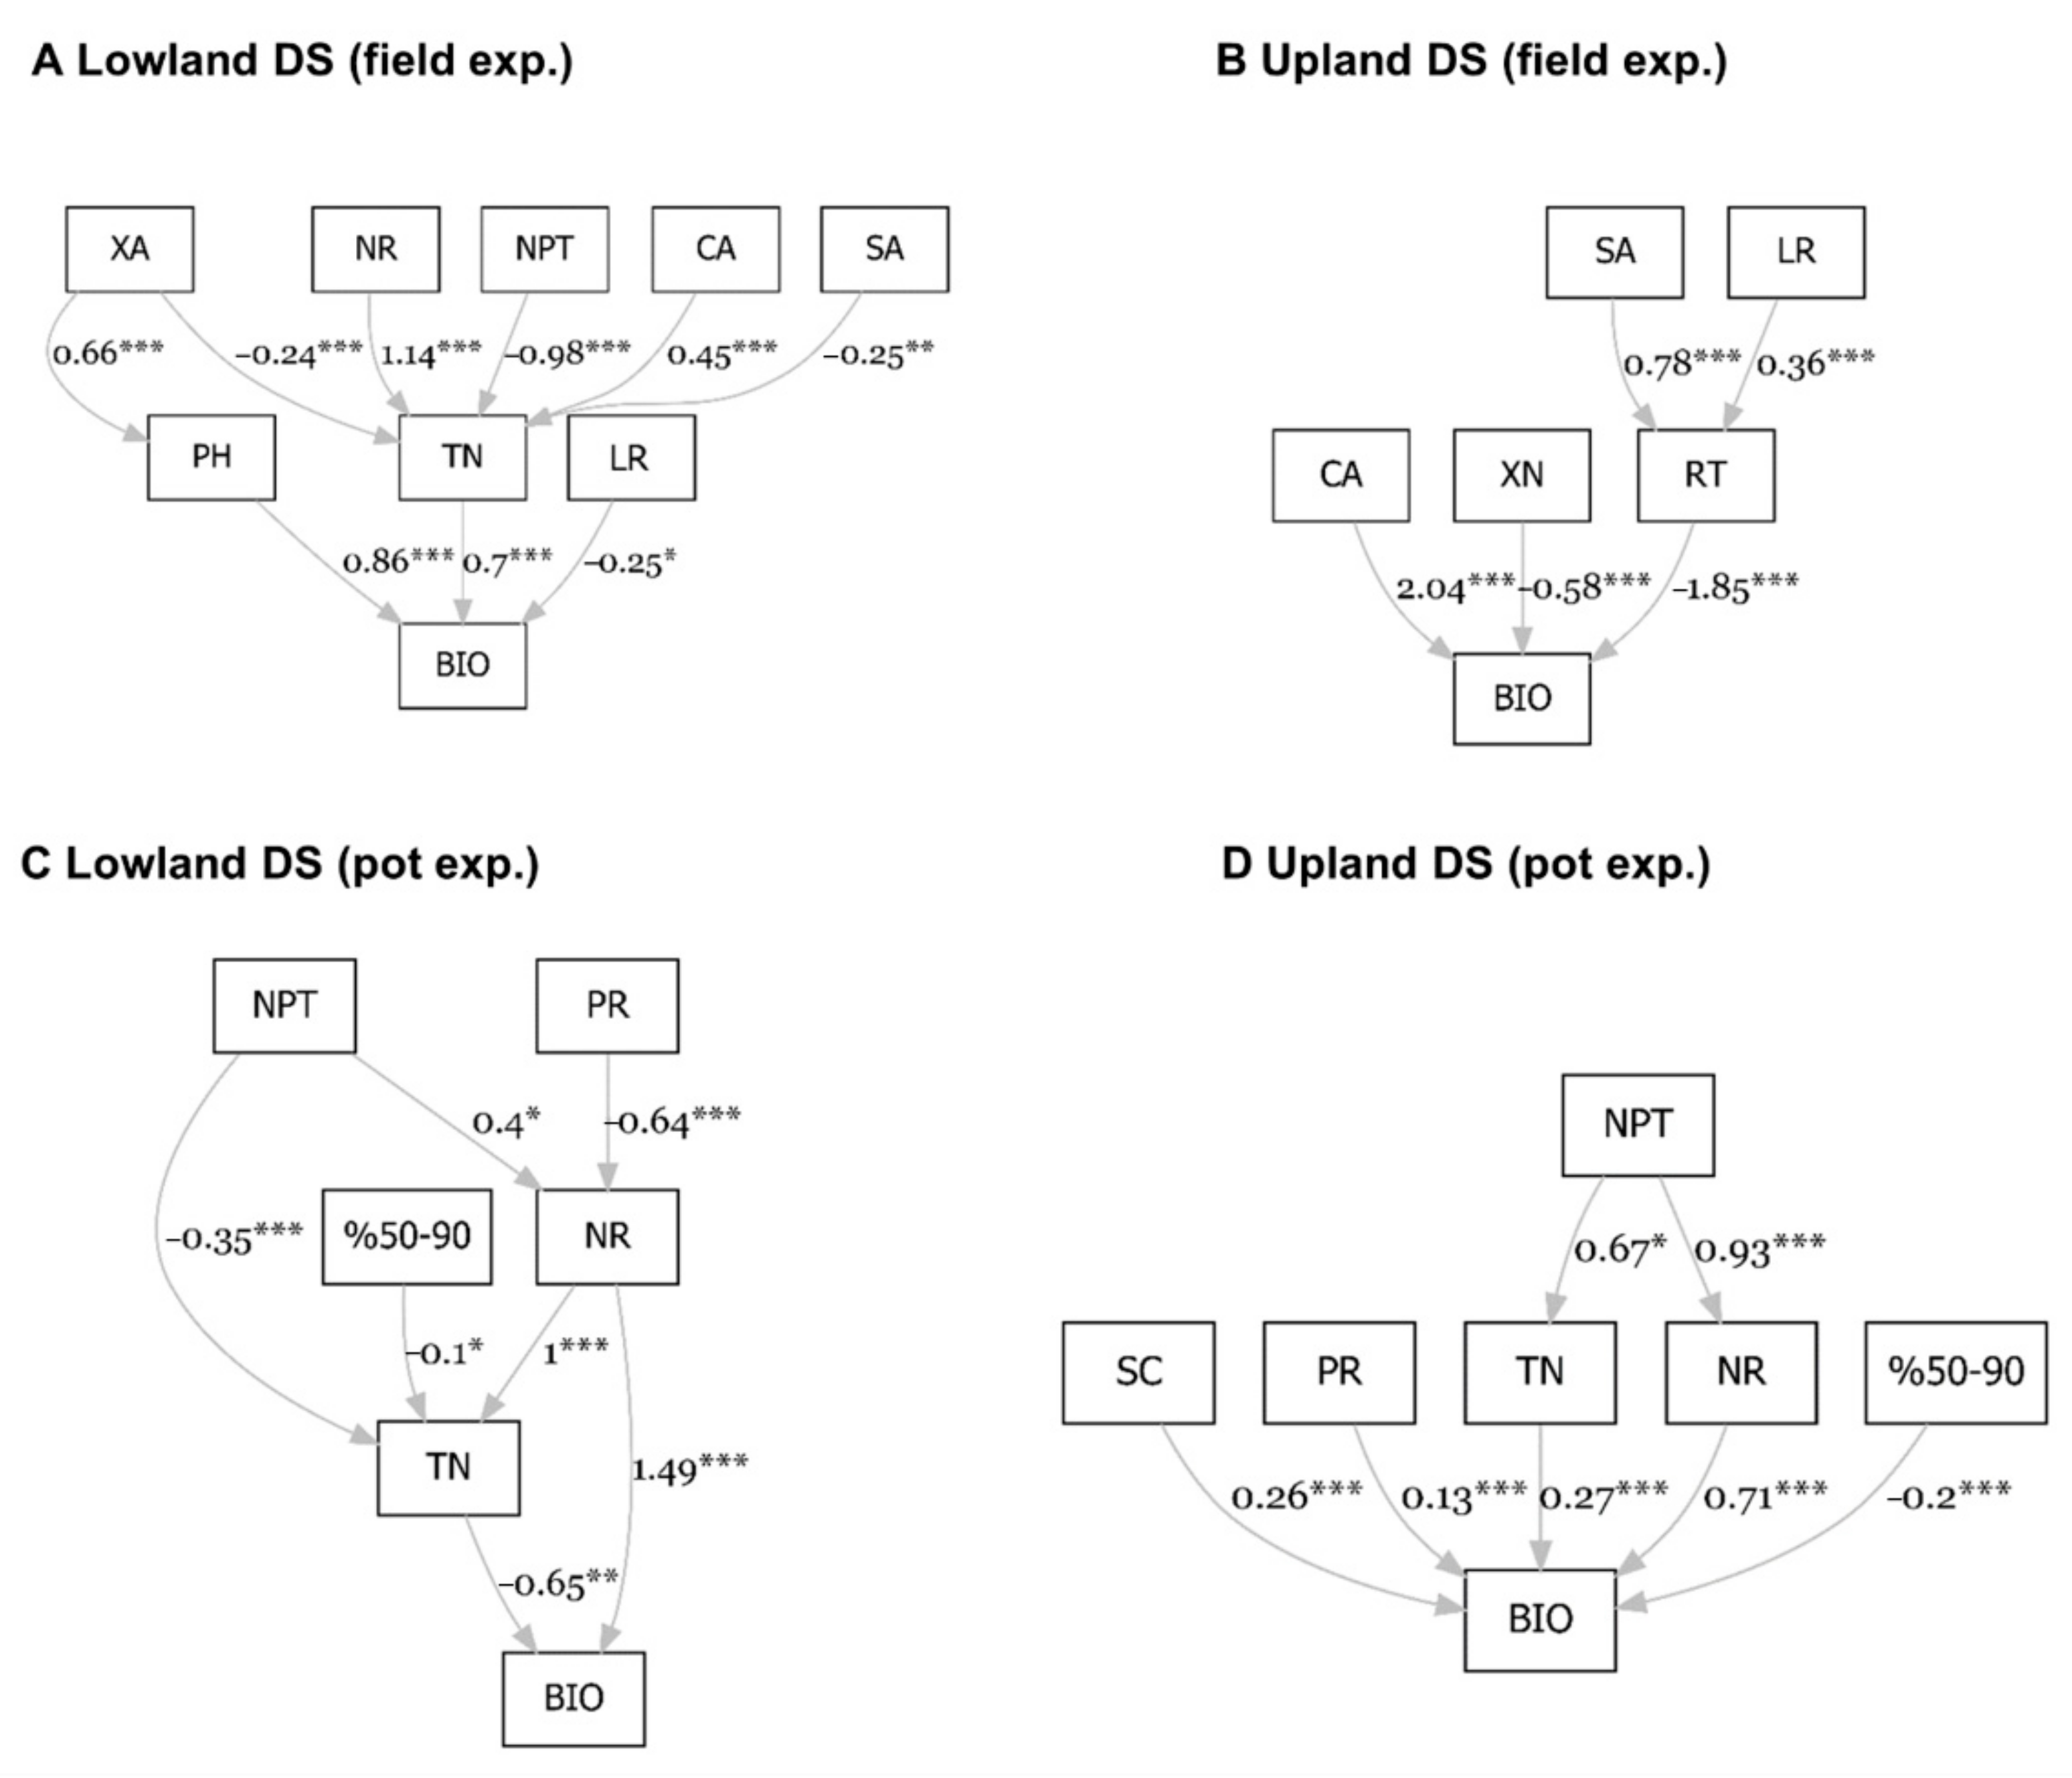
3.6. Path Analysis
4. Discussion
5. Conclusions
Supplementary Materials
Author Contributions
Funding
Data Availability Statement
Acknowledgments
Conflicts of Interest
References
- Hsiao, T.C.; O’Toole, J.C.; Yambao, E.B.; Turner, N.C. Influence of Osmotic Adjustment on Leaf Rolling and Tissue Death in Rice (Oryza sativa L.). Plant Physiol. 1984, 75, 338–341. [Google Scholar] [CrossRef] [PubMed] [Green Version]
- O’Toole, J. Adaptation of rice to drought-prone environments. In Drought Resistance in Crops, with Emphasis on Rice; International Rice Research Institute: Manila, PA, USA, 1982; pp. 195–213. [Google Scholar]
- Venuprasad, R.; Cruz, M.S.; Amante, M.; Magbanua, R.; Kumar, A.; Atlin, G. Response to two cycles of divergent selection for grain yield under drought stress in four rice breeding populations. Field Crop. Res. 2008, 107, 232–244. [Google Scholar] [CrossRef]
- Myint, U.T.; Thaw, S.H.; Nyein, Y.Y. Overview of droughts in Myanmar. In Droughts in Asian Monsoon Region; Emerald Group Publishing Limited: West Yorkshire, UK, 2011. [Google Scholar]
- Kamoshita, A.; Babu, R.C.; Boopathi, N.M.; Fukai, S. Phenotypic and genotypic analysis of drought-resistance traits for development of rice cultivars adapted to rainfed environments. Field Crop. Res. 2008, 109, 1–23. [Google Scholar] [CrossRef]
- Palanog, A.D.; Swamy, B.M.; Shamsudin, N.A.A.; Dixit, S.; Hernandez, J.E.; Boromeo, T.H.; Cruz, P.C.S.; Kumar, A. Grain yield QTLs with consistent-effect under reproductive-stage drought stress in rice. Field Crop. Res. 2014, 161, 46–54. [Google Scholar] [CrossRef]
- Bernier, J.; Atlin, G.N.; Serraj, R.; Kumar, A.; Spaner, D. Breeding upland rice for drought resistance. J. Sci. Food Agric. 2008, 88, 927–939. [Google Scholar] [CrossRef]
- Bouman, B. Water Management in Irrigated Rice: Coping with Water Scarcity; Int. Rice Res. Inst.: Metro Manila, PA, USA, 2007. [Google Scholar]
- Lynch, J.P. Roots of the Second Green Revolution. Aust. J. Bot. 2007, 55, 493–512. [Google Scholar] [CrossRef]
- Serraj, R.; Krishnamurthy, L.; Kashiwagi, J.; Kumar, J.; Chandra, S.; Crouch, J. Variation in root traits of chickpea (Cicer arietinum L.) grown under terminal drought. Field Crop. Res. 2004, 88, 115–127. [Google Scholar] [CrossRef] [Green Version]
- Fukai, S.; Inthapan, P. Growth and yield of rice cultivars under sprinkler irrigation in south-eastern Queensland. 3. Water extraction and plant water relations dash comparison with maize and grain sorghum. Aust. J. Exp. Agric. 1988, 28, 249–252. [Google Scholar] [CrossRef]
- Marschner, H. Soil-Root Interface: Biological and Biochemical Processes. Soil Chem. Ecosyst. Health 1998, 52, 191–231. [Google Scholar]
- Lynch, J. Root Architecture and Plant Productivity. Plant Physiol. 1995, 109, 7–13. [Google Scholar] [CrossRef]
- Samson, B.; Hasan, M.; Wade, L. Penetration of hardpans by rice lines in the rainfed lowlands. Field Crop. Res. 2002, 76, 175–188. [Google Scholar] [CrossRef]
- Wang, H.; Yamauchi, A. Growth and function of roots under abiotic stress soils. In Plant-Environmental Interactions, 3rd ed.; Huang, B., Ed.; CRC Press: New York, NY, USA, 2006; pp. 271–320. [Google Scholar]
- Gowda, V.R.; Henry, A.; Yamauchi, A.; Shashidhar, H.; Serraj, R. Root biology and genetic improvement for drought avoidance in rice. Field Crop. Res. 2011, 122, 1–13. [Google Scholar] [CrossRef]
- Henry, A.; Cal, A.J.; Batoto, T.C.; Torres, R.O.; Serraj, R. Root attributes affecting water uptake of rice (Oryza sativa) under drought. J. Exp. Bot. 2012, 63, 4751–4763. [Google Scholar] [CrossRef] [PubMed]
- Morita, M.; Kato, T.; Nagafusa, K.; Saito, C.; Ueda, T.; Nakano, A.; Tasaka, M. Involvement of the Vacuoles of the Endodermis in the Early Process of Shoot Gravitropism in Arabidopsis. Plant Cell 2002, 14, 47–56. [Google Scholar] [CrossRef] [Green Version]
- Fukai, S.; Cooper, M. Development of drought-resistant cultivars using physiomorphological traits in rice. Field Crop. Res. 1995, 40, 67–86. [Google Scholar] [CrossRef]
- Uga, Y.; Okuno, K.; Yano, M. Dro1, a major QTL involved in deep rooting of rice under upland field conditions. J. Exp. Bot. 2011, 62, 2485–2494. [Google Scholar] [CrossRef] [Green Version]
- Yoshida, S.; Hasegawa, S. The rice root system: Its development and function. Drought Resist. Crops Emphas. Rice 1982, 10, 97–134. [Google Scholar]
- Kato, Y.; Kamoshita, A.; Yamagishi, J. Preflowering abortion reduces spikelet number in upland rice (Oryza sativa L.) under water stress. Crop Sci. 2008, 48, 2389–2395. [Google Scholar] [CrossRef]
- Lipiec, J.; Doussan, C.; Nosalewicz, A.; Kondracka, K. Effect of drought and heat stresses on plant growth and yield: A review. Int. Agrophys. 2013, 27, 463–477. [Google Scholar] [CrossRef]
- Fukai, S.; Pantuwan, G.; Jongdee, B.; Cooper, M. Screening for drought resistance in rainfed lowland rice. Field Crop. Res. 1999, 64, 61–74. [Google Scholar] [CrossRef]
- Uga, Y.; Sugimoto, K.; Ogawa, S.; Rane, J.; Ishitani, M.; Hara, N.; Kitomi, Y.; Inukai, Y.; Ono, K.; Kanno, N.; et al. Control of root system architecture by DEEPER ROOTING 1 increases rice yield under drought conditions. Nat. Genet. 2013, 45, 1097–1102. [Google Scholar] [CrossRef] [PubMed]
- GIMP—GNU Image Manipulation Program. Available online: https://www.gimp.org/ (accessed on 8 March 2022).
- Kato, Y.; Abe, J.; Kamoshita, A.; Yamagishi, J. Genotypic Variation in Root Growth Angle in Rice (Oryza sativa L.) and its Association with Deep Root Development in Upland Fields with Different Water Regimes. Plant Soil 2006, 287, 117–129. [Google Scholar] [CrossRef]
- Ruangsiri, M.; Vejchasarn, P.; Saengwilai, P.; Lynch, J.; Bennett, M.J.; Brown, K.M.; Chutteang, C.; Boonruangrod, R.; Shearman, J.; Toojinda, T.; et al. Genetic control of root architectural traits in KDML105 chromosome segment substitution lines under well-watered and drought stress conditions. Plant Prod. Sci. 2021, 24, 512–529. [Google Scholar] [CrossRef]
- Payne, R.W. GenStat. Wiley Interdiscip. Rev. Comput. Stat. 2009, 1, 255–258. [Google Scholar] [CrossRef]
- Cluster Analysis in R: Practical Guide. Available online: www.sthda.com/english/articles/25-clusteranalysis-in-r-practical-guide (accessed on 9 December 2017).
- Rosseel, Y. lavaan: An R package for structural equation modeling. J. Stat. Softw. 2012, 48, 1–36. [Google Scholar] [CrossRef] [Green Version]
- Dewey, D.R.; Lu, K.H. A Correlation and Path-Coefficient Analysis of Components of Crested Wheatgrass Seed Production 1. Agron. J. 1959, 51, 515–518. [Google Scholar] [CrossRef]
- Singh, A.; Mall, A.; Singh, P.; Verma, O. Interrelationship of genetics parameters for quantitative and physiological traits in rice under irrigated and drought conditions. Oryza-Int. J. Rice 2010, 47, 142–147. [Google Scholar]
- Laude, H.M. Drought Influence on Physiological Processes and Subsequent Growth. Drought Inj. Resist. Crops 1971, 2, 45–56. [Google Scholar]
- Sahebi, M.; Hanafi, M.M.; Rafii, M.; Mahmud, T.; Azizi, P.; Osman, M.; Abiri, R.; Taheri, S.; Kalhori, N.; Shabanimofrad, M. Improvement of drought tolerance in rice (Oryza sativa L.): Genetics, genomic tools, and the WRKY gene family. BioMed Res. Int. 2018, 3158474. [Google Scholar] [CrossRef] [Green Version]
- Sarkarung, S. Breeding rice cultivars suitable for rainfed lowland environments: A farmers participatory approach for eastern India. Particip. Plant Breed. 1995, 26, 123. [Google Scholar]
- Merrill, S.D.; Black, A.L.; Bauer, A. Conservation Tillage Affects Root Growth of Dryland Spring Wheat under Drought. Soil Sci. Soc. Am. J. 1996, 60, 575–583. [Google Scholar] [CrossRef]
- Merrill, S.D.; Tanaka, D.L.; Hanson, J.D. Root length growth of eight crop species in Haplustoll soils. Soil Sci. Soc. Am. J. 2002, 66, 913–923. [Google Scholar] [CrossRef]
- Sainju, U.M.; Singh, B.P.; Whitehead, W.F. Tillage, Cover Crops, and Nitrogen Fertilization Effects on Cotton and Sorghum Root Biomass, Carbon, and Nitrogen. Agron. J. 2005, 97, 1279–1290. [Google Scholar] [CrossRef] [Green Version]
- Stone, P.; Wilson, D.R.; Jamieson, P.; Gillespie, R. Water deficit effects on sweet corn. II. Canopy development. Aust. J. Agric. Res. 2001, 52, 115–126. [Google Scholar] [CrossRef]
- Zobel, R.W. Root growth and development. In The Rhizosphere and Plant Growth; Springer: Berlin/Heidelberg, Germany, 1991; pp. 61–71. [Google Scholar]
- Hazman, M.; Brown, K.M. Progressive drought alters architectural and anatomical traits of rice roots. Rice 2018, 11, 1–16. [Google Scholar] [CrossRef] [PubMed]
- Gao, Y.; Lynch, J.P. Reduced crown root number improves water acquisition under water deficit stress in maize (Zea mays L.). J. Exp. Bot. 2016, 67, 4545–4557. [Google Scholar] [CrossRef] [Green Version]
- Kato, Y.; Okami, M. Root morphology, hydraulic conductivity and plant water relations of high-yielding rice grown under aerobic conditions. Ann. Bot. 2011, 108, 575–583. [Google Scholar] [CrossRef]
- Lynch, J.P. Steep, cheap and deep: An ideotype to optimize water and N acquisition by maize root systems. Ann. Bot. 2013, 112, 347–357. [Google Scholar] [CrossRef] [Green Version]
- Postma, J.A.; Dathe, A.; Lynch, J.P. The Optimal Lateral Root Branching Density for Maize Depends on Nitrogen and Phosphorus Availability. Plant Physiol. 2014, 166, 590–602. [Google Scholar] [CrossRef] [Green Version]
- Phoura, Y.; Kamoshita, A.; Norisada, M.; Deshmukh, V. Eco-physiological evaluation of Stele Transversal Area 1 for rice root anatomy and shoot growth. Plant Prod. Sci. 2020, 23, 202–210. [Google Scholar] [CrossRef] [Green Version]
- Yambao, E.B.; Ingram, K.T.; Real, J.G. Root Xylem Influence on the Water Relations and Drought Resistance of Rice. J. Exp. Bot. 1992, 43, 925–932. [Google Scholar] [CrossRef]
- Chang, T.; Armenta-Soto, J.; Mao, C.; Peiris, R.; Loresto, G. Genetic studies on the components of drought resistance in rice (Oryza sativa L.). In IRRI (Ed) Rice Genetics; Int Rice Res Inst: Los Baños, PA, USA, 1986; pp. 387–398. [Google Scholar]
- Ekanayake, I.J.; O’Toole, J.C.; Garrity, D.P.; Masajo, T.M. Inheritance of Root Characters and their Relations to Drought Resistance in Rice 1. Crop Sci. 1985, 25, 927–933. [Google Scholar] [CrossRef]
- Ingram, K.; Bueno, F.; Namuco, O.; Yambao, E.; Beyrouty, C. Rice root traits for drought resistance and their genetic variation. In Rice Roots: Nutrient and Water Use; Kirk, G.J.D., Ed.; International Rice Research Institute: Manila, PA, USA, 1994. [Google Scholar]
- Richards, R.; Passioura, J. A breeding program to reduce the diameter of the major xylem vessel in the seminal roots of wheat and its effect on grain yield in rain-fed environments. Aust. J. Agric. Res. 1989, 40, 943–950. [Google Scholar] [CrossRef]
- Sperry, J.S.; Saliendra, N.Z. Intra- and inter-plant variation in xylem cavitation in Betula occidentalis. Plant Cell Environ. 1994, 17, 1233–1241. [Google Scholar] [CrossRef]
- Tyree, M.T.; Yang, S.; Cruiziat, P.; Sinclair, B. Novel Methods of Measuring Hydraulic Conductivity of Tree Root Systems and Interpretation Using AMAIZED (A Maize-Root Dynamic Model for Water and Solute Transport). Plant Physiol. 1994, 104, 189–199. [Google Scholar] [CrossRef] [Green Version]
- Alder, N.; Sperry, J.; Pockman, W. Root and stem xylem embolism, stomatal conductance, and leaf turgor in Acer grandidentatum populations along a soil moisture gradient. Oecologia 1996, 105, 293–301. [Google Scholar] [CrossRef]
- Gallardo, M.; Jackson, L.; Thompson, R. Shoot and root physiological responses to localized zones of soil moisture in cultivated and wild lettuce (Lactuca spp.). Plant Cell Environ. 1996, 19, 1169–1178. [Google Scholar] [CrossRef]
- Pierret, A.; Doussan, C. Spatio-temporal Variations in Axial Conductance of Primary and First-order Lateral Roots of a Maize Crop as Predicted by a Model of the Hydraulic Architecture of Root Systems. Plant Soil 2006, 282, 117–126. [Google Scholar] [CrossRef]
- Zobel, R.W.; Kinraide, T.B.; Baligar, V.C. Fine root diameters can change in response to changes in nutrient concentrations. Plant Soil 2007, 297, 243–254. [Google Scholar] [CrossRef]
- Henry, A.; Gowda, V.R.; Torres, R.O.; McNally, K.; Serraj, R. Variation in root system architecture and drought response in rice (Oryza sativa): Phenotyping of the OryzaSNP panel in rainfed lowland fields. Field Crop. Res. 2011, 120, 205–214. [Google Scholar] [CrossRef]
- Kameoka, E.; Suralta, R.R.; Mitsuya, S.; Yamauchi, A. Developmental Plasticity of Rice Root System Grown under Mild Drought Stress Condition with Shallow Soil Depth; Comparison between Nodal and Lateral roots. Plant Prod. Sci. 2016, 19, 411–419. [Google Scholar] [CrossRef] [Green Version]
- Kano-Nakata, M.; Inukai, Y.; Wade, L.J.; Siopongco, J.D.; Yamauchi, A. Root Development, Water Uptake, and Shoot Dry Matter Production under Water Deficit Conditions in Two CSSLs of Rice: Functional Roles of Root Plasticity. Plant Prod. Sci. 2011, 14, 307–317. [Google Scholar] [CrossRef]
- Akram, W.; Anjum, T.; Ali, B.; Ahmad, A. Screening of native bacillus strains to induce systemic resistance in tomato plants against fusarium wilt in split root system and its field applications. Int. J. Agric. Biol. 2013, 15, 1289–1294. [Google Scholar]
- Oukarroum, A.; El Madidi, S.; Schansker, G.; Strasser, R.J. Probing the responses of barley cultivars (Hordeum vulgare L.) by chlorophyll a fluorescence OLKJIP under drought stress and re-watering. Environ. Exp. Bot. 2007, 60, 438–446. [Google Scholar] [CrossRef]
- Rolando, J.L.; Ramírez, D.A.; Yactayo, W.; Monneveux, P.; Quiroz, R. Leaf greenness as a drought tolerance related trait in potato (Solanum tuberosum L.). Environ. Exp. Bot. 2015, 110, 27–35. [Google Scholar] [CrossRef]
- Smit, N.E. The effect of the indigenous cultural practices of in-ground storage and piecemeal harvesting of sweetpotato on yield and quality losses caused by sweetpotato weevil in Uganda. Agric. Ecosyst. Environ. 1997, 64, 191–200. [Google Scholar] [CrossRef]
- Bararyenya, A.; Olukolu, B.A.; Tukamuhabwa, P.; Grüneberg, W.J.; Ekaya, W.; Low, J.; Ochwo-Ssemakula, M.; Odong, T.L.; Talwana, H.; Badji, A.; et al. Genome-wide association study identified candidate genes controlling continuous storage root formation and bulking in hexaploid sweetpotato. BMC Plant Biol. 2020, 20, 1–16. [Google Scholar] [CrossRef] [Green Version]
- Thomas, H.; Howarth, C.J. Five ways to stay green. J. Exp. Bot. 2000, 51 (Suppl. 1), 329–337. [Google Scholar] [CrossRef] [Green Version]
- Abdelrahman, M.; El-Sayed, M.; Jogaiah, S.; Burritt, D.J.; Tran, L.-S.P. The “STAY-GREEN” trait and phytohormone signaling networks in plants under heat stress. Plant Cell Rep. 2017, 36, 1009–1025. [Google Scholar] [CrossRef]
- Rivero, R.M.; Kojima, M.; Gepstein, A.; Sakakibara, H.; Mittler, R.; Gepstein, S.; Blumwald, E. Delayed leaf senescence induces extreme drought tolerance in a flowering plant. Proc. Natl. Acad. Sci. USA 2007, 104, 19631–19636. [Google Scholar] [CrossRef] [Green Version]
- Tyree, M.T.; Davis, S.D.; Cochard, H. Biophysical perspectives of xylem evolution: Is there a tradeoff of hydraulic efficiency for vulnerability to dysfunction? IAWA J. 1994, 15, 335–360. [Google Scholar] [CrossRef] [Green Version]
- Sandhu, N.; Raman, K.A.; Torres, R.O.; Audebert, A.; Dardou, A.; Kumar, A.; Henry, A. Rice Root Architectural Plasticity Traits and Genetic Regions for Adaptability to Variable Cultivation and Stress Conditions. Plant Physiol. 2016, 171, 2562–2576. [Google Scholar] [CrossRef] [PubMed] [Green Version]
- De Bauw, P.; Vandamme, E.; Lupembe, A.; Mwakasege, L.; Senthilkumar, K.; Drame, K.N.; Merckx, R. Anatomical root responses of rice to combined phosphorus and water stress—Relations to tolerance and breeding opportunities. Funct. Plant Biol. 2019, 46, 1009. [Google Scholar] [CrossRef] [PubMed]
- Hasegawa, S.; Thangaraj, M.; O’Toole, J. Root behavior: Field and laboratory studies for rice and nonrice crops. In Soil Physics and Rice; International Rice Research Institute: Manila, PA, USA, 1985; pp. 383–395. [Google Scholar]
- Sharma, P.K.; De Datta, S.K.; Redulla, C.A. Root Growth and Yield Response of Rainfed Lowland Rice to Planting Method. Exp. Agric. 1987, 23, 305–313. [Google Scholar] [CrossRef]
- Mambani, B.; De Datta, S.; Redulla, C. Land preparation requirements for rainfed rice as affected by climatic water balance and tillage properties of lowland soils. Soil Tillage Res. 1989, 14, 219–230. [Google Scholar] [CrossRef]
- Nabheerong, N. Root growth and nutrient uptake of rice as affected by planting methods and green manures. Agric. Nat. Resour. 1993, 27, 358–368. [Google Scholar]
- Pantuwan, G.; Ingram, K.; Sharma, P. Rice root systems development under rainfed conditions, Physiology of Stress Tolerance in Rice. In Proceedings of the International Conference on Stress Physiology in Rice, International Rice Research Centre, Manila, PA, USA, 28 February–5 March 1994; pp. 198–206. [Google Scholar]
- Samson, B. Examining genotypic variation in root traits for drought resistance, Fragile Lives in Fragile Ecosystems. In Proceedings of the International Rice Research Conference, Manila, PA, USA, 13–17 February 1995; pp. 521–534. [Google Scholar]


| Traits | Condition | Mean ± SD | LSD | Min | Max | % Change | G Effect | T Effect | GxT Effect | ||
|---|---|---|---|---|---|---|---|---|---|---|---|
| FD | WW | 105 | ± | 12.8 | 3.7 | 85 | 129 | −17.1 | ** | * | ** |
| DS | 87 | ± | 4.3 | 3.9 | 82 | 96 | ** | ||||
| PH | WW | 78.5 | ± | 13.0 | 3.9 | 42.3 | 105.3 | −22.5 | ** | * | ** |
| DS | 60.8 | ± | 10.2 | 6.5 | 47.7 | 84.3 | ** | ||||
| TN | WW | 24 | ± | 7.6 | 8.5 | 15 | 44 | −41.7 | ** | ** | ns |
| DS | 14 | ± | 3.9 | 4.2 | 8 | 22 | ** | ||||
| FG | WW | 90 | ± | 5.2 | 4.9 | 77.2 | 94.4 | −3.3 | ** | * | ns |
| DS | 87 | ± | 5.5 | 9.2 | 78.6 | 90.6 | ns | ||||
| 1000GW | WW | 23.6 | ± | 2.6 | 1.6 | 18.9 | 26.8 | −13.8 | ** | ** | ns |
| DS | 20.3 | ± | 11.4 | 2.8 | 16.5 | 22.8 | * | ||||
| BIO | WW | 30.4 | ± | 3.6 | 5.4 | 24.4 | 38.1 | −26.3 | * | * | * |
| DS | 22.4 | ± | 3.9 | 3.1 | 16.8 | 31.5 | ** | ||||
| NPT | WW | 17.8 | ± | 4.9 | 3.7 | 11.8 | 29.9 | −49.4 | ** | * | ns |
| DS | 9.0 | ± | 2.8 | 4.3 | 6.7 | 12.5 | ns | ||||
| NR | WW | 386 | ± | 92.9 | 63 | 227 | 530.3 | −71.5 | ** | ** | ns |
| DS | 110 | ± | 45.5 | 39.3 | 60.6 | 200.5 | ** | ||||
| LR | WW | 89.1 | ± | 20.3 | 40.5 | 45.5 | 122.5 | −63.9 | ns | * | ns |
| DS | 32.2 | ± | 8.2 | 18.6 | 16.8 | 46.9 | ns | ||||
| RT | WW | 1.35 | ± | 0.14 | 0.48 | 1.05 | 1.56 | −11.9 | ns | * | ns |
| DS | 1.19 | ± | 0.25 | 0.51 | 0.81 | 1.6 | ns | ||||
| CA | WW | 1.1 | ± | 0.12 | 0.49 | 0.83 | 1.29 | −18.2 | ns | * | ns |
| DS | 0.9 | ± | 0.21 | 0.47 | 0.63 | 1.3 | ns | ||||
| SA | WW | 0.04 | ± | 0.01 | 0.02 | 0.03 | 0.05 | 25.0 | ns | * | ns |
| DS | 0.05 | ± | 0.01 | 0.01 | 0.03 | 0.07 | ** | ||||
| XN | WW | 5.0 | ± | 0.6 | 1.05 | 4 | 5 | −8.0 | ns | * | ns |
| DS | 4.6 | ± | 0.9 | 1.28 | 3 | 5 | ns | ||||
| XA | WW | 0.005 | ± | 0.001 | 0.002 | 0.003 | 0.007 | 40.0 | * | * | ** |
| DS | 0.007 | ± | 0.003 | 0.003 | 0.002 | 0.011 | ** | ||||
| PA | WW | 32.1 | ± | 8.5 | 26.7 | 19.4 | 45.12 | −2.8 | ns | ns | ns |
| DS | 31.2 | ± | 11.7 | 13.1 | 11.9 | 49.64 | ** | ||||
| LRS | DS | 5.6 | ± | 0.6 | 1.5 | 1.56 | 4.92 | ns | |||
| LDS | DS | 3.0 | ± | 1.2 | 0.7 | 2.67 | 4.75 | * | |||
| Traits | Condition | Mean ± SD | LSD | Min | Max | % Change | G Effect | T Effect | GxT Effect | ||
|---|---|---|---|---|---|---|---|---|---|---|---|
| FD | WW | 104 | ± | 11.3 | 1.61 | 87 | 119 | −10.6 | ** | * | ns |
| DS | 93 | ± | 0.70 | 2.87 | 92 | 93 | ns | ||||
| PH | WW | 82.7 | ± | 13.3 | 6.75 | 69.3 | 102.5 | −29.0 | ** | ** | ** |
| DS | 58.7 | ± | 6.74 | 8.96 | 51.0 | 67.4 | ** | ||||
| TN | WW | 22 | ± | 10.4 | 7.00 | 15 | 46 | −40.9 | ** | * | ** |
| DS | 13 | ± | 4.23 | 4.65 | 9 | 20 | ** | ||||
| FG | WW | 91.8 | ± | 1.37 | 1.75 | 89.3 | 93.7 | −11.3 | ** | ns | ns |
| DS | 81.4 | ± | 5.37 | 56.6 | 77.6 | 85.2 | ns | ||||
| 1000GW | WW | 23.8 | ± | 1.27 | 1.90 | 22.5 | 25.8 | −24.8 | ns | * | ns |
| DS | 17.9 | ± | 0.42 | 7.86 | 17.6 | 18.2 | ns | ||||
| BIO | WW | 30.9 | ± | 5.00 | 9.91 | 25.0 | 37.3 | −30.7 | ns | ** | ns |
| DS | 21.4 | ± | 1.52 | 4.07 | 19.5 | 23.4 | ns | ||||
| NPT | WW | 16.7 | ± | 6.23 | 5.30 | 11.2 | 29.4 | −53.9 | ** | ** | ** |
| DS | 7.7 | ± | 1.77 | 5.87 | 5.1 | 9.6 | ns | ||||
| NR | WW | 360 | ± | 100 | 104 | 190 | 505 | −74.2 | ** | ** | * |
| DS | 93 | ± | 8.68 | 47.4 | 80.3 | 104.7 | ns | ||||
| LR | WW | 94.2 | ± | 30.5 | 62.0 | 53.3 | 140.4 | −56.2 | ns | * | ** |
| DS | 41.3 | ± | 17.96 | 33.3 | 27.4 | 79.5 | ** | ||||
| RT | WW | 1.32 | ± | 0.19 | 0.68 | 1.09 | 1.63 | −23.5 | ns | * | ns |
| DS | 1.01 | ± | 0.29 | 1.31 | 0.68 | 1.44 | ns | ||||
| CA | WW | 1.05 | ± | 0.16 | 0.57 | 0.86 | 1.34 | −30.5 | ns | ** | ns |
| DS | 0.73 | ± | 0.22 | 0.91 | 0.47 | 1.06 | ns | ||||
| SA | WW | 0.043 | ± | 0.008 | 0.03 | 0.030 | 0.050 | −11.6 | ns | ** | ns |
| DS | 0.038 | ± | 0.007 | 0.05 | 0.031 | 0.052 | ns | ||||
| XN | WW | 5 | ± | 0.18 | 1.50 | 5 | 5 | 0.00 | ns | ns | ns |
| DS | 5 | ± | 0.64 | 1.55 | 4 | 5 | ** | ||||
| XA | WW | 0.005 | ± | 0.0003 | 0.003 | 0.004 | 0.005 | 0.00 | ns | ns | ns |
| DS | 0.005 | ± | 0.001 | 0.01 | 0.004 | 0.007 | ns | ||||
| PA | WW | 37.1 | ± | 6.51 | 36.8 | 29.6 | 47.5 | −23.7 | ns | * | ns |
| DS | 28.3 | ± | 8.24 | 45.5 | 16.0 | 39.3 | ns | ||||
| LRS | DS | 2.2 | ± | 0.8 | 1.40 | 1.53 | 3.5 | ns | |||
| LDS | DS | 3.1 | ± | 0.4 | 0.80 | 2.25 | 3.6 | ns | |||
| Traits | Condition | Mean ± SD | LSD | Min | Max | % Change | G Effect | T Effect | GxT Effect | ||
|---|---|---|---|---|---|---|---|---|---|---|---|
| PH | WW | 84.7 | ± | 6.48 | 11.6 | 72.5 | 94.4 | −2.6 | ** | ns | ns |
| DS | 82.5 | ± | 10.7 | 21.0 | 54.9 | 97.1 | ** | ||||
| TN | WW | 15 | ± | 4.86 | 10.5 | 9 | 24 | −33.3 | ** | ** | ns |
| DS | 10 | ± | 3.17 | 5.02 | 6 | 15 | ns | ||||
| BIO | WW | 21.5 | ± | 2.56 | 7.14 | 16.5 | 25.5 | −20.0 | ns | ** | ns |
| DS | 17.2 | ± | 1.80 | 3.66 | 14.8 | 20.2 | ns | ||||
| NPT | WW | 18.2 | ± | 2.65 | 5.58 | 13.9 | 23.0 | −28.6 | ** | ** | ns |
| DS | 13.0 | ± | 2.06 | 5.92 | 10.0 | 16.5 | ns | ||||
| NR | WW | 269 | ± | 65.0 | 152 | 160 | 359 | −52.4 | ** | ** | ns |
| DS | 128 | ± | 47.6 | 72.1 | 80.0 | 213 | * | ||||
| LR | WW | 153.0 | ± | 36.7 | 115 | 92.0 | 225 | 5.0 | ns | ns | ns |
| DS | 160.7 | ± | 48.6 | 25.0 | 72.7 | 230 | * | ||||
| %50–90 | WW | 33.3 | ± | 7.77 | 15.3 | 16.7 | 44.3 | −3.6 | ns | ns | ns |
| DS | 32.1 | ± | 6.72 | 5.93 | 11.1 | 43.3 | ** | ||||
| LRS | DS | 5.90 | ± | 2.32 | 5.90 | 3 | 9 | ns | |||
| LDS | DS | 3.40 | ± | 2.66 | 4.50 | 1 | 9 | * | |||
| Traits | Condition | Mean ± SD | LSD | Min | Max | % Change | G Effect | T Effect | GxT Effect | ||
|---|---|---|---|---|---|---|---|---|---|---|---|
| PH | WW | 88.3 | ± | 12.3 | 13.9 | 64.0 | 100.1 | −2.9 | ** | ns | ns |
| DS | 85.7 | ± | 13.3 | 14.6 | 64.2 | 107.6 | ** | ||||
| TN | WW | 15 | ± | 4.72 | 6.63 | 8 | 20 | −29.3 | ** | ** | ns |
| DS | 11 | ± | 2.29 | 7.05 | 7 | 14 | ns | ||||
| BM | WW | 24.7 | ± | 3.16 | 13.6 | 20.7 | 27.9 | −26.0 | ns | ** | ns |
| DS | 18.3 | ± | 1.97 | 5.35 | 15.5 | 20.6 | ns | ||||
| NPT | WW | 18.8 | ± | 4.63 | 3.93 | 12.6 | 24.3 | −25.3 | ** | ** | ns |
| DS | 14.0 | ± | 3.17 | 5.55 | 10.0 | 19.5 | * | ||||
| NR | WW | 283 | ± | 91.5 | 93.7 | 95 | 64 | −45.6 | ** | ** | ns |
| DS | 154 | ± | 59.1 | 109 | 380 | 218 | ns | ||||
| LR | WW | 148.0 | ± | 37.30 | 133.00 | 81.7 | 205 | 6.1 | ns | ns | ns |
| DS | 157.0 | ± | 46.00 | 25.00 | 113.0 | 251 | ** | ||||
| %50–90 | WW | 26.1 | ± | 5.44 | 11.70 | 20.3 | 37 | −4.6 | ns | ns | ns |
| DS | 24.9 | ± | 4.07 | 5.93 | 19.7 | 33 | * | ||||
| LRS | DS | 7.3 | ± | 1.30 | 5.10 | 4 | 9 | ns | |||
| LDS | DS | 5.4 | ± | 1.90 | 5.60 | 1.7 | 7 | * | |||
| Ecosystem | Varieties | Group | BIO (DS) | BIO (WW) | PH | TN | 1000GW | FG | NPT | NR | LR | CA | SA | XN | XA | PA | RT |
|---|---|---|---|---|---|---|---|---|---|---|---|---|---|---|---|---|---|
| Lowland | Y329-UBN | bottom | 21.6 | 38.1 | 67.8 | 9 | 20.9 | 9.4 | 8.9 | 76 | 22.3 | 1.07 | 0.060 | 5.3 | 0.011 | 50 | 1.37 |
| Yeanelo-5 | bottom | 23.9 | 36.0 | 70.3 | 12 | 22.7 | 12.8 | 7.0 | 101 | 26.4 | 0.64 | 0.037 | 3.7 | 0.007 | 32 | 0.83 | |
| Yeanelo-1 | top | 31.5 | 33.2 | 84.3 | 12 | 19.6 | 16.9 | 16.8 | 201 | 16.8 | 1.17 | 0.053 | 5.3 | 0.009 | 40 | 1.53 | |
| Pyi Myanmar Sein | top | 25.0 | 30.0 | 60.0 | 14 | 16.5 | 16.1 | 8.8 | 122 | 31.8 | 0.79 | 0.040 | 5.3 | 0.006 | 39 | 1.03 | |
| p-value (bottom vs. top) | ns | ns | ns | ns | ns | ns | ns | ns | ns | ns | ns | ns | ns | ns | ns | ||
| Upland | Yar-8 | bottom | 19.5 | 29.1 | 55.7 | 13 | 0.0 | 0 | 7.9 | 111.8 | 42.8 | 0.59 | 0.037 | 4.7 | 0.004 | 26 | 1.00 |
| Kauk Yin | bottom | 19.9 | 28.9 | 63.5 | 10 | 0.0 | 0 | 8.5 | 80.3 | 40.3 | 1.06 | 0.083 | 5 | 0.004 | 14 | 1.43 | |
| Nga Ywan Nu | top | 23.4 | 35.4 | 66.5 | 11 | 17.6 | 5.1 | 8.8 | 107.5 | 27.4 | 0.86 | 0.060 | 4.7 | 0.004 | 17 | 1.07 | |
| Yar Kyaw | top | 23.1 | 37.3 | 51 | 20 | 0.0 | 0 | 5.4 | 104.7 | 29.3 | 0.66 | 0.04 | 4.3 | 0.006 | 22 | 0.87 | |
| p-value (bottom vs. top) | ** | * | ns | ns | ns | ns | ns | ns | * | ns | ns | ns | ns | ns | ns | ||
| Ecosystem | Varieties | Group | BIO (DS) | BIO (WW) | PH | TN | NPT | NR | LRD | %50–90 | CC | PR | SC | TR |
|---|---|---|---|---|---|---|---|---|---|---|---|---|---|---|
| Lowland | Yeanelo-2 | bottom | 15.0 | 22.6 | 84.7 | 7 | 14.5 | 87 | 116 | 29 | 40.6 | 9.7 | 0.09 | 0.0018 |
| Sin Thwe Lat | bottom | 15.5 | 24.6 | 79.5 | 9 | 10.0 | 91 | 138 | 39 | 40.8 | 13.6 | 0.16 | 0.0029 | |
| Yeanelo-3 | top | 20.3 | 23.2 | 88.7 | 15 | 14.1 | 206 | 204 | 21 | 41.8 | 1.5 | 0.04 | 0.0010 | |
| Pyi Myanmar Sein | top | 20.2 | 22.2 | 85.8 | 14 | 15.3 | 214 | 98 | 32 | 43.8 | 5.4 | 0.02 | 0.0005 | |
| p-value (bottom vs. top) | ** | ns | ns | * | ns | ** | ns | ns | ns | ns | ns | ns | ||
| Upland | Yar-4 | bottom | 15.5 | 27.6 | 80.2 | 7 | 10.0 | 64 | 113 | 33 | 39.4 | 8.2 | 0.11 | 0.0023 |
| Nga Ywan Nu | bottom | 16.7 | 22.9 | 88.7 | 9 | 11.3 | 111 | 148 | 24 | 36 | 1.2 | 0.07 | 0.0015 | |
| Yar-8 | top | 20.6 | 28.0 | 90.6 | 11 | 19.5 | 218 | 128 | 20 | 35.8 | 11.8 | 0.06 | 0.0012 | |
| Ba Ma Htar | top | 20.3 | 25.5 | 89.7 | 13 | 15.4 | 200 | 136 | 23 | 41.2 | 2.2 | 0.08 | 0.0017 | |
| p-value (bottom vs. top) | * | ns | ns | ns | ns | * | ns | ns | ns | ns | ns | ns | ||
Publisher’s Note: MDPI stays neutral with regard to jurisdictional claims in published maps and institutional affiliations. |
© 2022 by the authors. Licensee MDPI, Basel, Switzerland. This article is an open access article distributed under the terms and conditions of the Creative Commons Attribution (CC BY) license (https://creativecommons.org/licenses/by/4.0/).
Share and Cite
Sandar, M.M.; Ruangsiri, M.; Chutteang, C.; Arunyanark, A.; Toojinda, T.; Siangliw, J.L. Root Characterization of Myanmar Upland and Lowland Rice in Relation to Agronomic and Physiological Traits under Drought Stress Condition. Agronomy 2022, 12, 1230. https://0-doi-org.brum.beds.ac.uk/10.3390/agronomy12051230
Sandar MM, Ruangsiri M, Chutteang C, Arunyanark A, Toojinda T, Siangliw JL. Root Characterization of Myanmar Upland and Lowland Rice in Relation to Agronomic and Physiological Traits under Drought Stress Condition. Agronomy. 2022; 12(5):1230. https://0-doi-org.brum.beds.ac.uk/10.3390/agronomy12051230
Chicago/Turabian StyleSandar, Moe Myint, Mathurada Ruangsiri, Cattleya Chutteang, Anuruck Arunyanark, Theerayut Toojinda, and Jonaliza L. Siangliw. 2022. "Root Characterization of Myanmar Upland and Lowland Rice in Relation to Agronomic and Physiological Traits under Drought Stress Condition" Agronomy 12, no. 5: 1230. https://0-doi-org.brum.beds.ac.uk/10.3390/agronomy12051230