Article

Response of Phytic Acid to Nitrogen Application and Its Relation to Protein Content in Rice Grain

1
Key Laboratory of Ministry of Education for Genetics, Breeding and Multiple Utilization of Crops, College of Agriculture, Fujian Agriculture and Forestry University, Fuzhou 350002, China
2
International Magnesium Institute, Fujian Agriculture and Forestry University, Fuzhou 350002, China
3
Department of Plant and Environmental Sciences, University of Copenhagen, 1871 Copenhagen, Denmark
4
College of Plant Science, Jilin University, Changchun 130062, China
5
College of Agriculture and Biotechnology, Zhejiang University, Hangzhou 310058, China
*
Author to whom correspondence should be addressed.
Submission received: 25 April 2022 / Revised: 18 May 2022 / Accepted: 19 May 2022 / Published: 22 May 2022

Abstract

:
Nitrogen (N) fertilization has been recognized as improving the grain beneficial micronutrients, including Zn and Fe, in rice. However, only a few studies have explicitly focused on N-induced variation in anti-nutritional components such as phytic acid (PA), PA synthesis-related gene expression, and variation in grain protein fractions. Therefore, in this study, two culture systems (hydroponic and detached panicle culture systems) were used to elucidate the influence of N application on PA concentration and its relation to the grain protein fractions, such as albumin, globulin, prolamin, and glutelin, and total protein in rice. Results showed that N application generally decreased the grain PA concentration in brown rice and down-regulated the PA synthesis-related genes in the lipid-independent pathway. In contrast, total grain protein and its fractions concentrations increased significantly. For grain positional distribution, PA and protein concentration were generally higher in the aleurone fraction than in the milled rice, regardless of N application. However, higher N application decreased the PA in both aleurone fraction and milled rice, while increased the grain protein fractions mainly in milled rice. These findings imply that N application could substantially improve the rice nutrition by reducing the PA while increasing the protein concentration. Hence, these findings may provide critical bases for rice nutritional improvement through optimal N management.

Graphical Abstract

1. Introduction

Rice (Oryza sativa L.) is one of the largest-growing cereals globally and plays a crucial role in food security, particularly in South and East Asia [1]. Over the last few decades, spectacular progress has been made to maximize the grain yield and quality of rice for the growing populations worldwide by either conventional breeding methods such as cross-breeding or by molecular tools (gene knockout/CRISPR/Cas9) [2,3,4], but it remains a challenging task because of climate, limitation in water, and pathogens [5,6]. Nitrogen (N) is one of the significant elements for sustaining higher rice productivity. Various studies have been conducted to improve the N-use efficiency by genetic manipulation, such as overexpressed PERMEASE1, an amino acid transporter gene [7]. In addition, conventional N management practices (N application rate and time, field N fertilization/foliar spraying) also have a substantial impact on plant morphology, agronomic performance, stress defense, physiological traits, and yield potential [8,9,10]. For example, the heavy panicle fertilizer management characterized by decreasing basal N input but increasing topdressing level at the panicle initiation period may prolong the grain-filling period and yield increment [11]. Ning et al. (2009) further analyzed the yield components and concluded that N-induced high yield by the increment of panicle number and grain number per panicle was under genetic control and controlled by N level [12]. Nevertheless, the empirical knowledge based on rice nutritional improvement through optimal N management is limited. N is also essential for improving grain quality. It generally improves the milling and protein quality, but it may negatively affect the appearance, cooking, and eating quality of rice grain [13,14]. It has also been reported that N application has a significant positive impact on grain mineral concentration and proteins [15,16]. Based on solubility in water, salt, alcohol, and alkali, the rice grain protein can be classified into four fractions: albumin, globulin, prolamin, and glutelin. Glutelin has a better nutritional value than prolamin for the human diet due to its higher lysine concentration and easy digestibility in the gastrointestinal tract [12]. A knockdown line of rice 13-kD prolamin were observed with a 56% increase in lysine content [17]. Using an in vitro digestive system, Wang et al. (2016) found that glutelin also exerted a higher antioxidant capacity as compared with prolamin [18]. Thus, a high glutelin/prolamin ratio indicates a high protein nutritional quality. However, the response of those protein fractions to exogenous N regulation is still insufficient, especially with a wide range of N gradients. Furthermore, the real absorption of minerals in the human digestive tract, also known as their dietary bio-availabilities, depends not only on their quantity but also on anti-nutritional factors such as phytic acid (PA, IP6, myo-inositol-1,2,3,4,5,6-hexakis phosphoric acid, C6H18O24P6).
PA and the higher phosphorylated inositol phosphates derivative, including inositol pentaphosphate (IP5) are known as the most abundant storage form of phosphorus (P) in plant seeds [19]. Human and monogastric animals cannot hydrolyze these higher phosphorylated inositol phosphates, and these phosphate compounds easily bind with proteins and minerals and form insoluble and non-digestible complexes such as phytate (phytic acid salt) that cause a significant reduction in the bioavailability of minerals such as Fe and Zn [20]. Thereby, the higher grain PA, to some extent, is believed to exacerbate the occurrence of malnutrition for people who mainly live on plant-based food such as rice, which is characterized as inherently low in essential micronutrients, the poorest source of grain protein, and having abundant PA [21]. Zinc-regulated and iron-regulated transporter-like proteins (ZRT, IRT-like proteins) are closely linked with and involved in the transport of Zn and Fe. Optimized N application upregulates these transporter proteins involved in grain mineral allocation [22]. Many studies also explained the significant positive correlations between protein and mineral [23], suggesting the possibility of simultaneous enhancement for both minerals and proteins in grains.
So far, various studies have shown that P application promotes grain PA accumulation [24]. This is not surprising as PA is the principal storage form of grain P and accounts for 65–85% of grain total P [19]. However, the available information regarding the effect of N application on grain PA concentration is still insufficient and inconsistent. For instance, Simić et al. (2020) reported that N application changed grain Pi, but did not alter grain PA concentration in maize [25]. Kaplan et al. (2019) observed that N application increased maize grain PA when it was increased from 100 to 300 kg N ha−1 [26]. On the contrary, other research showed that N application decreased grain PA concentration in rice and wheat [12,27]. Meanwhile, energy-dispersive X-ray fluorescence and quantitative analysis have demonstrated that grain nutrients were unevenly distributed within an individual rice grain [28,29]. However, little attention has been given to understanding how the N application may influence grain’s positional PA concentration and its transcriptomic profiling. In the present study, two rice genotypes, XS110 and its low phytic acid (lpa) mutant HIPJ, were used to elucidate the effect of N application in two culture systems, namely, hydroponic and detached panicle culture systems. The hydroponic culture was selected to exclude the complexity of field conditions. The detached panicle culture with a wide range of N levels was used to exclude the possible translocation of N from leaf or other plant tissue to the developing rice grain. The key objectives of this study were: (i) to quantify the effect of N supply on grain PA and protein concentrations and their positional distribution; (ii) to clarify the transcript profiling of PA biosynthetic genes in response to N application. These findings could provide critical bases for rice nutritional improvement through optimal N management.

2. Materials and Methods

2.1. Plant Materials

The field experiments were conducted during rice growing seasons (April to October) at Zhejiang University, Hangzhou, China (30°18′ N, 120°04′ E) in 2015–2016. Two rice genotypes were used in the present study, XS110, and its corresponding lpa mutant HIPJ. XS110 was a japonica cultivar widely cultivated in south China, whereas the nonlethal lpa was originally isolated by gamma-irradiated XS110 mature grains, as reported previously by Liu et al. (2007) [30].

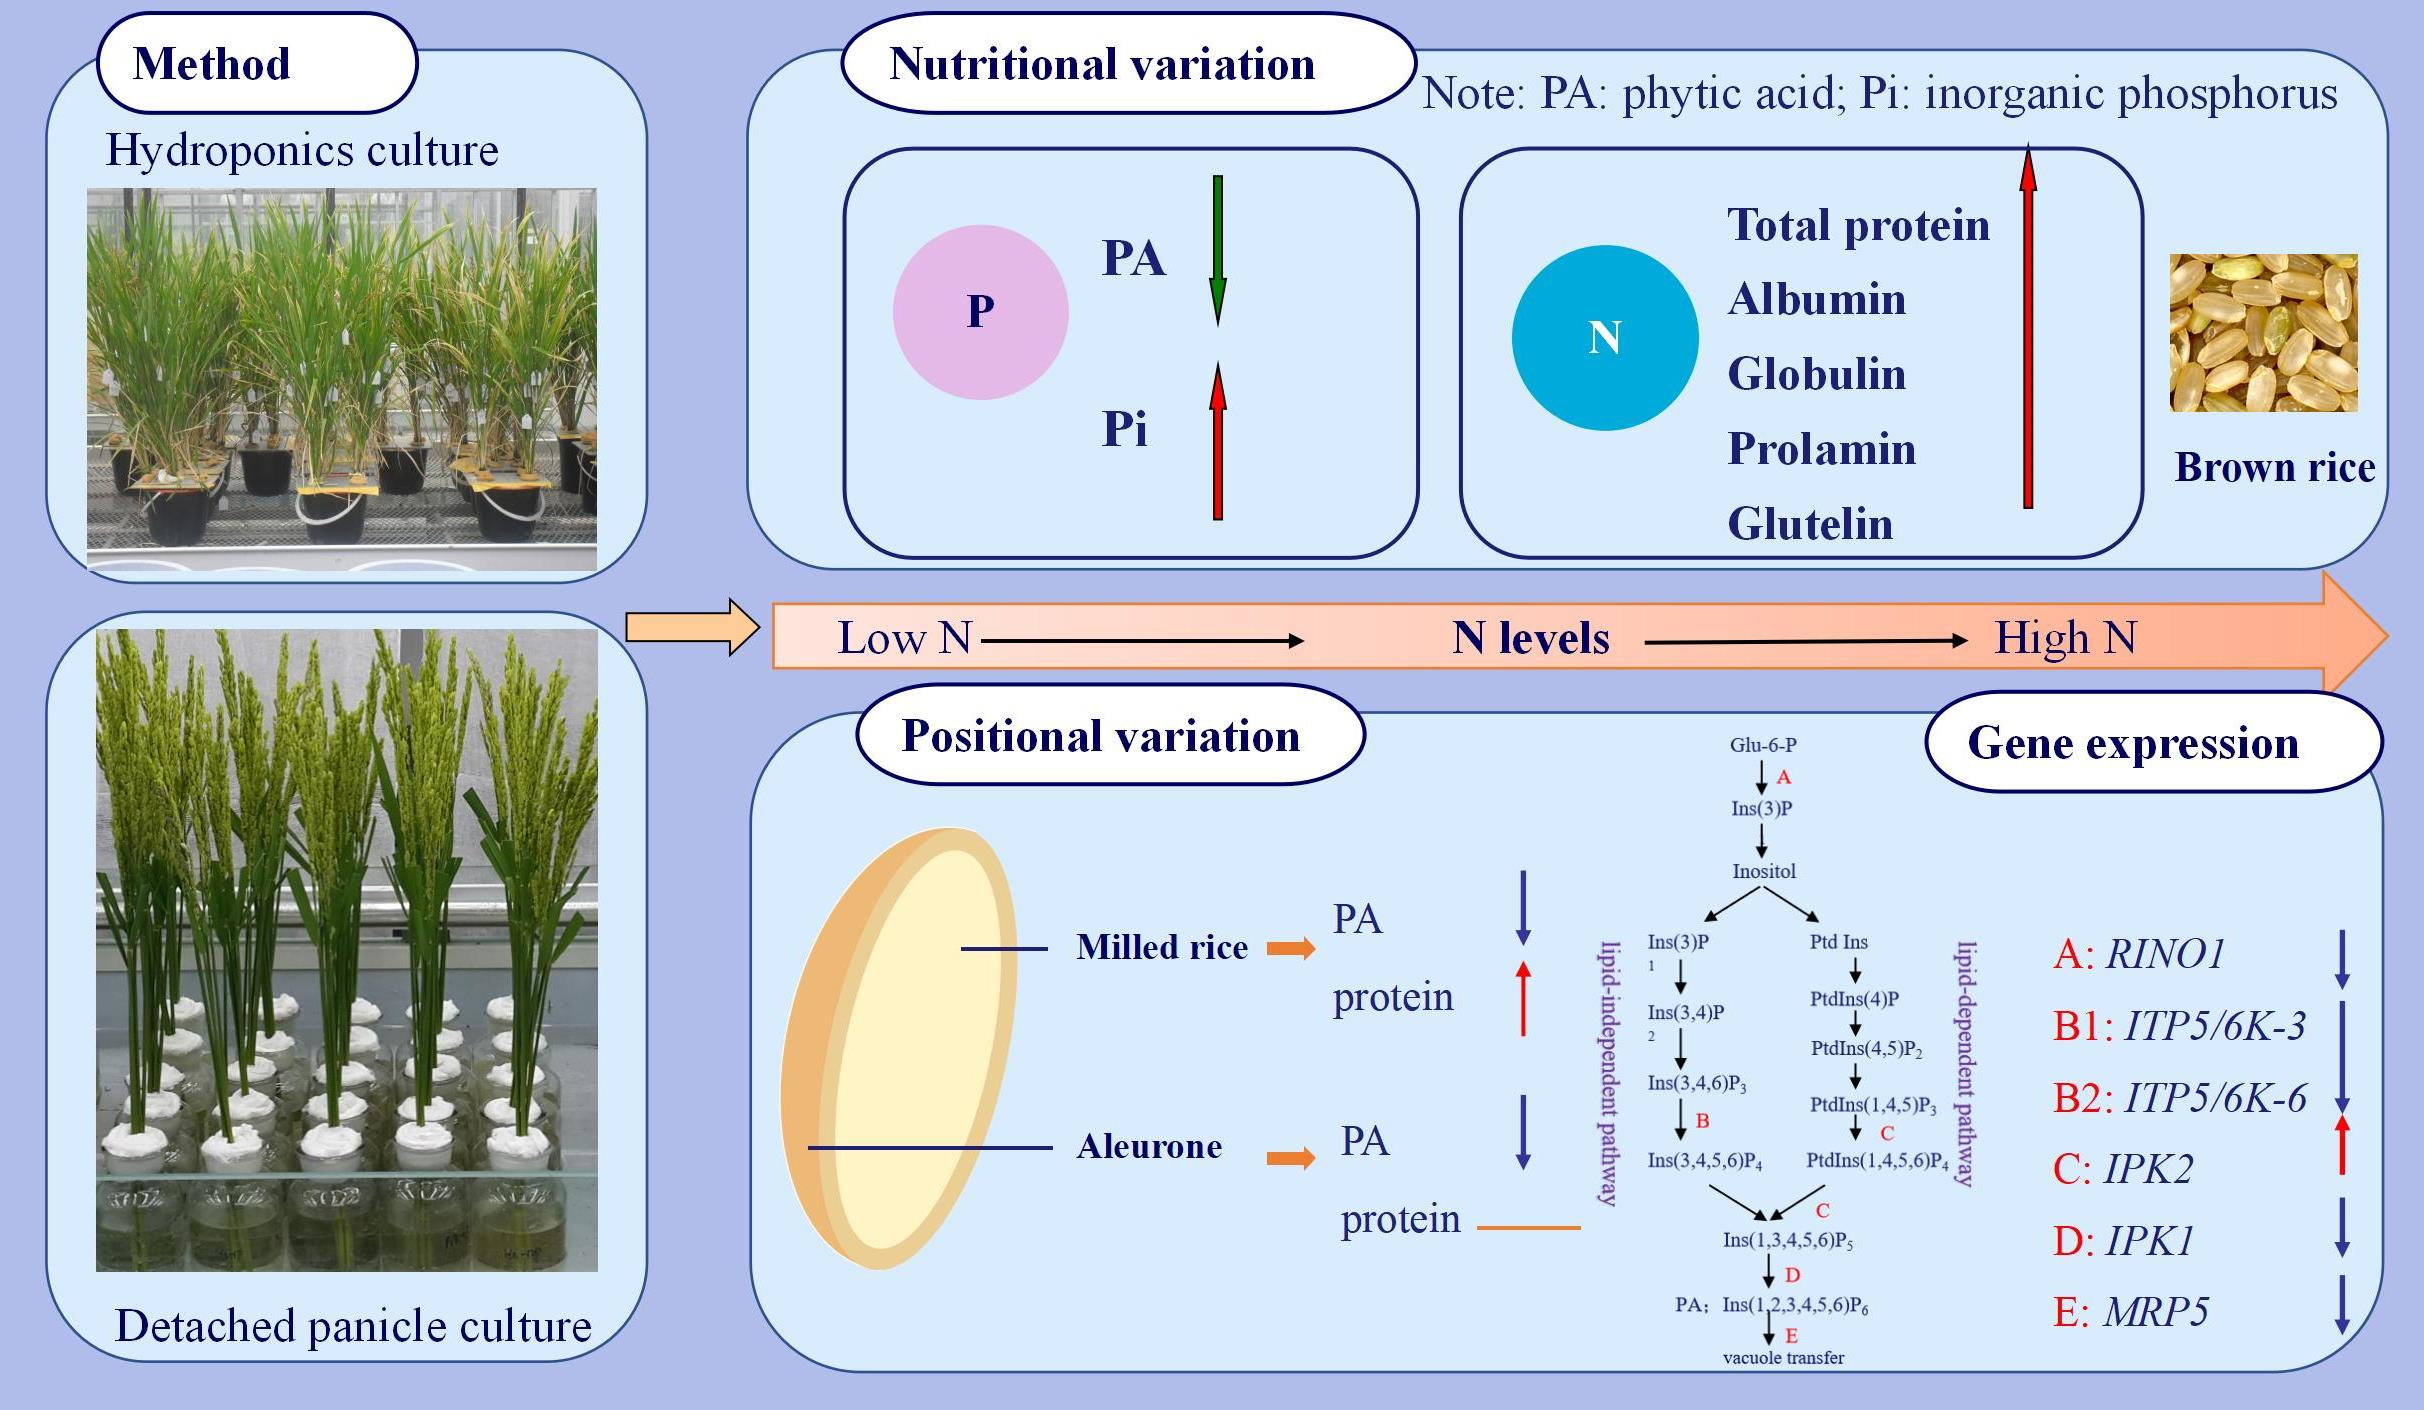
2.2. Hydroponic Culture

A hydroponic culture experiment was conducted in a greenhouse with natural light and temperature. The hydroponic culture experiment was laid in a randomized blocks design with two genotypes and three N levels, and five replications. Specifically, 1-month-old rice seedlings were transplanted to culture pots filled with 3.5 L ½ strength IRRI (International Rice Research Institute) nutrient solution. Each pot contained three uniform seedlings. After their initial adaptation to the solution medium, all rice plants were randomly divided into three groups for different N applications. The three N levels were as followed; 1.45 mM (low N, LN), 2.90 mM (medium N, MN), and 5.80 mM (high N, HN) and 4 replicates. MN was the standard N concentration according to the IRRI solution, with the 1/2 and 2 × of standard N concentration being set for LN and HN. The other essential elements, except for N, in the solution were kept constant for three N treatments. N was applied in the form of NH4NO3. The growth solution was changed once a week, and the pH was adjusted to 5.8. Pots were rotated periodically (2–3 times a week) to diminish the positional effect. At maturity (35 days after flowering), grains from each pot were harvested individually for subsequent 1000-grain weight (measured in paddy rice) and chemical analysis.

2.3. Detached Panicle Culture System

A detached panicle culture system was used with a wider range of N levels. It was also laid in a randomized blocks design with the two genotypes, five N levels, and five replicates. The detached panicle culture was performed at the full heading stage in a paddy field. The rice panicles in field with similar anthesis periods and uniform length were collected to impose different N treatments. NH4NO3 was used as N source, and five N levels were designed, 0 (N0), 0.1% (N1, M/V), 0.2% (N2, M/V), 0.3% (N3, M/V), and 0.6% (N4, M/V). All other basic nutrient concentrations were kept the same except for N, namely 1.50 mM CaCl2, 2.66 mM K2SO4, 0.75 mM MgSO4·7H2O, 0.75 mM MgSO4, 2.94 mM KH2PO4, 5.00 μM KI, 100.27 μM H3BO3, 100.00 μM MnSO4·4H2O, 29.91 μM ZnSO4·7H2O, 1.03 μM Na2MoO4·2H2O, 0.10 μM CuSO4·5H2O, 0.11 μM CoCl2·6H2O, 45.27 μM Na2EDTA, 45.99 μM FeSO4·7H2O, 4.06 μM nicotinic acid, 26.64 μM glycine, 1.48 mM pyridoxine hydrochloride, 0.59 μM thiamine hydrochloride, 0.075% filtered sulfurous acid and 131.47 mM sucrose. The solution was replaced every 5 days. A detailed procedure was followed as described by Su et al. (2018) [31].
Fresh grain samples of XS110 in 2016 were collected in the middle position of panicle from each N treatment at the 5th and 10th day after the initial culture. Their grains were frozen in liquid N and then stored at −80 °C for subsequent transcriptional expression analysis. The other panicles of the two genotypes were harvested individually after 20 days of different concentration N treatments in the solution, and 1000-grain weight (measured in paddy rice) and chemical analysis were performed.

2.4. Chemical Analyses

At maturity, harvested rice grains were firstly rinsed with ultrapure water (18.2Ω) to remove dust, and then air-dried. Grains used for determining grain protein, PA, and Pi analysis were dehusked by a laboratory de-husker (Model: JLGJ China) and ground using a portable grinder (Model JFSJ100, China) fitted with a 0.25 mm screen. For further investigating the influence of different N levels on PA and protein’s grain positional distribution, the aleurone fractions and milled rice of XS110 in 2016 were further separated using a milled rice polisher (Model JNMJ3, Taizhou Grain Industry Instrument Crop, Zhejiang, China) based on the degree of milling (DOM, defined as the weight percentage of grain fractions removed) [31,32]. In the current study, rice grain with DOM ≤ 6.5% and >12% is considered as aleurone fraction and milled rice. Brown rice is the unmilled rice with aleurone fraction. Triplicate measurements were performed for each treatment.
The four protein fractions were analyzed spectrophotometrically based on Liu et al. protocol (2005) [33]. Total protein concentration was calculated as the sum of four protein fractions (albumin, globulin, prolamin, glutelin). PA concentration was quantified spectrophotometrically as described by Su et al. (2018) [31]. Inorganic phosphorus (Pi) concentration was determined as described by Jiang et al. (2019) [34], and total grain P was estimated as the sum of phytic acid-phosphorus (PA-P) and Pi. All these tested parameters have three replicates.

2.5. Quantitative RT-PCR

Total RNA was extracted from the grains using Trizol reagent kit (Invitrogen) with its recommended protocol, then treated with DNasel and reverse transcribed using the ReverTra Acc qPCR Reverse Transcriptase Kit (Toyobo, Oscak, Japan). Gene expression was quantified by real-time PCR using the SYBR Real-time PCR Master Mix Reagent Kit (Toyobo, Oscak, Japan). The primer set OsAct for the actin gene was used as an internal control. All primers used in this study were synthesized in Sangon biological engineer technology Co., Ltd. (Shanghai, China). For primers sequences see Table 1.

2.6. Statistical Analysis

The results were presented as mean ± standard deviation (SD, n = 3). Data were subjected to analysis of variance (ANOVA) using IBM SPSS statistics 21, and the differences between means were compared by Tukey’s multiple comparison test at p < 0.05.

3. Results

3.1. Alterations in Grain Weight and Protein Concentration under Different N Levels

N application substantially increased the grain total protein and its four fractions (albumin, globulin, prolamin, glutelin) concentrations under hydroponic and detached panicle culture systems.
In hydroponic culture, N application increased the grain weight under MN and HN treatments compared to LN (Table 2). Rice grain protein was primarily constituted of glutelin, which accounted for 85.6% of grain total protein, prolamin with 7.2%, and least were globulin (5.4%) and albumin (5.2%). Similar to grain weight, grain total protein, including albumin, globulin, prolamin, and glutelin in MN and HN, were significantly higher as compared to LN (except for globulin of HIPJ, in 2015, and prolamin of HIPJ, in 2016). In terms of glutelin/total protein, no significant differences were observed across N levels for HIPJ in both years, whereas significant decrement were observed as the N level increased for XS110 in both years. Grain glutelin/prolamin generally decreased for both XS110 and HIPJ in 2015, whereas the difference was insignificant for HIPJ in 2016. Both the increment of grain weight and protein concentration resulted in significantly higher grain protein content (mg grain−1) in MN or/and HN as compared with LN. Whole rice grain (brown rice) was further separated into aleurone fraction and milled rice (inner endosperm fraction). Results showed that N application led to a significant rise in protein content in milled rice. In contrast, no significant variation was observed in aleurone fractions (except for glutelin in MN) (Figure 1).
In detached panicle culture, the effect of N application on grain protein concentration was more prominent, especially at high N levels (Table 3). With the increase in N levels, grain protein and their fractions showed a significant and progressive increment, but high N levels (N4) did not result in an additional contribution to the increase in grain weight; instead, it was decreased significantly. Take XS110 in 2015 as an example, from N0 to N4, the increased extent of albumin, prolamin, glutelin, and total protein concentration was 68.0%, 278.0%, 287.0%, and 380.9%, respectively. Between both genotypes in two years, the highest increased extent of total protein content (mg grain−1) was recorded for XS110 in 2016 (124.79%). Additionally, we observed that the ratio of glutelin/total protein increased along with N levels, which was different from the hydroponic culture. Grain glutelin/prolamin generally increased first then decreased under high N level, whereas XS110 in 2016 characterized as the progressively increasing trend with N application.
Under N application, the highest CV of four protein fractions was observed for prolamin in both culture systems (Table 2), but the lowest CV was culture system dependent (glutelin in hydroponic culture, albumin for detached panicle culture system). Additionally, we also observed a higher CV of glutelin/prolamin as compared with glutelin/total protein in both culture systems (Table 2, Table 3).

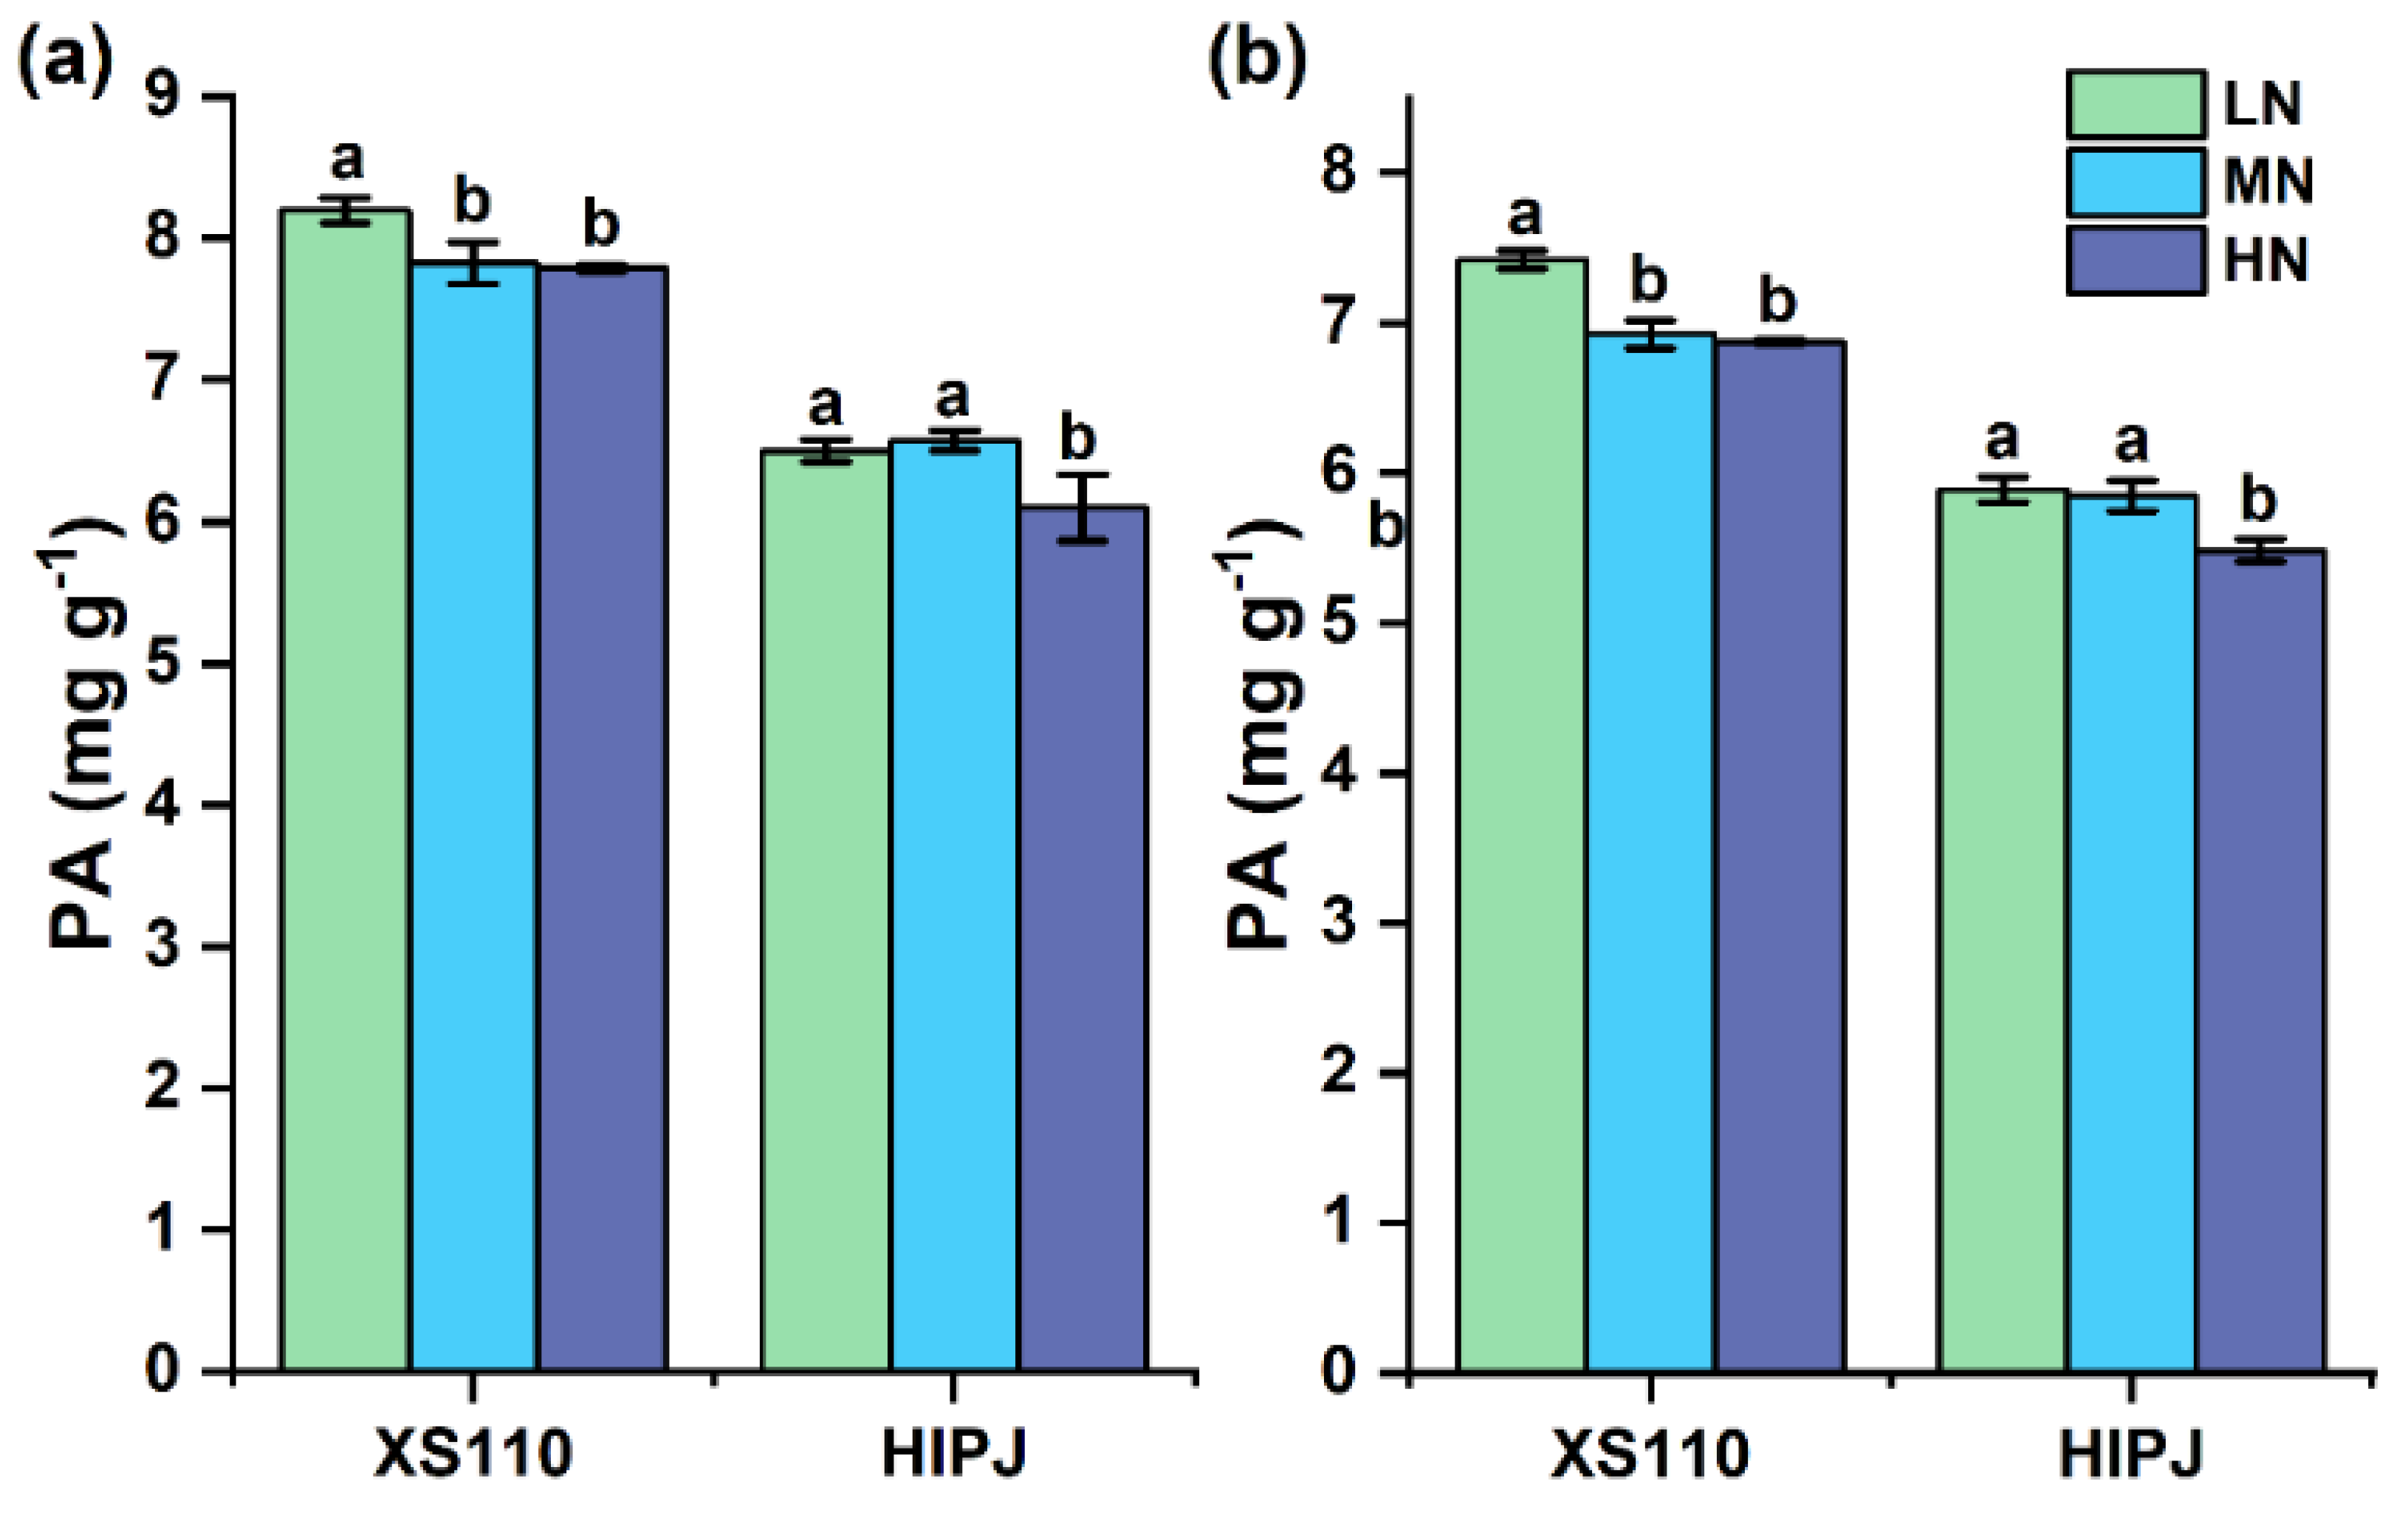
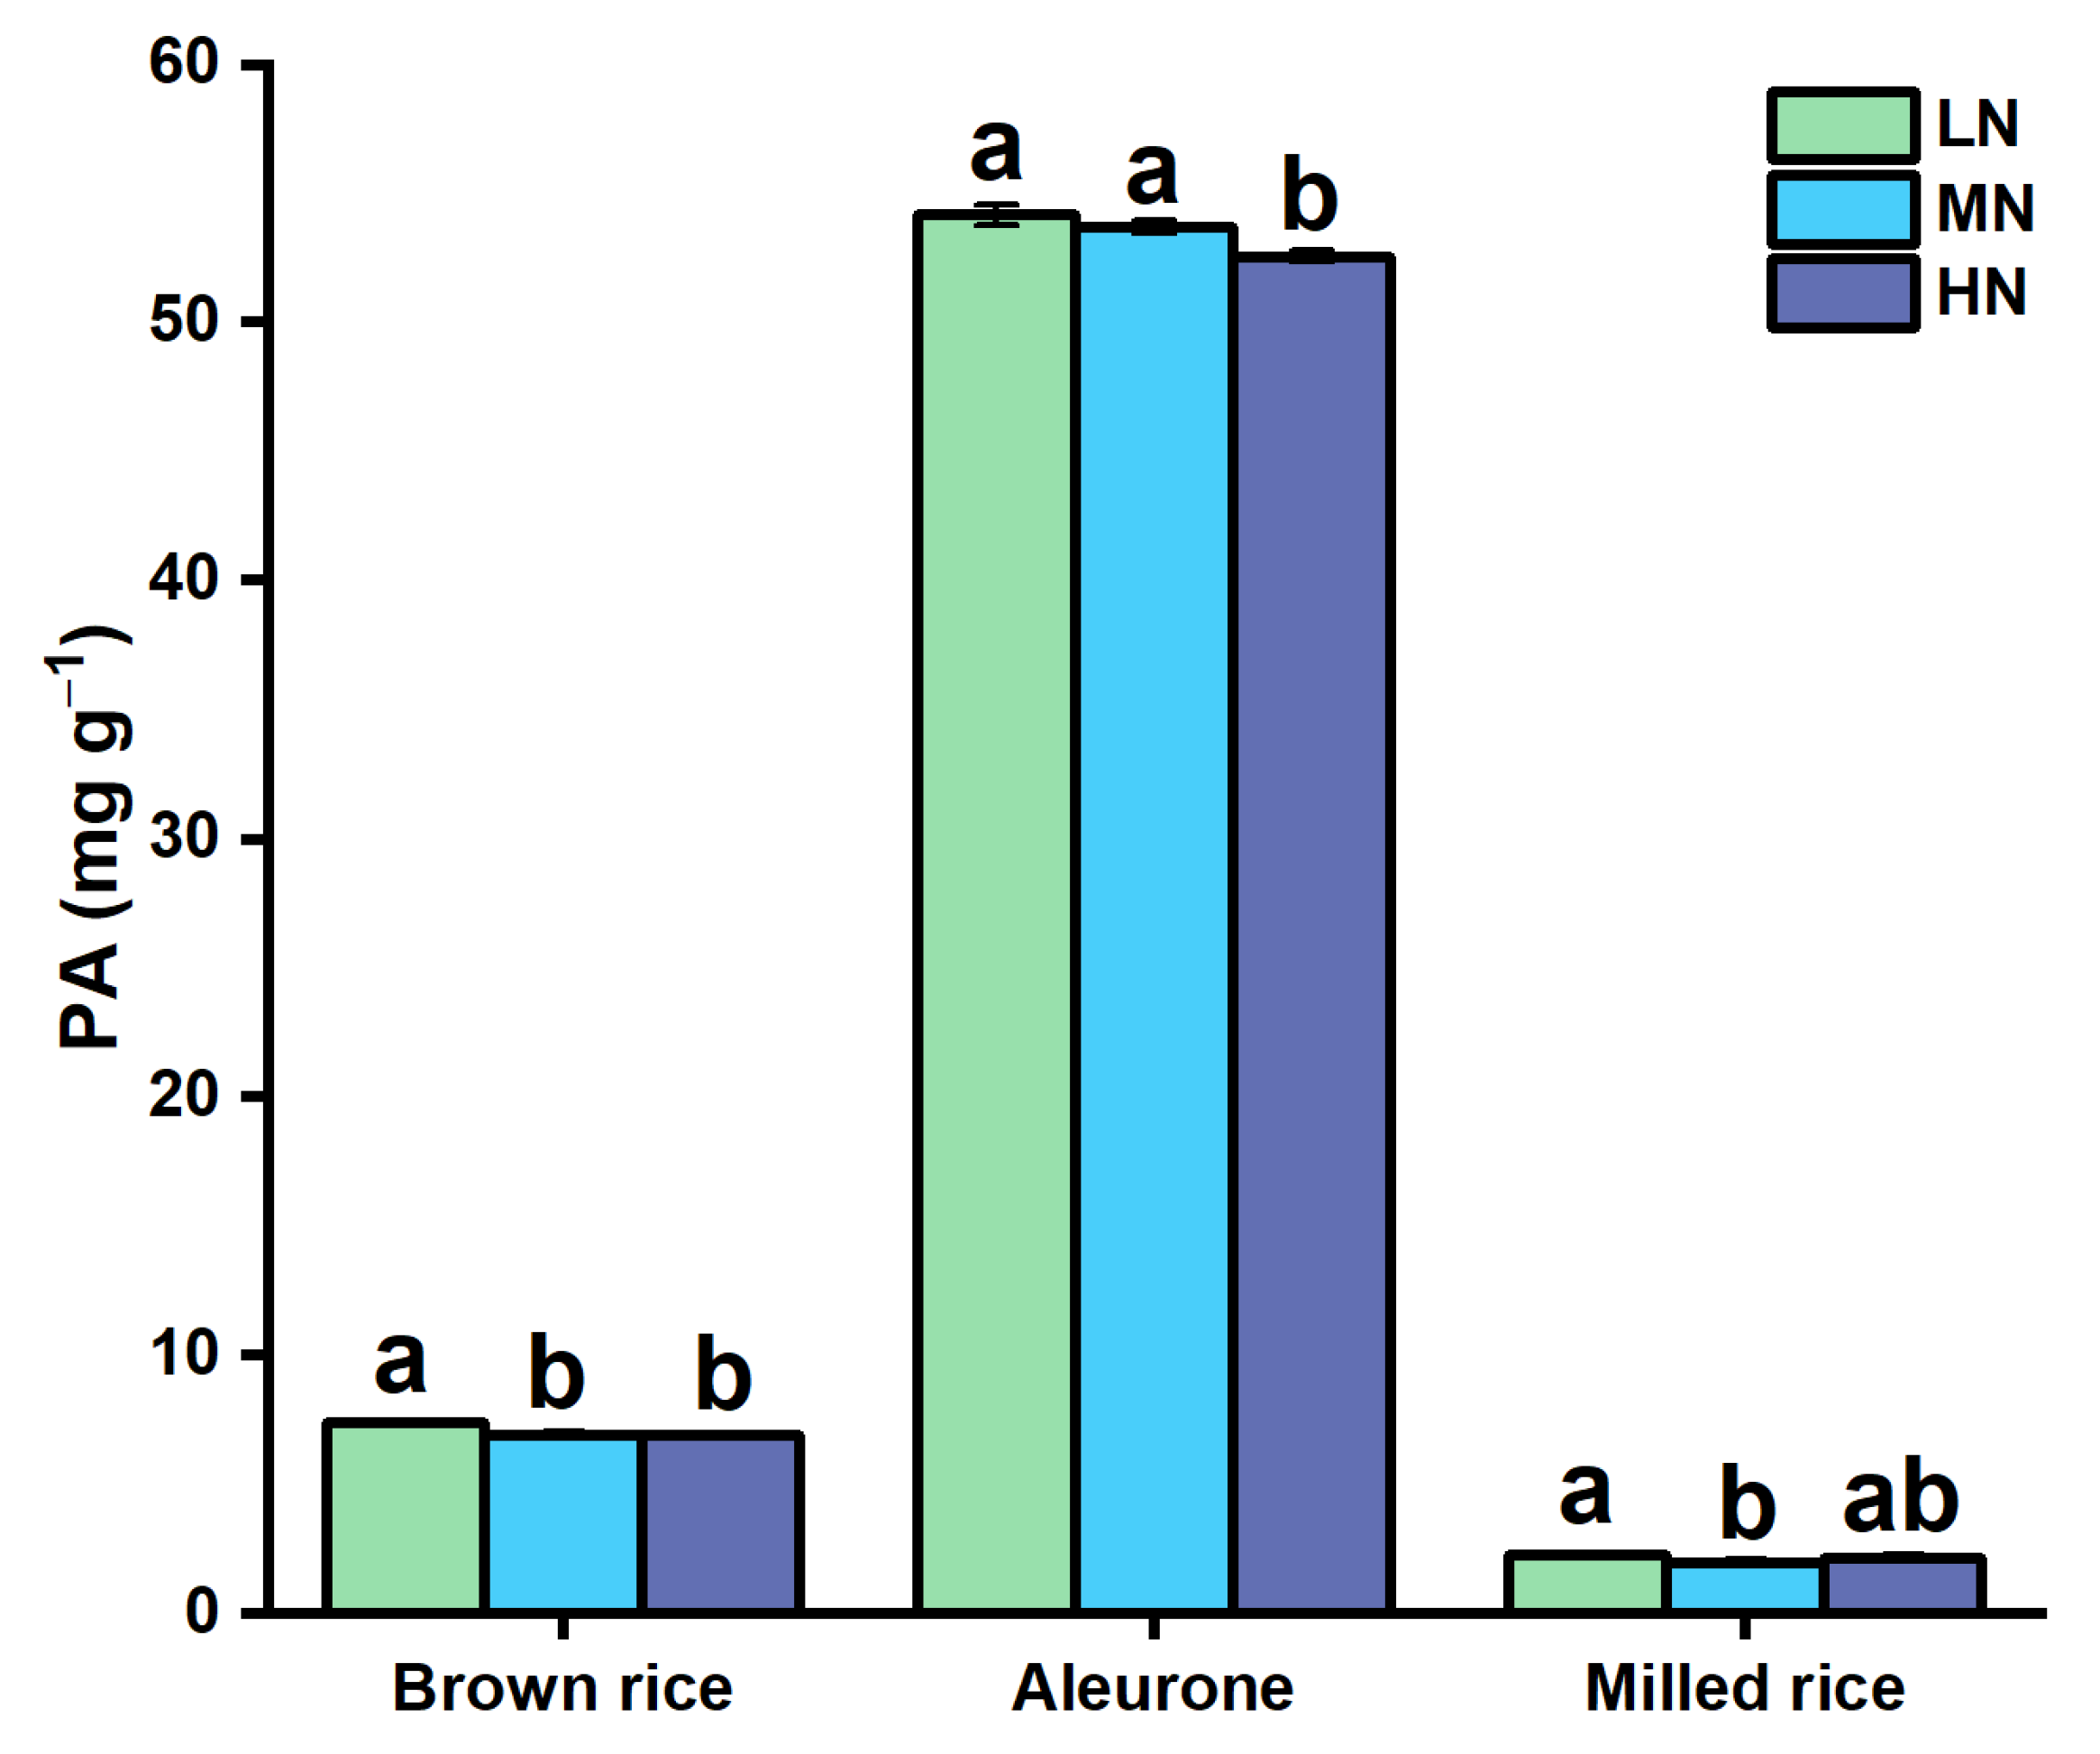
3.2. Alterations in Grain Phytic Acid with N Application

Both genotypes and nitrogen levels significantly influenced grain PA. Grain PA of HIPJ (lpa) was consistently lower than that of XS110 (wild type), irrespective of N levels (Figure 2, Table 4). N application generally decreased grain PA in both genotypes and both years.
In hydroponic culture (Figure 2), the genotypic difference in grain PA was firstly observed, and the average grain PA concentration of HIPJ (lpa) rice across three N levels was 18.9–19.5% lower than that of wild type (XS110) in two years. Because of N application, the grain PA concentration was lower with N application (MN and HN) compared with LN treatment, and the decreased extent was 4.95–6.15% in 2015 and 6.84–7.33% in 2016.
When we further separated the whole rice grain (brown rice) into aleurone fraction and milled rice, results showed that rice grain PA was observed with large positional variation, milled rice contained the lowest grain PA as expected, whereas most grain PA was found in the aleurone fraction. Relative to LN, HN treatment significantly decreased PA in aleurone fractions, whereas the lowest PA in milled rice was observed at the MN level (Figure 3).
In the detached panicle culture system, accompanied by the significant increment of grain weight (Table 3), grain PA and total P generally decreased from N0–N3 levels (Table 4), but their concentrations significantly increased in N4 as compared with the N3 level. On the contrary, grain Pi significantly increased as the N level increased. As the dominant grain P fraction, the average of PA-P/total P across the five N levels was 72.2%.

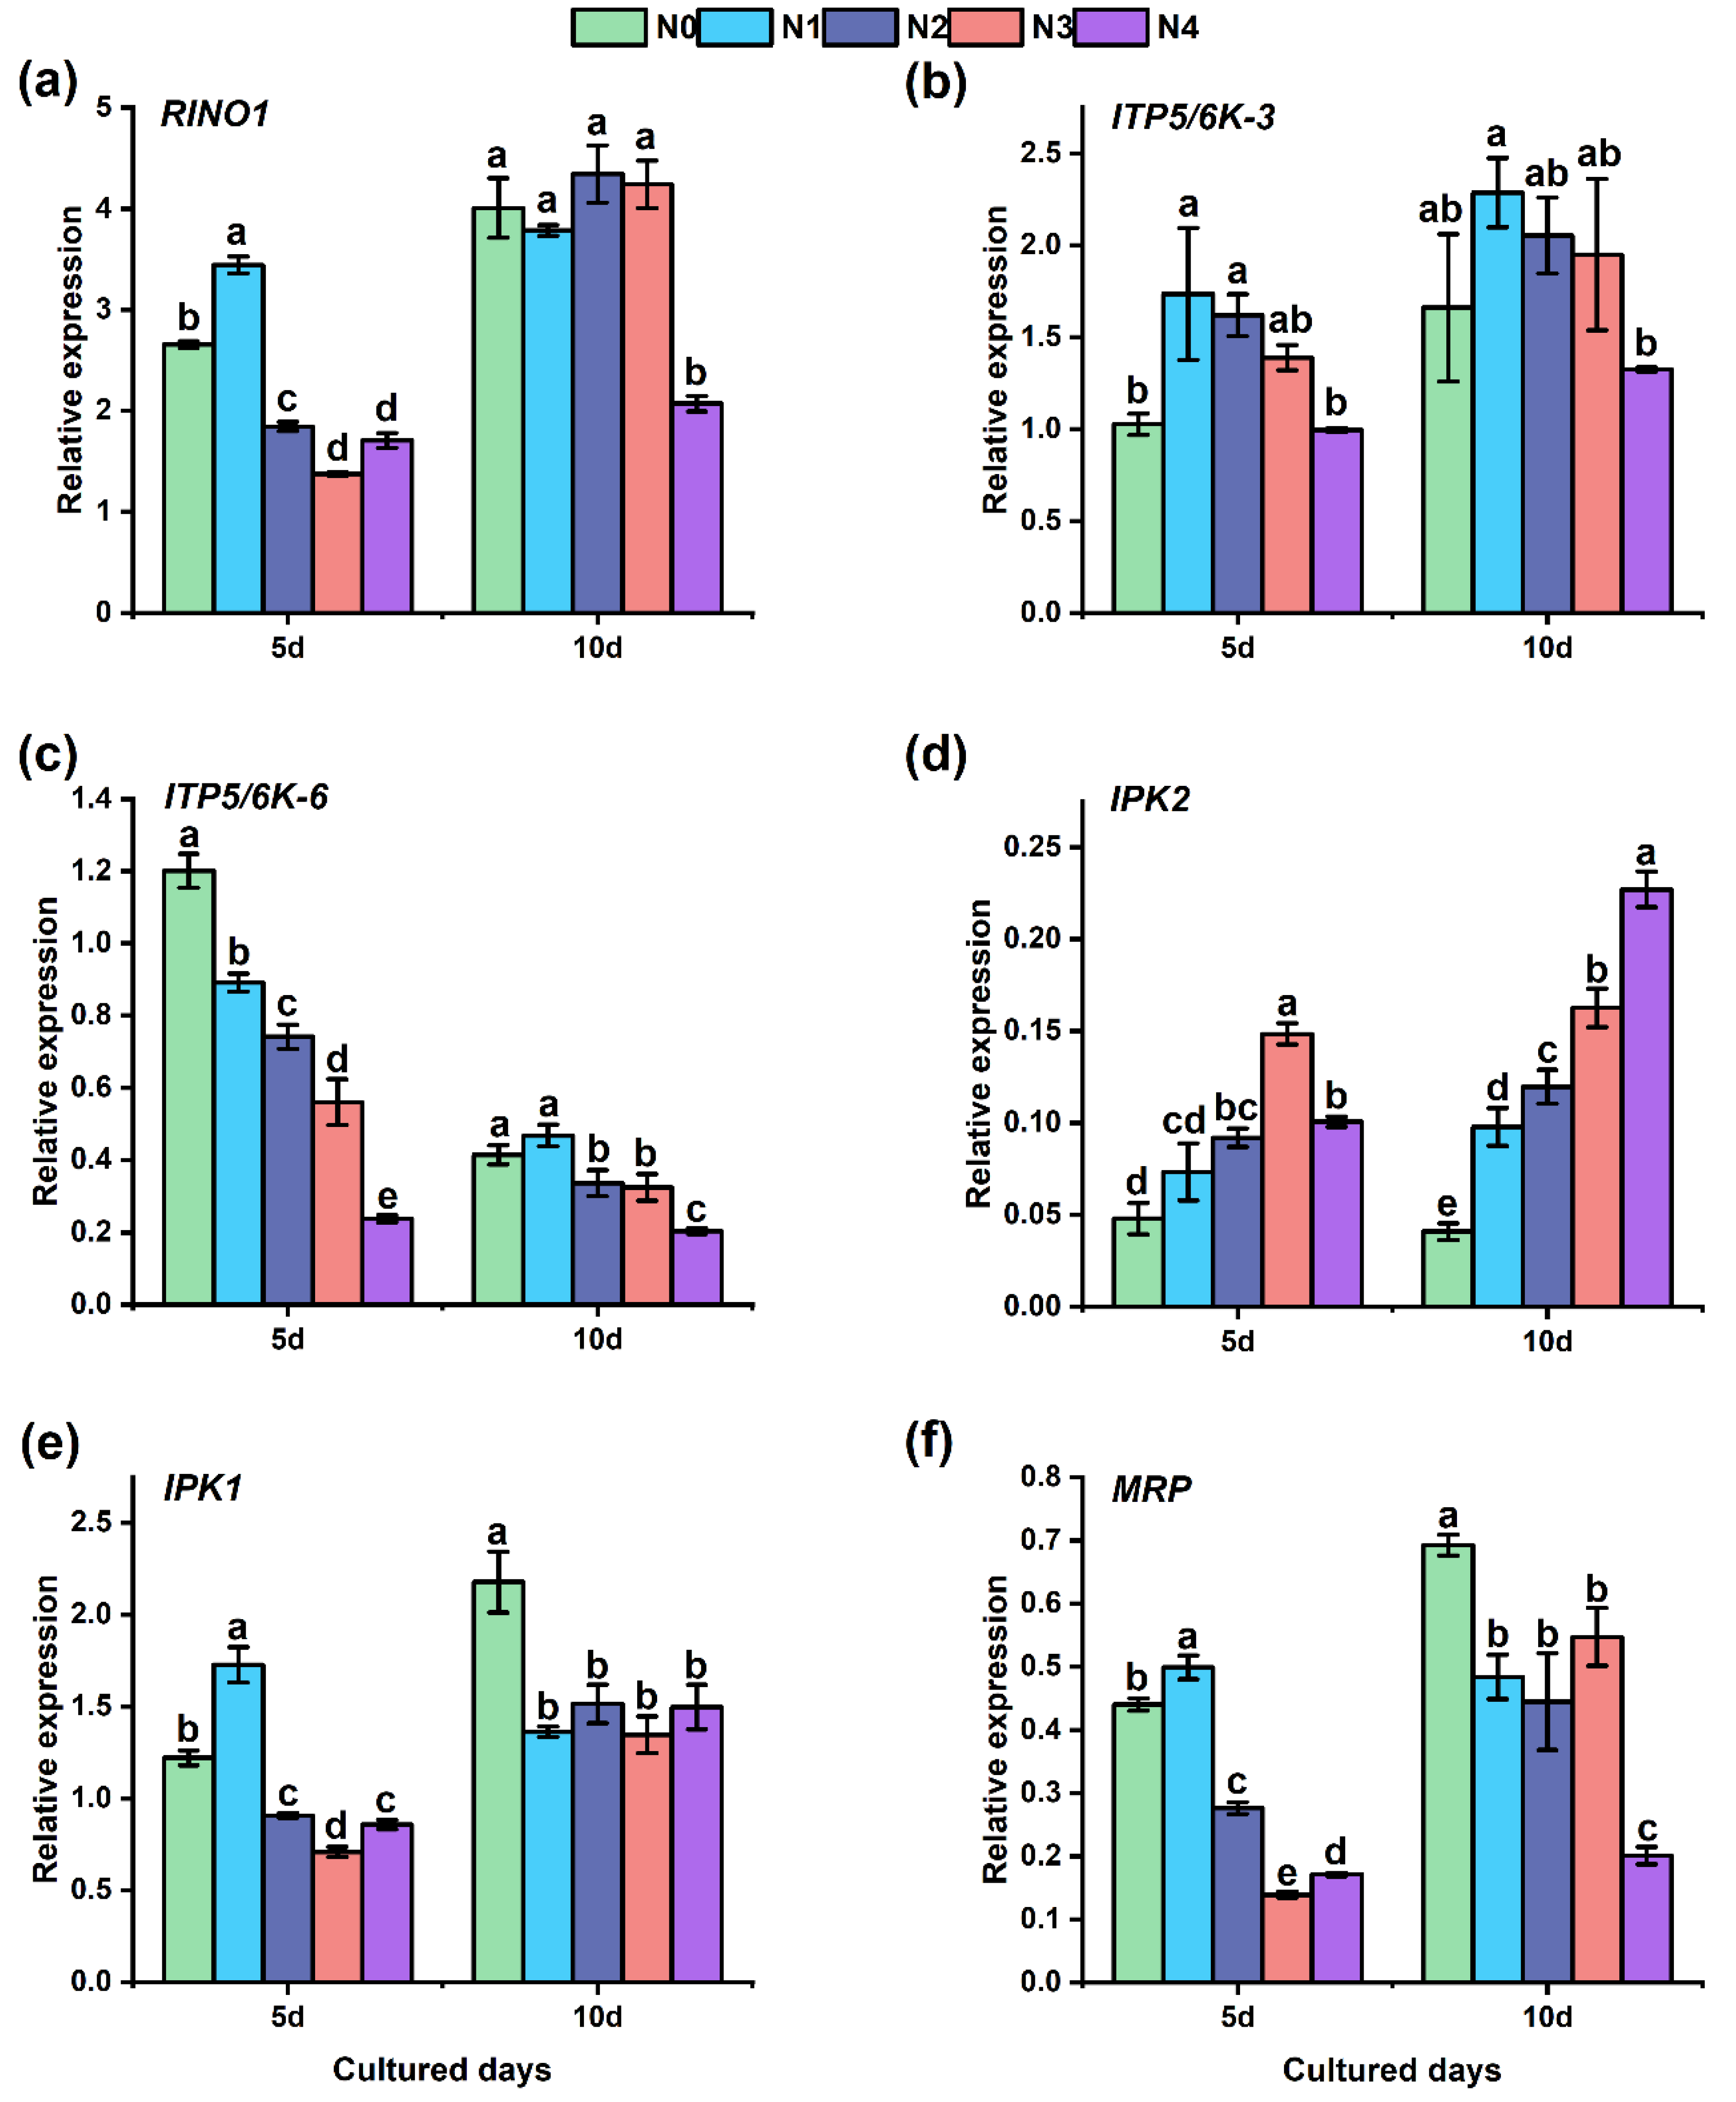
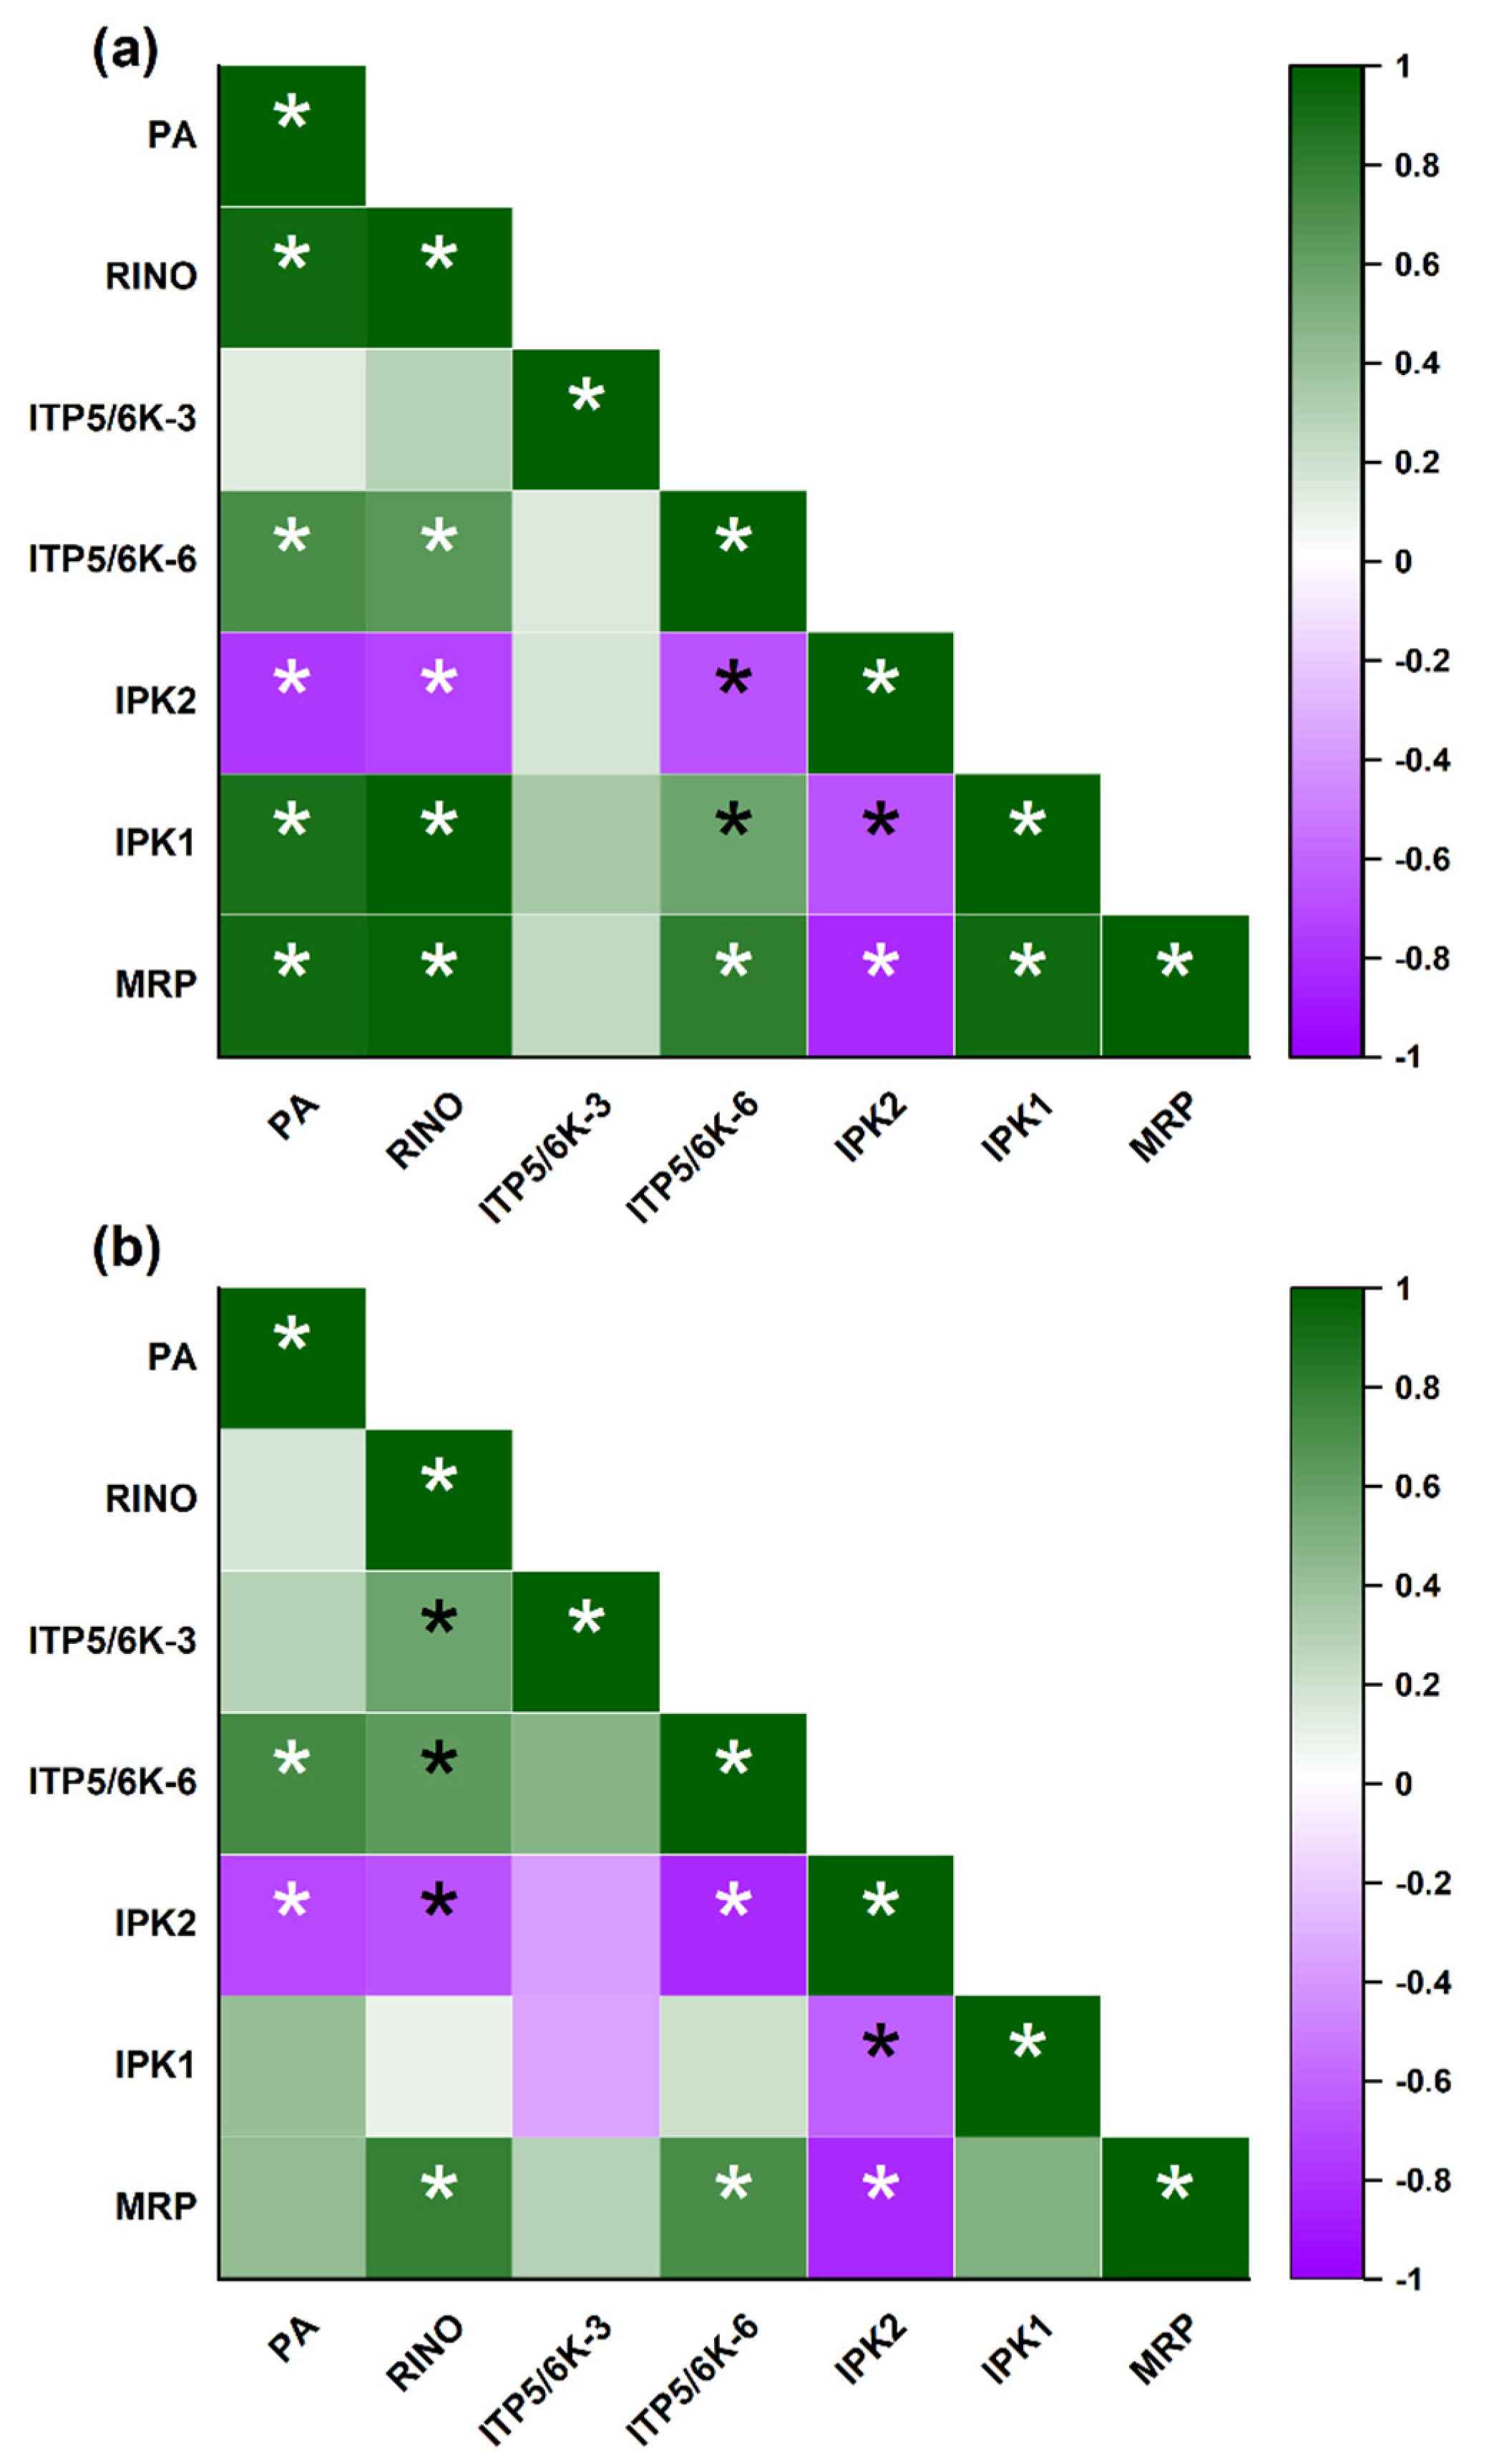
3.3. Transcript Profiling of PA under N Application

We further analyze the transcriptional variation of six PA synthesis-related genes in response to N application (Figure 4). Results showed that RION1 was the highly expressed, whereas the IPK2 was the least. All genes, except for IPT5/6K-6, were relatively highly expressed on the 10th day compared with the 5th day after the initial culture. N application generally induced a down-regulated effect on the transcriptional expression of inositol phosphate-related genes. For the 5th day, N1 treatment showed the transcriptional plateau for RION1, IPT5/6K-3, IPK1, and MRP, and then generally decreased as the N level increased. Grain IPT5/6K-6 showed a progressive decrement as responsive to increasing N level, but for the IPK2 gene, the trend was just the opposite. Grains cultured on the 10th day showed a similar variation. Specifically, the N4 treatment showed the lowest transcriptional expression of RION1, IPT5/6K-3 compared with other N treatments. For IPT5/6K-6 and MRP, N0 and/or N1 showed the highest transcriptional expression, N4 was observed with the least. IPK1 was highest expressed at the N0 level, but with other N levels insignificant, whereas IPK2 expression generally increased as the N level increased.

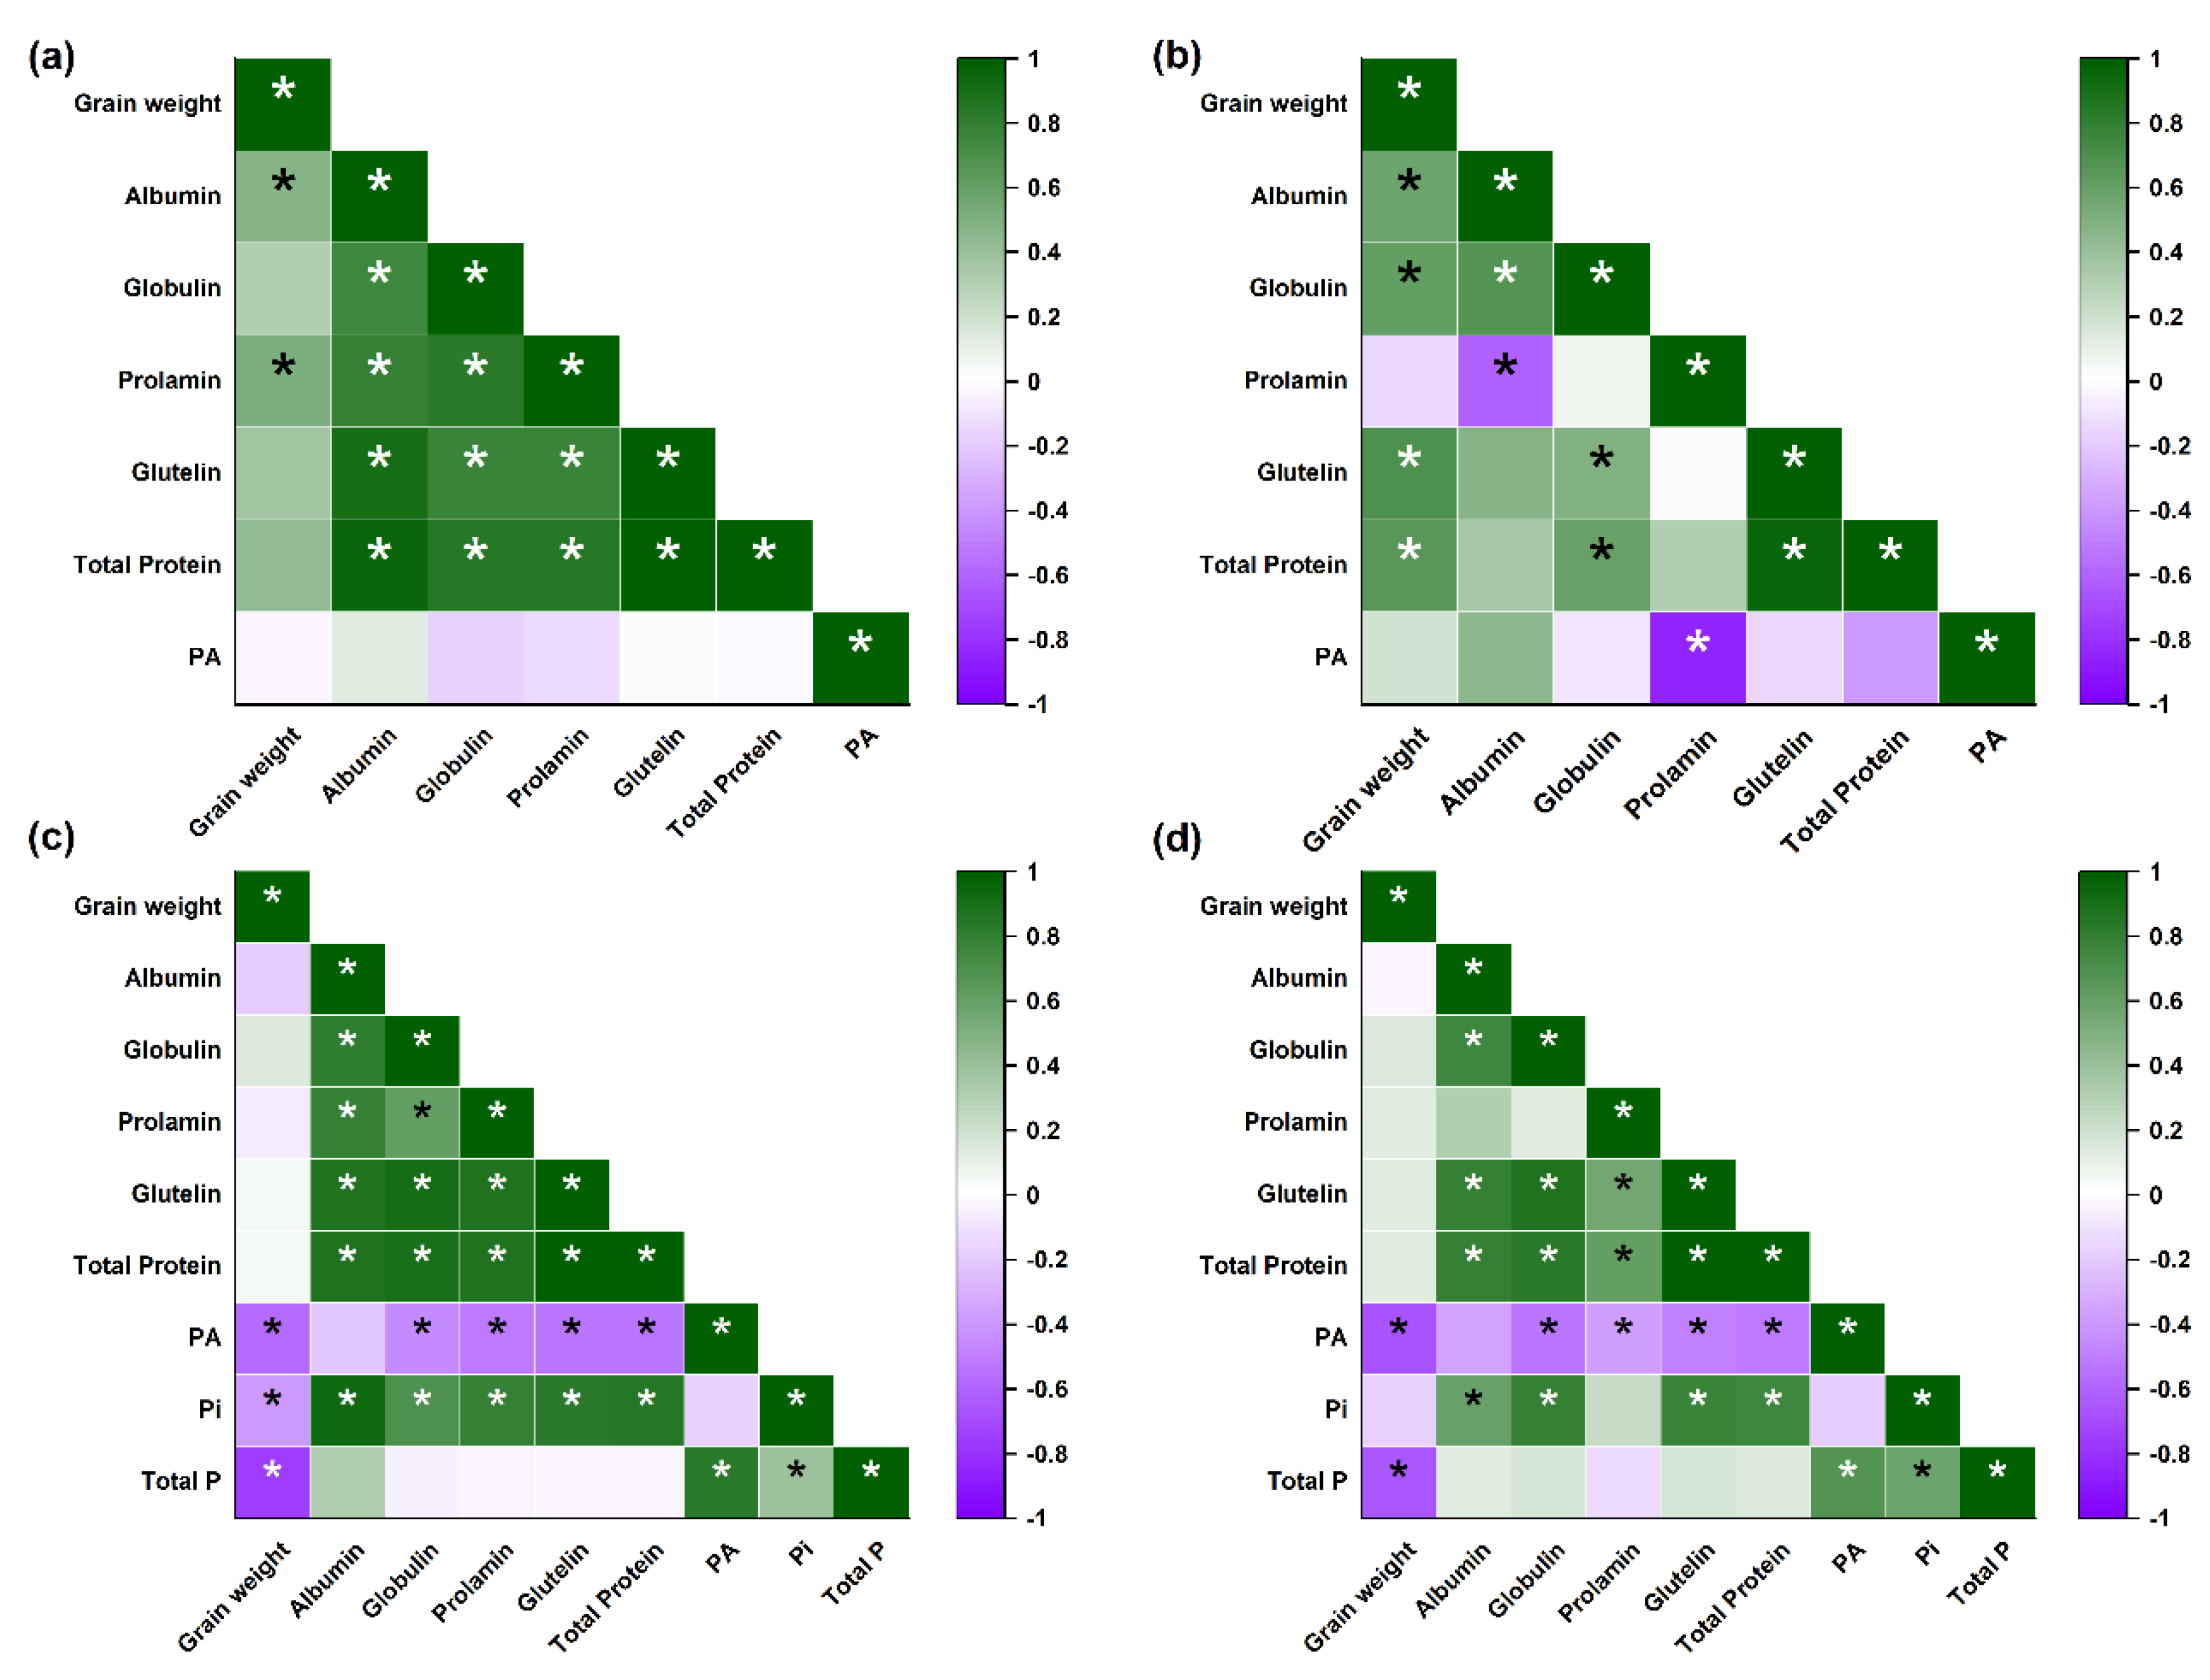
3.4. Correlation Analysis

The correlations among tested nutritional components in both culture systems were analyzed (Figure 5). In hydroponic culture (Figure 5a,b), no significant correlation was observed between PA and grain total protein in both genotypes, PA was insignificantly correlated with protein fractions for XS110, but significantly and negatively correlated with prolamin for HIPJ. In the detached panicle culture system (Figure 5c,d), grain PA was significantly and negatively correlated with total protein and three protein fractions (globulin, prolamin, and glutelin), regardless genotypes.
Grain PA concentration at maturity was significantly and positively correlated with gene expression level of RINO1, ITP5/6K-6, IPK1, and MRP, but significantly and negatively correlated with IPK2 when detached panicles were cultured for 5 days. Grain PA concentration at maturity was only significantly and positively correlated with ITP5/6K-6 gene expression level but significantly and negatively correlated with IPK2 when grain was cultured for 10 days (Figure 6).

4. Discussion

N-fertilization is an effective and one of the most critical agronomic practices for maximizing the grain yield, quality, and biofortification potential [35,36,37]. Hence, agronomic measures aiming at improving the nutritional quality, such as protein and minerals content, while reducing the anti-nutritional components such as PA, have become a matter of great interest [38,39,40]. Various studies have demonstrated that N-fertilization substantially improves the beneficial grain micronutrients, including Zn and Fe in rice. In contrast, N-induced variation in anti-nutritional components such as PA, PA synthesis-related gene expression, and grain protein fraction variation has been overlooked or received less attention. The current results suggest it may be possible to achieve quality optimization with N regulation (Figure 5).

4.1. Response of Grain Protein and Its Fractions to N Application

Grain protein is a major quality determinant while evaluating grain nutrition and economic value. It has been found that wheat grain progressively accumulates N until maturity under a suitable planting environment [41], and post-flowering has been reported a critical influential period [42]. Extensive studies have investigated the N-induced variation of grain proteins and showed a promotional effect [12,40]. Consistently, our study under hydroponic culture also showed that N application had a favorable influence on grain protein concentration. By enlarging the N gradient from N deficiency to excess under the detached panicle culture system, this variation trend became more prominent, grain protein concentration increased even at higher N levels. This can be explained by the fact that grain protein content was inherited as a typical polygenic trait and thereby susceptible to environmental factors, especially for N, an essential component during grain protein synthesis [43]. On the other hand, grain weight under high N level showed a significantly decreased trend. Liang et al. (2017) explained that excess N decreased both sink strength and grain-filling rate, especially for the inferior grain [44], and thus a decreased grain weight was recorded in our study.
It shows that the quantity and proportion of protein fractions, such as glutelin/prolamin, determine the overall protein quality [18,45]. Therefore, further understanding is required concerning the variation of N-induced grain protein fractions. Ning et al. (2010) reported that grain albumin and globulin, as metabolic and structural grain protein patterns, were less affected by N application [46], whereas quantitative proteomics in wheat identified three globulin proteins upregulated in high-nitrogen plants [36]. Our results showed that all grain protein fractions, including albumin and globulin, increased as the N supply increased. The possible explanation of this inconsistency might be due to either species difference or the more N levels being used in our study [47]. Actually, by further enlarging the N gradient using a detached panicle system, this trend became more prominent, suggesting a detached panicle culture system is a useful culture system for source-sink regulation even in a relatively shorter duration. By using foliar N spraying at 10–20 days after anthesis, Souza et al. (1999) found that glutelin was most contributed to the grain protein increment [48]. We found prolamin was most affected by N application in both culture systems. Although glutelin/total protein showed a similar increasing trend as Ning et al. (2009) [12] (Table 3), while grain glutelin/prolamin decreased under excessive N levels (Table 1 and Table 3). These findings imply that excessive N applied after heading enhances protein quantity but decreases the nutritional quality.
Histochemical studies show that rice caryopsis is composed of aleurone fractions, embryo, and starchy inner endosperm (milled rice) [49]. Traditionally, rice is consumed as milled rice, obtained by removing the embryo and aleurone fraction during the polishing process. Recently, brown rice or partially milled rice (with the combination of both brown rice and milled rice) has become more preferable for people who are health conscious. We therefore further analyzed positional protein distribution in rice grain. Our results demonstrated that grain protein, including the four fractions, was mostly distributed in the aleurone compared with the milled rice. It is consistent with Tong et al. (2019) [50], who also found that grain protein was mainly concentrated in the grain outer layer. Moreover, we also found that the effect of N application on grain protein concentration differed among the fractions. N application mainly increased grain protein, including its fractions in milled rice, rather than the most enriched aleurone fractions (except for glutelin in aleurone).

4.2. Response of Grain PA to N Application

Grain PA concentration is easily influenced by agricultural practices, including cultivation management (varieties, sowing time, soil properties, fertilization, irrigation, growth year and location, mixed cropping), climate (temperature, CO2-induced global warming), and their interactions [19,31]. This fluctuation challenges the stable inheritance of lpa phenotype and provides the opportunity to decrease grain PA through appropriate agronomic management. Previous findings regarding N-induced grain PA variation showed inconsistent results. The possible reasons may be attributed to the planting environment’s complexity and/or genetic PA inheritance. In this condition, two culture systems, hydroponic culture, and detached panicle culture systems, were used in the current study to exclude the interference of soil particles, unsuitable environment, and possible translocation of minerals (such as N, P) in the sink and source organs. Our results showed that N application generally decreased grain PA concentration, which was agreed with the previous report in field rice trials [12]. In hydroponic culture designed with the relatively narrow N range to guarantee plant normal growth, grain PA reduction extent was 5.0–7.3% with N application (Figure 2), which is comparable to Xia et al. (2018) findings, where 5.3% of PA was recorded under field experiment [51]. In a detached culture system designed with a wide N gradient to fully explore the N-influence grain PA variation, results further showed that grain PA and total P concentration generally decreased with N application (except at N4 level). Different from N-induced grain PA or total P variation, grain Pi concentration showed a generally increasing trend as the N level increased (Table 4), which is inconsistent with previous research by Bi et al. (2013), who reported no variation among different N rates [52]. The possible reasons for this discrepancy might be the combination of the wide N gradient range used (including the excessive N level), the difference in N–P interaction in culture solution and field soil, and/or the functional role of the root. Therefore, more research is required to elucidate further the role of different P fractions on rice grain development and PA synthesis with N application.
Compared with grain positional distribution, the present study showed that aleurone fraction contained the highest grain PA concentration as expected, whereas milled rice had the least. This was similar to those of Iwai et al. (2012), who used energy-dispersive X-ray microanalyses and observed that grain PA was mostly distributed in aleurone fractions [28]. Moreover, we further revealed that the N application had a significant distributional influence on grain PA concentration. Relatively to LN, N application decreased grain PA in both aleurone fraction and milled rice, but with N level dependent. It should be noted that in the detached panicle culture system, the significantly higher grain PA concentration under excessive-high N levels (N4) seemed inconsistent with the general negative induction of the N effect. The lowest grain weight under the N4 level also represented the higher proportion of the PA-enriched aleurone fraction, which can explain the grain PA increment under the N4 level.

4.3. Transcript Profiling of PA under N Application

PA is synthesized by multiple inositol phosphate enzymes coded by a set of genes [53]. It is generally accepted that PA biosynthesis is followed by two separate pathways, lipid-independent and lipid-dependent pathways [21]. The lipid-independent pathway is a process of sequential and stepwise phosphorylation process from Ins(3)P1 to IP6 (PA), catalyzed by specific inositol phosphate kinases. Among them, myo-inositol-3-phosphate synthase (MIPS, a rate-limiting enzyme in the PA biosynthesis pathway) catalyzes the initial committed step in PA synthesis. Previous results showed that RINO1 (MIPS coding gene in rice), IPT5/6K-3, IPT5/6K-6 were key and highest expressed genes in this pathway [53]. Another alternative pathway is the lipid-dependent biosynthesis pathway, and the IPK2 gene is reported to be mainly involved. Both pathways shared the same last step from Ins(1,3,4,5,6)P5 to Ins(1,2,3,4,5,6)P6 (InsP6), catalyzed by inositol 1,3,4,5,6-pentakisphosphate 2-kinase (IPK1). Synthesized cellular PA in cytosol still needs to transport to storage vacuoles as globoids, a multidrug resistance-associated protein (MPR), belong to the ATP-binding cassette (ABC), which is responsible for PA’s transport and compartmentalization.
Our results from the detached panicle culture experiment also showed that RINO1 was most highly expressed among six selected PA synthesis-related genes (Figure 4). In previous research, a strong emphasis was focused on the identification and characterization of genes necessary in PA synthesis [54], RNAi mediation in lpa generation [20,55], and transcriptome analysis of rice with various grain PA genetic backgrounds [56]. However, rare information was available about the transcription expression of PA-related genes in response to fertilizer or mineral regulation. Our results showed that N application generally decreased most PA synthesis-related genes, including RINO1, IPT5/6K-3, IPT5/6K-6, IPK1, and MRP, but increased IPK2 gene expression. However, under N regulation, RINO1, IPT5/6K-6, IPK1, and MRP may be more important for PA biosynthesis (Figure 4 and Figure 6). The trend was similar in both culture periods (5th and 10th days after the initial culture). Since the lipid-independent pathway is the major route that contributes to grain PA accumulation, whereas the lipid-dependent pathway mainly involves signal transduction [21], the downregulation of PA synthesis-related genes treated by N application could be a possible partial reason for the grain PA reduction.

5. Conclusions

The present study reported the potential beneficial effect of N application on grain protein enhancement but anti-nutritional phytic acid (PA) reduction. Grain PA and protein, including albumin, globulin, prolamin, and glutelin, were primarily distributed in rice grains’ aleurone fractions. Rational N application simultaneously enhanced grain protein quantity and quality but decreased grain PA and its essential regulatory genes. N application decreased grain PA in both aleurone and milled rice, but with N level dependent, whereas N application mainly increased protein, including the concentration of its fractions in milled rice. Optimized N application has the potential to promote the rice protein and mineral’s bioavailability status.

Author Contributions

D.S., methodology, formal analysis and writing—original draft preparation; M.A.M. and X.C., data validation, visualization, writing—review and editing; S.K.R., conceptualization and writing—review and editing; L.W. and Y.C., formal analysis and visualization; F.C., methodology, supervision, review and editing. All authors have read and agreed to the published version of the manuscript.

Funding

This research was funded by Fujian Province Natural Science, grant number 2019J01374 and International Magnesium Institute Foundation, grant number IMI 2018-12.

Institutional Review Board Statement

Not applicable.

Informed Consent Statement

Not applicable.

Data Availability Statement

Not applicable.

Conflicts of Interest

The authors declare no conflict of interest.

References

  1. Schneider, P.; Asch, F. Rice production and food security in Asian Mega deltas-A review on characteristics, vulnerabilities and agricultural adaptation options to cope with climate change. J. Agron. Crop Sci. 2020, 206, 491–503. [Google Scholar] [CrossRef]
  2. Panigrahi, R.; Kariali, E.; Panda, B.B.; Lafarge, T.; Mohapatra, P.K. Controlling the trade-off between spikelet number and grain filling: The hierarchy of starch synthesis in spikelets of rice panicle in relation to hormone dynamics (vol 46, pg 507, 2019). Funct. Plant Biol. 2019, 46, 507–523. [Google Scholar] [CrossRef] [PubMed]
  3. Witcombe, J.R.; Gyawali, S.; Subedi, M.; Virk, D.S.; Joshi, K.D. Plant breeding can be made more efficient by having fewer, better crosses. BMC Plant Biol. 2013, 13, 22. [Google Scholar] [CrossRef] [PubMed] [Green Version]
  4. Fiaz, S.; Ahmad, S.; Noor, M.A.; Wang, X.; Younas, A.; Riaz, A.; Riaz, A.; Ali, F. Applications of the CRISPR/Cas9 System for Rice Grain Quality Improvement: Perspectives and Opportunities. Int. J. Mol. Sci. 2019, 20, 888. [Google Scholar] [CrossRef] [PubMed] [Green Version]
  5. Abeysingha, N.S.; Singh, M.; Islam, A.; Sehgal, V.K. Climate change impacts on irrigated rice and wheat production in Gomti River basin of India: A case study. Springerplus 2016, 5, 1250. [Google Scholar] [CrossRef] [PubMed] [Green Version]
  6. van Oort, P.A.J.; Zwart, S.J. Impacts of climate change on rice production in Africa and causes of simulated yield changes. Glob. Chang. Biol. 2018, 24, 1029–1045. [Google Scholar] [CrossRef] [Green Version]
  7. Perchlik, M.; Tegeder, M. Improving Plant Nitrogen Use Efficiency through Alteration of Amino Acid Transport Processes. Plant Physiol. 2017, 175, 235–247. [Google Scholar] [CrossRef] [Green Version]
  8. Linquist, B.A.; Liu, L.J.; van Kessel, C.; van Groenigen, K.J. Enhanced efficiency nitrogen fertilizers for rice systems: Meta-analysis of yield and nitrogen uptake. Field Crops Res. 2013, 154, 246–254. [Google Scholar] [CrossRef]
  9. Mur, L.A.J.; Simpson, C.; Kumari, A.; Gupta, A.K.; Gupta, K.J. Moving nitrogen to the centre of plant defence against pathogens. Ann. Bot. 2017, 119, 703–709. [Google Scholar] [CrossRef] [Green Version]
  10. Singh, H.; Verma, A.; Ansari, M.W.; Shukla, A. Physiological response of rice (Oryza sativa L.) genotypes to elevated nitrogen applied under field conditions. Plant Signal Behav. 2014, 9, e29015. [Google Scholar] [CrossRef] [Green Version]
  11. Xue, L.H.; Yang, L.Z. Recommendations for nitrogen fertiliser topdressing rates in rice using canopy reflectance spectra. Biosyst. Eng. 2008, 100, 524–534. [Google Scholar] [CrossRef]
  12. Ning, H.F.; Liu, Z.G.; Wang, Q.S.; Lin, Z.M.; Chen, S.J.; Li, G.H.; Wang, S.H.; Ding, Y.F. Effect of nitrogen fertilizer application on grain phytic acid and protein concentrations in japonica rice and its variations with genotypes. J. Cereal Sci. 2009, 50, 49–55. [Google Scholar] [CrossRef]
  13. Gu, J.F.; Chen, J.; Chen, L.; Wang, Z.Q.; Zhang, H.; Yang, J.C. Grain quality changes and responses to nitrogen fertilizer of japonica rice cultivars released in the Yangtze River Basin from the 1950s to 2000s. Crop J. 2015, 3, 285–297. [Google Scholar] [CrossRef] [Green Version]
  14. Zhou, C.C.; Huang, Y.C.; Jia, B.Y.; Wang, Y.; Wang, Y.; Xu, Q.; Li, R.F.; Wang, S.; Dou, F.G. Effects of Cultivar, Nitrogen Rate, and Planting Density on Rice-Grain Quality. Agronomy 2018, 8, 246. [Google Scholar] [CrossRef] [Green Version]
  15. Singh, B.R.; Timsina, Y.N.; Lind, O.C.; Cagno, S.; Janssens, K. Zinc and Iron Concentration as Affected by Nitrogen Fertilization and Their Localization in Wheat Grain. Front. Plant Sci. 2018, 9, 307. [Google Scholar] [CrossRef] [Green Version]
  16. Wood, R.M.; Dunn, B.W.; Balindong, J.L.; Waters, D.L.E.; Blanchard, C.L.; Mawson, A.J.; Oli, P. Effect of agronomic management on rice grain quality Part II: Nitrogen rate and timing. Cereal Chem. 2021, 98, 234–248. [Google Scholar] [CrossRef]
  17. Kawakatsu, T.; Hirose, S.; Yasuda, H.; Takaiwa, F. Reducing rice seed storage protein accumulation leads to changes in nutrient quality and storage organelle formation. Plant Physiol. 2010, 154, 1842–1854. [Google Scholar] [CrossRef] [Green Version]
  18. Wang, Z.X.; Li, H.; Liang, M.C.; Yang, L. Glutelin and prolamin, different components of rice protein, exert differently in vitro antioxidant activities. J. Cereal Sci. 2016, 72, 108–116. [Google Scholar] [CrossRef]
  19. Perera, I.; Seneweera, S.; Hirotsu, N. Manipulating the Phytic Acid Content of Rice Grain Toward Improving Micronutrient Bioavailability. Rice 2018, 11, 4. [Google Scholar] [CrossRef] [Green Version]
  20. Ali, N.; Paul, S.; Gayen, D.; Sarkar, S.N.; Datta, S.K.; Datta, K. RNAi mediated down regulation of myo-inositol-3-phosphate synthase to generate low phytate rice. Rice 2013, 6, 12. [Google Scholar] [CrossRef] [Green Version]
  21. Sparvoli, F.; Cominelli, E. Seed Biofortification and Phytic Acid Reduction: A Conflict of Interest for the Plant? Plants 2015, 4, 728–755. [Google Scholar] [CrossRef] [PubMed] [Green Version]
  22. Lin, Y.F.; Liang, H.M.; Yang, S.Y.; Boch, A.; Clemens, S.; Chen, C.C.; Wu, J.F.; Huang, J.L.; Yeh, K.C. Arabidopsis IRT3 is a zinc-regulated and plasma membrane localized zinc/iron transporter. N. Phytol. 2009, 182, 392–404. [Google Scholar] [CrossRef] [PubMed]
  23. Morgounov, A.; Gomez-Becerra, H.F.; Abugalieva, A.; Dzhunusova, M.; Yessimbekova, M.; Muminjanov, H.; Zelenskiy, Y.; Ozturk, L.; Cakmak, I. Iron and zinc grain density in common wheat grown in Central Asia. Euphytica 2007, 155, 193–203. [Google Scholar] [CrossRef] [Green Version]
  24. Zhang, W.; Liu, D.; Liu, Y.; Chen, X.; Zou, C. Overuse of Phosphorus Fertilizer Reduces the Grain and Flour Protein Contents and Zinc Bioavailability of Winter Wheat (Triticum aestivum L.). J. Agric. Food Chem 2017, 65, 1473–1482. [Google Scholar] [CrossRef] [PubMed]
  25. Simic, M.; Dragicevic, V.; Drinic, S.M.; Vukadinovic, J.; Kresovic, B.; Tabakovic, M.; Brankov, M. The Contribution of Soil Tillage and Nitrogen Rate to the Quality of Maize Grain. Agronomy 2020, 10, 976. [Google Scholar] [CrossRef]
  26. Kaplan, M.; Karaman, K.; Kardes, Y.M.; Kale, H. Phytic acid content and starch properties of maize (Zea mays L.): Effects of irrigation process and nitrogen fertilizer. Food Chem. 2019, 283, 375–380. [Google Scholar] [CrossRef]
  27. Wang, S.X.; Li, M.; Tian, X.H.; Li, J.; Li, H.Y.; Ni, Y.J.; Zhao, J.H.; Chen, Y.L.; Guo, C.H.; Zhao, A.Q. Foliar Zinc, Nitrogen, and Phosphorus Application Effect on Micronutrient Concentrations in Winter Wheat. Agron. J. 2015, 107, 61–70. [Google Scholar] [CrossRef]
  28. Iwai, T.; Takahashi, M.; Oda, K.; Terada, Y.; Yoshida, K.T. Dynamic changes in the distribution of minerals in relation to phytic acid accumulation during rice seed development. Plant Physiol. 2012, 160, 2007–2014. [Google Scholar] [CrossRef] [Green Version]
  29. Paltridge, N.G.; Palmer, L.J.; Milham, P.J.; Guild, G.E.; Stangoulis, J.C.R. Energy-dispersive X-ray fluorescence analysis of zinc and iron concentration in rice and pearl millet grain. Plant Soil 2012, 361, 251–260. [Google Scholar] [CrossRef]
  30. Liu, Q.L.; Xu, X.H.; Ren, X.L.; Fu, H.W.; Wu, D.X.; Shu, Q.Y. Generation and characterization of low phytic acid germplasm in rice (Oryza sativa L.). Theor. Appl. Genet. 2007, 114, 803–814. [Google Scholar] [CrossRef]
  31. Su, D.; Zhou, L.; Zhao, Q.; Pan, G.; Cheng, F. Different Phosphorus Supplies Altered the Accumulations and Quantitative Distributions of Phytic Acid, Zinc, and Iron in Rice (Oryza sativa L.) Grains. J. Agric. Food Chem. 2018, 66, 1601–1611. [Google Scholar] [CrossRef] [PubMed]
  32. Wang, K.M.; Wu, J.G.; Li, G.; Zhang, D.P.; Yang, Z.W.; Shi, C.H. Distribution of phytic acid and mineral elements in three indica rice (Oryza sativa L.) cultivars. J. Cereal Sci. 2011, 54, 116–121. [Google Scholar] [CrossRef]
  33. Liu, Z.H.; Cheng, F.M.; Cheng, W.D.; Zhang, G.P. Positional variations in phytic acid and protein content within a panicle of japonica rice. J. Cereal Sci. 2005, 41, 297–303. [Google Scholar] [CrossRef]
  34. Jiang, M.; Liu, Y.; Liu, Y.; Tan, Y.; Huang, J.; Shu, Q. Mutation of Inositol 1,3,4-trisphosphate 5/6-kinase6 Impairs Plant Growth and Phytic Acid Synthesis in Rice. Plants 2019, 8, 114. [Google Scholar] [CrossRef] [Green Version]
  35. Zhang, J.; Wu, L.H.; Wang, M.Y. Iron and zinc biofortification in polished rice and accumulation in rice plant (Oryza sativa L.) as affected by nitrogen fertilization. Acta Agric. Scand. Sect. B Soil Plant Sci. 2008, 58, 267–272. [Google Scholar] [CrossRef]
  36. Liu, P.X.; Ma, X.F.; Wan, H.S.; Zheng, J.M.; Luo, J.T.; Hu, Y.B.; Pu, Z.J. Effects of differential nitrogen application on wheat grain proteome. J. Cereal Sci. 2021, 102, 103367. [Google Scholar] [CrossRef]
  37. Liu, K.; Deng, J.; Lu, J.; Wang, X.; Lu, B.; Tian, X.; Zhang, Y. High Nitrogen Levels Alleviate Yield Loss of Super Hybrid Rice Caused by High Temperatures During the Flowering Stage. Front. Plant Sci. 2019, 10, 357. [Google Scholar] [CrossRef] [Green Version]
  38. Kumar, A.; Lal, M.K.; Kar, S.S.; Nayak, L.; Ngangkham, U.; Samantaray, S.; Sharma, G. Bioavailability of iron and zinc as affected by phytic acid content in rice grain. J. Food Biochem. 2017, 41, e12413. [Google Scholar] [CrossRef]
  39. Wang, Z.H.; Li, S.X.; Malhi, S. Effects of fertilization and other agronomic measures on nutritional quality of crops. J. Sci. Food Agric. 2008, 88, 7–23. [Google Scholar] [CrossRef]
  40. Shi, R.L.; Zhang, Y.Q.; Chen, X.P.; Sun, Q.P.; Zhang, F.S.; Romheld, V.; Zou, C.Q. Influence of long-term nitrogen fertilization on micronutrient density in grain of winter wheat (Triticum aestivum L.). J. Cereal Sci. 2010, 51, 165–170. [Google Scholar] [CrossRef]
  41. Masclaux-Daubresse, C.; Daniel-Vedele, F.; Dechorgnat, J.; Chardon, F.; Gaufichon, L.; Suzuki, A. Nitrogen uptake, assimilation and remobilization in plants: Challenges for sustainable and productive agriculture. Ann. Bot. 2010, 105, 1141–1157. [Google Scholar] [CrossRef] [PubMed] [Green Version]
  42. Taulemesse, F.; Le Gouis, J.; Gouache, D.; Gibon, Y.; Allard, V. Post-Flowering Nitrate Uptake in Wheat Is Controlled by N Status at Flowering, with a Putative Major Role of Root Nitrate Transporter NRT2.1. PLoS ONE 2015, 10, e0120291. [Google Scholar] [CrossRef] [PubMed] [Green Version]
  43. Tan, Y.F.; Sun, M.; Xing, Y.Z.; Hua, J.P.; Sun, X.L.; Zhang, Q.F.; Corke, H. Mapping quantitative trait loci for milling quality, protein content and color characteristics of rice using a recombinant inbred line population derived from an elite rice hybrid. Theor. Appl. Genet. 2001, 103, 1037–1045. [Google Scholar] [CrossRef]
  44. Liang, W.X.; Zhang, Z.C.; Wen, X.X.; Liao, Y.C.; Liu, Y. Effect of non-structural carbohydrate accumulation in the stem pre-anthesis on grain filling of wheat inferior grain. Field Crops Res. 2017, 211, 66–76. [Google Scholar] [CrossRef]
  45. Furukawa, S.; Tanaka, K.; Masumura, T.; Ogihara, Y.; Kiyokawa, Y.; Wakai, Y. Influence of rice proteins on eating quality of cooked rice and on aroma and flavor of sake. Cereal Chem. 2006, 83, 439–446. [Google Scholar] [CrossRef]
  46. Ning, H.F.; Qiao, J.F.; Liu, Z.H.; Lin, Z.M.; Li, G.H.; Wang, Q.S.; Wang, S.H.; Ding, Y.F. Distribution of proteins and amino acids in milled and brown rice as affected by nitrogen fertilization and genotype. J. Cereal Sci. 2010, 52, 90–95. [Google Scholar] [CrossRef]
  47. Wei, K.; Wang, X.D.; Chen, X.; Wu, F.B.; Zhang, G.P. Hormonal changes in grains of cv. Triumph and its mutant TL43 as affected by nitrogen fertilizer at heading time. J. Cereal Sci. 2009, 49, 246–249. [Google Scholar] [CrossRef]
  48. Souza, S.R.; Stark, E.M.L.M.; Fernandes, M.S. Foliar spraying of rice with nitrogen: Effect on protein levels, protein fractions, and grain weight. J. Plant Nutr. 1999, 22, 579–588. [Google Scholar] [CrossRef]
  49. Krishnan, S.; Dayanandan, P. Structural and histochemical studies on grain-filling in the caryopsis of rice (Oryza sativa L.). J. Biosci. 2003, 28, 455–469. [Google Scholar] [CrossRef]
  50. Tong, C.; Gao, H.; Luo, S.; Liu, L.; Bao, J. Impact of Postharvest Operations on Rice Grain Quality: A Review. Compr. Rev. Food Sci. Food Saf. 2019, 18, 626–640. [Google Scholar] [CrossRef] [Green Version]
  51. Xia, H.; Xue, Y.; Liu, D.; Kong, W.; Xue, Y.; Tang, Y.; Li, J.; Li, D.; Mei, P. Rational Application of Fertilizer Nitrogen to Soil in Combination with Foliar Zn Spraying Improved Zn Nutritional Quality of Wheat Grains. Front. Plant Sci. 2018, 9, 677. [Google Scholar] [CrossRef] [PubMed] [Green Version]
  52. Bi, J.G.; Liu, Z.H.; Lin, Z.M.; Alim, M.A.; Rehmani, M.I.A.; Li, G.H.; Wang, Q.S.; Wang, S.H.; Ding, Y.F. Phosphorus accumulation in grains of japonica rice as affected by nitrogen fertilizer. Plant Soil 2013, 369, 231–240. [Google Scholar] [CrossRef]
  53. Suzuki, M.; Tanaka, K.; Kuwano, M.; Yoshida, K.T. Expression pattern of inositol phosphate-related enzymes in rice (Oryza sativa L.): Implications for the phytic acid biosynthetic pathway. Gene 2007, 405, 55–64. [Google Scholar] [CrossRef] [PubMed]
  54. Kim, S.I.; Tai, T.H. Identification of genes necessary for wild-type levels of seed phytic acid in Arabidopsis thaliana using a reverse genetics approach. Mol. Genet. Genom. 2011, 286, 119–133. [Google Scholar] [CrossRef] [PubMed]
  55. Nunes, A.C.; Vianna, G.R.; Cuneo, F.; Amaya-Farfan, J.; de Capdeville, G.; Rech, E.L.; Aragao, F.J. RNAi-mediated silencing of the myo-inositol-1-phosphate synthase gene (GmMIPS1) in transgenic soybean inhibited seed development and reduced phytate content. Planta 2006, 224, 125–132. [Google Scholar] [CrossRef] [Green Version]
  56. Jin, H.X.; Yu, X.M.; Yang, Q.H.; Fu, X.J.; Yuan, F.J. Transcriptome analysis identifies differentially expressed genes in the progenies of a cross between two low phytic acid soybean mutants. Sci. Rep. 2021, 11, 8740. [Google Scholar] [CrossRef]
Figure 1. Effect of N levels on (a) Albumin (%), (b) Globulin (%), (c) Prolamin (%), (d) Glutelin (%), (e) Total protein (%), (f) Glutelin/Prolamin in different rice grain fractions, including brown rice, milled rice, and aleurone (XS110 of 2016 in hydroponic culture). LN: low nitrogen level; MN: medium nitrogen level; HN: high nitrogen level. Bars indicate the mean ± SE. Different letters for every three N levels (LN, MH, HN) of each grain fraction denoted significant differences according to a one-way ANOVA analysis followed by Tukey’s multiple comparison test.
Agronomy 12 01234 g001
Figure 2. Effect of N levels on grain phytic acid (PA) concentration on rice grain under hydroponic culture; (a) 2015; (b) 2016. LN: low nitrogen level; MN: medium nitrogen level; HN: high nitrogen level. Bars indicate the mean ± SE. Different letters for every three N levels (LN, MH, HN) denoted significant differences according to one-way ANOVA analysis followed by Tukey’s multiple comparison test.
Agronomy 12 01234 g002
Figure 3. Effect of N levels on phytic acid (PA) concentration in different rice grain fractions (brown rice, milled rice, and aleurone) (XS110 of 2016 in hydroponic culture). LN: low nitrogen level; MN: medium nitrogen level; HN: high nitrogen level; PA: phytic acid. Bars indicate the mean ± SE. Different letters for every 3 N levels (LN, MH, HN) denoted significant differences according to one-way ANOVA analysis followed by Tukey’s multiple comparison test.
Agronomy 12 01234 g003
Figure 4. N-induced phytic acid (PA) synthesis-related genes expression in the grains; (a) RINO1, (b) ITP5/6K-3, (c) ITP5/6K-6, (d) IPK2, (e) IPK1, (f) MRP under detached panicle culture for XS110. Bars indicate the mean ± SE. Different letters for every five N levels denoted significant difference according to one-way ANOVA analysis followed by Tukey’s multiple comparison test.
Agronomy 12 01234 g004
Figure 5. Pearson correlation among grain phytic acid (PA) and protein fractions for the following: (a) XS110 for hydroponic culture; (b) HIPJ for hydroponic culture; (c) XS110 for detached panicle culture; (d) HIPJ for detached panicle culture. The symbol * represents significance at the level of p < 0.05.
Agronomy 12 01234 g005
Figure 6. Pearson correlation between PA-related genes expressions ((a) for 5 days after culture, (b) for 10 days after culture) and grain phytic acid (PA) concentrations. (XS110 for detached panicle culture). The symbol * represents significance at the level of p < 0.05.
Agronomy 12 01234 g006
Table 1. Sequence of primers for PA synthesis-related genes.
Gene NameAccession NumberPrimer (Forward, 5′-3′)Primer (Reverse, 5′-3′)Tm
OsActinAK100267TGCGACGTGGATATTAGGAATGCCAGGGAACATAGTGGTA59–73
RINO1AK103501AAACATTCCGATCCAAGGAGCAAGCTCATAGAGGATGGCA59–81
ITP5/6K-3AK067068GCTGAACTTCCTCCAAGACCGAACCGATCTCTTGTCCCAT59–117
ITP5/6K-6AK102571TTGGGTTTGATGTCGTTGTTATGACTGCTTGATTGCATCC59–132
IPK1AK102842TGCCAAAGATTGGGTTTACATAGAAGGTGACGAGCCAGTG59–74
IPK2AK072296GGAGCAAACCCTGTACCACTACCAGCTTCACCCTTACACC59–114
MRP5AK121451TTGTCGCCGTGATAACATTTCAGAAAGAACACCTCCAGCA59–72
Table 2. Effect of N levels on grain dry weight, albumin, globulin, prolamin, glutelin, total protein concentration, glutelin/total protein, protein content in rice (Hydroponic culture).
YearGenotypeN Level1000-Grain
Weight (g)
Albumin (%)Globulin (%)Prolamin (%)Glutelin (%)Total Protein
(%)
Glutelin
/Total Protein
Protein
(mg Grain−1)
Glutelin/Prolamin
2015XS110LN23.8 ± 0.2 b0.327 ± 0.030 c0.380 ± 0.053 b0.611 ± 0.092 b7.09 ± 0.16 c8.41 ± 0.18 c84.3 ± 1.5 a2.00 ± 0.04 b11.76 ± 1.65 a
MN26.5 ± 0.2 a0.454 ± 0.010 b0.444 ± 0.072 ab0.759 ± 0.029 ab7.62 ± 0.06 b9.28 ± 0.11 b82.1 ± 0.8 ab2.46 ± 0.04 a10.05 ± 0.31 b
HN24.2 ± 0.1 b0.518 ± 0.008 a0.522 ± 0.013 a0.786 ± 0.042 a8.04 ± 0.22 a9.86 ± 0.17 a81.5 ± 0.8 b2.38 ± 0.03 a10.23 ± 0.37 ab
HIPJLN23.8 ± 0.5 b0.627 ± 0.035 a0.533 ± 0.035 a0.167 ± 0.031 b6.69 ± 0.39 b8.01 ± 0.46 b83.4 ± 0.4 a1.91 ± 0.11 b40.73 ± 4.99 a
MN25.3 ± 0.0 a0.537 ± 0.015 b0.500 ± 0.010 a0.300 ± 0.072 a7.47 ± 0.55 ab8.80 ± 0.52 ab84.8 ± 1.5 a2.22 ± 0.13 ab25.67 ± 4.9 b
HN25.1 ± 0.3 a0.653 ± 0.021 a0.517 ± 0.029 a0.240 ± 0.036 ab8.61 ± 0.75 a10.02 ± 0.70 a85.9 ± 1.4 a2.51 ± 0.21 a36.18 ± 3.73 b
2016XS110LN23.7 ± 0.1 b0.223 ± 0.060 b0.356 ± 0.009 b0.584 ± 0.029 c6.96 ± 0.09 b8.12 ± 0.17 c85.7 ± 0.8 a1.93 ± 0.03 c11.93 ± 0.48 a
MN24.4 ± 0.5 ab0.291 ± 0.005 b0.418 ± 0.027 ab0.685 ± 0.028 b7.18 ± 0.12 b8.57 ± 0.11 b83.7 ± 0.3 b2.09 ± 0.02 b10.48 ± 0.28 b
HN24.9 ± 0.0 a0.455 ± 0.059 a0.493 ± 0.057 a0.754 ± 0.014 a7.64 ± 0.05 a9.35 ± 0.12 a81.8 ± 0.5 c2.33 ± 0.03 a10.14 ± 0.13 b
HIPJLN22.7 ± 0.1 b0.326 ± 0.038 b0.353 ± 0.053 b0.708 ± 0.042 a6.40 ± 0.45 b7.79 ± 0.37 b82.1 ± 1.9 a1.77 ± 0.08 c9.04 ± 0.33 a
MN24.7 ± 0.2 a0.488 ± 0.022 a0.512 ± 0.021 a0.828 ± 0.056 a7.37 ± 0.37 a9.20 ± 0.32 a80.1 ± 1.3 a2.27 ± 0.08 b8.91 ± 0.27 a
HN24.6 ± 0.3 a0.494 ± 0.025 a0.580 ± 0.036 a1.086 ± 0.287 a8.03 ± 0.23 a10.19 ± 0.51 a78.9 ± 2.0 a2.51 ± 0.12 a7.68 ± 1.62 a
CV3.929.616.142.88.39.02.011.671.4
LN: low nitrogen level; MN: medium nitrogen level; HN: high nitrogen level. All data were presented as mean ± SE. CV: the coefficient of variation. Different letters for every three N levels (LN, MH, HN) in each year denoted significant differences according to a one-way ANOVA analysis followed by Tukey’s multiple comparison test.
Table 3. Effect of N levels on grain dry weight, albumin, globulin, prolamin, glutelin, total protein concentration, glutelin/total protein, glutelin/prolamin and protein content in rice (detached panicle culture system).
YearGenotypeN
Level
1000-Grain Weight (g)Albumin
(%)
Globulin
(%)
Prolamin
(%)
Glutelin (%)Total Protein (%)Glutelin/Total ProteinProtein
(mg Grain−1)
Glutelin/Prolamin
2015XS110N016.33 ± 0.17 c0.350 ± 0.012 e0.156 ± 0.005 e0.180 ± 0.003 e2.24 ± 0.12 e2.92 ± 0.14 e76.5 ± 0.7 c0.48 ± 0.03 e12.43 ± 0.51 d
N118.81 ± 0.06 b0.397 ± 0.007 d0.358 ± 0.005 d0.266 ± 0.003 d4.45 ± 0.11 d5.47 ± 0.10 d81.3 ± 0.4 b1.03 ± 0.02 d16.74 ± 0.22 b
N218.84 ± 0.11 b0.424 ± 0.004 c0.458 ± 0.005 c0.376 ± 0.014 c6.99 ± 0.08 c8.24 ± 0.06 c84.7 ± 0.3 a1.55 ± 0.02 c18.58 ± 0.62 a
N320.57 ± 0.08 a0.456 ± 0.011 b0.499 ± 0.003 b0.507 ± 0.022 b8.87 ± 0.17 b10.33 ± 0.17 b85.8 ± 0.3 a2.12 ± 0.03 a17.49 ± 0.43 ab
N415.43 ± 0.35 d0.588 ± 0.008 a0.589 ± 0.015 a0.696 ± 0.021 a10.75 ± 0.03 a12.62 ± 0.06 a85.2 ± 0.2 a1.95 ± 0.04 b15.46 ± 0.43 c
HIPJN017.36 ± 0.35 ab0.352 ± 0.007 d0.413 ± 0.002 c0.207 ± 0.038 c4.67 ± 0.30 d5.65 ± 0.28 e82.7 ± 1.3 b0.98 ± 0.03 d22.9 ± 2.55 ab
N116.67 ± 1.13 bc0.424 ± 0.033 c0.516 ± 0.012 b0.256 ± 0.023 c6.87 ± 0.27 c8.07 ± 0.27 d85.2 ± 0.5 a1.34 ± 0.06 c26.89 ± 1.36 a
N218.92 ± 0.45 a0.508 ± 0.034 b0.610 ± 0.008 a0.368 ± 0.042 b7.39 ± 0.13 c8.87 ± 0.15 c83.3 ± 0.5 ab1.68 ± 0.03 b20.23 ± 2.01 bc
N317.54 ± 0.59 ab0.510 ± 0.019 b0.635 ± 0.010 a0.528 ± 0.013 a8.61 ± 0.51 b10.28 ± 0.52 b83.7 ± 0.8 ab1.80 ± 0.03 a16.29 ± 0.58 c
N415.21 ± 0.49 c0.577 ± 0.005 a0.622 ± 0.019 a0.536 ± 0.030 a9.56 ± 0.10 a11.30 ± 0.09 a84.6 ± 0.2 ab1.72 ± 0.04 ab17.88 ± 0.8 c
2016XS110N017.22 ± 0.11 cd0.403 ± 0.006 d0.181 ± 0.010 d0.431 ± 0.011 d4.19 ± 0.09 e5.21 ± 0.09 e80.5 ± 0.3 c0.90 ± 0.01 d9.73 ± 0.05 c
N117.71 ± 0.26 c0.443 ± 0.006 c0.292 ± 0.010 c0.532 ± 0.036 c6.01 ± 0.21 d7.28 ± 0.23 d82.6 ± 0.4 b1.29 ± 0.03 c11.32 ± 0.44 b
N218.74 ± 0.57 b0.447 ± 0.006 bc0.382 ± 0.018 b0.631 ± 0.039 b7.10 ± 0.04 c8.56 ± 0.09 c82.9 ± 0.6 b1.60 ± 0.03 b11.28 ± 0.64 b
N320.18 ± 0.42 a0.470 ± 0.010 a0.401 ± 0.010 b0.640 ± 0.031 b8.48 ± 0.68 b10.00 ± 0.65 b84.8 ± 1.3 a2.02 ± 0.09 a13.25 ± 0.67 a
N416.52 ± 0.24 d0.467 ± 0.012 ab0.453 ± 0.005 a0.764 ± 0.035 a10.01 ± 0.09 a11.70 ± 0.11 a85.6 ± 0.2 a1.93 ± 0.01 a13.12 ± 0.49 a
HIPJN015.71 ± 0.27 d0.403 ± 0.006 c0.246 ± 0.005 d0.546 ± 0.026 d3.71 ± 0.05 d4.91 ± 0.06 d75.7 ± 0.5 b0.77 ± 0.01 e6.81 ± 0.25 c
N116.51 ± 0.12 c0.440 ± 0.010 b0.424 ± 0.007 c0.653 ± 0.032 c6.64 ± 0.09 c8.15 ± 0.05 c81.4 ± 0.6 a1.35 ± 0.01 d10.18 ± 0.4 a
N219.21 ± 0.28 b0.453 ± 0.006 b0.474 ± 0.013 b0.744 ± 0.016 c7.67 ± 0.04 b9.34 ± 0.07 b82.1 ± 0.2 a1.79 ± 0.01 c10.3 ± 0.17 a
N320.58 ± 0.14 a0.477 ± 0.006 a0.519 ± 0.012 b0.877 ± 0.061 b8.51 ± 0.28 b10.39 ± 0.22 b82 ± 0.9 a2.14 ± 0.06 a9.73 ± 0.54 ab
N416.12 ± 0.43 cd0.480 ± 0.010 a0.588 ± 0.003 a1.102 ± 0.020 a9.77 ± 0.33 a11.94 ± 0.31 a81.8 ± 0.7 a1.92 ± 0.01 b8.86 ± 0.14 b
CV9.5313.6132.1743.2232.6331.033.3131.7835.59
All data were presented as mean ± SE. CV: the coefficient of variation. Different letters for every five N levels in each genotype and year denoted significant difference according to one-way ANOVA analysis followed by Tukey’s multiple comparison test.
Table 4. Effect of N levels on grain P components (phytic acid, inorganic phosphorus, total phosphorus, and PA-P/TP) in the detached panicle culture system.
YearGenotypeN LevelPA Concentration
mg kg−1
Pi Concentration
mg g−1
TP Concentration
mg kg−1
PA-P/TP
2015XS110N07.87 ± 0.18 a0.28 ± 0.01 c2.50 ± 0.06 b88.6 ± 0.2 a
N17.42 ± 0.11 ab0.29 ± 0.02 c2.39 ± 0.05 bc87.6 ± 0.8 a
N27.19 ± 0.07 bc0.33 ± 0.01 b2.36 ± 0.02 bc85.7 ± 0.3 b
N36.83 ± 0.31 c0.37 ± 0.01 b2.29 ± 0.09 c83.7 ± 0.5 c
N47.68 ± 0.12 a0.59 ± 0.01 a2.75 ± 0.04 a78.6 ± 0.3 d
HIPJN06.12 ± 0.24 a1.04 ± 0.03 b2.76 ± 0.09 b62.4 ± 0.7 ab
N16.06 ± 0.38 a1.00 ± 0.06 b2.71 ± 0.05 b62.9 ± 2.9 a
N24.95 ± 0.24 b1.02 ± 0.07 b2.41 ± 0.14 c57.8 ± 0.6 abc
N34.45 ± 0.05 b1.09 ± 0.13 b2.35 ± 0.12 c53.5 ± 3.3 c
N46.20 ± 0.18 a1.32 ± 0.02 a3.07 ± 0.05 a56.9 ± 1 bc
2016XS110N07.67 ± 0.22 a0.36 ± 0.01 c2.52 ± 0.06 ab85.8 ± 0.6 a
N17.91 ± 0.21 a0.35 ± 0.01 c2.58 ± 0.06 a86.5 ± 0.5 a
N26.78 ± 0.16 b0.36 ± 0.01 c2.27 ± 0.04 c84.2 ± 0.7 b
N36.56 ± 0.09 b0.42 ± 0.01 b2.26 ± 0.03 c81.5 ± 0.3 c
N46.71 ± 0.33 b0.47 ± 0.01 a2.36 ± 0.10 bc80.1 ± 0.6 c
HIPJN06.31 ± 0.31 a0.68 ± 0.01 d2.46 ± 0.08 b72.3 ± 1.2 a
N15.84 ± 0.13 b0.87 ± 0.03 c2.51 ± 0.04 b65.5 ± 1.1 b
N25.64 ± 0.03 bc0.94 ± 0.02 bc2.53 ± 0.03 b62.9 ± 0.4 b
N34.32 ± 0.11 d1.03 ± 0.11 b2.25 ± 0.13 c54.2 ± 2 c
N45.38 ± 0.03 c1.27 ± 0.02 a2.79 ± 0.03 a54.3 ± 0.4 c
CV16.9151.128.6318.2
Note: Pi: inorganic phosphors; TP: total phosphorus, PA-P/TP: the ratio of phytic acid phosphorus to total phosphorus. All data were presented as mean ± SE. CV: the coefficient of variation. Different letters for every five N levels denoted significant differences according to one-way ANOVA analysis followed by Tukey’s multiple comparison test.
Publisher’s Note: MDPI stays neutral with regard to jurisdictional claims in published maps and institutional affiliations.

