
Effect of Potassium (K) Supply on Cannabinoids, Terpenoids and Plant Function in Medical Cannabis

1
Institute of Soil Water and Environmental Sciences, Volcani Center, 68 HaMaccabim Road, P.O. Box 15159, Rishon LeZion 7505101, Israel
2
The Robert H. Smith Faculty of Agriculture, The Hebrew University of Jerusalem, Rehovot, Israel
*
Author to whom correspondence should be addressed.
Agronomy 2022, 12(5), 1242; https://0-doi-org.brum.beds.ac.uk/10.3390/agronomy12051242
Submission received: 18 December 2021
/
Revised: 27 April 2022
/
Accepted: 28 April 2022
/
Published: 23 May 2022
(This article belongs to the Special Issue Feature Papers on Medicinal and Aromatic Plants)
Abstract
:We have demonstrated in previous studies that the essential macro-nutrients nitrogen (N) and phosporous (P) have profound effects on the production of cannabinoids and terpenoids in the cannabis plant. The present study was undertaken to evaluate the hypothesis that potassium (K) supply, which is known to substantially affect plant development and function, affects the secondary metabolism of the cannabis plant. Two cultivars of medical cannabis were grown in controlled environment conditions, under five levels of K supply: 15, 60, 100, 175, and 240 mg L−1 K. The results revealed that the development and function of plants that received the low K supply of 15 mg L−1 K were impaired, as the plants suffered from visual chlorosis, and the inflorescence yield was reduced in both cultivars. Plants that received higher K inputs in the range of −175 mg L−1 K demonstrated optimal plant function and high yield, and one cultivar demonstrated over-supply symptoms under the high K level of 240 mg L−1. The concentrations of most cannabinoids and terpenoids declined with the elevation of K supply, thus supporting the hypothesis. As secondary metabolite concentrations decreased with the increase in K supply, and higher K levels had no positive effects, 60 mg L−1 K is the suggested application level to maintain high function and yield combined with high secondary metabolism.
Keywords:
cannabis; cultivation; development; fertilizer; fertilization; growth; nutrition; potassium; deficiency; cannabinoid; terpenoid1. Introduction
The global increase in the legalization of cannabis (Cannabis sativa L.) for medical or recreational use [1,2] has increased the demand for cannabis products worldwide [2,3]. The increasing interest in medical cannabis is accompanied by newly attained research-based knowledge regarding the many therapeutic properties of this unique plant, and a better understanding of its potential impacts on the human body [4,5,6]. The therapeutic activity of cannabis is based on the production of hundreds of biologically active secondary metabolites in the plant inflorescence, including terpenoids, flavonoids, and cannabis-distinct cannabinoids [7,8]. Recent studies have demonstrated the significant effects of two major plant macronutrients, N and P, on medical cannabis function and yield, and on the cannabinoid and terpenoid profiles of the plant [9,10]. Hence, there is an urgent need to study the effects of other plant macronutrients, such as potassium (K), on plant function and secondary metabolism.
Potassium is an essential plant nutrient that is required by plants in relatively high amounts, and takes part in many key physiological processes [11,12,13]. Processes affected by K supply include stomatal regulation, protein synthesis, photosynthesis, enzyme activation, osmoregulation, and the uptake and accumulation of other essential cations such as Ca and Mg [14,15,16,17,18]. In addition to its involvement in the regulation of plant primary metabolism, K is known to have a considerable impact on the secondary metabolism of plants, and is therefore considered as a ‘quality element’ [12,19,20]. As K is known to affect a wide range of secondary metabolites in plants, including phenolic compounds [21,22], flavonoids [23,24], carotenoids [20,25], and organic acids [26,27], we hypothesized that it has potential to regulate the production of medical compounds in Cannabis sativa.
Very little information is available about the effect of K nutrition on Cannabis sativa, and available information is mainly for cannabis genotypes grown in the field for fiber or seed production, i.e., industrial hemp genotypes, rather than ‘drug-type’ medical types. Finnan and Burke [28] found no significant relationship between K supply and stem (fiber) yield of hemp, although K accumulation in the plant was elevated with increased supply, suggesting the over-accumulation of K. Limited or no effect of K availability on seed and fiber yield and on the plant growth of hemp has been demonstrated by other studies as well [29,30,31]. Regarding the plant’s secondary metabolism, a survey conducted several decades ago on wild populations of hemp found a correlation between K deficiency and high Δ9-tetrahydrocannabinol (THC) content [32].
Two recent studies have examined the response of medical cannabis cultivars to K supply [16,33]. We reported that, at the vegetative growth phase, low K levels of 15 mg L−1 (ppm) caused growth retardation and visual deficiency symptoms in two medical cannabis cultivars, induced by impaired water relations, transpiration, and carbon fixation [16]. The response to K supply at the vegetative growth phase varied slightly between the two cultivars [16]. Despite the significant competition for root uptake between K, Ca and Mg, the results suggested that a supply of 175–240 mg L−1 K is optimal for medical cannabis production at the vegetative growth phase [16]. In a mock aquaponic system, the addition of K (up to 75–113 mg L−1) at the reproductive growth phase increased inflorescence yield but did not influence plant growth [33]. Since no study has examined the effects of K nutrition on cannabinoid and terpenoid production in medical cannabis, these effects remain unknown.
In recent years, an increasing number of studies have evaluated the influence of mineral nutrition on medical cannabis cultivation, and significant progress has been made in our understanding of the nutritional requirements of medical cannabis [9,10,34,35,36,37,38]. Shiponi and Bernstein [33] reported that P supply has a considerable effect on development, morpho-physiology and the translocation of nutrients in the cannabis plant at the vegetative [33] and the reproductive phases of plant growth [9]. A wide optimum range for P input was identified for both growth phases, with a minimum requirement of 15 mg L−1 P and a recommended application of 30 mg L−1 for the vegetative phase [33]. For the reproductive phase, 30–90 mg L−1 P was within the optimal range for plant development and function, and 30 mg L−1 P was sufficient for producing 80% of the maximum yield [9]. Genetic differences in the response of medical cannabis cultivars to P supply were identified at the vegetative growth phase [36]. Nitrogen supply substantially affected the physiological, developmental, and metabolic performances of medical cannabis at the vegetative and the reproductive growth phases, with optimal function, biomass, and yield production obtained under 160 mg L−1 N [9,34]. At the reproductive phase of growth, low inputs of N and P promoted cannabinoid and terpenoid production, and increasing N and P supply generally decreased the plant’s secondary metabolism [9,10]. Furthermore, the N form supplied to the plant, represented by NH4/NO3 ratio, was reported to have a significant effect on plant function, with optimal plant performance, yield, and secondary metabolism achieved under solely NO3 nutrition. Ratios containing over 50% NH4 induced significant toxicity [35]. The supplementation of humic acids or NPK was found to induce changes in cannabinoid production [37]. A response surface analysis to different NPK combinations demonstrated increased inflorescence yield under elevated N and P supply, but there was no yield response to K supply [38].
In addition to mineral nutrition, recent studies have shown that other environmental factors such as light spectra [39,40], UV-B supplementation [41,42], the rootzone system [43], NaCl-induced stress [44], and the manipulation of the plant architecture [45] can also affect the cannabinoid profile of the plant. Moreover, it has been demonstrated that there is a cross-link between the physiological, morphological, and chemical properties of medical cannabis and the plant organ and plant height [46].
Due to the known significant effects of K nutrition on crop quality and plant secondary metabolism, and the knowledge gap regarding the impact of K nutrition on medical cannabis, the present work studied the response of the plants to K supply under a short photoperiod. The hypothesis guiding the workplan was that an increase in K supply would induce changes to the plant secondary metabolism, and to its morpho-physiology at the regenerative growth phase. To evaluate the hypothesis, we examined the metabolic, physiological, and chemical responses of the plants to five levels of K supply (15, 60, 100, 175, and 240 mg L−1 (ppm) K) at the reproductive growth stage. Genotypic sensitivity to the response was assessed by a comparative analysis of the response of two medical cannabis genotypes to the K inputs. The results of this study will aid in the optimization of the secondary metabolite profile of Cannabis sativa, and enable a deeper understanding of the plant’s nutritional requirements, which are of great value to the fast-developing medical cannabis industry worldwide.
2. Materials and Methods
2.1. Plant Material and Growing Conditions
The medical cannabis (Cannabis sativa L.) cultivars ‘Royal medic’ (RM) and ‘Desert queen’ (DQ) (Teva Adir LTD, Israel) were used as a model system in this study. They represent two distinct chemotypes: a balanced THC: CBD (cannabidiol) concentration (about 5%; RM), and a high THC level (DQ). Plants were propagated from cuttings taken from the top of the primary branches of genetically identical mother plants and grown in a controlled environment growing room under a 18/6 h light/dark photoperiod. The cuttings were rooted in coconut fiber plugs (Jiffy international AS, Kristiansand, Norway) and placed in the mother plant room until rooting. Rooted cuttings, selected for uniformity, were planted in 3 L plastic pots in perlite 2-1-2 (Agrekal, Habonim, Israel). Perlite was used as the growing media as it is a relatively inert media, which is therefore often used for mineral nutrition studies. After planting, for 17 days, the plants received a uniform K fertilization treatment as was found optimal for the vegetative stage of growth in our previous study [16], i.e., 175 mg L−1 K. At this stage, the plants were grown under a 18/6 h light/dark photoperiod using Metal Halide bulbs (400 μmol m−2 s−1, Solis Tek Inc., Carson, CA, USA) in a controlled environment growing room. After 17 days of vegetative growth, the plants were randomly divided into five treatments of increasing K supply: 15, 60, 100, 175 and 240 mg L−1 K, with five plants per treatment. From this stage until the end of the experiment at harvest, which lasted an additional 51 days for DQ and 74 days for RM (until maturation for each variety), the plants were grown under a 12:12 h light/dark photoperiod using High Pressure Sodium bulbs (980 μmol m−2 s−1, Greenlab by Hydrogarden, Petah Tikva, Israel). Temperature in the growing room was 28 and 25 °C day/night, and the relative humidity was 43% and 73%, respectively. Irrigation was supplied via 1 L h−1 discharge-regulated drippers (Netafim, Tel-Aviv, Israel), with one dripper per pot. The volume of irrigation in each irrigation pulse was 330–830 ml/pot/day, set to allow 30% of drainage. Fertilizers were supplied by fertigation, i.e., dissolved in the irrigation solution at each irrigation. The irrigation solution contained (in mM): 14.3 N-NO3−, 1.7 N-NH4+, 1.9 P-PO42−, 2.15 Ca2+, 2.13 Mg2+, 1.64 Na+, 0.33 Cl−, 0.03 Fe2+, 0.01 Mn2+, 0.009 B3+, 0.004 Zn2+, 0.001 Cu2+, and 0.0003 Mo2+; and increasing concentrations of K+: 0.38, 1.53, 2.56, 4.48 and 6.14 mM K+. Zinc, Cu, and Mn were supplied chelated with EDTA, and Fe as chelated with EDDHSA. Mo and B were added as a part of the fertilizers Bar-Koret and B-7000, respectively (Israel chemicals, Tel-Aviv, Israel). The irrigation solution was supplied from the final solutions, i.e., premixed individually for each treatment. The irrigation solution was prepared using distilled water, and the irrigation and leachate solutions were routinely monitored once a week throughout the experiment. Potassium concentration in the irrigation solutions was stable throughout the experiment duration (Figure S1 Supplemental). The pH of the irrigation solutions ranged from 5.4 to 6.2, and the electric conductivity (EC) of the irrigation solutions was 1.6–2.3 mS cm−1 (data not shown). Analysis of the leachate solutions revealed that the pH values of the leachate were not significantly different from the irrigation solution values, but the EC of the leachate was higher by 17–50%, compared to the irrigation solutions (data not shown). The experiment was arranged in a complete randomized design. All measurements were conducted for five replicated plants and results are presented as averages ± standard error (S.E.).
2.2. Plant Biomass, Inorganic Mineral Analysis, and Potassium Use Efficiency
Sampling of plant materials for the determination of fresh and dry plant biomass, and for the analyses of concentrations of inorganic minerals in the plant material, were conducted by destructive sampling at the termination of the experiment, 74 and 51 days after the transition to the short-day photoperiod for RM and DQ, respectively, following Saloner and Bernstein [9]. The plants were divided into roots, stems, fan leaves, trimmed inflorescences, and trimmed inflorescence leaves. Sample processing, and inorganic mineral analysis procedures were conducted, as detailed in Saloner and Bernstein [9]. Potassium use efficiency (KUE) was calculated as the total dry weight of the inflorescence, divided by the cumulative amount of K (g/plant) supplied to the plant throughout the experiment duration.
2.3. Physiological and Morphological Parameters
The plants were sampled for physiological analyses 23 days after the transition to the 12/12 h light/dark photoperiod. The youngest mature fan leaf on the main stem, located at the 4th node from the top of the stem, was used for the analyses. Determination of osmotic potential, membrane leakage, photosynthetic pigments, and relative water content (RWC) were performed as described by Saloner et al. [16]. Net photosynthesis rate, transpiration rate, stomatal conductance, and intercellular CO2 concentration were measured with a Licor 6400 XT system (LI-COR, Lincoln, NE, USA). The youngest mature fan leaf on the plant’s youngest branch, located on the fourth node down the plant’s top, on the fourth node of the branch, was used for the analyses. The leaves were exposed to 400 PPFD and 400 mg CO2 L−1, the temperature was kept at 25 °C, and relative humidity ranged between 40% and 55%. Intrinsic water use efficiency (WUEi) was calculated from the photosynthesis and stomatal conductance results [34].
The morphological parameters that are presented in the Supplemental data file (stem diameter, plant height, the number of nodes on the main stem, and inflorescence length) were measured 9 days before harvest (65 and 42 days after the transition to the 12/12 h light/dark photoperiod for the cultivars RM and DQ, respectively). The measurements were conducted as described by Saloner and Bernstein [9]. The values presented for the inflorescence length results (Figure S1 Supplemental) are the average length of the apical (top) inflorescence of the main stem (primary inflorescence) and the apical inflorescence of the lowest first-order (side) branch on the main stem (secondary inflorescence).
2.4. Cannabinoids and Terpenoids Analyses
For the quantification of cannabinoid and terpenoid concentration, the top (primary) and side (secondary) inflorescences were harvested at the termination of the experiment, 74 and 51 days after the transition to the short-day photoperiod for the cultivars RM and DQ, respectively, when about 40% of the trichomes were of amber color. The plant materials were harvested, trimmed, dried and prepared for analysis, as detailed by Saloner and Bernstein [9].
For cannabinoid analysis, the dried inflorescences and the dried trimmed inflorescence leaves were ground manually. Sample handling, plant extraction, and the analysis of cannabinoid concentrations in the filtered plant extracts (by HPLC; Jasco 2000 Plus series, Easton, MD, USA) were conducted following Saloner and Bernstein [9]. The calculation of cannabinoid concentrations was based on analytical standards: cannabichromene (CBC), cannabichromenic acid (CBCA), cannabigerol (CBG), cannabigerolic acid (CBGA), cannabinol (CBN), cannabidiol (CBD), cannabidiolic acid (CBDA), cannabicyclol (CBL), cannabidivarin (CBDV), cannabidivarinic acid (CBDVA), tetrahydrocannabivarinic acid (THCVA) (Sigma-Aldrich, Germany), tetrahydrocannabinolic acid (THCA), Δ9-tetrahydrocannabinol (THC), and tetrahydrocannabivarin (THCV) (Restek, Pennsylvania, USA). The R2 values for the linear regressions of the calibrations curves of all cannabinoid standards were >0.994 [9]. Concentrations of THCV, CBDV, CBN, CBL, and CBCV were lower than the detection limits. Cannabichromene (CBC) concentration was in the range of 0.1−0.01% and was generally not affected by K supply (data not shown).
For terpenoid analysis, 100 mg of dried plant material was ground in liquid N2 to a fine powder. The extraction of volatile compounds from the plant material, the analysis of cannabinoid concentrations in the filtered plant extracts (by a GC-MSD system, model 6890 N/ 5973 N, Agilent Technologies CA, USA), compound identification, and the calculation of the amount of the compound in the sample were conducted as described by Saloner and Bernstein [9].
2.5. Statistical Analyses
The experiments were conducted following a random experimental design, with 5 treatments and 5 replicated plants per treatments. All measurements were conducted with 5 replications following the experimental design. The data were subjected to a two-way ANOVA, followed by Tukey’s HSD post hoc test. The statistical analysis was performed with the Jump software, version 15 (SAS 2015, Cary, NC, USA).
3. Results
3.1. Plant Morphology and Visual Appearance
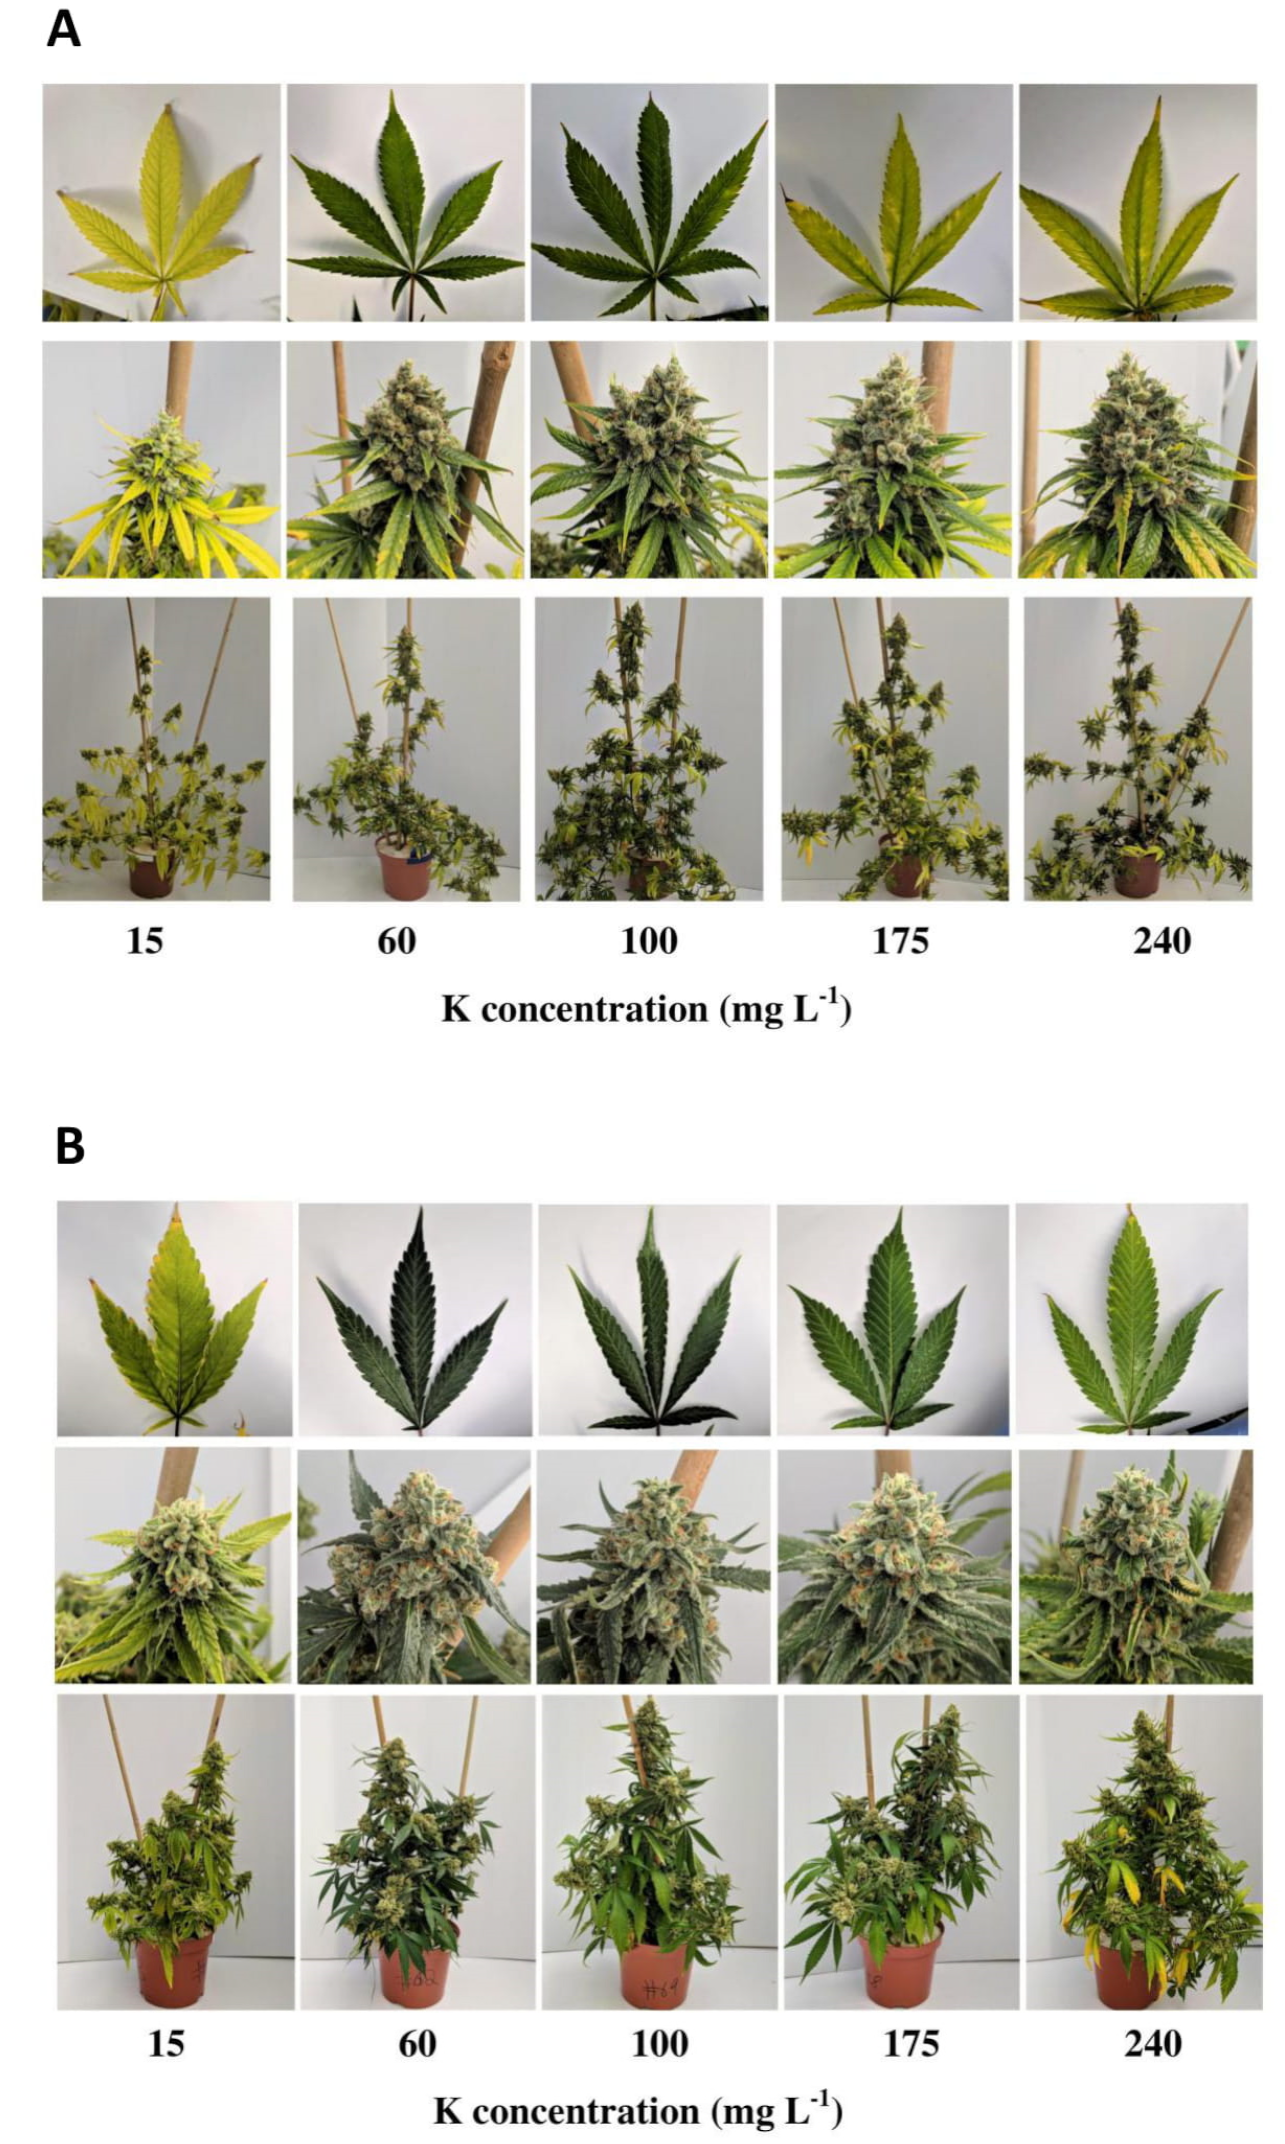
Potassium nutrition induced significant changes in the plants’ visual appearance (Figure 1), but had only a minor impact on morphology (Figure S2 Supplemental). In the cultivar RM, plants that received the lowest K treatment of 15 mg L−1 K demonstrated significant chlorosis, and were significantly smaller than the plants that received the highest K level of 240 mg L−1 K (Figure 1A; Figure S2 Supplemental). The plants that received 60–100 mg L−1 K demonstrated optimal visual appearance and green tissue. Higher K input (175–240 mg L−1 K) induced moderate chlorosis, mainly of the older leaves (Figure 1A). The number of nodes on the main stem and inflorescence length were not affected by K supply, whereas the diameter of the stem was larger under 240 mg L−1 K than all other treatments (Figure S1 Supplemental). Plants of the cultivar DQ demonstrated similar visual characteristics as RM, with a slightly wider optimal range for K; the best appearance was obtained under 60–175 mg L−1 K, and lower or higher K inputs induced moderate chlorosis (Figure 1A). Other than that, K supply had but a small impact on DQ morphology, as plant height, the number of nodes on the main stem, and stem diameter were unaffected by K supply, and only the inflorescence length was significantly smaller under 15 mg L−1 K, compared with the higher K supply of 100–175 mg L−1 K (Figure S2 Supplemental). It should be noted that the two tested cultivars differ in growth morphology. RM has a relatively tall, woody, and un-dense natural structure, while DQ has relatively short internodes, and a small and dense natural structure, causing a significant difference in their appearance and their growth abilities (Figure 1). As a result of the long structure of RM, when the RM plants were removed at the termination of the experiment from the branch support system for the sake of photography, some of the lateral branches bent down and did not remain erect (Figure 1).
3.2. Plant Growth, Biomass Accumulation, and Potassium Use Efficiency
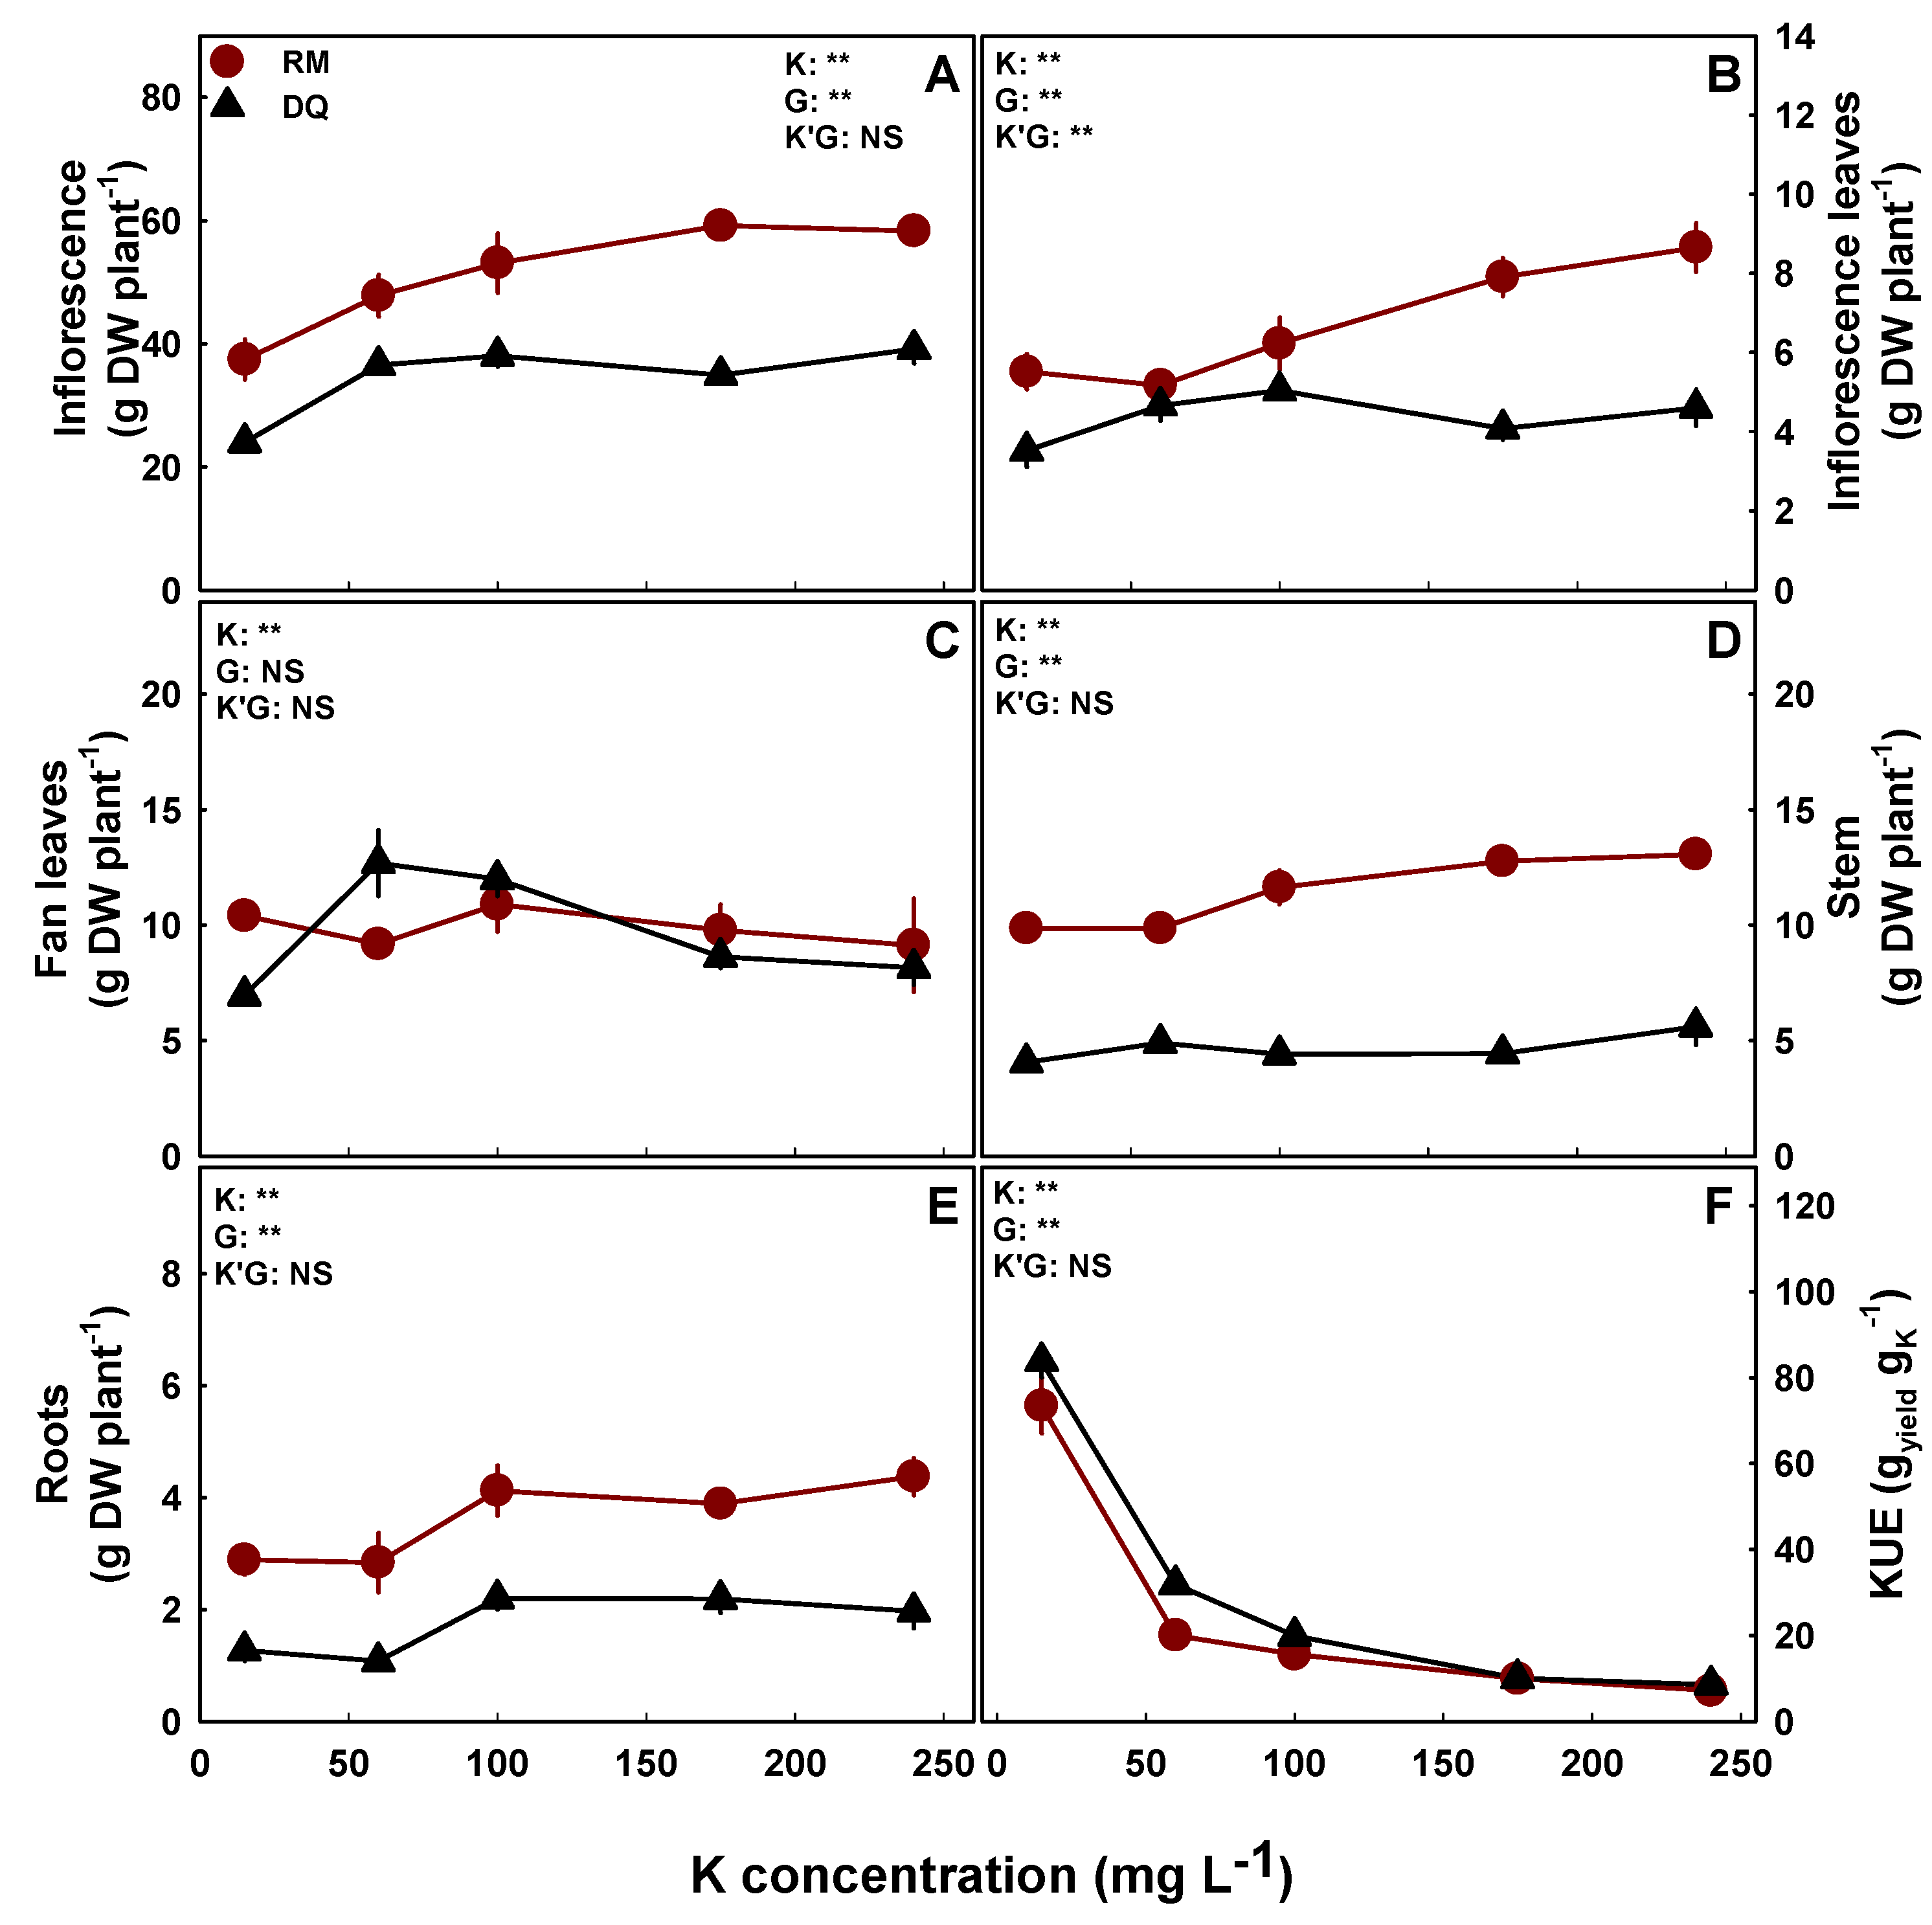
Although K nutrition induced only minor effects on plant morphology, plant growth and biomass accumulation, some significant trends, as well as genotype specificities, were obtained (Figure 2). In general, growth, biomass accumulation, and yield production were lowest under the low K treatment of 15 mg L−1 K, and were not substantially influenced at the range of 60–240 mg L−1 K (Figure 2). Specifically, yield production, i.e., inflorescence biomass, presented similar trends for both cultivars, with lower yields obtained under 15 mg L−1 K, compared with the higher K treatments of which no significant difference in yield production was obtained (Figure 2A). The root biomass of both cultivars and the stem biomass in RM were higher under 100–240 mg L−1 K than under lower K inputs; in DQ fan leaves, the biomass response demonstrated a maximum curve with a peak at 60–100 mg L−1 K (Figure 2C,E). Inflorescence leaves demonstrated a genotype-specific response; their biomass was highest under 175–240 mg L−1 K in RM, while in DQ, it was not affected significantly by K supply (Figure 2B). The biomass of the fan leaves in RM and the stem in DQ were not affected by K supply (Figure 2C,D). Since yield accumulation was not substantially increased as K supply was elevated, K use efficiency decreased significantly with the increase in K supply (Figure 2F).
3.3. Cannabinoid and Terpenoid Profiles
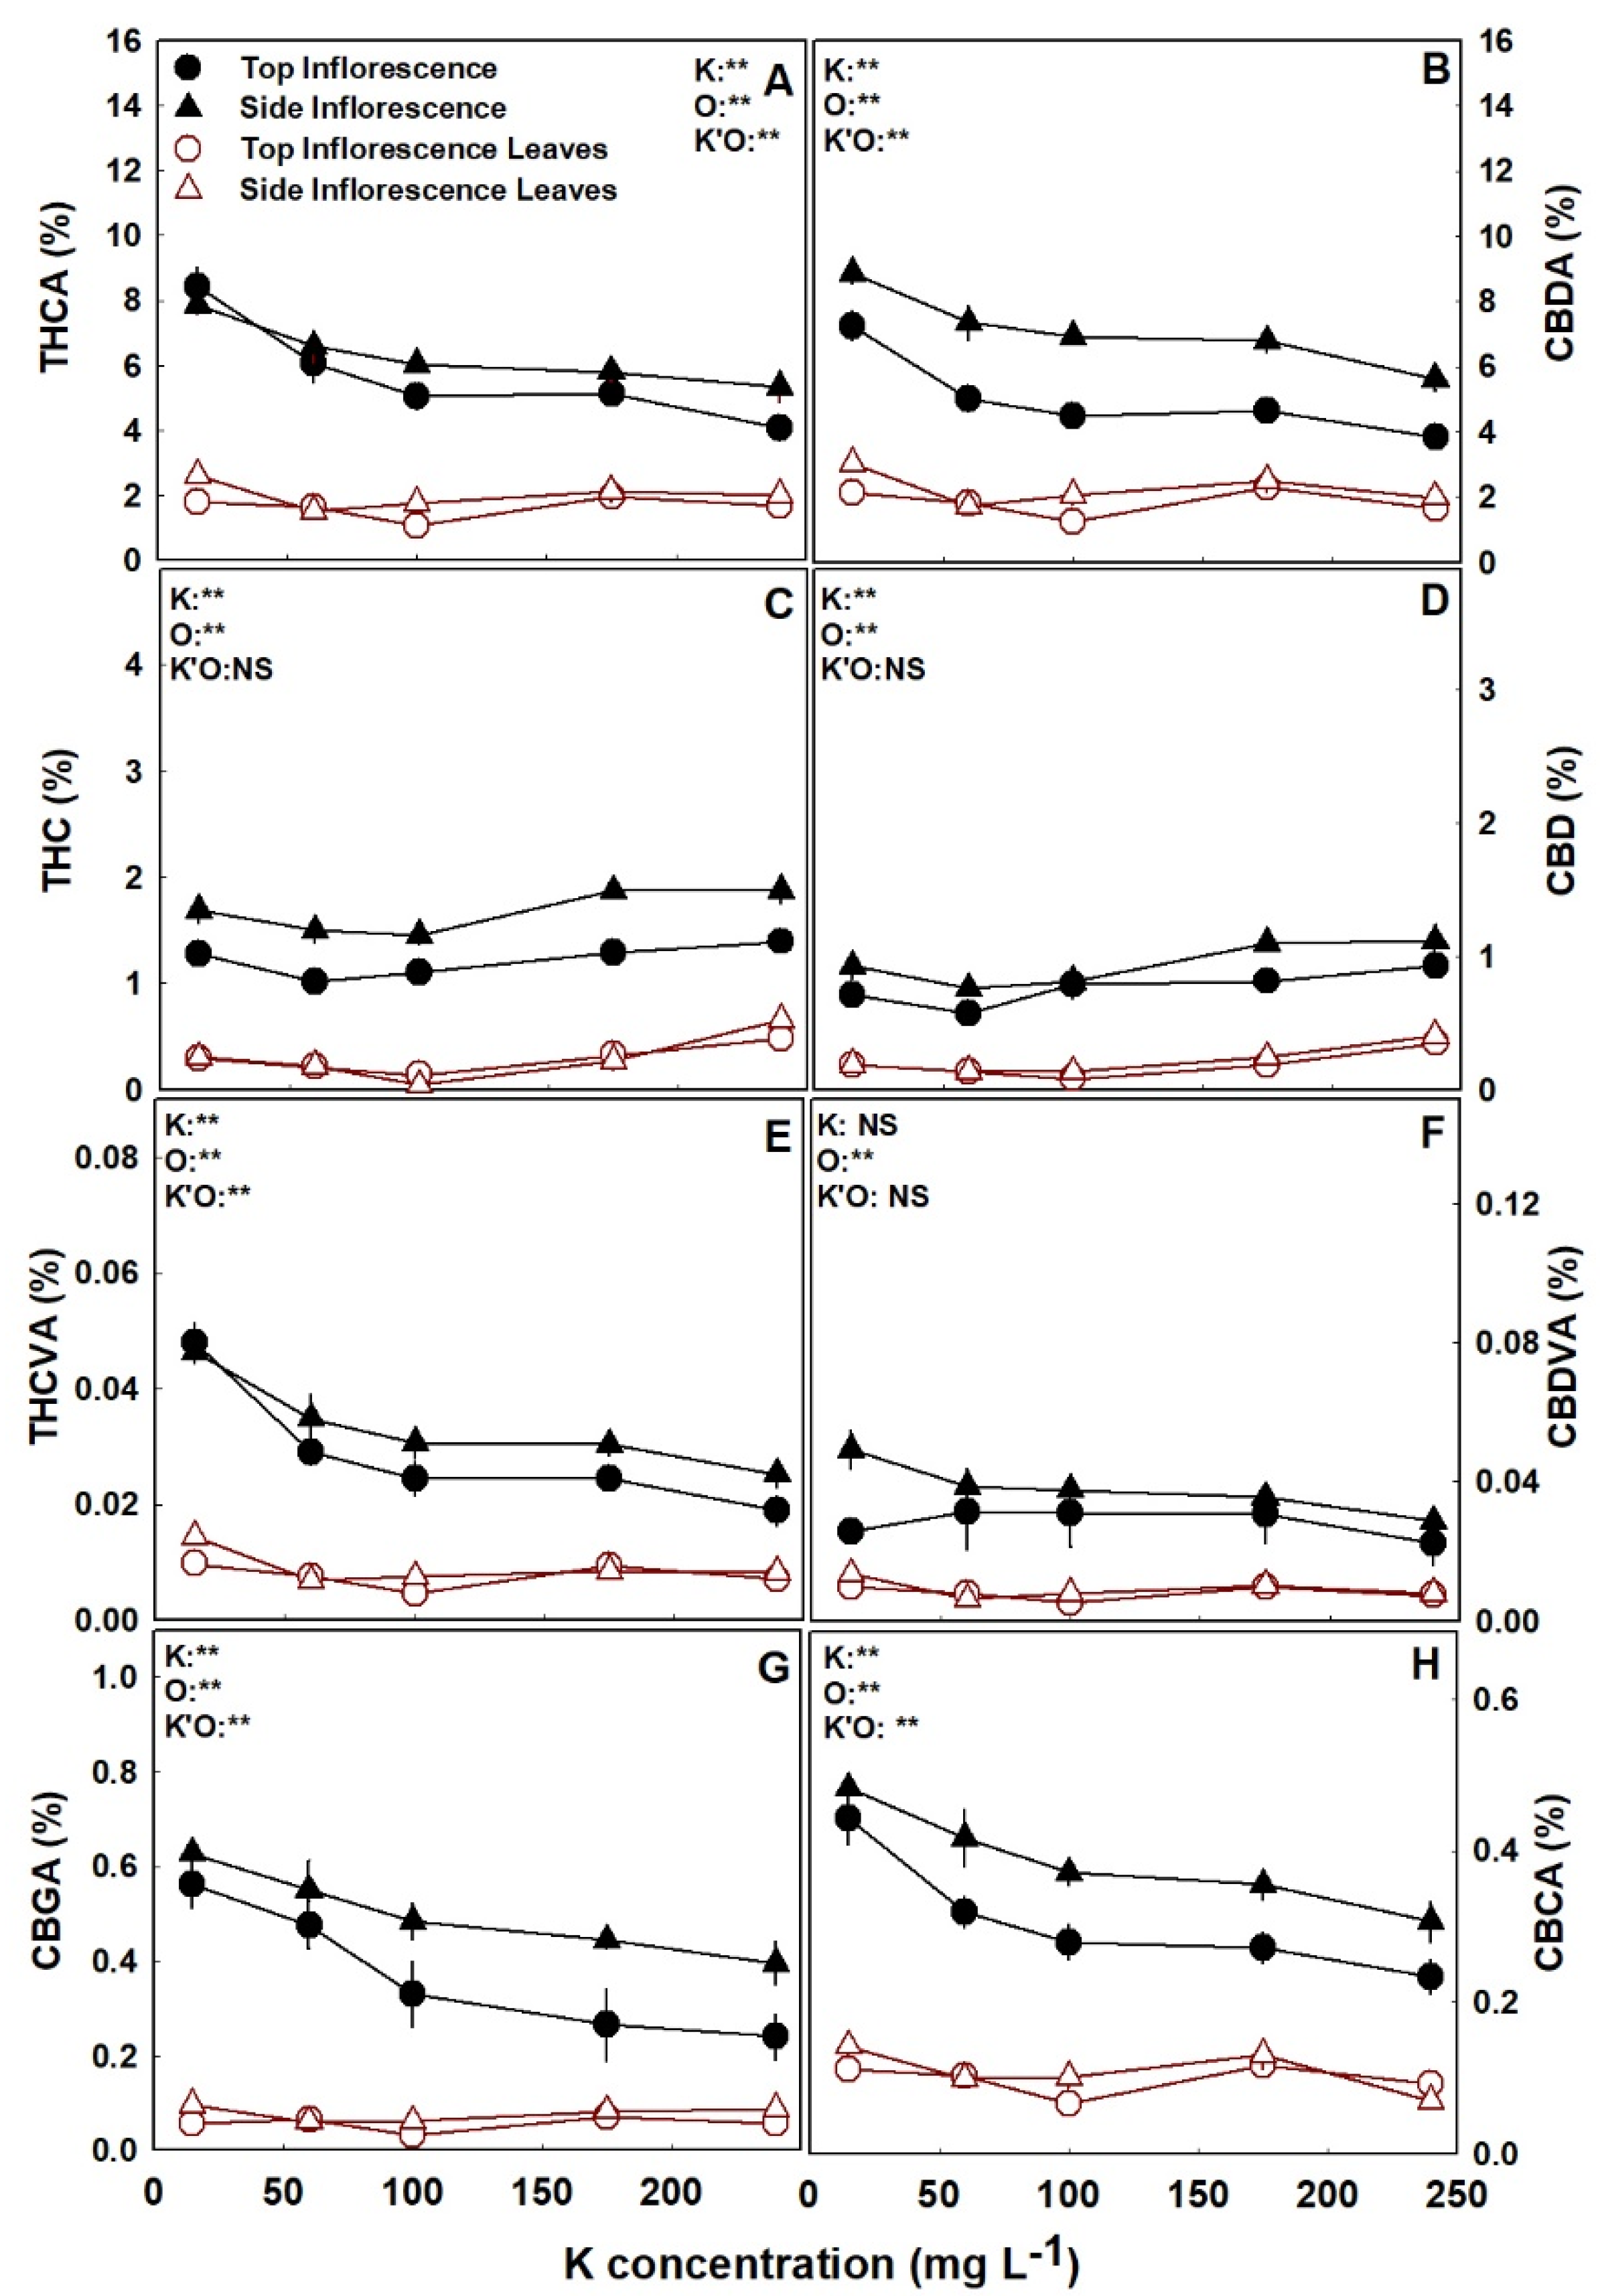
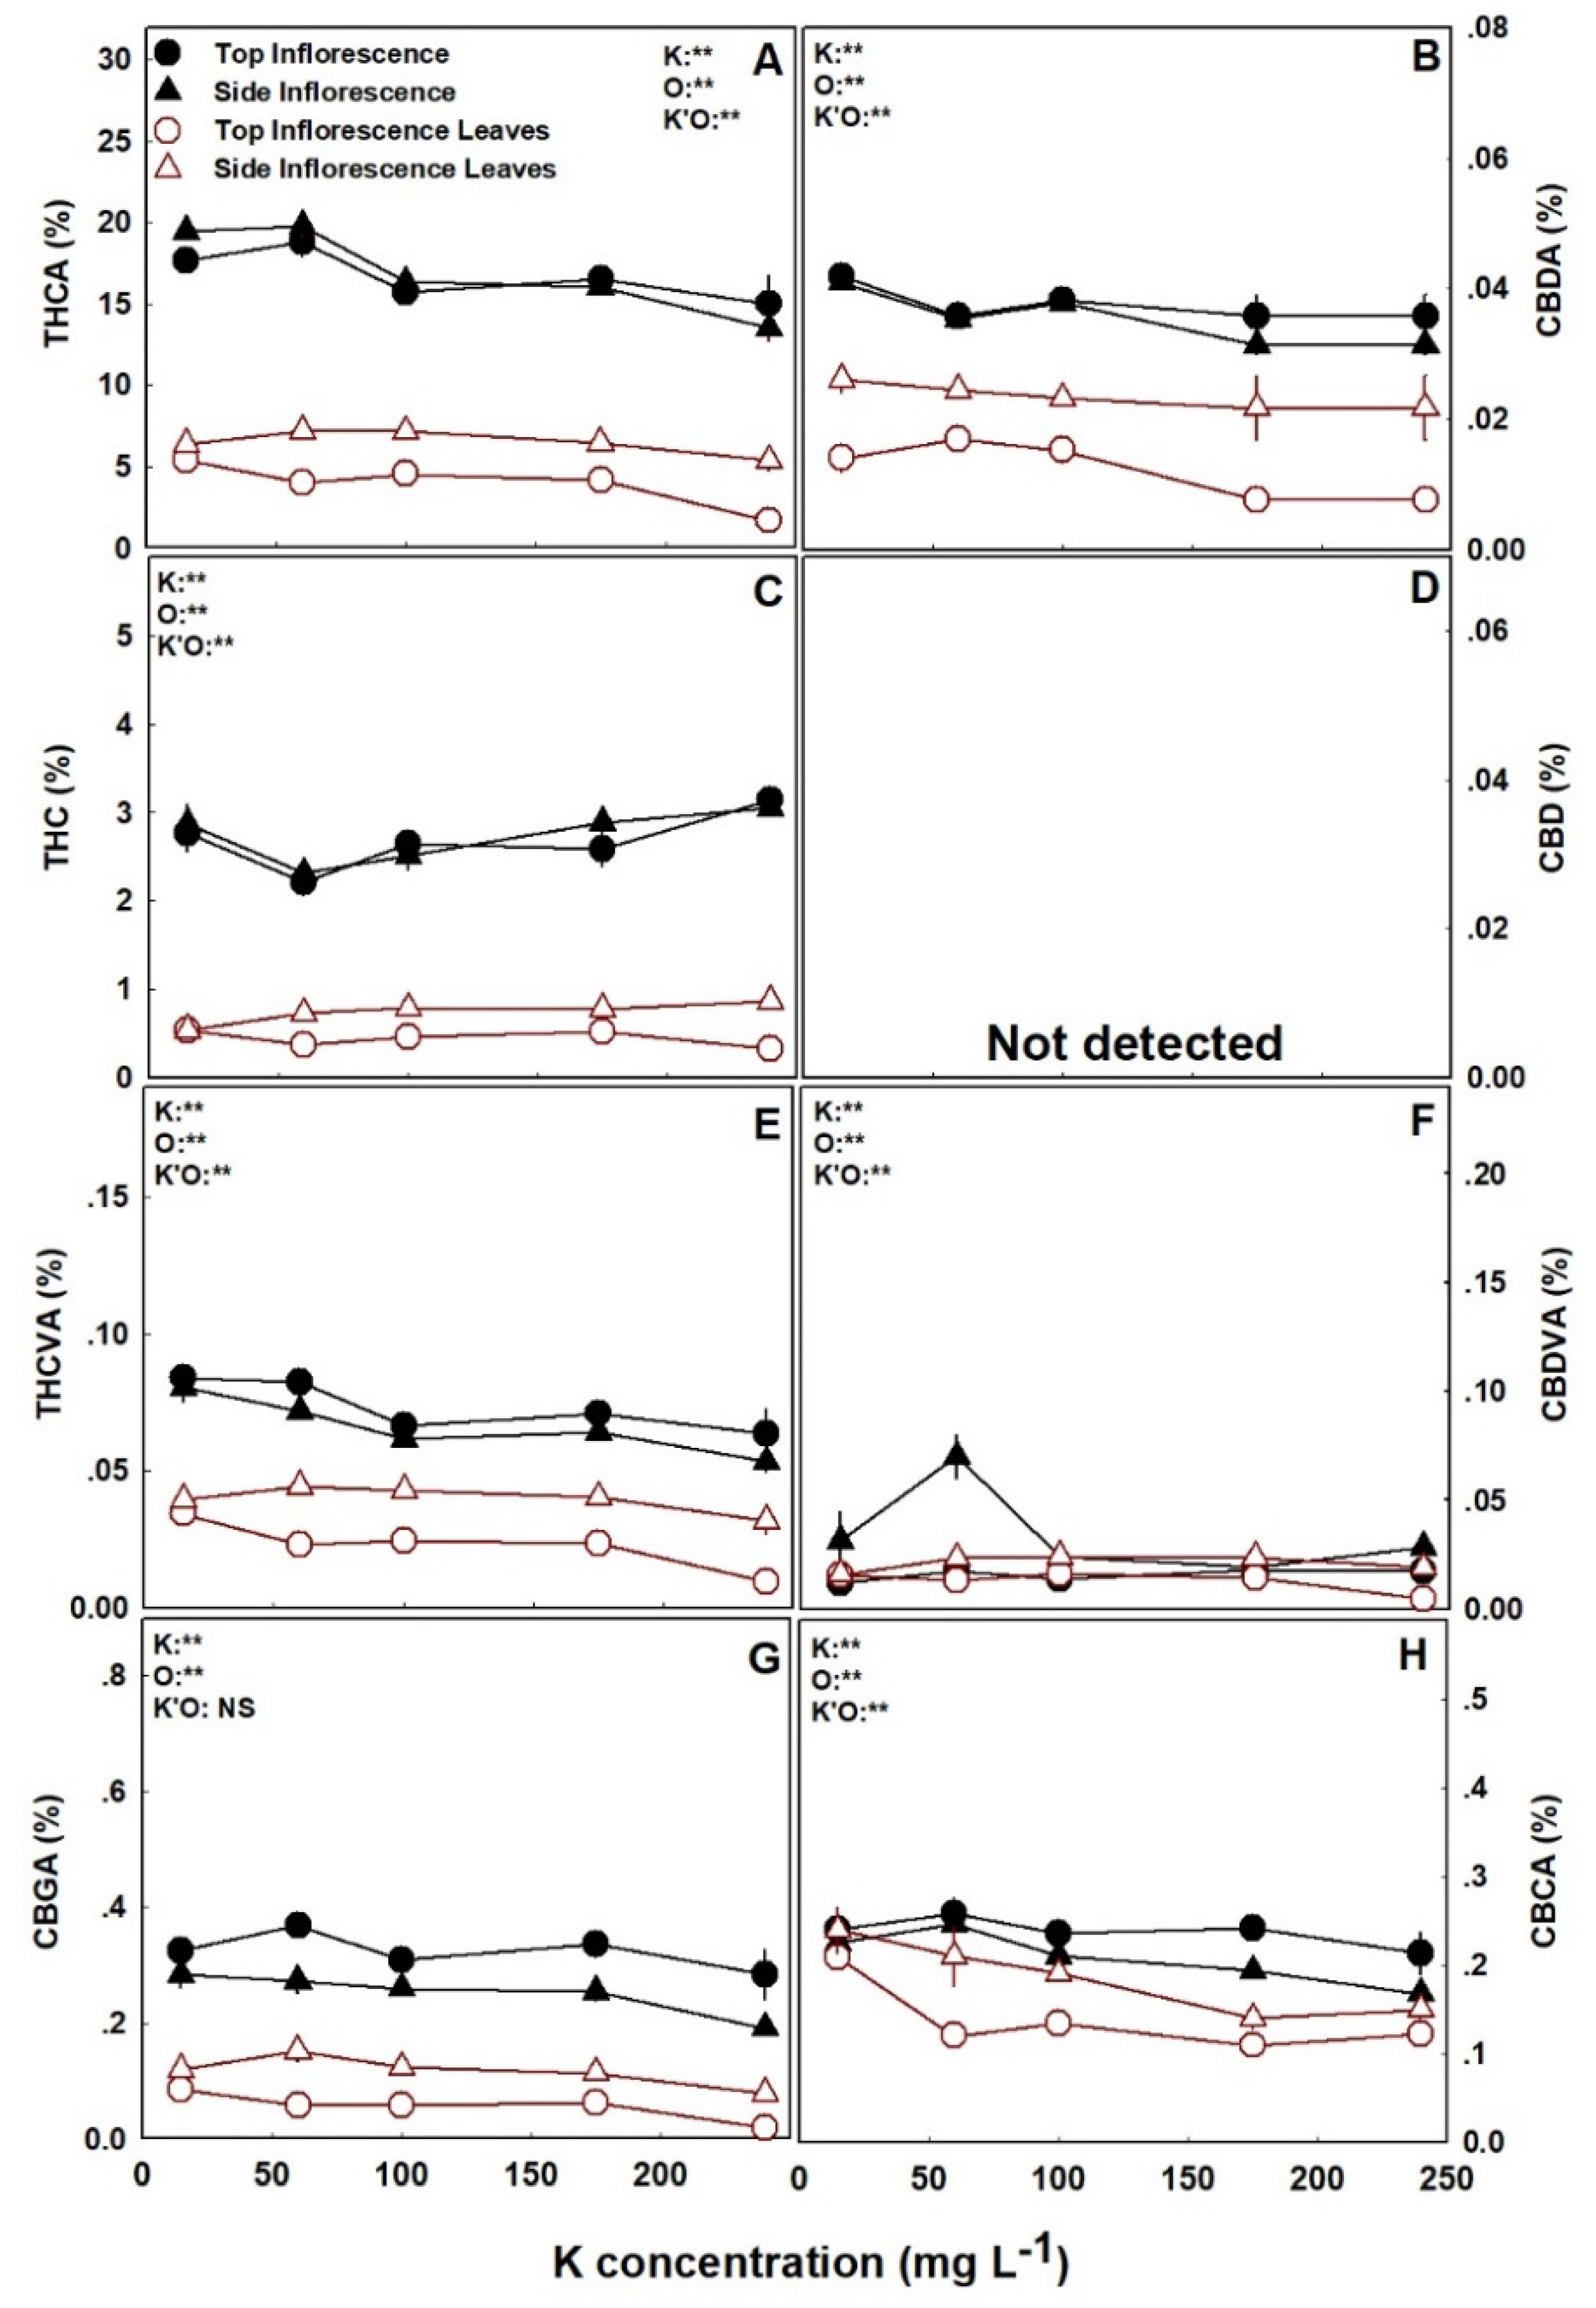
The cannabinoid profiles of the plants were influenced by K nutrition, and demonstrated cannabinoid and organ specificity, as not all cannabinoids and organs were affected, or affected similarly (Figure 3 and Figure 4). Several significant trends of K effects were observed: (i) the concentrations of the acidic forms of the cannabinoids in the inflorescences, i.e., THCA, CBDA, CBGA, CBCA, THCVA, and CBDVA, were all highest under the low K treatment of 15 mg L−1 K, and generally declined with further increase sin K supply (Figure 3 and Figure 4). (ii) The concentration of the acidic forms of the cannabinoids were cultivar-specific in the inflorescence leaves. As for DQ, they were lowest under the high K treatment of 240 mg L−1 K, and for RM they were lowest in the range of 60–100 mg L−1 K, compared to all other treatments (Figure 3 and Figure 4). (iii) The concentrations of the non-acidic forms of the cannabinoids, i.e., THC, CBD, and CBC, were generally unaffected (p > 0.05) by K supply, in all organs (Figure 3 and Figure 4). (iv) The cannabinoid profile of the top inflorescence of the cultivar DQ was unaffected by K supply (Figure 4).
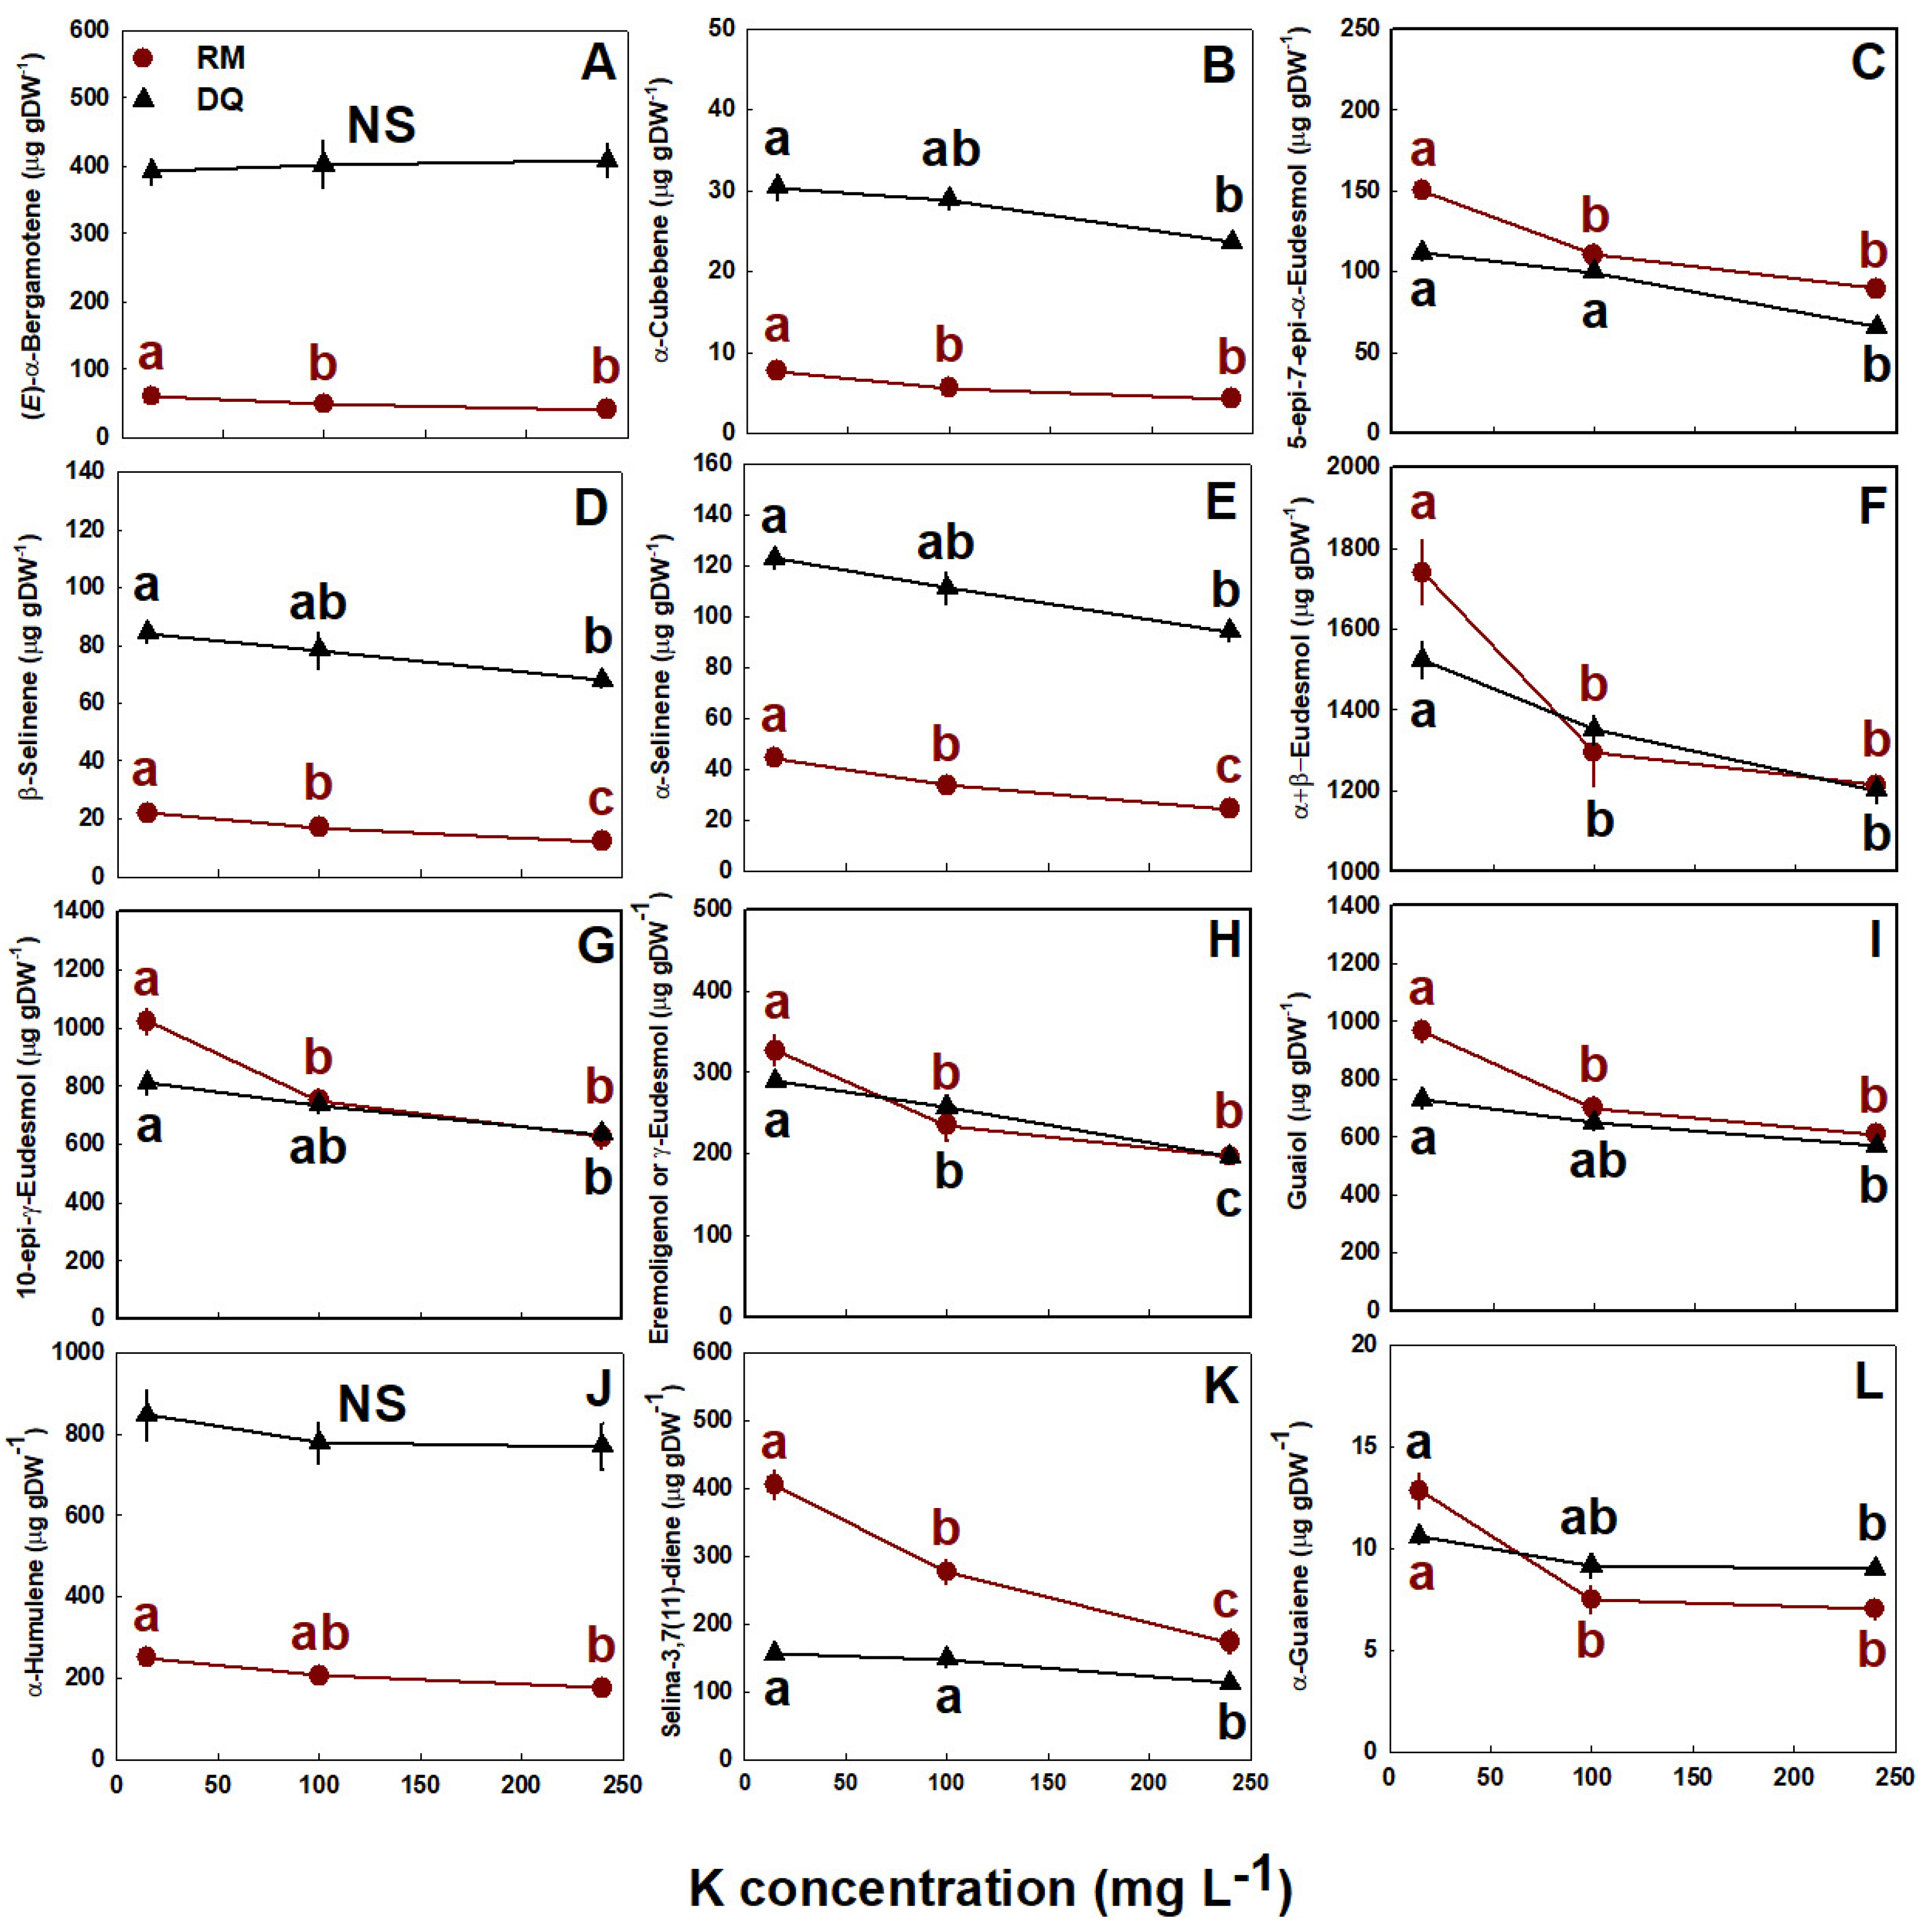
The impact of K supply on the plant’s terpenoid profile was genotype-specific, demonstrating a weak influence on the cultivar DQ and a more substantial influence on RM (Figure 5 and Figure 6). The overall trend of response for both cultivars and most terpenoids was a decrease in terpenoid concentrations under the elevation of K supply (Figure 5 and Figure 6). In the cultivar RM, the concentration of the majority of monoterpenes declined as K supply increased from 15 to 100 mg L−1 K, while myrcene, ipsendiol, and terpinene-4-ol decreased only at 240 mg L−1 K, and (E)-β-ocimene was not affected by K supply (Figure 5). Most monoterpenes in the cultivar DQ were the exception to this trend, as they were unaffected by K supply, excluding borneol and fenchol, which demonstrated similar patterns of decline as were obtained for the cultivar RM (Figure 5). Sesquiterpene concentrations were also strongly influenced by K supply (Figure 5 and Figure 6; Figure S3 Supplemental). In RM, except for α-bisabolol and caryophyllene oxide that were not significantly affected by K supply, the concentration of all sesquiterpenes declined with the increase in K supply from 15 to 240 mg L−1 K. For most sesquiterpenes, a significant decline in concentration was apparent between 15 and 100 mg L−1 K (Figure 6; Figure S3 Supplemental). In DQ, although many sesquiterpenes, including (E)-α-bergamotene, (E)-β-caryophyllene, (E)-β-farnesene, β-curcumene, β-sesquiphellandrene, and β-bisabolene were not significantly affected by K supply, all other sesquiterpenes declined in response to the elevation of K supply from 15 to 240 mg L−1 K (Figure 6; Figure S3 Supplemental). The concentration of δ-amorphene also declined as K supply was elevated (data not shown).
3.4. Nutrient Concentration
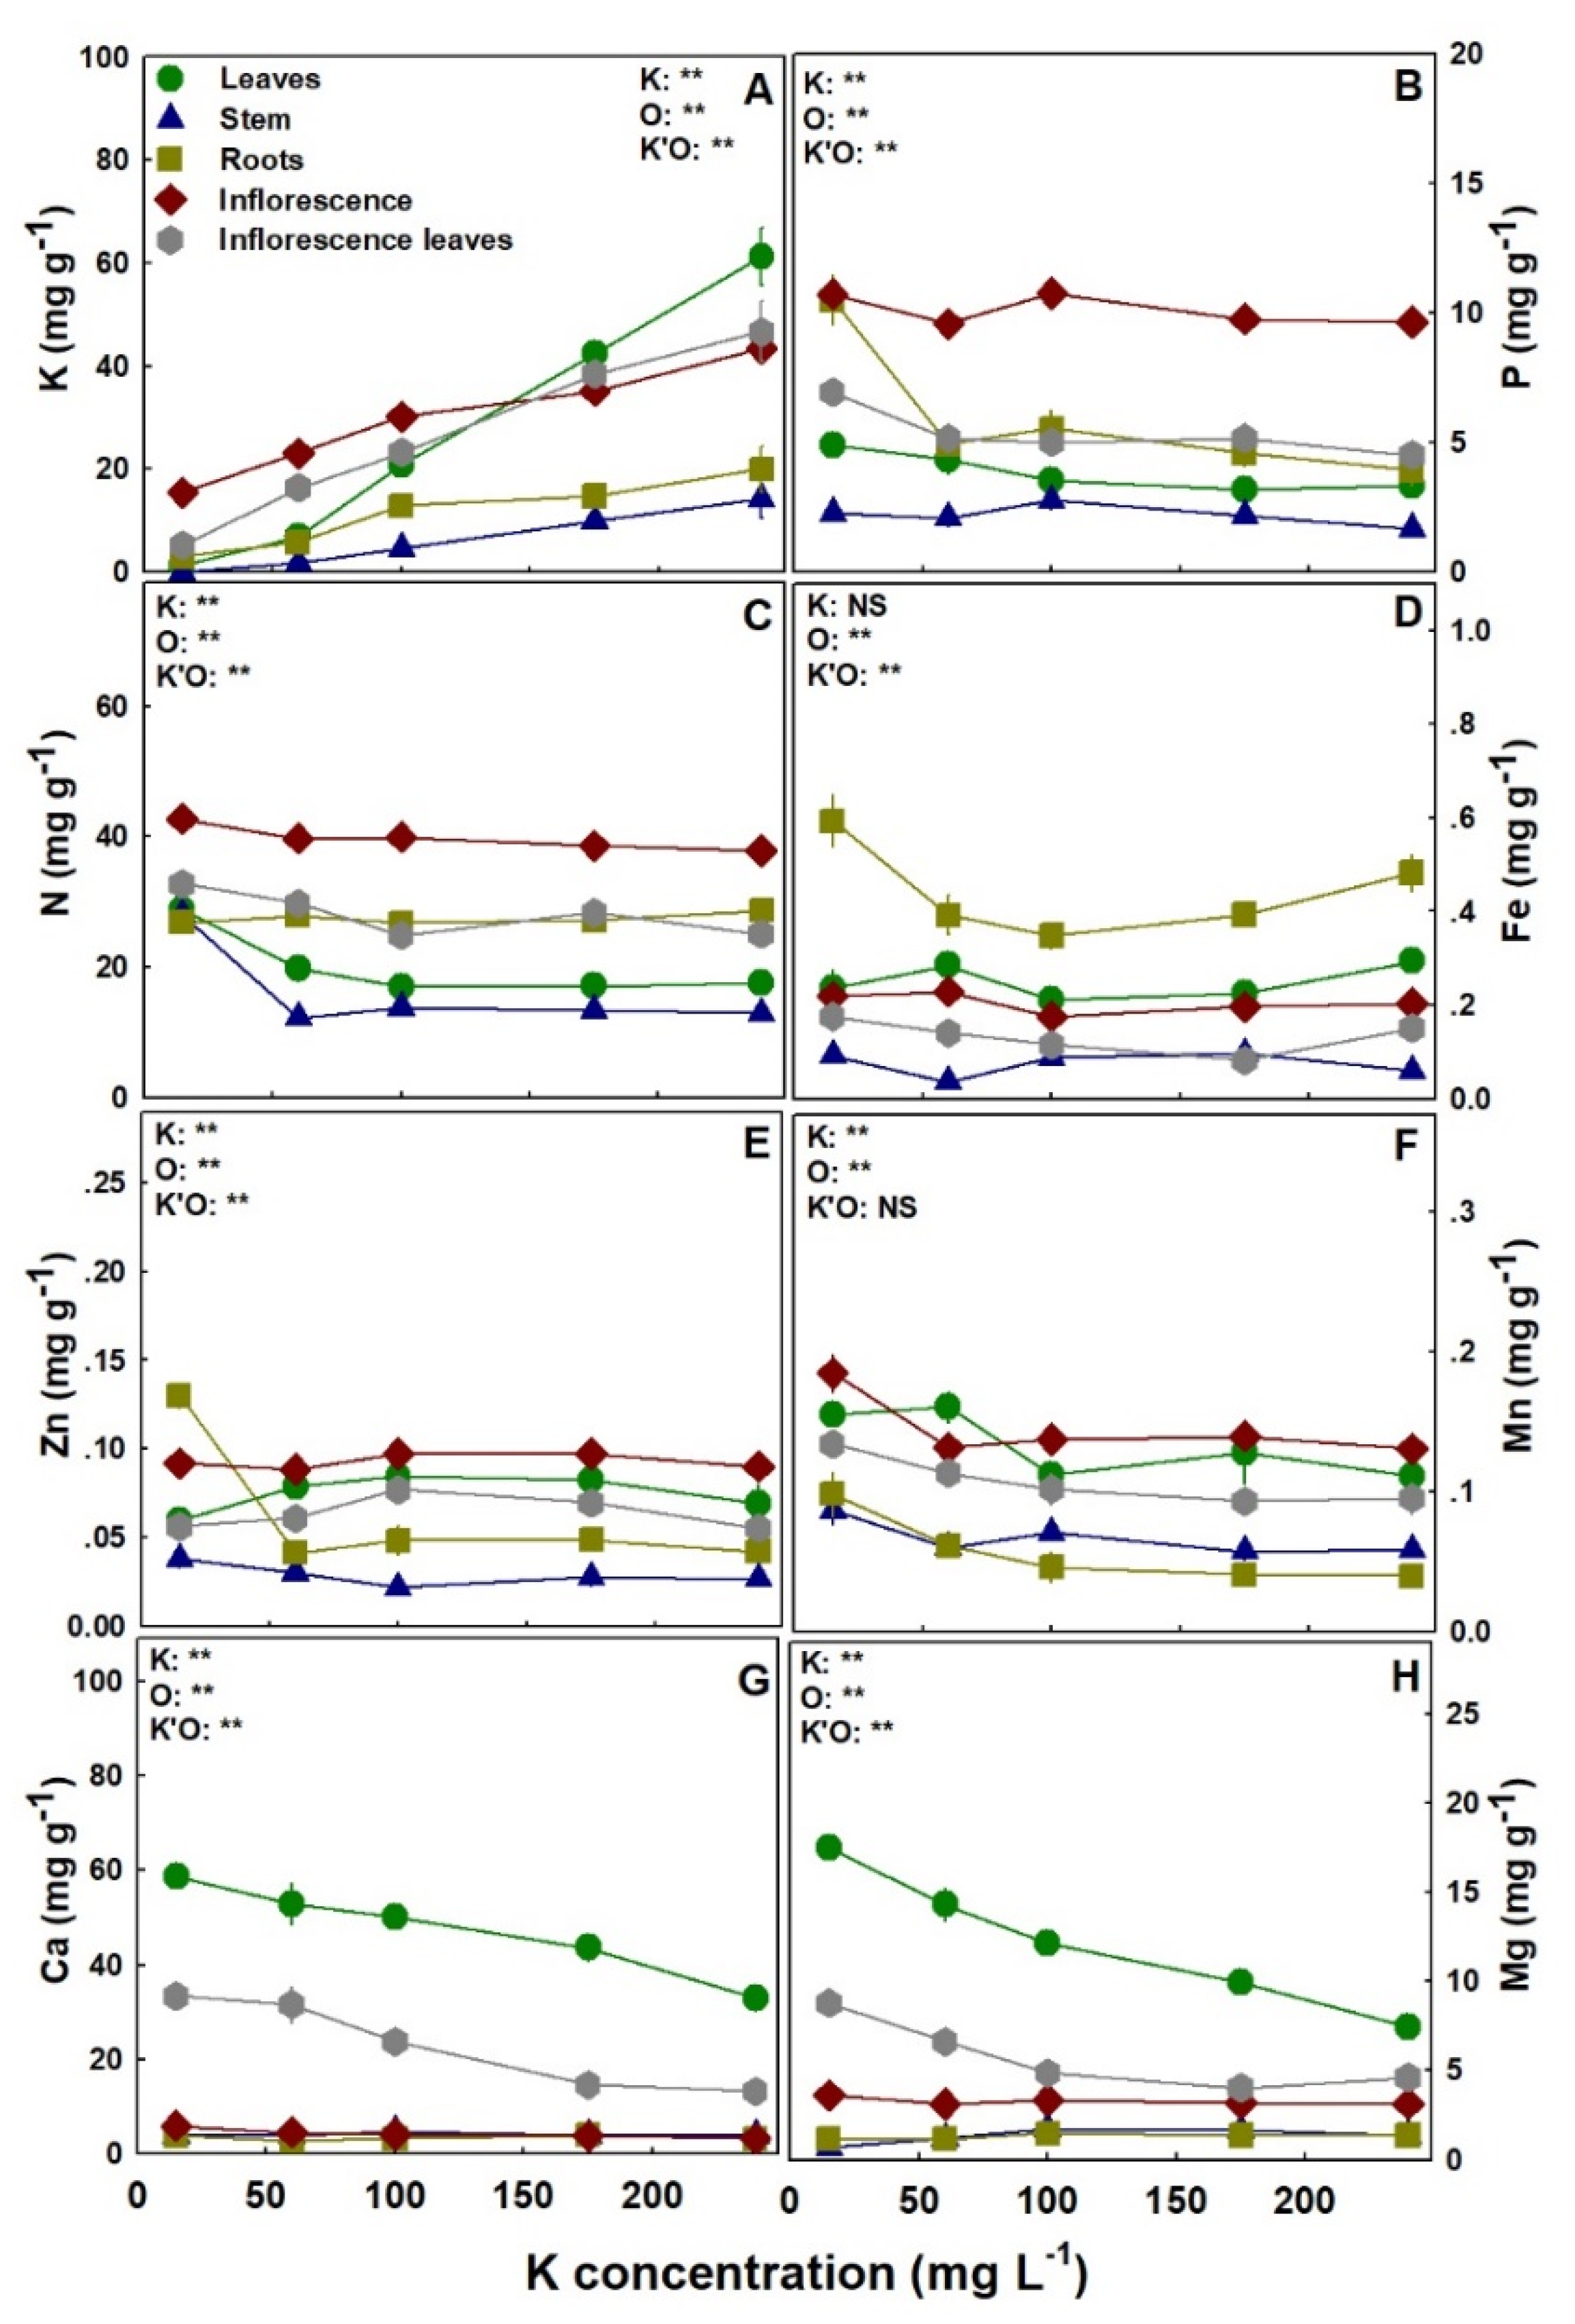
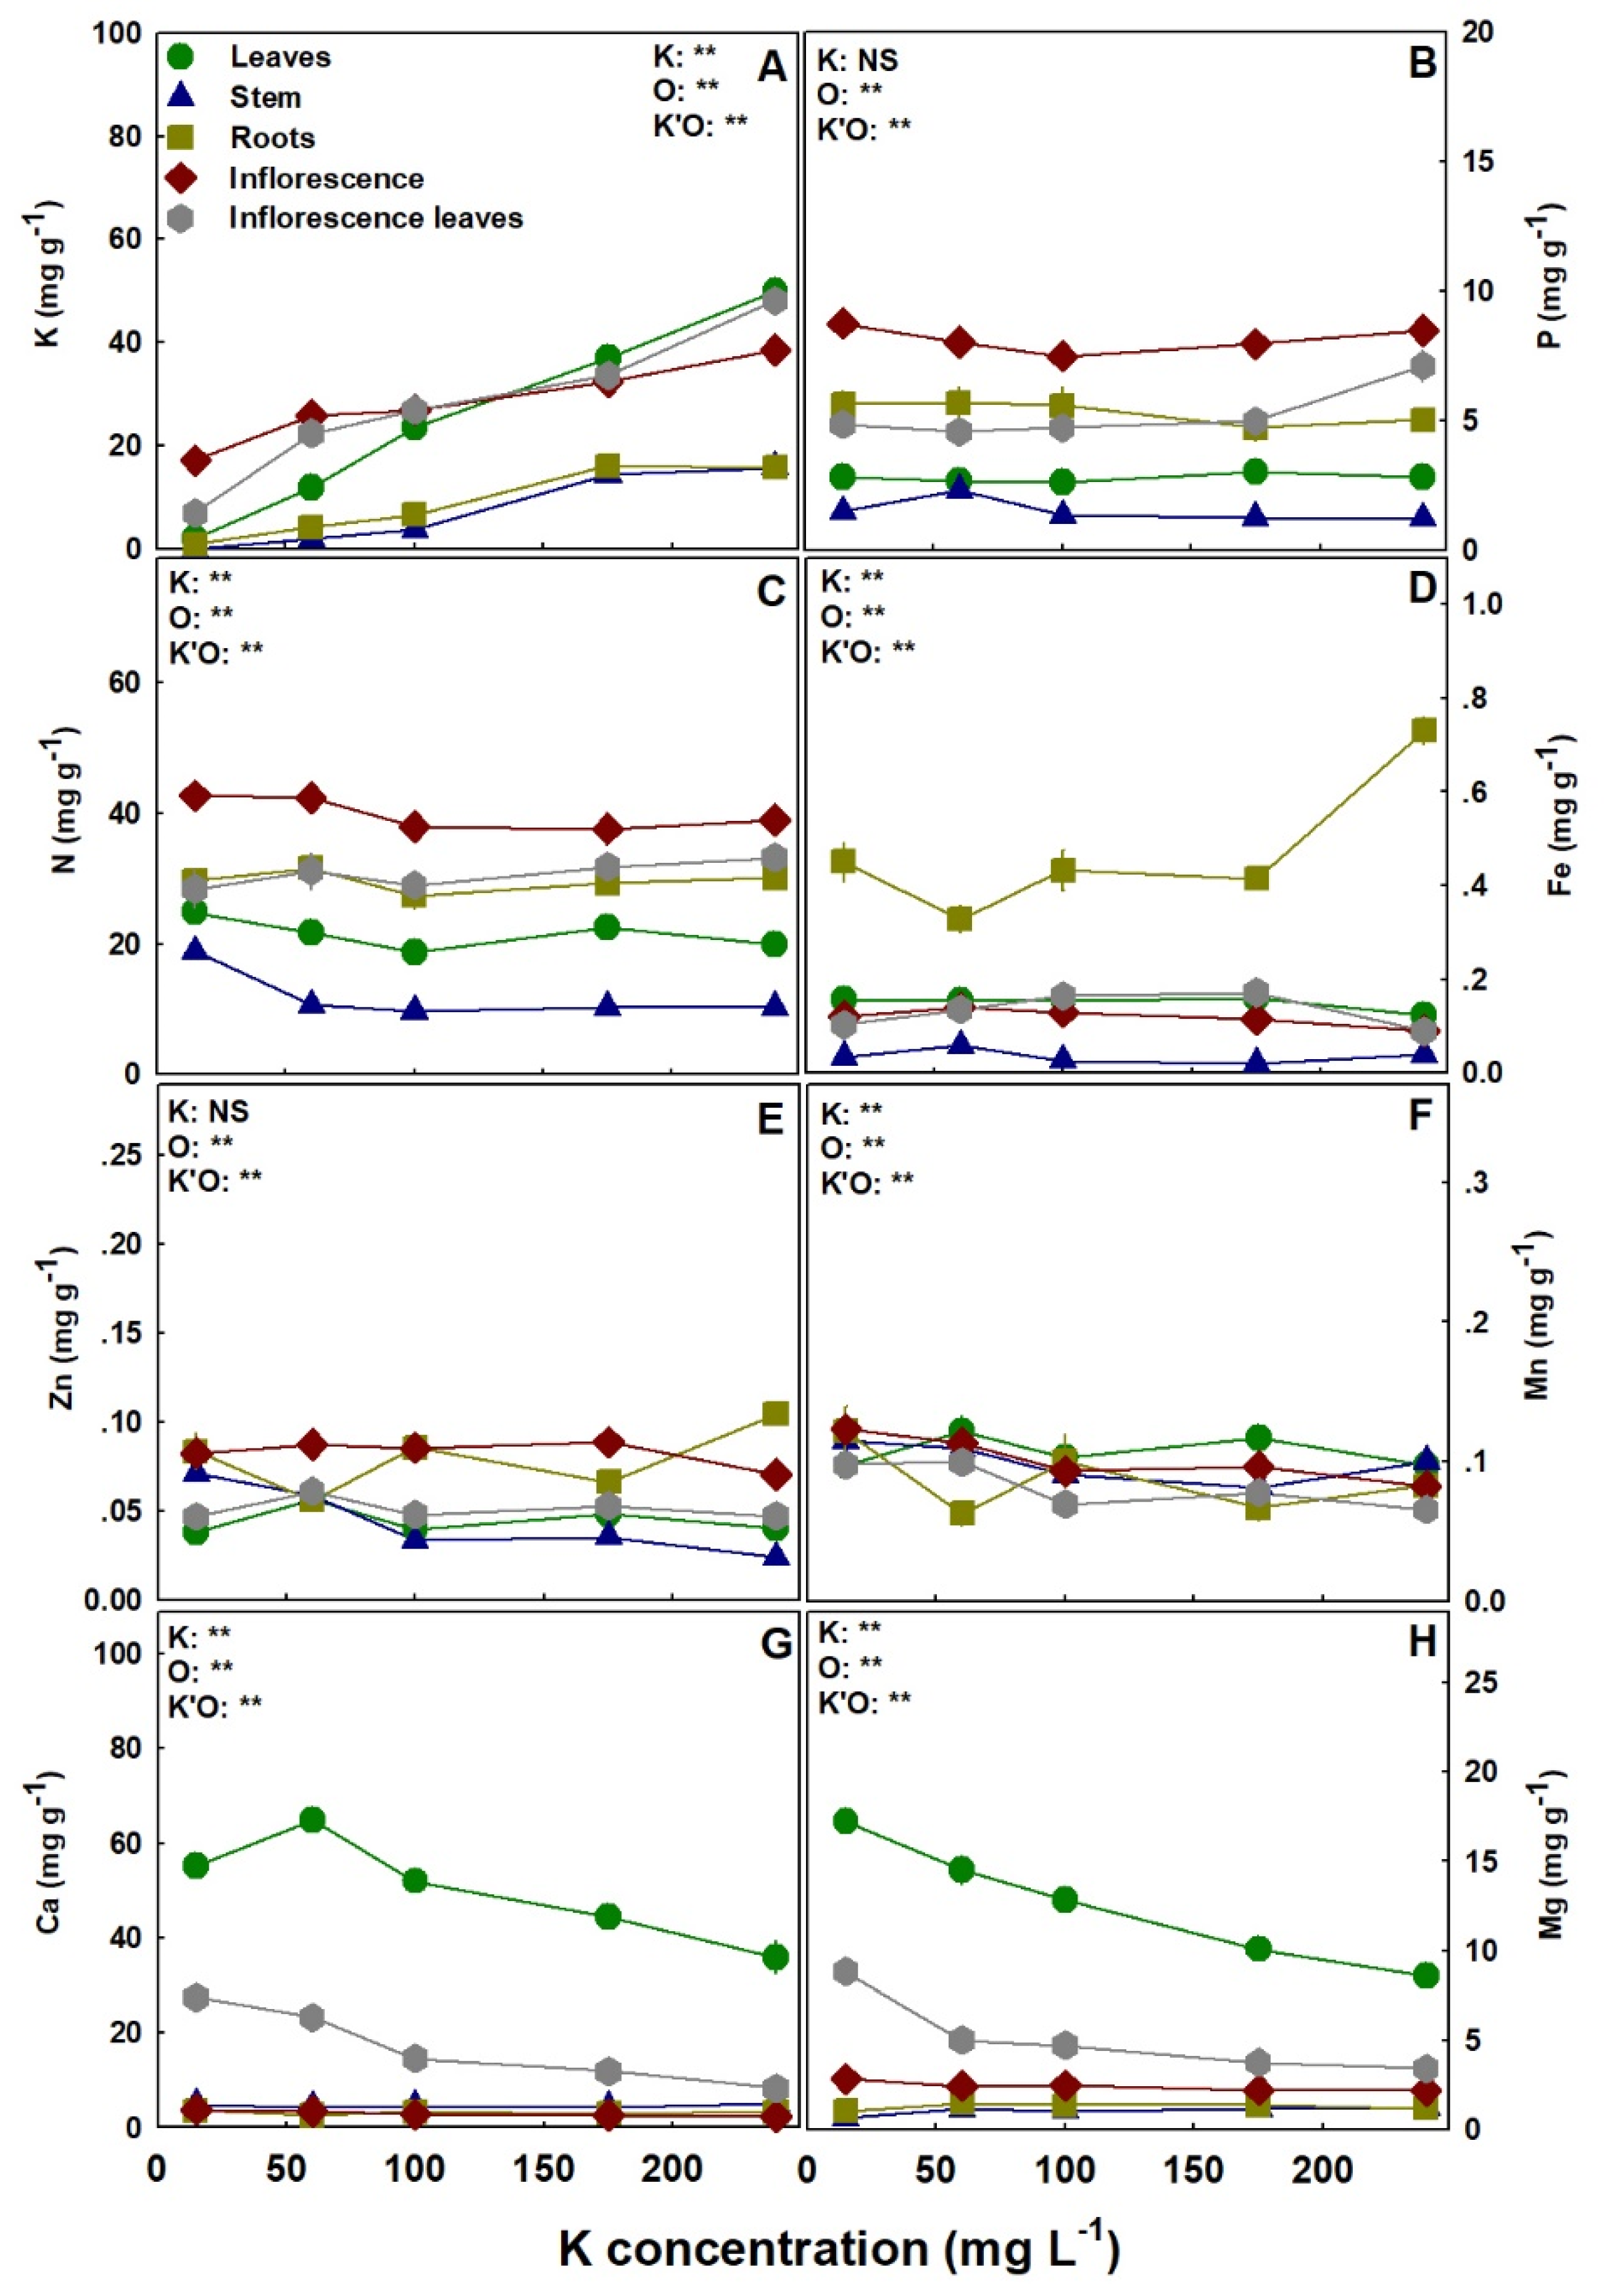
Macronutrient and micronutrient accumulation in the plant, and their distribution to plant organs, were significantly influenced by K supply, with overall similar response trends to K inputs in the two studied cultivars (Figure 7 and Figure 8). As expected, K accumulation in all plant organs increased with K supply in both cultivars (Figure 7A and Figure 8A). Royal Medic plants accumulated P in the leaves, inflorescence leaves, and roots to the highest concentrations under the low K input of 15 mg L−1 K, while P concentrations in the stem and the inflorescences were unaffected by K supply (Figure 7B). In DQ, P concentration was also only partly affected by K supply, as it was highest under 240 mg L−1 K in the inflorescence leaves, significantly lowest under 100 mg L−1 K in the inflorescence, and not significantly influenced by K supply in the leaves, stem, and roots (Figure 8B). Nitrogen accumulation and distribution between the different plant organs were similar in both cultivars, with the concentrations in the leaves and stem highest under 15 mg L−1 K, and the concentrations in the roots, inflorescence, and inflorescence leaves not affected by K supply (Figure 7C and Figure 8C). Iron accumulation was significantly higher in the roots than all other organs in both cultivars (Figure 7D and Figure 8D). In RM, Fe concentration in the roots was significantly higher under 15 mg L−1 K than under 60–175 mg L−1 K, while in all other organs Fe concentration was not significantly affected by K supply (Figure 7D). In DQ, Fe concentration in the inflorescence was significantly lowest under 240 mg L−1 K, while in the stem and roots it was significantly higher under 60 and 240 mg L−1 K, respectively, than in all other K treatments (Figure 8D). In RM, Zn concentration in the stem and roots was highest under 15 mg L−1 K, in the inflorescence leaves it was highest under 100 mg L−1 K; however, the leaves and inflorescence were not affected by K supply (Figure 7E). In DQ, the trend of Zn accumulation was organ-specific: the concentration was highest under 60, 15–60, and 240 mg L−1 K in the leaves, stem, and roots, respectively, lowest under 240 mg L−1 K in the inflorescence, and was not significantly affected by K supply in the inflorescence leaves (Figure 8E). Manganese accumulation was similar in the two cultivars, as the leaves were not affected by K supply, and the concentrations of all other plant organs were significantly higher under 15–60 mg L−1 K (Figure 7F and Figure 8F). However, in DQ, Mn concentration in the inflorescence decreased gradually with the increase in K supply (Figure 7F and Figure 8F). Calcium concentration also demonstrated similar trends for both cultivars, as the concentration in the leaves, inflorescence leaves, and inflorescence decreased with the increase in K supply, while the stem and roots were unaffected (Figure 7G and Figure 8G). In both cultivars, Mg concentration in the leaves and inflorescence leaves decreased as K supply increased (Figure 7H and Figure 8H), and the concentration in the stem and the inflorescences presented an opposite trend. The concentration in the stem was lower under 15 mg L−1 K, while in the inflorescence it was higher under 15 mg L−1 K, compared with all other treatments (Figure 7H and Figure 8H). Although Mg concentration in the roots of the cultivar RM was unaffected by K supply, the concentration in DQ presented a maximum curve at 60–100 mg L−1 K (Figure 7H and Figure 8H).
3.5. Gas Exchange, Water Relations, and Photosynthetic Pigments
The physiological parameters facilitated an insight into the metabolic functions of the plant and their adjustment to the K regime, and revealed variability in the sensitivity of the two cultivars to K supply (Figure 9; Figure S4 Supplemental). In the cultivar RM, photosynthesis was significantly lower under 15 mg L−1 K, while transpiration and stomatal conductance were not affected by K supply (Figure 9A–C). In DQ, all three parameters (photosynthesis, transpiration, and stomatal conductance) demonstrated an optimum response curve with a maximum in the range of 60–175 mg L−1 K, and lower values under lower and higher K inputs (Figure 9A–C). The intercellular CO2 concentration was significantly higher at 15 mg L−1 K compared with all other treatments in RM, and lower at 240 mg L−1 K compared with all other treatments in DQ (Figure 9D). Relative water content (RWC) of the leaves was significantly higher under 60 mg L−1 K than under higher K inputs in RM, while in DQ this factor was not significantly affected by K supply (Figure 9E). In both cultivars, the osmotic potential of the leaf sap was significantly higher under 240 mg L−1 K and lower under 15 mg L−1 K than for all other treatments (Figure 9F,H), and so was the water use efficiency in the cultivar DQ. The membrane leakage of both cultivars was unaffected by K supply (Figure 9G). The response trend of the photosynthetic pigments’ concentration demonstrated a high similarity to the gas exchange parameters, as the concentration of the pigments in RM was generally not influenced by K supply, while in DQ, a maximum was obtained in the range of 60–175 mg L−1 K (Figure S4 Supplemental).
4. Discussion
The present study was undertaken to evaluate the impact of K nutrition on medical cannabis plants at the reproductive growth phase in order to further expand our understanding of the plant’s nutritional requirements. The results confirmed the hypothesis that the secondary metabolism in medical cannabis is affected by K supply, and revealed a genotypic variability in the response to K inputs. Our key findings were that plant function and biomass yield production were impaired under a low K supply of 15 mg L−1; optimal under higher K inputs of 60–175 mg L−1; and K over-supply caused an impaired function of the cultivar DQ, but did not alter yield. Cannabinoid and terpenoid concentrations were generally highest under the deficient K supply of 15 mg L−1 K (except the non-acidic cannabinoids in both cultivars and most of the monoterpenes in the cultivar DQ). The integration of the results suggests 60 mg L−1 K as the optimal K concentration for optimal plant function, high inflorescence yield, and rich secondary metabolite profiles. This information adds to the recently revealed information for medical cannabis about the impact of N, P, and K nutrition at the vegetative growth phase [16,34,36], and N and P nutrition at the reproductive growth phase [9,10,35,38]. Together with the studies conducted on N and P, the current study fills the knowledge gap concerning the effects of the three primary macronutrients on medical cannabis plants.
The physiological data obtained in this study demonstrated significant damage to both cultivars under the low K supply of 15 mg L−1 K, and with the over-supply of K at 240 mg L−1 K in the cultivar DQ (Figure 9; Figure S4 Supplemental). The impaired physiological function reduced biomass accumulation and yield production, and was accompanied by visual appearance of moderate leaf chlorosis under 15 and 240 mg L−1 K (Figure 1 and Figure 2). This decrease in physiological function and plant biomass indicates that the supply of 15 mg L−1 K is insufficient for medical cannabis cultivation. Higher supply inputs of 60–175 mg L−1 K improved plant function in both cultivars, but demonstrated genotypic variability in the response of specific physiological functions (Figure 9; Figure S4 Supplemental). The deficiency responses of the cannabis plants were in accord with the responses observed for other plant species, demonstrating reduced physiological activity under low K inputs [11,47,48].
The improved physiological state under 60–175 mg L−1 K enabled higher biomass and yield production, but K supply above 60 mg L−1 K did not affect yield production (Figure 2). The highest K treatment of 240 mg L−1 K negatively influenced most physiological parameters in DQ compared to the lower K levels, while the cultivar RM did not suffer from excess K supply (Figure 9; Figure S4 Supplemental). K over-supply normally does not induce physiological damage to plants [16,28,49]. Thus, the detrimental effects of high K inputs (at 240 mg L−1 K) on the physiological function of the cultivar DQ were surprising. The adverse effects of K over-supply can be best explained by the substantial reduction in the accumulation of Ca and Mg in the leaves (Figure 7 and Figure 8), as a shortage of Ca and Mg in leaves is a known cause of physiological damage [50,51,52,53].
K accumulation in the plant (in all plant parts) increased with the increase in K supply, and antagonistic response patterns to an increase in K supply were obtained for the accumulation of other plant nutrients (Figure 7 and Figure 8). Generally, deficient levels of K (15 mg L−1 K) induced higher concentrations of N, P, and Mn (the accumulation was organ-dependent) (Figure 7 and Figure 8). Another negative trend, which has been well demonstrated for other plant species [51,54,55,56], was the significant decline in Ca and Mg concentrations with the elevation in K supply in most organs, presenting a competitive interaction between K and these cations for plant uptake. In addition, except for a few minor effects, K supply did not elevate the accumulation of any of the nutrients examined, and the levels of most nutrients were either reduced, or not affected by K supply (Figure 7 and Figure 8).
Overall, plant response to K supply at the reproductive growth phase was in accord with the response we formerly observed for the vegetative growth phase [16]. However, the deficiency response under low K supply was more moderate at the reproductive growth phase than at the vegetative phase. First, the morphological parameters showed that plant morphology was not affected by low K supply at the reproductive phase (Figure S1 Supplemental), while at the vegetative phase, low K supply significantly delayed morphological development [16]. Second, membrane integrity, chlorophyll content, and carotenoids in the cultivar RM were not affected by K supply at the reproductive phase (Figure 9G; Figure S4 Supplemental). However, these parameters were negatively influenced by the same low K supply of 15 mg L−1 K at the vegetative growth phase [16]. Furthermore, while high K levels above 60 mg L−1 K promoted growth and biomass accumulation in the vegetative phase, [16], no positive impact was apparent in the reproductive phase. Different sensitivities to environmental pressures at different growth phases have been demonstrated before for numerous plants and environmental conditions [57,58,59,60]. Therefore, we conclude that the morphological and physiological impacts of restrictive exogenous K supply in medical cannabis are more dominant in the vegetative phase than in the reproductive growth phase.
To fully understand the impact of K on cannabis plants cultivated for medical use, it is necessary to examine the impact on plant secondary metabolism. In agriculture, K is known as a “quality element” known to improve primary and secondary metabolism [12,19], thus increasing components of color, aroma, and taste in different crops [26,61,62]. Contradictory to this notion, in the present study with medical cannabis, increased K supply significantly decreased the concentrations of most cannabinoids and terpenoids identified in the plant (Figure 3, Figure 4, Figure 5 and Figure 6; Figure S3 Supplemental). Importantly, the concentrations of all major cannabinoids, THCA, CBDA, CBGA, CBCA, as well as THCVA, were highest under the deficient K input of 15 mg L−1 K (Figure 3 and Figure 4). As the concentrations of most terpenoids were highest under this deficient K supply, we conclude that K deficiency promotes secondary metabolism in cannabis.
Nutrient deficiencies in general, and K deficiency in particular, may cause plant stress or elevate stress by impairing the plants’ ability to cope with other biotic and abiotic stresses such as drought, salinity, and attack by pathogens [15,63,64,65]. Increased secondary metabolism is a common and well-documented response of plants to stress [66,67,68]. The deficiency-induced stress we report here for cannabis, which resulted from insufficient K supply, may explain the increase in the cannabinoid and terpenoid content under 15 mg L−1 K. Furthermore, the results support the findings of a survey conducted by Haney and Kutscheid [32] that reported a correlation between K deficiency and high THC content in wild hemp populations grown naturally at diverse locations. However, the finding that the concentration of many secondary metabolites continued to decline with the increase in K supply at the optimum K supply range of 60–240 mg L−1 K, that did not induce plant stress (Figure 3, Figure 4, Figure 5 and Figure 6; Figure S3 Supplemental), suggests that another mechanism that is not linked to stress is involved. Nevertheless, although K supply decreased cannabinoid production, the concentrations of the non-acidic forms of the cannabinoids (THC, CBD, and CBC) were generally not affected by K supply (Figure 3 and Figure 4), indicating that, unlike N supply [9], K supply and deficiency-induced stress do not affect in-plant decarboxylation.
Interestingly, the elevated production of cannabinoids and terpenoids under nutrient deficiency in medical cannabis is not restricted to K deficiency. In previous studies, we reported on the response of medical cannabis plants to the increase in N supply [9] and NH4/NO3 ratios [35]. In both N studies, inflorescence N concentration was negatively correlated with the production of secondary metabolites, and no other measured parameter was correlated accordingly. Hence, the main conclusion that evolved from these studies is that the elevation of N concentration in the inflorescence is the cause for the reduced secondary metabolism in medical cannabis, following the well-documented carbon/nutrient balance hypothesis that has been well documented for other crops [69,70]. In the present study, the N content in the inflorescence and inflorescence leaves was not affected by K supply (Figure 7C and Figure 8C). Therefore, no such links can be made, and the reduced secondary metabolism that is elicited by the elevation of K supply cannot be due to the plant N content.
Nevertheless, as cannabinoids and terpenoids do not contain any K atoms, the carbon/nutrient balance hypothesis may explain the reduction in cannabinoid and terpenoid production under elevated K inputs if the plant K content is considered. The path of increasing a mineral supply, and thereby elevating its’ accumulation in the plant and reducing the carbon/nutrient status, can also be found in the work of Shiponi and Bernstein [10]. They demonstrated that elevation of P supply to medical cannabis plants, which induced an increase in inflorescence P content, also reduced cannabinoid concentrations. The integration of the responses of medical cannabis to the elevation of the three major macronutrients, N, P, and K, and the decline in cannabinoid production in all three cases, may imply that the concentration of these nutrients in the inflorescence negatively correlates with secondary metabolism in the inflorescence, according to the carbon/nutrient balance hypothesis, while the type of nutrient is less significant. Hence, we suggest that the decrease in cannabinoid and terpenoid content under the elevation of K supply is due to the increase in inflorescence K content. It should, however, be acknowledged, that as an increase in K supply decreased inflorescence Ca content in both cultivars, the assumption that the decrease in Ca content is the cause for the reduced secondary metabolism can also be argued, and further research on medical cannabis Ca response is required to resolve this issue. Such study is currently underway in our laboratory.
The response of the medical cannabis plant to K supply confirms the hypothesis that K supply induces changes to the secondary metabolism and plant function. Despite the significant and visible effects on morpho-physiological responses, K nutrition does not exert a substantial effect on plant development and function at the reproductive growth phase, compared to the vegetative growth phase and the effects of N nutrition [9,16,34]. Moreover, the cannabinoid and terpenoid contents in the plant were only partially affected by K supply, and the decline in most of these compounds was moderate, and weaker than the response of secondary metabolism recorded to N [9]. Furthermore, many parameters, including monoterpene concentrations (Figure 5), gas exchange (Figure 9A–D), and photosynthetic pigments content (Figure S4 Supplemental), differed between cultivars. Thus, cultivar specificity must be obtained in order to fully optimize plant nutrition.
5. Conclusions
The physiological results demonstrated a significant deficiency-induced stress caused by K deficiency at 15 mg L−1 K in both cultivars. K over-supply damage was caused at 240 mg L−1 K in the cultivar DQ, suggesting 60–175 mg L−1 K as the optimal range for the cultivation of medical cannabis. It is suggested that the metabolic response of the plant to K supply is composed of two major components: A stress component that induces high secondary metabolism under insufficient K inputs (lower than 60 mg L−1 K), and a component that involves a response to the inflorescence K content. The second component is activated even when the physiological status is optimal, causing the decrease in secondary metabolism as the inflorescence K content rises. It cannot be ignored that cannabinoid and terpenoid content decreased with the elevation of K supply, and no beneficial effects were observed for the elevation of K supply from 60 to 175 mg L−1 K. Therefore, the integration of the results suggests that 60 mg L−1 K is the optimal supply level to maintain high function, yield, and secondary metabolite profiles in medical cannabis. Although we now have a better understanding of the effect of K on medical cannabis, it is necessary to further investigate the response of the plants to mineral nutrition. Information is needed about the requirements for fertilization at different periods within the flowering period, the adjustment of mineral nutrition to different growing media, and different combinations of nutrients within the optimal application range. Studies such as these, which have already begun at our laboratory, will help to refine and optimize medical cannabis cultivation.
Supplementary Materials
The following supporting information can be downloaded at: https://0-www-mdpi-com.brum.beds.ac.uk/article/10.3390/agronomy12051242/s1, Figure S1: Concentrations of K in the irrigation solutions (A), and leachates (B), throughout the experiment duration. Figure S2: Effect of K concentration on the development of the medical cannabis cultivars RM and DQ. Plant height (A), number of nodes (B), inflorescence length (C), stem diameter (D). Figure S3: Effect of K supply on sesquiterpenes concentration in the cannabis cultivars RM and DQ. Figure S4: Effect of K supply on the concentration of photosynthetic pigments chlorophyll a (A), chlorophyll b (B) and carotenoids (C). Figure S5: Effect of K supply on cannabinoid contents in the RM cultivar, in units of mg g−1 DW. Figure S6: Effect of K supply on cannabinoid contents in the DQ cultivar in units of mg g−1 DW.
Author Contributions
N.B., conceptualization, funding acquisition, methodology, recourses, supervision, writing; A.S., formal analysis, data curation, writing. All authors have read and agreed to the published version of the manuscript.
Funding
The project was funded by the Chief Scientist Fund of the Ministry of Agriculture in Israel, Project No. 20-03-0018.
Acknowledgments
We thank Mollie Sacks for advice concerning the design of the fertigation solutions; Yael Sade for assistance with cannabinoid analyses; Nadav Danziger, Sivan Shiponi, Geki Shoef, Ayana Neta, and Dalit Morad for technical assistance; Efraim Lewinsohn and Einat Bar for the terpenoid analyses and advice; Shiran Cohen for assistance with N and P analysis. We thank Gerry Kolin from Teva Adir LTD, for cooperation and the supply of the plant material for the study.
Conflicts of Interest
The authors declare no conflict of interest.
References
- Chouvy, P.A. Cannabis cultivation in the world: Heritages, trends and challenges. EchoGéo 2019, 13, 12. [Google Scholar] [CrossRef] [Green Version]
- Aliekperova, N.; Kosyachenko, К.; Kaniura, O. Perspectives on formation of medical cannabis market in Ukraine based on holistic approach. J. Cannabis Res. 2020, 2, 33. [Google Scholar] [CrossRef] [PubMed]
- United Nations Office on Drugs and Crime (UNODC). World Drug Report; United Nations Office on Drugs and Crime (UNODC): Vienna, Austria, 2018. [Google Scholar]
- Bruni, N.; Della Pepa, C.; Oliaro-Bosso, S.; Pessione, E.; Gastaldi, D.; Dosio, F. Cannabinoid delivery systems for pain and inflammation treatment. Molecules 2018, 23, 2478. [Google Scholar] [CrossRef] [PubMed] [Green Version]
- Tóth, K.F.; Ádám, D.; Bíró, T.; Oláh, A. Cannabinoid signaling in the skin: Therapeutic potential of the “c (ut) annabinoid” system. Molecules 2019, 24, 918. [Google Scholar] [CrossRef] [Green Version]
- Zou, S.; Kumar, U. Cannabinoid receptors and the endocannabinoid system: Signaling and function in the central nervous system. Int. J. Mol. Sci. 2018, 19, 833. [Google Scholar] [CrossRef] [PubMed] [Green Version]
- Andre, C.M.; Hausman, J.-F.; Guerriero, G. Cannabis sativa: The Plant of the Thousand and One Molecules. Front. Plant Sci. 2016, 7, 19. [Google Scholar] [CrossRef] [Green Version]
- Flores-Sanchez, I.J.; Verpoorte, R. Secondary metabolism in cannabis. Phytochem. Rev. 2008, 7, 615–639. [Google Scholar] [CrossRef]
- Saloner, A.; Bernstein, N. Nitrogen supply affects cannabinoid and terpenoid profile in medical cannabis (Cannabis sativa L.). Ind. Crops Prod. 2021, 167, 113516. [Google Scholar] [CrossRef]
- Shiponi, S.; Bernstein, N. The highs and lows of P supply in medical cannabis: Effects on cannabinoids, the ionome, and morpho-physiology. Front. Plant Sci. 2021, 12, 657323. [Google Scholar] [CrossRef]
- Grzebisz, W.; Gransee, A.; Szczepaniak, W.; Diatta, J. The effects of potassium fertilization on water-use efficiency in crop plants. J. Plant Nutr. Soil Sci. 2013, 176, 355–374. [Google Scholar] [CrossRef]
- Prajapati, K.; Modi, H.A. The importance of potassium in plant growt—A review. Indian J. Plant Sci. 2012, 1, 177–186. [Google Scholar]
- Tsialtas, I.T.; Shabala, S.; Baxevanos, D.; Matsi, T. Effect of potassium fertilization on leaf physiology, fiber yield and quality in cotton (Gossypium hirsutum L.) under irrigated mediterranean conditions. Field Crop. Res. 2016, 193, 94–103. [Google Scholar] [CrossRef]
- Fageria, V.D. Nutrient interactions in crop plants. J. Plant Nutr. 2001, 24, 1269–1290. [Google Scholar] [CrossRef]
- Hawkesford, M.; Horst, W.; Kichey, T.; Lambers, H.; Schjoerring, J.; Skrumsager Møller, I.; White, P. Functions of macronutrients. In Marschner’s Mineral Nutrition of Higher Plants; Marschner, H., Ed.; Academic Press: Cambridge, MA, USA, 2012; pp. 135–190. ISBN 9780123849052. [Google Scholar]
- Saloner, A.; Sacks, M.M.; Bernstein, N. Response of medical cannabis (Cannabis sativa L.) genotypes to K supply under long photoperiod. Front. Plant Sci. 2019, 10, 1369. [Google Scholar] [CrossRef] [PubMed]
- Wang, Y.; Wu, W.H. Regulation of potassium transport and signaling in plants. Curr. Opin. Plant Biol. 2017, 39, 123–128. [Google Scholar] [CrossRef]
- Wang, M.; Zheng, Q.; Shen, Q.; Guo, S.; Wang, M.; Zheng, Q.; Shen, Q.; Guo, S. The Critical Role of Potassium in Plant Stress Response. Int. J. Mol. Sci. 2013, 14, 7370–7390. [Google Scholar] [CrossRef] [Green Version]
- Usherwood, N.R. The role of potassium in crop quality. In Potassium in Agriculture; Munson, R., Ed.; ASA, CSSA and SSSA: Madison, WI, USA, 1985; pp. 489–513. [Google Scholar]
- Bidari, B.I.; Hebsur, N.S. Potassium in relation to yield and quality of selected vegetable crops. Karnataka J. Agric. Sci. 2011, 24, 55–59. [Google Scholar]
- Nguyen, P.M.; Kwee, E.M.; Niemeyer, E.D. Potassium rate alters the antioxidant capacity and phenolic concentration of basil (Ocimum basilicum L.) leaves. Food Chem. 2010, 123, 1235–1241. [Google Scholar] [CrossRef]
- Delgado, R.; Martín, P.; Del Álamo, M.; González, M.R. Changes in the phenolic composition of grape berries during ripening in relation to vineyard nitrogen and potassium fertilisation rates. J. Sci. Food Agric. 2004, 84, 623–630. [Google Scholar] [CrossRef]
- Liu, W.; Zhu, D.W.; Liu, D.H.; Zhou, W.B.; Yang, T.W.; Geng, M.J. Influence of potassium deficiency on flower yield and flavonoid metabolism in leaves of Chrysanthemum morifolium Ramat. J. Plant Nutr. 2011, 34, 1905–1918. [Google Scholar] [CrossRef]
- Gaaliche, B.; Ladhari, A.; Zarrelli, A.; Ben Mimoun, M. Impact of foliar potassium fertilization on biochemical composition and antioxidant activity of fig (Ficus carica L.). Sci. Hortic. 2019, 253, 111–119. [Google Scholar] [CrossRef]
- Martín-hernández, C.S.; Gómez-merino, F.C.; Saucedo-veloz, C.; Quintana-obregón, E.A.; Muy-rangel, M.D.; Trejo-téllez, L.I. Nitrogen and potassium supplied by phenological stages affect the carotenoid and nutritive content of the tomato fruit. Not. Bot. Horti Agrobot. 2021, 49, 12320. [Google Scholar] [CrossRef]
- Lin, D.; Huang, D.; Wang, S. Effects of potassium levels on fruit quality of muskmelon in soilless medium culture. Sci. Hortic. 2004, 102, 53–60. [Google Scholar] [CrossRef]
- Naumann, M.; Koch, M.; Thiel, H.; Gransee, A.; Pawelzik, E. The importance of nutrient management for potato production part II: Plant nutrition and tuber quality. Potato Res. 2020, 63, 121–137. [Google Scholar] [CrossRef] [Green Version]
- Finnan, J.; Burke, B. Potassium fertilization of hemp (Cannabis sativa). Ind. Crop. Prod. 2013, 41, 419–422. [Google Scholar] [CrossRef]
- Deng, G.; Du, G.; Yang, Y.; Bao, Y.; Liu, F. Planting density and fertilization evidently influence the fiber yield of hemp (Cannabis sativa L.). Agronomy 2019, 9, 368. [Google Scholar] [CrossRef] [Green Version]
- Aubin, M.; Seguin, P.; Vanasse, A.; Tremblay, G.F.; Mustafa, A.F.; Charron, J. Industrial hemp response to nitrogen, phosphorus, and potassium fertilization. Crop Forage Turfgrass Manag. 2015, 1, 1–10. [Google Scholar] [CrossRef] [Green Version]
- Xu, Y.; Chen, Z.Y.; Du, G.H. Effects of potassium nutrition on growth and potassium uptake and utilization efficiency of hemp. Chin. Agric. Sci. Bull. 2015, 31, 132–136. [Google Scholar]
- Haney, A.; Kutscheid, B.B. Quantitative variation in the chemical constituents of marihuana from stands of naturalized Cannabis sativa L. in East-Central Illinois. Econ. Bot. 1973, 27, 193–203. [Google Scholar] [CrossRef]
- Yep, B.; Zheng, Y. Potassium and micronutrient fertilizer addition in a mock aquaponic system for drug-type Cannabis sativa L. cultivation. Can. J. Plant Sci. 2021, 101, 341–352. [Google Scholar] [CrossRef]
- Saloner, A.; Bernstein, N. Response of medical cannabis (Cannabis sativa L.) to nitrogen supply under long photoperiod. Front. Plant Sci. 2020, 11, 1517. [Google Scholar] [CrossRef] [PubMed]
- Saloner, A.; Bernstein, N. Nitrogen source matters: High NH4/NO3 ratio reduces cannabinoids, terpenoids, and yield in medical cannabis. Front. Plant Sci. 2022; in press. [Google Scholar]
- Shiponi, S.; Bernstein, N. Response of medical cannabis (Cannabis sativa L.) genotypes to P supply under long photoperiod: Functional phenotyping and the ionome. Ind. Crops Prod. 2021, 161, 113154. [Google Scholar] [CrossRef]
- Bernstein, N.; Gorelick, J.; Zerahia, R.; Koch, S. Impact of N, P, K, and humic acid supplementation on the chemical profile of medical cannabis (Cannabis sativa L.). Front. Plant Sci. 2019, 10, 736. [Google Scholar] [CrossRef] [Green Version]
- Bevan, L.; Jones, M.; Zheng, Y. Optimisation of nitrogen, phosphorus, and potassium for soilless production of Cannabis sativa in the flowering stage using response surface analysis. Front. Plant Sci. 2021, 12, 764103. [Google Scholar] [CrossRef]
- Danziger, N.; Bernstein, N. Light matters: Effect of light spectra on cannabinoid profile and plant development of medical cannabis (Cannabis sativa L.). Ind. Crops Prod. 2021, 164, 113351. [Google Scholar] [CrossRef]
- Westmoreland, F.M.; Kusuma, P.; Bugbee, B. Cannabis lighting: Decreasing blue photon fraction increases yield but efficacy is more important for cost effective production of cannabinoids. PLoS ONE 2021, 16, e0248988. [Google Scholar] [CrossRef]
- Lydon, J.; Teramura, A.H.; Coffman, C.B. UV-B radiation effects on photosynthesis, growth and cannabinoid production of two Cannabis sativa chemotypes. Photochem. Photobiol. 1987, 46, 201–206. [Google Scholar] [CrossRef]
- Rodriguez-Morrison, V.; Llewellyn, D.; Zheng, Y. Cannabis inflorescence yield and cannabinoid concentration are not increased with exposure to short-wavelength ultraviolet-B radiation. Front. Plant Sci. 2021, 12, 725078. [Google Scholar] [CrossRef]
- Yep, B.; Gale, N.V.; Zheng, Y. Comparing hydroponic and aquaponic rootzones on the growth of two drug-type Cannabis sativa L. cultivars during the flowering stage. Ind. Crops Prod. 2020, 157, 112881. [Google Scholar] [CrossRef]
- Yep, B.; Gale, N.V.; Zheng, Y. Aquaponic and hydroponic solutions modulate NaCl-induced stress in drug-type Cannabis sativa L. Front. Plant Sci. 2020, 11, 1169. [Google Scholar] [CrossRef] [PubMed]
- Danziger, N.; Bernstein, N. Plant architecture manipulation increases cannabinoid standardization in ‘drug-type’ medical cannabis. Ind. Crops Prod. 2021, 167, 113528. [Google Scholar] [CrossRef]
- Bernstein, N.; Gorelick, J.; Koch, S. Interplay between chemistry and morphology in medical cannabis (Cannabis sativa L.). Ind. Crops Prod. 2019, 129, 185–194. [Google Scholar] [CrossRef]
- Kanai, S.; Moghaieb, R.E.; El-Shemy, H.A.; Panigrahi, R.; Mohapatra, P.K.; Ito, J.; Nguyen, N.T.; Saneoka, H.; Fujita, K. Potassium deficiency affects water status and photosynthetic rate of the vegetative sink in green house tomato prior to its effects on source activity. Plant Sci. 2011, 180, 368–374. [Google Scholar] [CrossRef] [PubMed]
- Zhao, X.H.; Yu, H.Q.; Wen, J.; Wang, X.G.; Du, Q.; Wang, J.; Wang, Q. Response of root morphology, physiology and endogenous hormones in maize (Zea mays L.) to potassium deficiency. J. Integr. Agric. 2016, 15, 785–794. [Google Scholar] [CrossRef]
- Bartholomew, R.P.; Janssen, G. Luxury consumption of potassium by plants and its significance. Agron. J. 1929, 21, 751–765. [Google Scholar] [CrossRef]
- Guo, W.; Nazim, H.; Liang, Z.; Yang, D. Magnesium deficiency in plants: An urgent problem. Crop J. 2016, 4, 83–91. [Google Scholar] [CrossRef] [Green Version]
- Farhat, N.; Elkhouni, A.; Zorrig, W.; Smaoui, A.; Abdelly, C.; Rabhi, M. Effects of magnesium deficiency on photosynthesis and carbohydrate partitioning. Acta Physiol. Plant. 2016, 38, 145. [Google Scholar] [CrossRef]
- Long, M.H.; Tang, X.F.; Yu, W.J.; Liao, Y.; Huang, W.H.; Qin, R.Y. Effects of different calcium levels on photosynthesis and protective enzyme activities of melon leaves. Guihaia 2005, 25, 77–82. [Google Scholar]
- Ramalho, J.C.; Rebelo, M.C.; Santos, M.E.; Antunes, M.L.; Nunes, M.A. Effects of calcium deficiency on Coffea arabica. Nutrient changes and correlation of calcium levels with some photosynthetic parameters. Plant Soil 1995, 172, 87–96. [Google Scholar] [CrossRef]
- Bernstein, N.; Ioffe, M.; Luria, G.; Bruner, M.; Nishri, Y.; Philosoph-Hadas, S.; Salim, S.; Dori, I.; Matan, E. Effects of K and N nutrition on function and production of Ranunculus asiaticus. Pedosphere 2011, 21, 288–301. [Google Scholar] [CrossRef]
- Heenana, D.P.; Campbell, L.C. Influence of potassium and manganese on growth and uptake of magnesium by soybeans (Glycine max (L.) Merr. cv. Bragg). Plant Soil 1981, 61, 447–456. [Google Scholar] [CrossRef]
- Bar-Tal, A.; Pressman, E. Root restriction and potassium and calcium solution concentrations affect dry-matter production, cation uptake, and blossom-end rot in greenhouse tomato. J. Am. Soc. Hortic. Sci. 1996, 121, 649–655. [Google Scholar] [CrossRef] [Green Version]
- Asad, A.; Blamey, F.P.C.; Edwards, D.G. Dry matter production and boron concentrations of vegetative and reproductive tissues of canola and sunflower plants grown in nutrient solution. Plant Soil 2002, 243, 243–252. [Google Scholar] [CrossRef]
- Samineni, S.; Siddique, K.H.M.; Gaur, P.M.; Colmer, T.D. Salt sensitivity of the vegetative and reproductive stages in chickpea (Cicer arietinum L.): Podding is a particularly sensitive stage. Environ. Exp. Bot. 2011, 71, 260–268. [Google Scholar] [CrossRef] [Green Version]
- Bissuel-Belaygue, C.; Cowan, A.A.; Marshall, A.H.; Wery, J. Reproductive development of white clover (Trifolium repens L.) is not impaired by a moderate water deficit that reduces vegetative growth: II. Fertilization efficiency and seed Set. Crop Sci. 2002, 42, 414–422. [Google Scholar] [CrossRef]
- Malhi, S.S.; Gill, K.S. Effectiveness of sulphate-S fertilization at different growth stages for yield, seed quality and S uptake of canola. Can. J. Plant Sci. 2011, 82, 665–674. [Google Scholar] [CrossRef]
- Luo, Y.; Xiao, L.; Pan, S.; Nie, J.; Li, Y.; Tang, X. Effects of potassium fertilizer on aroma and quality of aromatic rice. Southwest China J. Agric. Sci. 2014, 27, 1147–1153. [Google Scholar]
- Liu, G.S.; Ye, X.F.; Wang, Y.T.; Li, X.L.; Ma, L.X. Effect of different potassium application rates on the contents of aroma constituents in flue-cured tobacco. Chin. Tob. Sci. 2004, 4, 1–4. [Google Scholar]
- Gorelick, J.; Bernstein, N. Elicitation: An underutilized tool in the development of medicinal plants as a source of therapeutic secondary metabolites. In Advances in Agronomy; Sparks, D.L., Ed.; Elsevier Inc.: Amsterdam, The Netherlands, 2014; pp. 201–230. [Google Scholar]
- Zimerman-Lax, N.; Tamir-Ariel, D.; Shenker, M.; Burdman, S. Decreased potassium fertilization is associated with increased pathogen growth and disease severity caused by Acidovorax citrulli in melon foliage. J. Gen. Plant Pathol. 2018, 84, 27–34. [Google Scholar] [CrossRef]
- Usherwood, N.R. The role of Potassium in drought tolerance. In Potassium in Agriculture; ASA, CSSA and SSSA: Madison, WI, USA, 1985; pp. 1–15. [Google Scholar]
- Sampaio, B.L.; Edrada-Ebel, R.; Da Costa, F.B. Effect of the environment on the secondary metabolic profile of Tithonia diversifolia: A model for environmental metabolomics of plants. Sci. Rep. 2016, 6, 29265. [Google Scholar] [CrossRef] [PubMed] [Green Version]
- Ghorbanpour, M.; Varma, A. Medicinal Plants and Environmental Challenges; Springer: Berlin/Heidelberg, Germany, 2017; ISBN 978-3-31968-717-9. [Google Scholar]
- Nascimento, N.C.; Fett-Neto, A.G. Plant secondary metabolism and challenges in modifying its operation: An overview. In Plant Secondary Metabolism Engineering. Methods in Molecular Biology (Methods and Protocols); Fett-Neto, A.G., Ed.; Humana Press: Totowa, NJ, USA, 2010; Volume 643, pp. 1–13. ISBN 978-1-60761-722-8. [Google Scholar]
- Lerdau, M.; Coley, P.D. Benefits of the carbon-nutrient balance hypothesis. Oikos 2002, 98, 534–536. [Google Scholar] [CrossRef]
- Rembiałkowska, E. Quality of plant products from organic agriculture. J. Sci. Food Agric. 2007, 87, 2757–2762. [Google Scholar] [CrossRef]
Figure 1.
Visual appearance of the leaves (top row), inflorescences (middle row), and whole plant (bottom row) of the medical cannabis cultivars RM (A) and DQ (B) under different K treatments. From left to right: 15, 60, 100, 175, and 240 mg L−1 K. The inflorescence images are of the apical (top) inflorescence of the main stem (primary inflorescence), and the leaf images are of the youngest, fully developed leaves on the main stem. The images were taken at the time of harvest.

Figure 2.
Effect of K supply on plant biomass in the medical cannabis cultivars RM and DQ. Dry weights of the inflorescences (A), inflorescence leaves (B), fan leaves (C), stem (D), and roots (E); and K use efficiency (KUE) (F). Presented data are averages ± SE (n = 5). Where not seen, the error bars are smaller than the symbol size. Results of the 2-way ANOVA are indicated as ** p < 0.05, F-test; NS, not significant, p > 0.052. In the ANOVA results, K’G represents the interaction between K and the genotype.

Figure 3.
Effect of K supply on cannabinoid content in the medical cannabis cultivar RM, at the top (primary) and side (secondary) inflorescences and the inflorescence leaves. THCA (A), CBDA (B), THC (C), CBD (D), THCVA (E), CBDVA (F) CBGA (G), CBCA (H). Presented data are averages ± SE (n = 5). Where not seen, the error bars are smaller than the symbol size. Results of two-way ANOVA indicated as ** p < 0.05, F-test; NS, not significant p > 0.05, F-test. In the ANOVA results, K’O represents the interaction between K and the plant organ. Results in units of mg g−1 are presented in Figure S5 Supplemental.

Figure 4.
Effect of K supply on cannabinoid content in the medical cannabis cultivar DQ, at the top (primary) and side (secondary) inflorescences and inflorescence leaves. Presented data are averages ± SE (n = 5). Where not seen, the error bars are smaller than the symbol size. Results of two-way ANOVA are indicated as ** p < 0.05, F-test; NS, not significant p > 0.05, F-test. In the ANOVA results, K’O represents the interaction between K and the plant organ. Results in units of mg g−1 are presented in Figure S6 Supplemental.

Figure 5.
Effect of K supply on monoterpene concentration in the medical cannabis cultivars RM and DQ at the top (primary) inflorescence. α-Pinene (A), β-pinene (B), myrcene (C), ipsdienol (D), limonene (E), δ-2-carene (F), linalool (G), fenchol (H), (E)-β-ocimene (I), borneol (J), terpinene-4-ol. (K) and α-terpineol (L). Presented data are averages ± SE (n = 5). In the one-way ANOVA results, NS signifies no significant differences between treatments, and different small letters signify significant differences between treatments by Tukey’s HSD test at α = 0.05.

Figure 6.
Effect of K supply on sesquiterpene concentration in the medical cannabis cultivars RM and DQ. (E)-α-Bergamotene (A), α-cubebene (B), 5-epi-7-epi-α-eudesmol (C), α-selinene (D), β-selinene (E), α+β-eudesmol (F), 10-epi-γ-eudesmol (G), eremoligenol or γ-eudesmol (H), guaiol (I), α-humulene (J), selina-3,7(11)-diene (K) and α-guaiene (L) concentration in the top (primary) inflorescence. Presented data are averages ± SE (n = 5). Where not seen, the error bars are smaller than the symbol size. In the one-way ANOVA results, NS signifies no significant differences between treatments, and different small letters signify significant differences between treatments by Tukey’s HSD test at α = 0.05.

Figure 7.
Effect of K supply on nutrient concentrations in the leaves, stem, roots, inflorescence, and inflorescence leaves of the medical cannabis cultivar RM. K (A), P (B), N (C), Fe (D), Zn (E) Mn (F), Ca (G) and Mg (H). Presented data are averages ± SE (n = 5). Where not seen, the error bars are smaller than the symbol size. Results of two-way ANOVA are indicated as ** p < 0.05, F-test; NS, not significant p > 0.05, F-test. In the ANOVA results, K’O represents the interaction between K and the plant organs.

Figure 8.
Effect of K supply on nutrient concentrations in the leaves, stem, roots, inflorescence, and inflorescence leaves of the medical cannabis cultivar DQ. K (A), P (B), N (C), Fe (D), Zn (E) Mn (F), Ca (G) and Mg (H). Presented data are averages ± SE (n = 5). Where not seen, the error bars are smaller than the symbol size. Results of two-way ANOVA indicated as ** p < 0.05, F-test; NS, not significant p > 0.05, F-test. In the ANOVA results, K’O represents the interaction between K and the plant organs.

Figure 9.
Effect of K supply on gas exchange and physiological characteristics in the medical cannabis cultivars RM and DQ. Net photosynthesis rate (A), transpiration rate (B), stomatal conductance (C), intercellular CO2 concentration (D), relative water content (RWC) (E), osmotic potential (F), membrane leakage (G), and intrinsic water use efficiency (WUEi) (H). Presented data are averages ± SE (n = 5). Where not seen, the error bars are smaller than the symbol size. Results of two-way ANOVA are indicated as ** p < 0.05, F-test; NS, not significant p > 0.05, F-test. In the ANOVA results, K’G represents the interaction between K and the genotype.

Publisher’s Note: MDPI stays neutral with regard to jurisdictional claims in published maps and institutional affiliations. |
© 2022 by the authors. Licensee MDPI, Basel, Switzerland. This article is an open access article distributed under the terms and conditions of the Creative Commons Attribution (CC BY) license (https://creativecommons.org/licenses/by/4.0/).
Share and Cite
MDPI and ACS Style
Saloner, A.; Bernstein, N. Effect of Potassium (K) Supply on Cannabinoids, Terpenoids and Plant Function in Medical Cannabis. Agronomy 2022, 12, 1242. https://0-doi-org.brum.beds.ac.uk/10.3390/agronomy12051242
AMA Style
Saloner A, Bernstein N. Effect of Potassium (K) Supply on Cannabinoids, Terpenoids and Plant Function in Medical Cannabis. Agronomy. 2022; 12(5):1242. https://0-doi-org.brum.beds.ac.uk/10.3390/agronomy12051242
Chicago/Turabian StyleSaloner, Avia, and Nirit Bernstein. 2022. "Effect of Potassium (K) Supply on Cannabinoids, Terpenoids and Plant Function in Medical Cannabis" Agronomy 12, no. 5: 1242. https://0-doi-org.brum.beds.ac.uk/10.3390/agronomy12051242
Note that from the first issue of 2016, this journal uses article numbers instead of page numbers. See further details here.