
Effects of Years of Rice Straw Return on Soil Nitrogen Components from Rice–Wheat Cropped Fields


1
Nanjing Institute of Agricultural Mechanization, Ministry of Agriculture and Rural Affairs, Nanjing 210014, China
2
Jiangsu Key Laboratory of Crop Genetics and Physiology, Yangzhou University, Yangzhou 225009, China
*
Author to whom correspondence should be addressed.
Agronomy 2022, 12(6), 1247; https://0-doi-org.brum.beds.ac.uk/10.3390/agronomy12061247
Submission received: 19 April 2022
/
Revised: 12 May 2022
/
Accepted: 19 May 2022
/
Published: 24 May 2022
(This article belongs to the Special Issue Multiple Cropping Systems for Improving Crop Yield and Soil Quality)
Abstract
:Straw return is an important farmland management practice that influences the activity of soil nitrogen. Few studies have examined the distribution of soil nitrogen and its components in wheat–rice cropping fields in subtropical China. This study assesses the influence of different years of straw return on the distribution and variation of total soil nitrogen (TN), light fraction nitrogen (LFN), heavy fraction nitrogen (HFN), particulate nitrogen (PN), and mineral-bound nitrogen (MN). We conducted a field experiment with eight years of straw retention treatments in 2017 (no straw retention, NR; 1 year of straw retention, SR1; 2 years of straw retention, SR2; 3 years of straw retention, SR3; 4 years of straw retention, SR4; 5 years of straw retention, SR5; 6 years of straw retention, SR6; 7 years of straw retention, SR7) and one more treatment in 2018 (8 years of straw retention, SR8) in a rice–wheat cropping system at Yangzhou University Experimental Station in China. The results demonstrated that as the number of years of treatment increases, the content of TN, LFN, HFN, PN, and MN at each soil layer gradually increases. Compared with NR, the highest increase in TN, LFN, HFN, PN, and MN under SR1-SR8 in the 0–20 cm soils was 38.10%, 150.73%, 35.61%, 79.97%, and 27.71%, respectively, but increases in TN, HFN, and MN content gradually slowed after six years of straw return. The contents or variation of TN were extremely significantly correlated (p < 0.01) with that of LFN, HFN, PN, and MN, while LFN had the highest variation. In general, straw return could improve the quality of the 0–20 cm nitrogen pool. LFN was the best indicator of changes to the soil nitrogen pool affected by years of straw return.
1. Introduction
Nitrogen is an important element for crop growth and is an important factor in agricultural non-point source pollution [1]. Excessive application of nitrogen fertilizers for intensive agricultural production has become a major threat to both ecosystems and human health in China [2]. Improving the soil nitrogen pool can reduce nitrogen fertilizer application, improve soil nitrogen supply potential, and protect the environment from the negative impacts of nitrogen loss [3]. Crop straw is rich in nutrients, and returning straw to the field can add additional nitrogen into the soil, increase nitrogen storage in the soil, and affect the soil nitrogen pool and soil productivity [4,5,6]. The authors of [7] reported that compared with no straw return, rice straw return could increase the soil available nitrogen content by 27.5% and total nitrogen content by 10.8%, an effect that was more obvious in the 0–20 cm soil layer. The authors of [8] also reported that wheat straw return could promote nitrogen fixation, improve soil nitrogen accumulation, and reduce total gaseous nitrogen loss. The authors of [9] showed that continuous straw return could improve soil total nitrogen content, but that total nitrogen content did not gradually increase as straw return years increased.
Total nitrogen (TN) can be used to measure the size of the soil nitrogen pool, but it cannot fully reflect its quality and characterize its changes [5]. In contrast, soil active nitrogen components are more sensitive to farming management and are an important indicator of soil nitrogen pool changes [10,11,12]. The soil particulate fraction primarily consists of partially degraded plant fragments. The activity of particulate nitrogen (PN) in soil particulate fraction is between active organic nitrogen and inert organic nitrogen, which is sensitive to management measures [13,14] and has received extensive attention due to its close relationship with soil nitrogen supply capacity and nitrogen mineralization [11,15,16]. Mineral-associated nitrogen (MN) is a stable component and is an important factor in determining the ability of soil to continuously and steadily supply nitrogen [13,17]. The soil light fraction is primarily composed of newly synthesized organic matter. Light fraction nitrogen (LFN) in the light fraction has strong biological activity and is the source of mineralizable nitrogen in the soil, which is extremely sensitive to changes in management measures [12,18]. Heavy fraction nitrogen (HFN) is a stable component, and a sink of mineralizable nitrogen in the soil. The authors of [11] suggested that increasing carbon and nitrogen content in soil particulate fractions could be key to enhancing long-term sustainable soil use in intensive cropping fields. Straw return significantly affected the content of soil nitrogen components. In a study by the authors of [19], the authors conducted a 22-year experiment on black soil in northeast China. They found that straw return combined with N, P, and K fertilizer significantly improved soil PN content and PN/TN ratio compared with N, P, and K fertilizer treatment. The authors of [13] demonstrated that straw return under conventional tillage increased the PN content of the 0–20 cm soil but had no significant effect on the MN content. The authors of [20] reported that straw return significantly increased soil LFN content. The authors of [21] showed that straw return led to a decrease in the proportion of LFN in soil nitrogen and an increase in the proportion of HFN. An in-depth study of the distribution and change of different nitrogen components in farmland soil can more accurately evaluate the nitrogen supply capacity of the soil and clarify the mechanism of soil nitrogen pool change.
Multiple cropping systems can improve the utilization rate of cultivated land and guarantee grain yield. In the rice–wheat cropping system in China, the intensified rice–wheat cropping system guarantees sustainably high and stable crop yields. However, soil fertilizer is also expensive and causes soil degradation [22]. Establishing a reasonable straw management system is important for improving the quality of the soil nitrogen pool, enhancing the soil nitrogen supply capacity, and implementing sustainable agricultural development in a rice–wheat cropping system. Some previous studies have examined the effects of straw return on soil total nitrogen [23,24], but few studies have assessed the effects of straw returning years on nitrogen components such as LFN, HFN, PN, and MN in this area. Variations in the characteristics of each nitrogen component as straw return years increase remain unclear. This study will clarify the distribution characteristics of soil nitrogen among different components by comparing the distribution characteristics and variation of soil TN, LFN, HFN, PN, and MN under different treatments of years of straw return. Additionally, we analyzed the relationship of content and variation between total nitrogen and nitrogen components to provide a theoretical basis for establishing a reasonable straw return system in the rice–wheat cropping area.
2. Materials and Methods
2.1. Site Description
The experiment was conducted at Yangzhou University, Jiangsu Province, China (32°23′ N, 119°25′ E) from 2010 to 2018, using a rice–wheat rotation field where straw return had not been applied. This area has a subtropical monsoon climate, with a total accumulated temperature of 2519 °C, total precipitation of 679 mm, and total sunshine duration of 1142 h from late October 2016 to late May 2017 (the whole wheat growth period). From the end of October 2017 to the end of May 2018 (the whole wheat growth period), the total accumulated temperature was 2398 °C, the total precipitation was 445 mm, and the total sunshine duration was 1261 h. The predominant soil was classified as a Stagnic Anthrosol [25]. Soil samples were obtained from the 0–20 cm soil layer in 2010 and provided estimates for basic soil properties: bulk density (1.45 g cm−3); pH in H2O (7.21); and dry soil contents of SOC (15.73 g kg−1), total N (TN, 1.24 g kg−1), available potassium (16.32 mg kg−1), and available phosphorus (146.12 mg kg−1). Rice–wheat is the dominant cropping system in this area.
2.2. Experimental Design
The experiment included eight treatments in 2017: no straw returning (NR) and one (SR1), two (SR2), three (SR3), four (SR4), five (SR5), six (SR6), and seven (SR7) consecutive years of rice straw returning. In 2018, there were eight (SR8) consecutive years of straw returning. Each treatment was established with a completely randomized block design with three repetitions. For each straw return treatment, an annual amount of 9000 kg/hm2 (fresh weight) rice residue was applied to a soil depth of 10 cm. Wheat straw was removed after harvest for paper making.
The wheat variety used was Yangfumai 4. The total amount of nitrogen applied during wheat growth was 240 kg/hm2, of which 50% was applied as basal fertilizer, 10% was applied during the tillering stage, 20% was applied during the jointing stage, and 20% was applied during the booting stage. Phosphate fertilizer (P2O5) and potassium fertilizer (K2O) were applied in amounts of 90 kg/hm2, and 150 kg/hm2, respectively, where 50% of each fertilizer was applied as a base fertilizer and the other 50% was applied during the jointing stage. The fertilization regime for the rice crop was the same as that of wheat, except that 150 kg/hm2 of urea was applied at the tiller and booting stages.
2.3. Sampling and Analysis
Soil samples (5 sample replicates at the same depth per plot were mixed into one sample) were obtained from the 0–5, 5–10, and 10–20 cm soil after wheat harvest in May 2017 and May 2018. TN content was determined by the Sei-micro Kjeldahl Method [26]. PN was determined using the 5 g/L sodium hexametaphosphate dispersion method [27], and MN was the difference between TN and PN. LFN was determined using the density grouping method [28], and HFN was the difference between TN and LFN.
The variation rate (%) was adopted for the sensitivity analysis of TN and its components to straw return, which was calculated using Equation (1) as follows [29]:
where variation rate is the variation rate of contents of TN or its components to a certain depth; Ci is the concentration of TN or its components at layer “i” (i = 1, 2, and 3, represent 0–5, 5–10, and 10–20 cm, respectively); Ci,NR is the concentration of TN or its components in NR at layer “i.”
The grain yield was determined at a water content of 12% after manually harvesting the three central areas from each plot with an area of 1.2 m2.
2.4. Statistical Analyses
The data presented in this study come from mean values collected in 2017 and 2018 at depths of 0–5, 5–10, and 10–20 cm. Statistical calculations and analyses were performed using Excel 2013 and SPSS 17.0. The differences of soil TN, LFN, HFN, PN, and MN contents under different treatments at the same soil layer and at different soil layers under the same treatment were tested by a one-way analysis of variance (ANOVA) with a least-significant difference (LSD). The Pearson coefficient was used for correlation analysis between the contents or variation of TN and LFN, HFN, PN, and MN. Linear regression analysis was used to quantify the relationship between wheat yield and the contents of TN and LFN, HFN, PN, and MN.
3. Results
3.1. Soil Total Nitrogen
Soil TN content in each treatment decreased as soil depth increased (Figure 1), and significant differences were found among all soil layers under each treatment except between the 0–5 cm and 5–10 cm soil layer under SR4 treatment in 2017 and between the 0–5 cm and 5–10 cm soil layer under SR7 treatment in 2018 (p < 0.05), which was mainly due to the nitrogen absorption of wheat roots in the 5–20 cm soil layer being higher than in the 0–5 cm soil, and the distribution density of straw in the 10–20 cm soil was higher than in the 0–5 cm and 5–10 cm soil. In 2017, the TN content in all soil layers increased with the increase in straw return years. Compared with NR, the TN content of SR1-SR7 treatments increased by 1.75–26.62% in the 0–5 cm soil layer, 3.49–33.59% in the 5–10 cm soil layer, and 6.60–38.10% in the 10–20 cm soil layer. In 2018, the TN content in each soil layer increased with the increase in straw return years, primarily due to the input of extra nitrogen into the soil by straw return. Compared with NR, the TN content of SR6 and SR8 treatment increased by 19.45% and 22.00% in the 0–5 cm soil layer, 26.12% and 28.62% in the 5–10 cm soil layer, and 19.79% and 22.48% in the 10–20 cm soil layer. This indicates that the growth rate decreased since SR6, which was primarily related to the increase in nitrogen decomposition.
3.2. LFN and HFN
Compared with NR in 2017 (Figure 2), the LFN content in the SR1-SR7 treatments changed by −2.37–114.23% in the 0–5 cm soil layer, 10.22–150.73% in the 5–10 cm soil layer, and 3.29–115.34% in the 10–20 cm soil layer. Significant differences were found since SR3 in the 0 ~ 5 cm and 10 ~ 20 cm soil layers, and since SR1 in the 5 ~ 10 cm soil layer (p < 0.05). In 2018, compared with NR, the LFN content of SR6 and SR8 increased by 100.23% and 141.26% in the 0–5 cm soil layer, 114.02% and 142.82% in the 5–10 cm soil layer, and 90.73% and 105.04% in the 10–20 cm soil layer, respectively. This indicates that the growth rate of LFN at 10–20 cm decreased since SR6.
The content of soil HFN decreased as soil depth increased, and significant differences were found among all soil layers under each treatment except between the 0–5 cm and 5–10 cm soil layer under SR4 treatment in 2017 and between the 0–5 cm and 5–10 cm soil layer under SR7 treatment in 2018 (p < 0.05). Compared with NR in 2017, the HFN content of SR1-SR7 treatments increased by 1.90–23.24% in the 0–5 cm soil layer, 3.24–29.32% in the 5–10 cm soil layer, and 3.24–29.32% in the 10–20 cm soil layer. In 2018, compared with NR, the HFN content of SR6 and SR8 increased by 16.59% and 17.78% in the 0–5 cm soil layer, 22.91% and 24.66% in the 5–10 cm soil layer, and 17.50% and 19.82% in the 10–20 cm soil layer, respectively. This indicates that the growth rate decreased since SR6.
3.3. PN and MN
In 2017, the PN content of each treatment first increased and then decreased as the soil depth increased (Figure 3), and significant differences were found between the 5–10 cm and 10–20 cm soil layer under each treatment and between the 0–5 cm and 5–10 cm soil layer under NR, SR4, SR6, and SR7 (p < 0.05). The PN content in each soil layer increased as the straw return years increased. Compared with NR, the PN content of SR1-SR7 treatments changed by 4.92–60.38% in the 0–5 cm soil layer, 1.81%-73.94% in the 5–10 cm soil layer, and −4.34–79.97% in the 10–20 cm soil layer. In 2018, as the straw return years increased, the PN content in each soil layer showed an increasing trend. Compared with NR, the PN content of SR6 and SR8 increased by 34.28% and 47.35% in the 0–5 cm soil layer, 52.59% and 60.68% in the 5–10 cm soil layer, and 42.25% and 64.66% in the 10–20 cm soil layer, respectively. This indicates that the rate of PN increase in the 5–10 cm soil layer decreased since SR6.
The MN content of each treatment decreased as the soil depth increased, and significant differences were found among each soil layer under each treatment in both years (p < 0.05). However, as the straw return years increased, the MN content in each soil layer increased. Compared with NR, the MN content of the SR1-SR7 treatments increased by 1.14–20.38% in the 0–5 cm soil layer, 3.88–24.14% in the 5–10 cm soil layer, and 9.31–27.71% in the 10–20 cm soil layer in 2017. In 2018, compared with NR, the MN content of SR6 and SR8 increased by 16.13% and 16.33% in the 0–5 cm soil layer, 19.57% and 21.49% in the 5–10 cm soil layer, and 14.20% and 12.01% in the 10–20 cm soil layer, respectively. This indicates that the MN growth rate decreased since SR6, and that the MN content of SR7 and SR8 in the 10–20 cm soil layer was lower than that of SR6.
3.4. Variation of TN and Its Components
Pearson correlation coefficients of LFN, HFN, PN, and MN contents with TN contents were 0.945, 0.999, 0.755, and 0.965 (p < 0.01) in 2017, and 0.906, 0.997, 0.730, and 0.950 (p < 0.01) in 2018, respectively (Table 1). This indicates that these four components can be used as indicators of total nitrogen change.
As shown in Table 2, the variation of TN, LFN, HFN, PN and MN were 1.75–38.10%, −2.37–150.73%, 1.90–35.61%, −5.63–79.97%, and 1.14–27.71%, respectively. The soil LFN varied more than soil TN and HFN, PN, and MN in the 0~20 cm soil layer, which showed the highest sensitivity to straw returning years, followed by PN. The sensitivity of HFN and MN was low. The variation of soil TN was significantly correlated with that of LFN, HFN, PN, and MN (p < 0.01) (Table 2). The correlation with HFN variation was the highest, with Pearson coefficients of 0.999 (2017) and 0.995 (2018); followed by MN, with Pearson coefficients of 0.983 (2017) and 0.923 (2018); LFN, with Pearson coefficients of 0.968 (2017) and 0.916 (2018); and PN, with Pearson coefficients of 0.957 (2017) and 0.891 (2018).
3.5. Wheat Yield
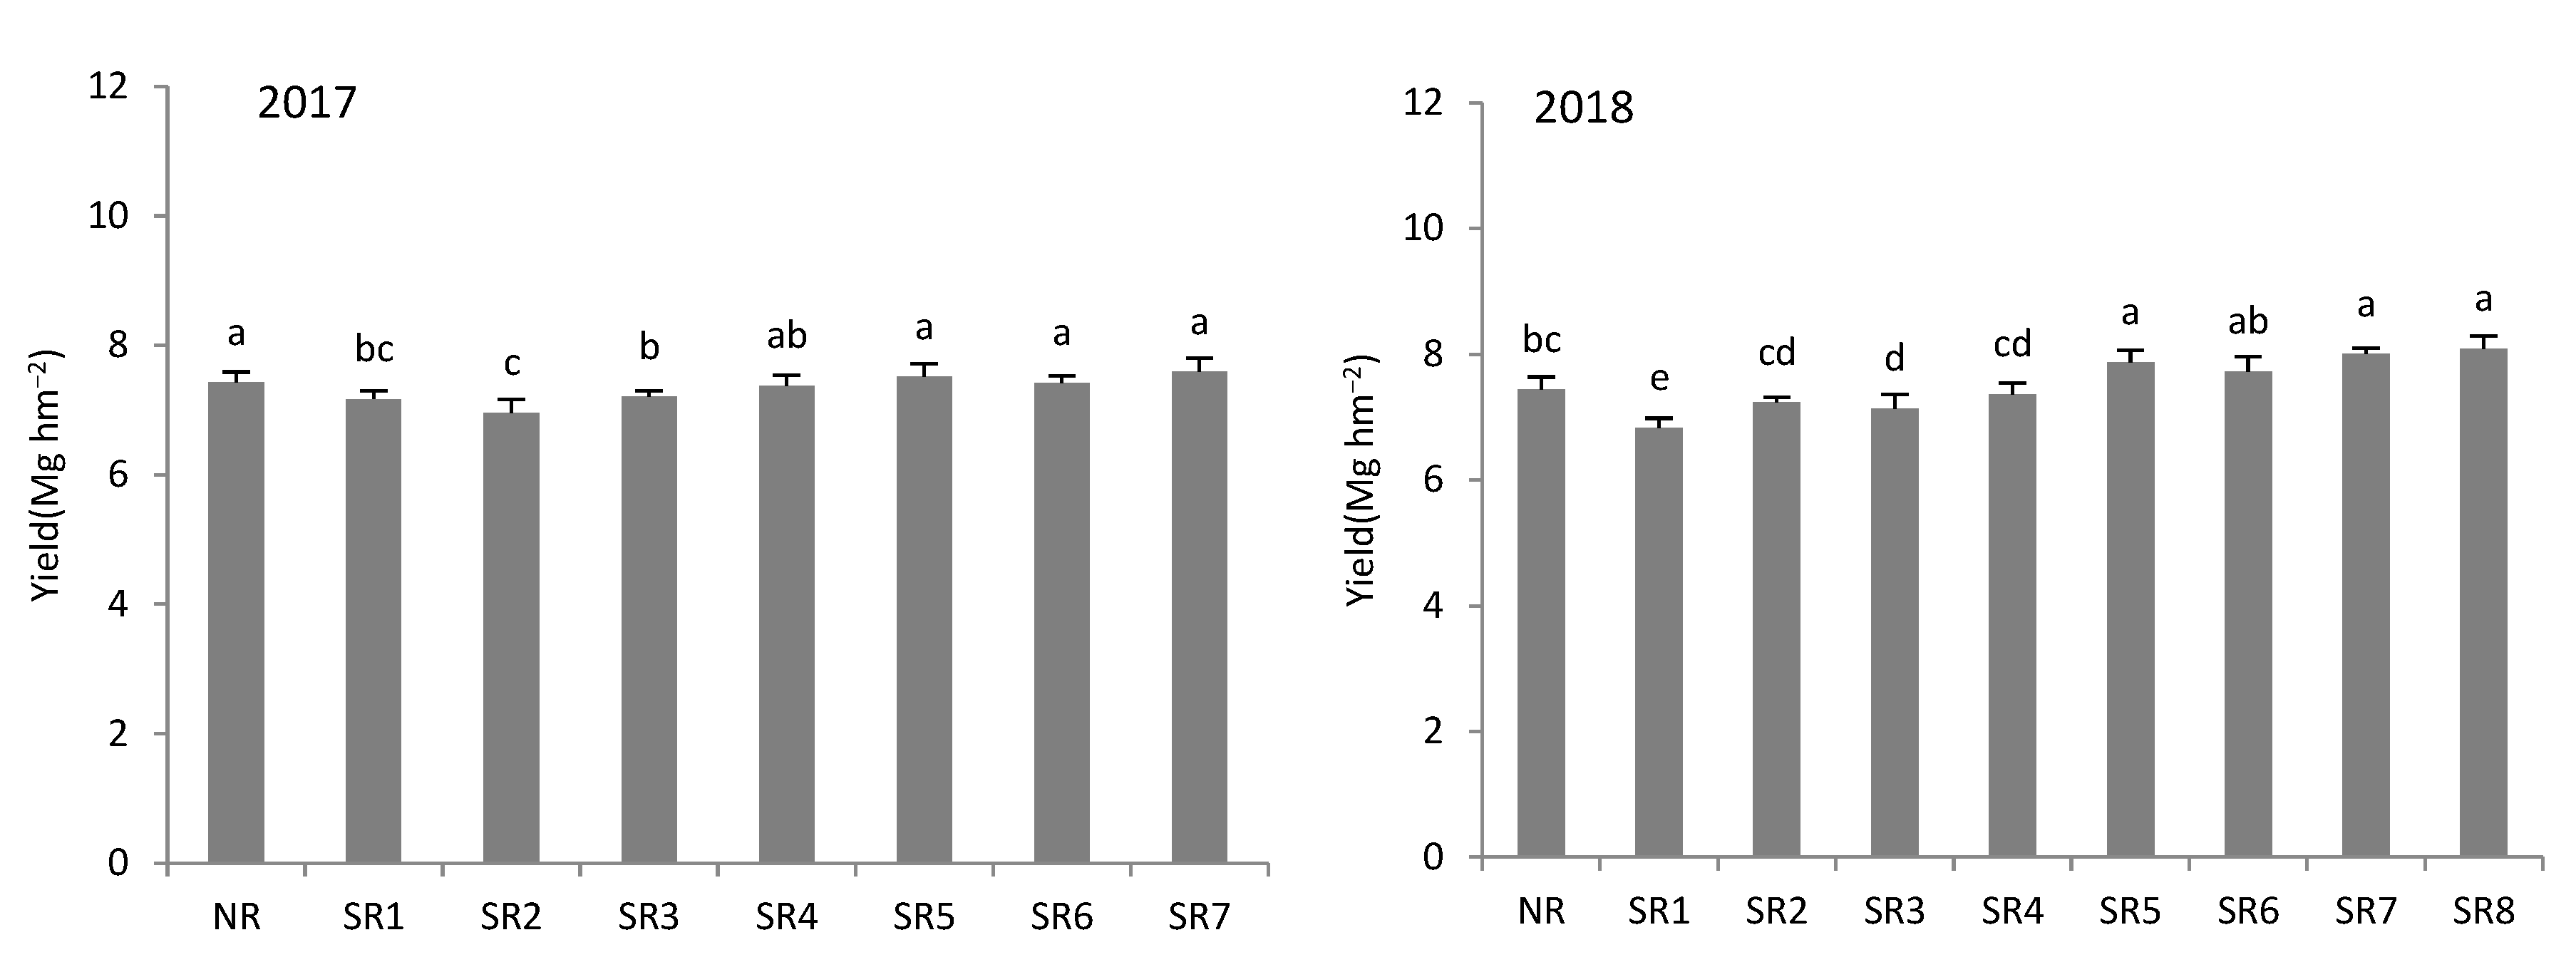
With the increase in straw return years, wheat yield first decreased and then increased (Figure 4). This may be because when the term of straw return was short (1 or 2 years), the straw could not be completely decomposed into organic matter, and the residual crude fiber in the soil affected the growth of seedlings, resulting in a decrease in yield. With the extension of straw return years, straw gradually degraded into soil and improved soil fertility, and finally increased the wheat yield. The results of correlation analysis showed that there were significant positive correlations between wheat yield and the contents of TN, LFN, HFN, PN, and MN (Table 3). The results of linear regression analysis showed that among the nitrogen components, the increase in LFN content had the highest contribution to the increase in wheat yield, followed by PN, which may be mainly related to the activity of each nitrogen component.
4. Discussion
4.1. The Effect of Straw Return Years on Soil TN
Soil nitrogen content is affected by exogenous nitrogen input, crop root absorption, nitrogen decomposition intensity, and leaching loss [17,30]. Straw return can effectively increase TN content in tillage soil [13,31]. This experiment demonstrated that straw return could effectively increase the TN content in tillage soil (0–20 cm), and that soil TN content increased as return years increased. This is mainly due to the additional nitrogen added to the soil by humus and other substances generated after the decomposition of returning straw. This mostly exists in organic form [32] and cannot be directly absorbed and utilized by crops, making it easy to accumulate and store in the soil. As a result, the TN content kept increasing as the straw return years increased. After six years of straw returning, the growth rate of soil TN content gradually decreased. On the one hand, some soil nitrogen was gradually degraded and absorbed by crops. On the other hand, soil microbial biomass and activity continuously increased as the straw return years increased [33], promoting nitrogen decomposition. This decreases the growth rate of nitrogen content, which is consistent with the results of [34]. In 2017, the soil total nitrogen content in the 10–20 cm soil under SR2 and SR5 treatments was lower than under the SR1 and SR4 treatments, respectively, for reasons that remain unclear. Compared with NR, a significant difference was found in TN content at each soil layer after 1–3 a of straw return (p < 0.05), indicating that straw returning could increase soil total nitrogen content in the short term, as suggested by the authors of [35].
4.2. The Effect of Straw Return Years on Soil Nitrogen Components
The light fraction is the most active component in soil, and nitrogen in the light fraction is easily affected by crops, the external environment, tillage management, and other external factors that can quickly reflect the effect of straw return on soil nitrogen [12,36]. The results of this study demonstrate that the LFN content in each treatment gradually decreased as soil depth increased, primarily because nitrogen uptake by wheat roots from the 5–10 cm soil layer was higher than that from the 0–5 cm soil layer, while the straw distribution density in the 10–15 cm soil layer was lower than in the 0–5 cm and 5–10 cm soil layer, leading to a lower input of exogenous LFN than in the upper soil layer. As a result, LFN activity was high, and easily leached to deeper soil [37]. The LFN content in each soil layer increased as the straw return years increased, which is mainly caused by the continuous input of additional active nitrogen into the soil after the straw decomposes [38]. The rate of LFN content increase in the 10–20 cm soil layers slowed down after six years of straw return (SR7 and SR8), which could be related to increases in soil organic carbon and total nitrogen content due to straw return. This led to increases in soil microbial biomass and activity, promoting the decomposition and utilization of LFN [39]. HFN is a relatively stable nitrogen component in soil, and primarily comes from the conversion of nitrogen-containing substances that are difficult for crops to absorb and utilize and can decompose by mineralization, such as cellulose and lignin in straw and active nitrogen in the soil [21]. As the straw return years increased, soil HFN content gradually increased. However, the increase rate decreased, mainly because straw returning increased soil nitrogen supply but soil microbial biomass and activity also gradually increased [33]. This improved the decomposition of HFN.
PN activity is between active organic nitrogen and inert organic nitrogen, and quickly responds to farm management [17,40]. This study demonstrated that as soil depth increased, the PN content of each treatment in 2017 and SR6-SR8 treatments in 2018 first increased and then decreased (Figure 3), which was mainly related to the depth of straw distribution. This inter-annual difference could be related to meteorological conditions and crop growth. The humus and polysaccharides produced by the decomposition of straw have an adhesive effect, which can promote the aggregation of soil clay particles into form particles and the aggregation of small particles into large particles, which promotes the transfer of soil nitrogen to the particle group and improves PN stability [41]. As the straw return years increase, the humus produced by straw decomposition increases. The formation and protection of soil particle components strengthened, gradually increasing soil PN content. When straw returning years were longer, the growth rate of soil PN content in soil tended to decrease. This could be related to enhanced soil microbial activity, which increased the decomposition intensity. Soil MTN content increased as the straw return years increased, mainly because straw returning increased soil nitrogen input. In 2018, the MTN content growth rate slowed down as straw return years increased. This was mainly due to the transfer of nitrogen to particle components and the increase in soil microbial biomass and activity as straw return years increased, which improved MTN decomposition. In 2018, the PN content of the SR3 treatment exceeded that of the SR2 and SR4 treatments, though the specific reasons for this require further study.
4.3. Relationship between TN and Its Components
Studies have shown that the soil TN content is significantly correlated with the content of nitrogen components such as LFN and PN, and that the active nitrogen component is a sensitive indicator of how soil management affects nitrogen [21,41]. The results demonstrated that the contents of LFN, HFN, PN, and MN soil were significantly correlated with TN content, indicating that all of these nitrogen components could be used as indicators of total nitrogen changes. The correlation coefficient between the variation of HFN and MN and the variation of TN content exceeded that of LFN and PN. This was primarily due to the low content and strong activity of LFN and PN, which resulted in a large change to their content. In contrast, the proportion of HFN and MN contents in TN were high, and the changing trend was similar to TN. However, the variation of HFN and MN was much lower than that of LFN and PN, while the variation of LFN and its correlation coefficient with the variation of TN were higher than those of PN. This indicates that changes in the LFN content were the most obvious after changes in the straw return years, making it the best indicator to reflect changes in TN content affected by straw return years, followed by PN.
5. Conclusions
As the straw return years increased, the TN content in the 0–20 cm soil layer gradually increased, and SR1-SR8 treatments increased by 4.81–28.62% compared with NR. The contents of LFN, HFN, PN, and MN in soil increased as straw return years increased, and the growth rate of LFN and PN exceeded that of HFN and MN. After six years of straw return, the growth rate of soil TN, HFN, and MN content at each soil layer gradually decreased, after which the amount of straw return can be reduced. The content and variation of soil TN were significantly correlated with those of TN, HFN, PN, and MN. Of these, LFN showed the highest variation, indicating that LFN had the highest sensitivity to straw return years and was the best indicator of the effect of straw return on soil nitrogen, followed by PN. In addition, wheat yield was positively correlated with the contents of TN, LFN, HFN, PN, and MN, among which the increase in LFN content had the highest contribution to the increase in wheat yield, followed by PN.
Author Contributions
Data curation, S.C.; formal analysis, S.C.; resources, X.Z.; writing—original draft, S.C.; writing—review and editing, G.C. All authors have read and agreed to the published version of the manuscript.
Funding
This research was partially funded by the Science and Technology Innovation Project of the Chinese Academy of Agricultural Sciences (Agricultural Academy Office (2014) No. 216) and the National Key R&D Program of China (2018YFD0200500).
Institutional Review Board Statement
Not applicable.
Informed Consent Statement
Not applicable.
Data Availability Statement
The data presented in this study are available on reasonable request from the corresponding author.
Acknowledgments
We thank the editor and two anonymous reviewers for their insightful comments on the manuscript.
Conflicts of Interest
The authors declare no conflict of interest.
References
- Zhang, Y.; Xie, D.; Ni, J.; Zeng, X. Conservation tillage practices reduce nitrogen losses in the sloping upland of the Three Gorges Reservoir area: No-till is better than mulch-till. Agric. Ecosyst. Environ. 2020, 300, 107003. [Google Scholar] [CrossRef]
- Wang, Y.; Lu, Y.; Yuan, J.; Zhen, G. Evaluating the risks of nitrogen fertilizer-related grain production processes to ecosystem health in China. Resour. Conserv. Recycl. 2022, 177, 105982. [Google Scholar] [CrossRef]
- Gai, X.P.; Liu, H.B.; Yang, B.; Wang, H.Y.; Zhai, L.M.; Lei, Q.L.; Wu, S.X.; Ren, T.Z. Responses of crop yields, soil carbon and nitrogen stocks to additional application of organic materials in different fertilization years. Sci. Agric. Sin. 2019, 52, 676–689, (In Chinese with English Abstract). [Google Scholar]
- Jug, D.; Đurđević, B.; Birkás, M.; Brozović, B.; Lipiec, J.; Vukadinović, V.; Jug, I. Effect of conservation tillage on crop productivity and nitrogen use efficiency. Soil Tillage Res. 2019, 194, 104327. [Google Scholar] [CrossRef]
- Pu, C.; Kan, Z.; Liu, P.; Ma, S.; Qi, J.; Zhao, X.; Zhang, H. Residue management induced changes in soil organic carbon and total nitrogen under different tillage practices in the North China Plain. J. Integr. Agric. 2019, 18, 1337–1347. [Google Scholar] [CrossRef]
- Huang, T.; Yang, N.; Lu, C.; Qin, X.; Siddique, K.H.M. Soil organic carbon, total nitrogen, available nutrients, and yield under different straw returning methods. Soil Tillage Res. 2021, 214, 105171. [Google Scholar] [CrossRef]
- Zhang, P.; Chen, X.; Wei, T.; Yang, Z.; Jia, Z.; Yang, B.; Han, Q.; Ren, X. Effects of straw incorporation on the soil nutrient contents, enzyme activities, and crop yield in a semiarid region of China. Soil Tillage Res. 2016, 160, 65–72. [Google Scholar] [CrossRef]
- Cao, Y.; Sun, H.; Zhang, J.; Chen, G.; Zhu, H.; Zhou, S.; Xiao, H. Effects of wheat straw addition on dynamics and fate of nitrogen applied to paddy soils. Soil Tillage Res 2018, 178, 92–98. [Google Scholar] [CrossRef]
- Yang, J.; Gao, W.; Ren, S. Long-term effects of combined application of chemical nitrogen with organic materials on crop yields, soil organic carbon and total nitrogen in fluvo-aquic soil. Soil Till Res. 2015, 151, 67–74. [Google Scholar] [CrossRef]
- Martínez, J.M.; Galantini, J.A.; Duval, M.E.; López, F.M. Tillage effects on labile pools of soil organic nitrogen in a semi-humid climate of Argentina: A long-term field study. Soil Tillage Res. 2017, 169, 71–80. [Google Scholar] [CrossRef]
- Desrochers, J.; Brye, K.R.; Gbur, E.; Pollock, E.D.; Savin, M.C. Carbon and nitrogen properties of particulate organic matter fractions in an Alfisol in the mid-southern, USA. Geoderma Reg. 2019, 20, e00248. [Google Scholar] [CrossRef]
- Andruschkewitsch, R.; Geisseler, D.; Koch, H.; Ludwig, B. Effects of tillage on contents of organic carbon, nitrogen, water-stable aggregates and light fraction for four different long-term trials. Geoderma 2013, 192, 368–377. [Google Scholar] [CrossRef]
- Pu, C.; Liu, P.; Kan, Z.R.; Qi, J.Y.; Ma, S.T.; Zhao, X.; Zhang, H.L. Effects of tillage and straw mulching on soil total nitrogen and its components in north China plain. Trans. CSAE 2018, 34, 160–166, (In Chinese with English Abstract). [Google Scholar]
- Domínguez, G.F.; Diovisalvi, N.V.; Studdert, G.A.; Monterubbianesi, M.G. Soil organic C and N fractions under continuous cropping with contrasting tillage systems on mollisols of the southeastern Pampas. Soil Tillage Res. 2009, 102, 93–100. [Google Scholar] [CrossRef]
- Guo, S.; Zhai, L.; Liu, J.; Liu, H.; Chen, A.; Wang, H.; Wu, S.; Lei, Q. Cross-ridge tillage decreases nitrogen and phosphorus losses from sloping farmlands in southern hilly regions of China. Soil Tillage Res. 2019, 191, 48–56. [Google Scholar] [CrossRef]
- Desrochers, J.; Brye, K.R.; Gbur, E.; Pollock, E.D.; Savin, M.C. Long-term residue and water management practice effects on particulate organic matter in a loessial soil in eastern Arkansas, USA. Geoderma 2019, 337, 792–804. [Google Scholar] [CrossRef]
- Qi, J.Y.; Wang, X.; Pu, C.; Ma, S.T.; Zhao, X.; Xue, J.F.; Zhang, H.L. Research advances on effects of conservation tillage practice on soil nitrogen component. Trans. CSAE 2018, 34, 222–229, (In Chinese with English Abstract). [Google Scholar]
- Li, X.; Yang, T.; Hicks, L.C.; Hu, B.; Liu, X.; Wei, D.; Wang, Z.; Bao, W. Latitudinal patterns of light and heavy organic matter fractions in arid and semi-arid soils. Catena 2022, 215, 106293. [Google Scholar] [CrossRef]
- Qiu, S.; Gao, H.; Zhu, P.; Hou, Y.; Zhao, S.; Rong, X.; Zhang, Y.; He, P.; Christie, P.; Zhou, W. Changes in soil carbon and nitrogen pools in a Mollisol after long-term fallow or application of chemical fertilizers, straw or manures. Soil Tillage Res. 2016, 163, 255–265. [Google Scholar] [CrossRef]
- Shu, X.; Zhu, A.N.; Zhang, J.B.; Chen, W.C.; Yang, W.L. Effects of Conservation Tillage on Organic Carbon and Nitrogen in Different Fractions of fluvo-aquic soil. Chin. J. Soil Sci. 2014, 45, 432–438, (In Chinese with English Abstract). [Google Scholar]
- Dong, L.L.; Wang, H.H.; Lu, Z.Y.; Jin, M.J.; Zhu, X.L.; Shen, Y.; Shen, M.X. 2019. Effects of straw returning amount and type on soil nitrogen and its composition. Chin. J. Appl. Ecol. 2019, 30, 1143–1150, (In Chinese with English Abstract). [Google Scholar]
- Hu, N.J.; Chen, Q.; Zhu, L.Q. Life cycle environmental impact assessment on rice-winter wheat rotation system in the middle and lower reaches of Yangtze River: A case study of Nanjing, Jiangsu province. Resour. Environ. Yangtze Basin 2019, 28, 1111–1120, (In Chinese with English Abstract). [Google Scholar]
- Zhang, S.; Zhang, G.; Wang, D.; Liu, Q. Abiotic and biotic effects of long-term straw retention on reactive nitrogen runoff losses in a rice–wheat cropping system in the Yangtze Delta region. Agric. Ecosyst. Environ. 2021, 305, 107162. [Google Scholar] [CrossRef]
- Zhang, W.; Chen, X.; Wang, H.; Wei, W.; Zhou, J. Long-term straw return influenced ammonium ion retention at the soil aggregate scale in an Anthrosol with rice-wheat rotations in China. J. Integr. Agr 2022, 21, 521–531. [Google Scholar] [CrossRef]
- Gong, Z.T.; Zhang, G.L.; Chen, Z.C. Pedogenesis and Soil Taxonomy; Sciences Press: Beijing, China, 2007. (In Chinese) [Google Scholar]
- Shidan, B. Soil Agro-Chemistrical Analysis, 3rd ed.; China Agriculture Press: Beijing, China, 2000; (In Chinese with English Abstract). [Google Scholar]
- Lee, J.H. An overview of phytoremediation as a potentially promising technology for environmental pollution control. Biotechnol Bioproc 2013, 18, 431–439. [Google Scholar] [CrossRef]
- Roscoe, R.; Buurman, P. Tillage effects on soil organic matter in density fractions of a Cerrado Oxisol. Soil Tillage Res. 2003, 70, 107–119. [Google Scholar] [CrossRef]
- Plaza-Bonilla, D.; Álvaro-Fuentes, J.; Cantero-Martínez, C. Identifying soil organic carbon fractions sensitive to agricultural management practices. Soil Tillage Res. 2014, 139, 19–22. [Google Scholar] [CrossRef] [Green Version]
- Wang, J.G.; Lin, S.; Li, B.G. Nitrogen cycling and management strategies in chinese agriculture. Sci. Agric. Sin. 2016, 49, 503–517, (In Chinese with English Abstract). [Google Scholar]
- Liu, S.; Wang, M.; Yin, M.; Chu, G.; Xu, C.; Zhang, X.; Abliz, B.; Tang, C.; Wang, D.; Chen, S. Fifteen years of crop rotation combined with straw management alters the nitrogen supply capacity of upland-paddy soil. Soil Tillage Res. 2022, 215, 105219. [Google Scholar] [CrossRef]
- Liu, X.; Dong, W.; Jia, S.; Liu, Q.; Li, Y.; Hossain, M.E.; Liu, E.; Kuzyakov, Y. Transformations of N derived from straw under long-term conventional and no-tillage soils: A 15N labelling study. Sci. Total Env. 2021, 786, 147428. [Google Scholar] [CrossRef]
- Chen, H.; Liang, Q.; Gong, Y.; Kuzyakov, Y.; Fan, M.; Plante, A.F. Reduced tillage and increased residue retention increase enzyme activity and carbon and nitrogen concentrations in soil particle size fractions in a long-term field experiment on Loess Plateau in China. Soil Tillage Res. 2019, 194, 104296. [Google Scholar] [CrossRef]
- Wang, S.L.; Wang, H.; Li, J.; Lv, W.; Chen, L.L.; Li, J. Effects of long-term straw mulching on soil organic carbon, nitrogen and moisture and spring maize yield on rain-fed croplands under different patterns of soil tillage practice. Chin. J. Appl. Ecol. 2016, 27, 1530–1540, (In Chinese with English Abstract). [Google Scholar]
- Zhang, D.; Fu, B.; Hu, W.L.; Zhai, L.M.; Liu, H.B.; Chen, A.Q.; Gai, X.P.; Zhang, Y.T.; Liu, J.; Wang, H.Y. Increasing soil nitrogen fixation capacity and crop yield of rice-rape rotation by straw returning. Trans. CSAE 2017, 33, 133–140, (In Chinese with English Abstract). [Google Scholar]
- Zhao, F.; Zhang, L.; Sun, J.; Ren, C.; Han, X.; Yang, G.; Pang, G.; Bai, H.; Wang, J. Effect of Soil C, N and P Stoichiometry on Soil Organic C Fractions, After Afforestation. Pedosphere 2017, 27, 705–713. [Google Scholar] [CrossRef]
- Wang, J. Mechanistic Insights into the Role of Sol Nitrogen Transformation Processes in Regulating Soil Nitrogen Fate; Normal University: Nanjing, China, 2017; (In Chinese with English Abstract). [Google Scholar]
- Zhang, J. Effects of Incorporation of Straw, Lignin and Biochar on Organic Carbon, Nitrogen and Microbial Diversity; Chinese Academy of Agricultural Sciences: Beijing, China, 2015; (In Chinese with English Abstract). [Google Scholar]
- Hao, M.; Hu, H.; Liu, Z.; Dong, Q.; Sun, K.; Feng, Y.; Li, G.; Ning, T. Shifts in microbial community and carbon sequestration in farmland soil under long-term conservation tillage and straw returning. Appl. Soil Ecol. 2019, 136, 43–54. [Google Scholar] [CrossRef]
- Jilling, A.; Kane, D.; Williams, A.; Yannarell, A.C.; Davis, A.; Jordan, N.R.; Koide, R.T.; Mortensen, D.A.; Smith, R.G.; Snapp, S.S.; et al. Rapid and distinct responses of particulate and mineral-associated organic nitrogen to conservation tillage and cover crops. Geoderma 2020, 359, 114001. [Google Scholar] [CrossRef]
- Zhang, H.; Zhang, Y.; Yan, C.; Liu, E.; Chen, B. Soil nitrogen and its fractions between long-term conventional and no-tillage systems with straw retention in dryland farming in northern China. Geoderma 2016, 269, 138–144. [Google Scholar] [CrossRef]
Figure 1.
Depth distribution of soil total N concentrations with different treatments of straw return years. NR, no straw retention; SR1-SR8 is straw retention treatment for 1–8 years, respectively. Different letters over bars indicate a significant difference between treatments at the same soil depth at p < 0.05.

Figure 2.
Depth distribution of soil LFN and HFN concentrations with different treatments of straw return years. Different letters over bars indicate a significant difference between treatments at the same soil depth at p < 0.05.
Figure 2.
Depth distribution of soil LFN and HFN concentrations with different treatments of straw return years. Different letters over bars indicate a significant difference between treatments at the same soil depth at p < 0.05.

Figure 3.
Depth distribution of soil PN and MN concentrations with different treatments of straw return years. Different letters over bars indicate a significant difference between treatments at the same soil depth at p < 0.05.
Figure 3.
Depth distribution of soil PN and MN concentrations with different treatments of straw return years. Different letters over bars indicate a significant difference between treatments at the same soil depth at p < 0.05.

Figure 4.
Wheat yield with different treatments of straw return years. Different letters over bars indicate a significant difference between treatments at p < 0.05.
Figure 4.
Wheat yield with different treatments of straw return years. Different letters over bars indicate a significant difference between treatments at p < 0.05.


Table 1.
Pearson correlation coefficients among soil TN contents and soil total nitrogen components.
Table 1.
Pearson correlation coefficients among soil TN contents and soil total nitrogen components.
| 2017 | 2018 | |||||||
|---|---|---|---|---|---|---|---|---|
| LFN | HFN | PN | MN | LFN | HFN | PN | MN | |
| TN | 0.945 ** | 0.999 ** | 0.755 ** | 0.965 ** | 0.906 ** | 0.997 ** | 0.730 ** | 0.950 ** |
Note: ** Pearson correlation is significant at the p < 0.01 level.
Table 2.
Variation of TN, LFTN, HFTN, PTN, and MTN with treatments of different straw retention years.
Table 2.
Variation of TN, LFTN, HFTN, PTN, and MTN with treatments of different straw retention years.
| Soil Depth/cm | Treatment | 2017 | 2018 | ||||||||
|---|---|---|---|---|---|---|---|---|---|---|---|
| TN/% | LFN/% | HFN/% | PN/% | MN/% | TN/% | LFN/% | HFN/% | PN/% | MN/% | ||
| 0–5 | NR | 0 | 0 | 0 | 0 | 0 | 0 | 0 | 0 | 0 | 0 |
| SR1 | 1.75 | −2.37 | 1.90 | 4.92 | 1.14 | 4.81 | 9.38 | 4.65 | −0.97 | 6.11 | |
| SR2 | 3.63 | 8.32 | 3.45 | 13.12 | 1.82 | 8.25 | 23.05 | 7.73 | 16.48 | 6.41 | |
| SR3 | 9.44 | 31.14 | 8.60 | 36.62 | 4.24 | 11.10 | 40.34 | 10.06 | 37.71 | 5.14 | |
| SR4 | 12.60 | 44.05 | 11.39 | 48.52 | 5.74 | 13.56 | 57.98 | 11.98 | 23.12 | 11.42 | |
| SR5 | 22.83 | 80.02 | 20.62 | 55.95 | 16.50 | 17.09 | 80.38 | 14.85 | 30.41 | 14.11 | |
| SR6 | 25.15 | 92.91 | 22.53 | 60.38 | 18.42 | 19.45 | 100.23 | 16.59 | 34.28 | 16.13 | |
| SR7 | 26.62 | 114.23 | 23.24 | 59.27 | 20.38 | 18.66 | 118.33 | 15.13 | 30.93 | 15.92 | |
| SR8 | / | / | / | / | / | 22.00 | 141.26 | 17.78 | 47.35 | 16.33 | |
| 5–10 | NR | 0 | 0 | 0 | 0 | 0 | 0 | 0 | 0 | 0 | 0 |
| SR1 | 3.49 | 10.21 | 3.24 | 1.81 | 3.88 | 6.86 | 3.91 | 6.96 | 0.66 | 8.39 | |
| SR2 | 6.59 | 24.73 | 5.93 | 8.23 | 6.20 | 13.49 | 17.88 | 13.33 | 10.34 | 14.27 | |
| SR3 | 17.14 | 49.70 | 15.95 | 30.67 | 13.97 | 18.82 | 51.85 | 17.62 | 26.92 | 16.82 | |
| SR4 | 23.93 | 80.10 | 21.89 | 49.01 | 18.06 | 20.57 | 65.88 | 18.92 | 22.27 | 20.14 | |
| SR5 | 28.77 | 110.10 | 25.81 | 51.50 | 23.45 | 20.35 | 96.36 | 17.58 | 27.63 | 18.55 | |
| SR6 | 31.75 | 123.57 | 28.40 | 66.47 | 23.61 | 26.12 | 114.02 | 22.91 | 52.59 | 19.57 | |
| SR7 | 33.59 | 150.73 | 29.32 | 73.94 | 24.14 | 29.38 | 142.82 | 25.25 | 61.30 | 21.49 | |
| SR8 | / | / | / | / | / | 28.62 | 137.22 | 24.66 | 60.68 | 20.69 | |
| 10–20 | NR | 0 | 0 | 0 | 0 | 0 | 0 | 0 | 0 | 0 | 0 |
| SR1 | 6.60 | 3.29 | 6.70 | −4.34 | 9.31 | 5.15 | 1.89 | 5.26 | −5.63 | 7.83 | |
| SR2 | 2.85 | 5.77 | 2.75 | 13.91 | 0.10 | 10.77 | 13.92 | 10.67 | 12.00 | 10.47 | |
| SR3 | 17.72 | 43.45 | 16.89 | 40.98 | 11.94 | 12.65 | 37.27 | 10.71 | 31.16 | 7.12 | |
| SR4 | 26.95 | 70.13 | 25.56 | 56.52 | 19.61 | 15.69 | 36.21 | 15.03 | 29.07 | 12.37 | |
| SR5 | 25.08 | 94.29 | 22.84 | 60.85 | 16.20 | 14.88 | 44.83 | 13.39 | 34.06 | 9.01 | |
| SR6 | 32.40 | 110.81 | 29.87 | 77.08 | 21.31 | 19.79 | 90.73 | 17.50 | 42.25 | 14.21 | |
| SR7 | 38.10 | 115.34 | 35.61 | 79.97 | 27.71 | 20.49 | 87.88 | 18.32 | 57.02 | 11.42 | |
| SR8 | / | / | / | / | / | 22.48 | 105.04 | 19.82 | 64.66 | 12.01 | |
| Pearson correlation coefficients | |||||||||||
| Variation of TN | 0.968 ** | 0.999 ** | 0.957 ** | 0.983 ** | / | 0.916 ** | 0.995 ** | 0.891 ** | 0.923 ** | ||
Note: ** Pearson correlation is significant at the p < 0.01 level.
Table 3.
Correlation and regression analysis between wheat yield and contents of TN, LFN, HFN, PN, and MN.
Table 3.
Correlation and regression analysis between wheat yield and contents of TN, LFN, HFN, PN, and MN.
| Soil Depth/cm | Nitrogen Components | Pearson’s Correlation Coefficients with Wheat Yield | Linear Regression Equation |
|---|---|---|---|
| 0–5 | TN | 0.672 ** | y = 1885.6x + 4.5381, R2 = 0.452 |
| LFN | 0.787 ** | y = 12,147.0x + 6.5195, R2 = 0.6201 | |
| HFN | 0.638 ** | y = 2159.5x + 4.2800, R2 = 0.4075 | |
| PN | 0.612 ** | y = 4377.3x + 6.1077, R2 = 0.374 | |
| MN | 0.666 ** | y = 2873.4x + 3.8914, R2 = 0.4434 | |
| 5–10 | TN | 0.644 ** | y = 1567.8x + 5.1708, R2 = 0.4147 |
| LFN | 0.772 ** | y = 11,461.0x + 6.5998, R2 = 0.5966 | |
| HFN | 0.610 ** | y = 1751.9x + 5.0326, R2 = 0.3722 | |
| PN | 0.720 ** | y = 4062.4x + 6.1620, R2 = 0.5185 | |
| MN | 0.554 * | y = 2244.8x + 4.8963, R2 = 0.3073 | |
| 10–20 | TN | 0.627 ** | y = 1695.4x + 5.2890, R2 = 0.3926 |
| LFN | 0.768 ** | y = 18,080.0x + 6.4977, R2 = 0.5894 | |
| HFN | 0.599 * | y = 1801.9x + 5.2476, R2 = 0.3585 | |
| PN | 0.692 ** | y = 3993.6x + 6.2658, R2 = 0.4829 | |
| MN | 0.491 * | y = 2133.2x + 5.3588, R2 = 0.2361 |
Note: * Pearson correlation is significant at the p < 0.05 level. ** Pearson correlation is significant at the p < 0.01 level. In the linear regression equation, x is the contents of soil nitrogen or its component, g kg−1; y is the yield of wheat, kg hm−2.
Publisher’s Note: MDPI stays neutral with regard to jurisdictional claims in published maps and institutional affiliations. |
© 2022 by the authors. Licensee MDPI, Basel, Switzerland. This article is an open access article distributed under the terms and conditions of the Creative Commons Attribution (CC BY) license (https://creativecommons.org/licenses/by/4.0/).
Share and Cite
MDPI and ACS Style
Cui, S.; Zhu, X.; Cao, G. Effects of Years of Rice Straw Return on Soil Nitrogen Components from Rice–Wheat Cropped Fields. Agronomy 2022, 12, 1247. https://0-doi-org.brum.beds.ac.uk/10.3390/agronomy12061247
AMA Style
Cui S, Zhu X, Cao G. Effects of Years of Rice Straw Return on Soil Nitrogen Components from Rice–Wheat Cropped Fields. Agronomy. 2022; 12(6):1247. https://0-doi-org.brum.beds.ac.uk/10.3390/agronomy12061247
Chicago/Turabian StyleCui, Siyuan, Xinkai Zhu, and Guangqiao Cao. 2022. "Effects of Years of Rice Straw Return on Soil Nitrogen Components from Rice–Wheat Cropped Fields" Agronomy 12, no. 6: 1247. https://0-doi-org.brum.beds.ac.uk/10.3390/agronomy12061247
Note that from the first issue of 2016, this journal uses article numbers instead of page numbers. See further details here.