Article

Little Potential of Spring Wheat Genotypes as a Strategy to Reduce Nitrogen Leaching in Central Europe

1
Agroscope. Route de Duillier 50, Nyon 1260, Switzerland
2
Instituto de Investigaciones en Biociencias Agrícolas y Ambientales (INBA-CONICET), Facultad de Agronomía, Universidad de Buenos Aires, Buenos Aires C1417DSE, Argentina
3
Swiss Federal Institute of Technology, Universitätstrasse 2, Zürich CH-8092, Switzerland
4
Hellenic Agricultural Organization DEMETER, N.AG.RE.F.-Industrial and Forage Crops Institute, 1, Theophrastou Str. 41335, Larissa 41335, Greece
*
Author to whom correspondence should be addressed.
Submission received: 25 January 2016 / Revised: 15 April 2016 / Accepted: 25 April 2016 / Published: 9 May 2016

Abstract

:
Nitrogen (N) losses negatively impact groundwater quality. Spring wheat genotypes varying in N-fertilizer recovery were studied (by using lysimeters) for their potential to minimize NO3-N leaching during spring and summer, over a three-year period. Additionally, we examined to what extent root growth and NO3-N leaching explain the well-known difference found between apparent and isotopic N recovery. The genotypes were grown under low (2 g m−2) and high (27 g m−2) N fertilizer supply. On average, the apparent and isotopic recoveries of N fertilizer by wheat were 43% and 51%, respectively. The three genotypes varied in fertilizer N recovery but not in NO3-N leaching, which only accounted for 15% of the applied N fertilizer. The differences in N uptake, fertilizer N recovery and root growth among the genotypes were not associated with the leached NO3-N because root growth and N uptake were not well synchronized with NO3-N leaching. Already at stem elongation 70% to 98% of the season-long NO3-N leaching had already taken place. Thus, the ability to minimize in-season NO3-N leaching by using spring wheat genotypes with higher fertilizer N recovery was limited because maximum N leaching occurred in the early crop season.

1. Introduction

Understanding the processes that affect the uptake and utilization of nitrogen (N) by wheat is of major importance because these processes determine grain yield, quality, production costs, and the environmental burden of wheat cropping. To obtain high grain yields while achieving the quality requirements of the bread-making industry, fertilizer N is supplied at rates that exceed demand by wheat. This strategy is expected to influence N leaching, and agricultural N losses negatively impact groundwater quality [1,2]. According to Galloway [3], research is required to optimize the use of N throughout crop production.
The most often used method to determine the N fertilizer recovery is the apparent method [4], in which the amount of fertilizer taken up by the crop is calculated as the difference between fertilized and unfertilized plots. An alternative is the 15N dilution method that is used to determine the N-fertilizer recovery by direct measurement of the 15N-labeled fertilizer taken up by the plant [5]. The estimated recovery of fertilizer N is often higher when the apparent method is used rather than the 15N dilution method [6,7]. Smil [8] argued that the 15N dilution method provides a more accurate estimate of fertilizer N recovery than the apparent method does. In contrast, Cassman et al. [9] considered the apparent method to be more reliable because it is influenced by fewer factors and is less likely to be affected by experimental errors. Rao et al. [6] reviewed the sources of the differences between the two methods and postulated that differences in N losses and root growth between fertilized and unfertilized plots may explain the differences between the two methods. However, little data exists to support these postulates. Except for Olson and Swallow [10], who recorded the growth of coarse roots, but not the fine roots that are more relevant in N uptake [11], no dataset exists that combines fertilizer N recovery as estimated by the apparent and the isotopic methods and root measurements.
On average, 40% to 50% of the applied N fertilizer is recovered by field crops [12]. Among the three most cultivated cereals (i.e., maize, rice, and wheat), N fertilizer recovery is the least for wheat [9,13]. Genotypic variation for N-fertilizer recovery is well documented among spring wheat genotypes [14,15,16]. While maize genotypes were reported to impact nitrate lost through leaching, minimizing N leaching by utilizing genotypes with an increased capacity to take up N and to recover N fertilizer has not been explored for spring wheat.
Lysimeters are useful tools for studying the fate and transport of chemicals in the soil and are used to study the mass balance of water [17,18] and the leaching of nutrients [19,20,21]. Webster et al. [22] stated that lysimeters can be used to quantify leaching losses, and in contrast to suction cups, lysimeters enable the measurement of the amount of percolated water and the concentration of different N forms in the drained water.
The present study was conducted to determine (i) whether spring wheat genotypes that differ in fertilizer N recovery and N uptake have the potential to minimize NO3-N leaching, and (ii) whether root growth and NO3-N leaching are factors influencing the well-known differences in N recovery estimated by the apparent and isotopic methods.

2. Experimental Section

2.1. Experimental Conditions

A study was conducted for three years (1998–2000) in the Swiss Midlands near Zurich (47°26´ N, 8°40´ E) at 550 m above sea level in a facility with drainage lysimeters that allowed sampling of the draining solution and observation of the roots using minirhizotrons (at 10 soil depths between 0.05 m and 1.00 m). The basic lysimeter unit was a watertight, double-walled fiberglass container. The inner surface area of the container was 1.00 m2 and the depth of the soil column inside was 1.10 m. Each lysimeter contained minirhizotrons for the observation of roots. The minirhizotrons were 1.20 m long with an external diameter of 60 mm; these were placed horizontally in the lysimeters. Details about the construction, equipment and arrangement of the lysimeters are provided in Liedgens et al. [23]. The soil used to fill the lysimeters was a sandy loam (54% sand, 29% loam, 17% clay) sufficient in phosphorous (Olsen; 0.40–0.50 g P kg−1) and potassium content (assimilable K2O, NH4 acetate; 0.03–0.04 g kg−1) to a depth of 0.30 m. The soil was poor in organic matter content (2.8%–3.0%, Blake-Walkley) and slightly alkaline (pH (H2O) = 7.2 to 8.0).
The Swiss spring wheat (Triticum aestivum L.) cultivars Albis (released in 1983) and Toronit (released in 1996) and the experimental line L94491 [14] were used in this study. Albis, a relatively old, high-quality cultivar, and L94491 were selected because of their contrasting N yield. On average across four regimes of N supply over two years, L94491 took up 12% more N and yielded 11% more N in the grains [14] as a result of the higher N concentration in the shoot (15.3 vs. 12.8 g kg−1). Toronit is considered a cultivar with a relatively high protein content and was widely used by farmers when the experiment was planned.
The sowing dates were 30 March 1998, 15 March 1999, and 23 March 2000. The sowing was performed in rows 0.14 m apart at a depth of 20 to 30 mm and with a seeding rate of 420 seeds m−2.
Each year, 6 g m−2 of Foskal® (CU Agro, Uetikon, Switzerland; a calcium hydrogen phosphate fertilizer supplying 0.7, 2.0, 0.1, 0.4, and 0.2 g m−2 of P, K, Mg, Ca, and S, respectively) and 2 g N m−2 as ammonium nitrate were broadcast over all plots before sowing. No additional N and 25 g N m−2 were added as ammonium nitrate to the lysimeters under low (LN) and high N supply (HN), respectively. The HN fertilizer was split into four applications (9, 4, 6, and 6 g N m−2) between the beginning of tillering and anthesis. Except for 1998, the N fertilizer applied to the HN lysimeters was isotopically-enriched (15NH415NO3, 1.325 atom% excess). The isotopically-enriched fertilizer was dissolved in water (4 L) and sprayed uniformly using watering cans.
The experimental facility has a total 48 lysimeters, of which 24 were used each year. This was because the study included stable isotopes. The same set of 24 lysimeters were used in 1998 and 2000 while a different set with the remaining 24 lysimeters was used in 1999. Irrigation was provided only during long periods without rainfall. Weeds were removed manually while 5 × 10⁻⁵ L m−2 of Karate (Syngenta Agro AG, Basel, Switzerland) and 1.5 × 10⁻⁵ L m−2 of Opus Top (Syngenta Agro AG, Basel, Switzerland) were applied to preventally control pests and diseases, respectively. Moddus (Syngenta Agro AG, Basel, Switzerland) was applied at the beginning of stem elongation at a rate of 0.05 L m−2 to prevent lodging.
Each lysimeter represented one experimental unit (plot). In each year, the experimental layout was a completely randomized block design with two factors, i.e., N supply (two levels) and genotypes (three levels), and four replicates.

2.2. Data Sampling

Meteorological data were obtained from a weather station 500 m away from the experimental site.
Phenological development was screened on 30 plants within each lysimeter according to the extended BBCH scale [24]. The plants were harvested at physiological maturity (BBCH 92) on 4 August 1998, 9 August 1999, and 7 August 2000, respectively. All the shoots in each lysimeter were cut at ground level and dried at 65 °C for 48 h. The shoots were then threshed and separated into grains, chaff (rachis, glumes, and awns), and straw. Chaff and straw were mixed thoroughly before weighing and are referred to as straw hereafter. The N concentrations in the grains and the straw of the ground subsamples were analyzed using a LECO CHN-1000 autoanalyzer (LECO Corporation, St. Joseph, MI, USA), and the 15N concentrations were determined using a bench-top isotope ratio mass spectrometer (Europa Scientific Integra, Cambridge, UK). Biomass yield was calculated adding the dry weights of grain and straw, shoot N concentration is the mean between the N concentrations in the grains and the straw and biomass N yield is the product between biomass yield and shoot N concentration.
The volume of leachate from the lysimeters was recorded automatically by a gauge connected to a data logger; weekly drainage volumes were calculated and aliquots sampled. Leachate was analyzed for the concentrations of ammonium (NH4+) and nitrate (NO3) by means of colorimetry (Evolution II Autoanalyser, Alliance Instruments, Nanterre, France).
The root images were recorded at the minirhizotron-soil interface using a special camera system (Bartz Technology Co., Santa Barbara, CA, USA) and strips 18 mm wide and 202.5 mm (1999) or 243 mm (2000) long, corresponding to 15 and 18 single images, respectively. Each image was 13.5 by 18 mm. The images were digitalized using a frame grabber and organized into an image-time series. This allowed the sequential screening of new roots. Blockwise screening of the roots was performed by trained operators.
The number of roots [25] was determined by counting the number of root segments according to the method of Upchurch and Ritchie [26]. Since there are no objective visual criteria to determine whether a root is functional [27], a root was considered to be dead when it was no longer visible in the minirhizotron images. Root growth was assessed according to the method of Smit et al. [27] and analyzed in terms of the cumulative number of roots, i.e., the number of roots between sowing and the target observation date. These values were converted into a surface unit (cm2) for each position and averaged over all the positions in the same minirhizotron, referred to hereafter as the root density (RD).

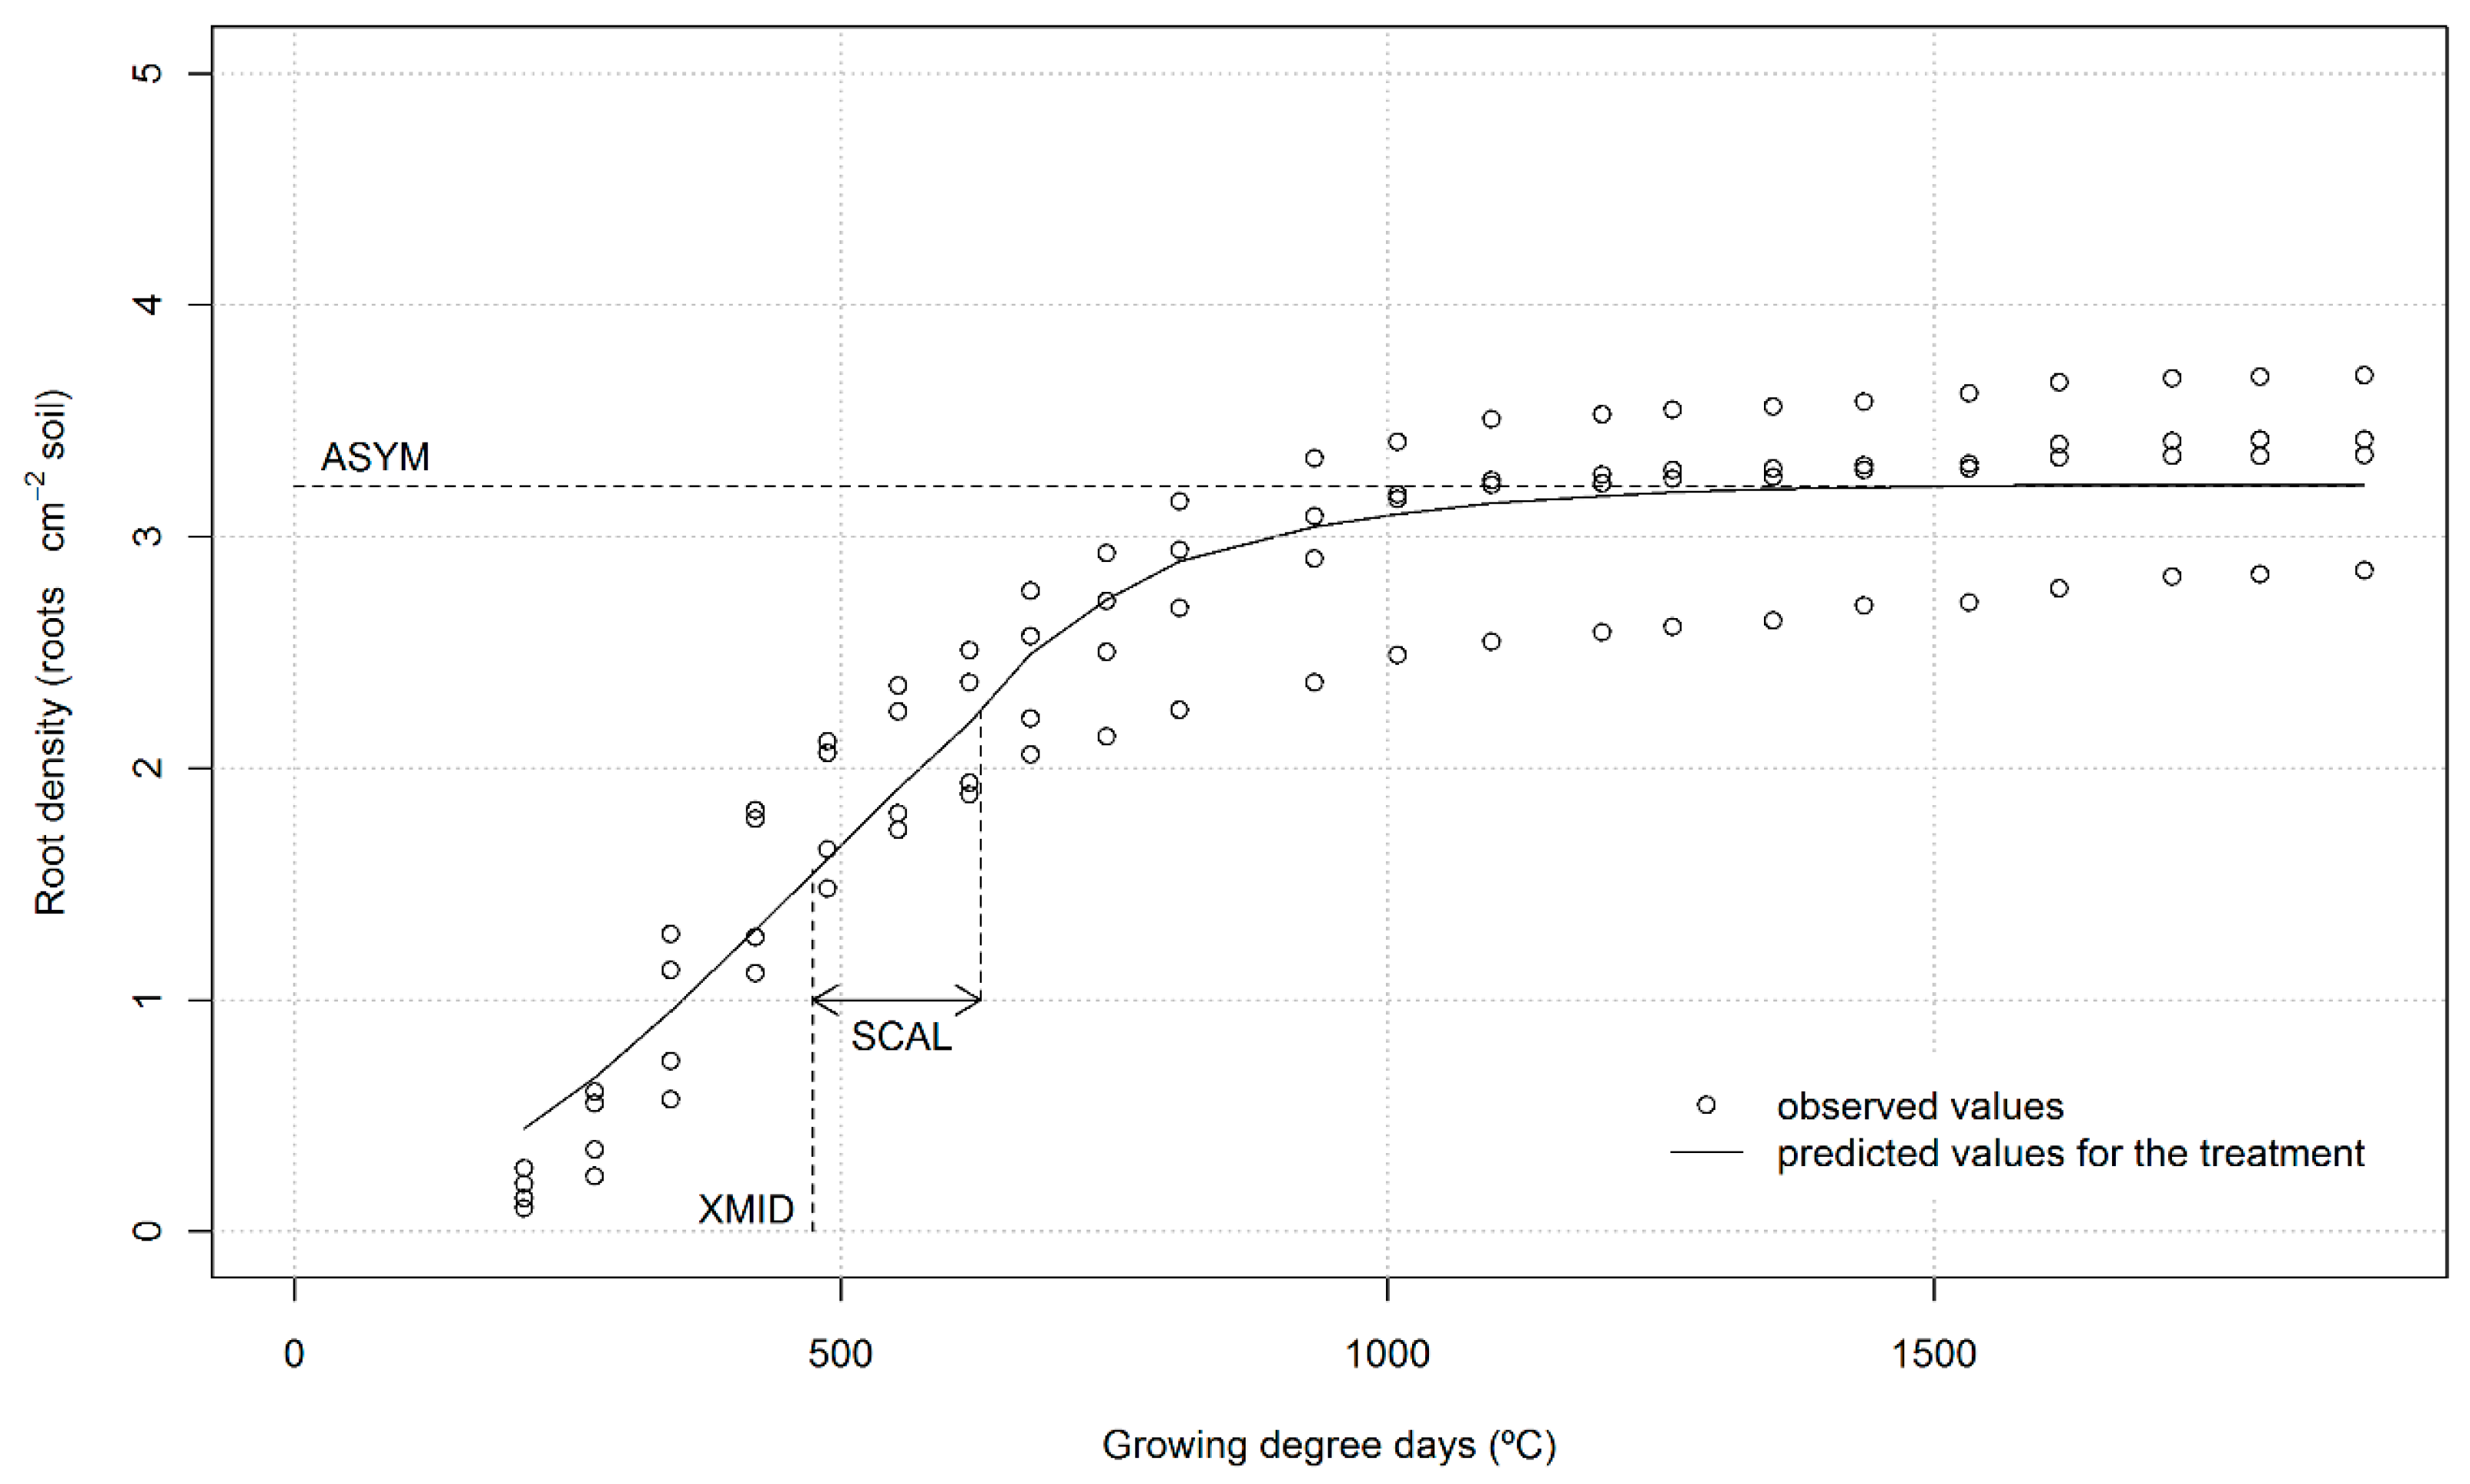
2.3. Calculations and Data Analysis

Fertilizer N recovery (NR) and apparent fertilizer N recovery (ANR) were determined according to the isotope dilution method [5] and the difference method [4], respectively:
% N R = N R f × 100
N R = N t × c d e d
% A N R = A N R f × 100
A N R = ( D Y N f × N Y N f ) ( D Y N 0 N Y N 0 )
where %NR is the proportion of isotopic fertilizer N recovery, f is the fertilizer rate (g N m−2), NR is the isotopic fertilizer N recovery rate (g N m−2), Nt is the total shoot N content at maturity (g N m−2), c is the atom% 15N of the sample, d is the atom% 15N of the non-labeled N pool (0.3663 atom% 15N), e is the atom% 15N of the applied fertilizer (1.325 atom% 15N), %ANR is the proportion of apparent fertilizer N recovery, ANR is the apparent N recovery rate (g N m−2), DYNf is the shoot dry matter (g m−2) of the fertilized plots, NYNf is the proportion of N (%) in the dry matter of the fertilized plots, DYN0 is the shoot dry matter (g m−2) of the non-fertilized plots, and NYN0 is the proportion of N (%) in the dry matter on the non-fertilized plots.
The root densities (RD) were averaged across the soil depths to provide estimates of the root growth over the soil profile of each lysimeter. The time course of the raw root densities as a function of growing degree days (using 0 °C as the base temperature) suggested the logistic function [28] as a good approximation of the growth pattern (Figure 1). The logistic function is characterized by three parameters: ASYM, the asymptotic limit of the RD; XMID, the time at which the RD equals 0.5 × ASYM; and SCAL, the time lag between the XMID and the time at which the RD reaches 0.75 × ASYM. The particular advantage of this non-linear modeling approach is the biological meaning of its parameters, i.e., ASYM indicates root production, whereas XMID and SCAL summarize the root growth pattern throughout the growing season. XMID is the inflection point of the logistic equation and determines the change from an exponential to a linear increase in RD, and it is an estimate of the time when the maximum RD is reached. Repeated measurements, such as the RD data, can be investigated by fitting the chosen function [29] to each sample (plot) and then applying an analysis variance to the parameters.
The weekly and the total losses of N by leaching were calculated based on the volume of leachate and the concentrations of NH4+ and NO3 in the leachate. The N losses in the form of ammonium-nitrogen (NH4-N) never represented more than 1% of the total N losses. Consequently, the results for NO3-N and total N are interchangeable with regard to the N losses by leaching, and we report only the N losses in the form of nitrate-nitrogen (NO3-N). Within each year, weekly values of water percolation and leached NO3-N were summed for five periods during the spring wheat development: i) from sowing to the beginning of tillering (SO-BT); ii) from the beginning of tilling to stem elongation (BT-SE); iii) from stem elongation to anthesis (SE-AN); iv) from anthesis to physiological maturity (AN-PM); and v) from sowing to physiological maturity, i.e., the entire growing season (Total).

2.4. Statistical Analysis

The analyses of the shoot, root, and nitrate leaching data were performed using R [30]. The estimates of the parameters of the logistic growth curve used to approximate the RD were calculated for each plot with the function “nlsList” in R [31]. Analyses of variance (ANOVA) for these parameters and the shoot data were performed using R’s function “lme” in that fits linear mixed-effects models. Blocks, genotypes and N supply were set as fixed effects, whereas the blocks nested within the years were set as random effects. Differences between genotypes in any of the measured and estimated variables for which a significant effect of the genotypes was found were indicated by the least significant difference test (LSD).

3. Results

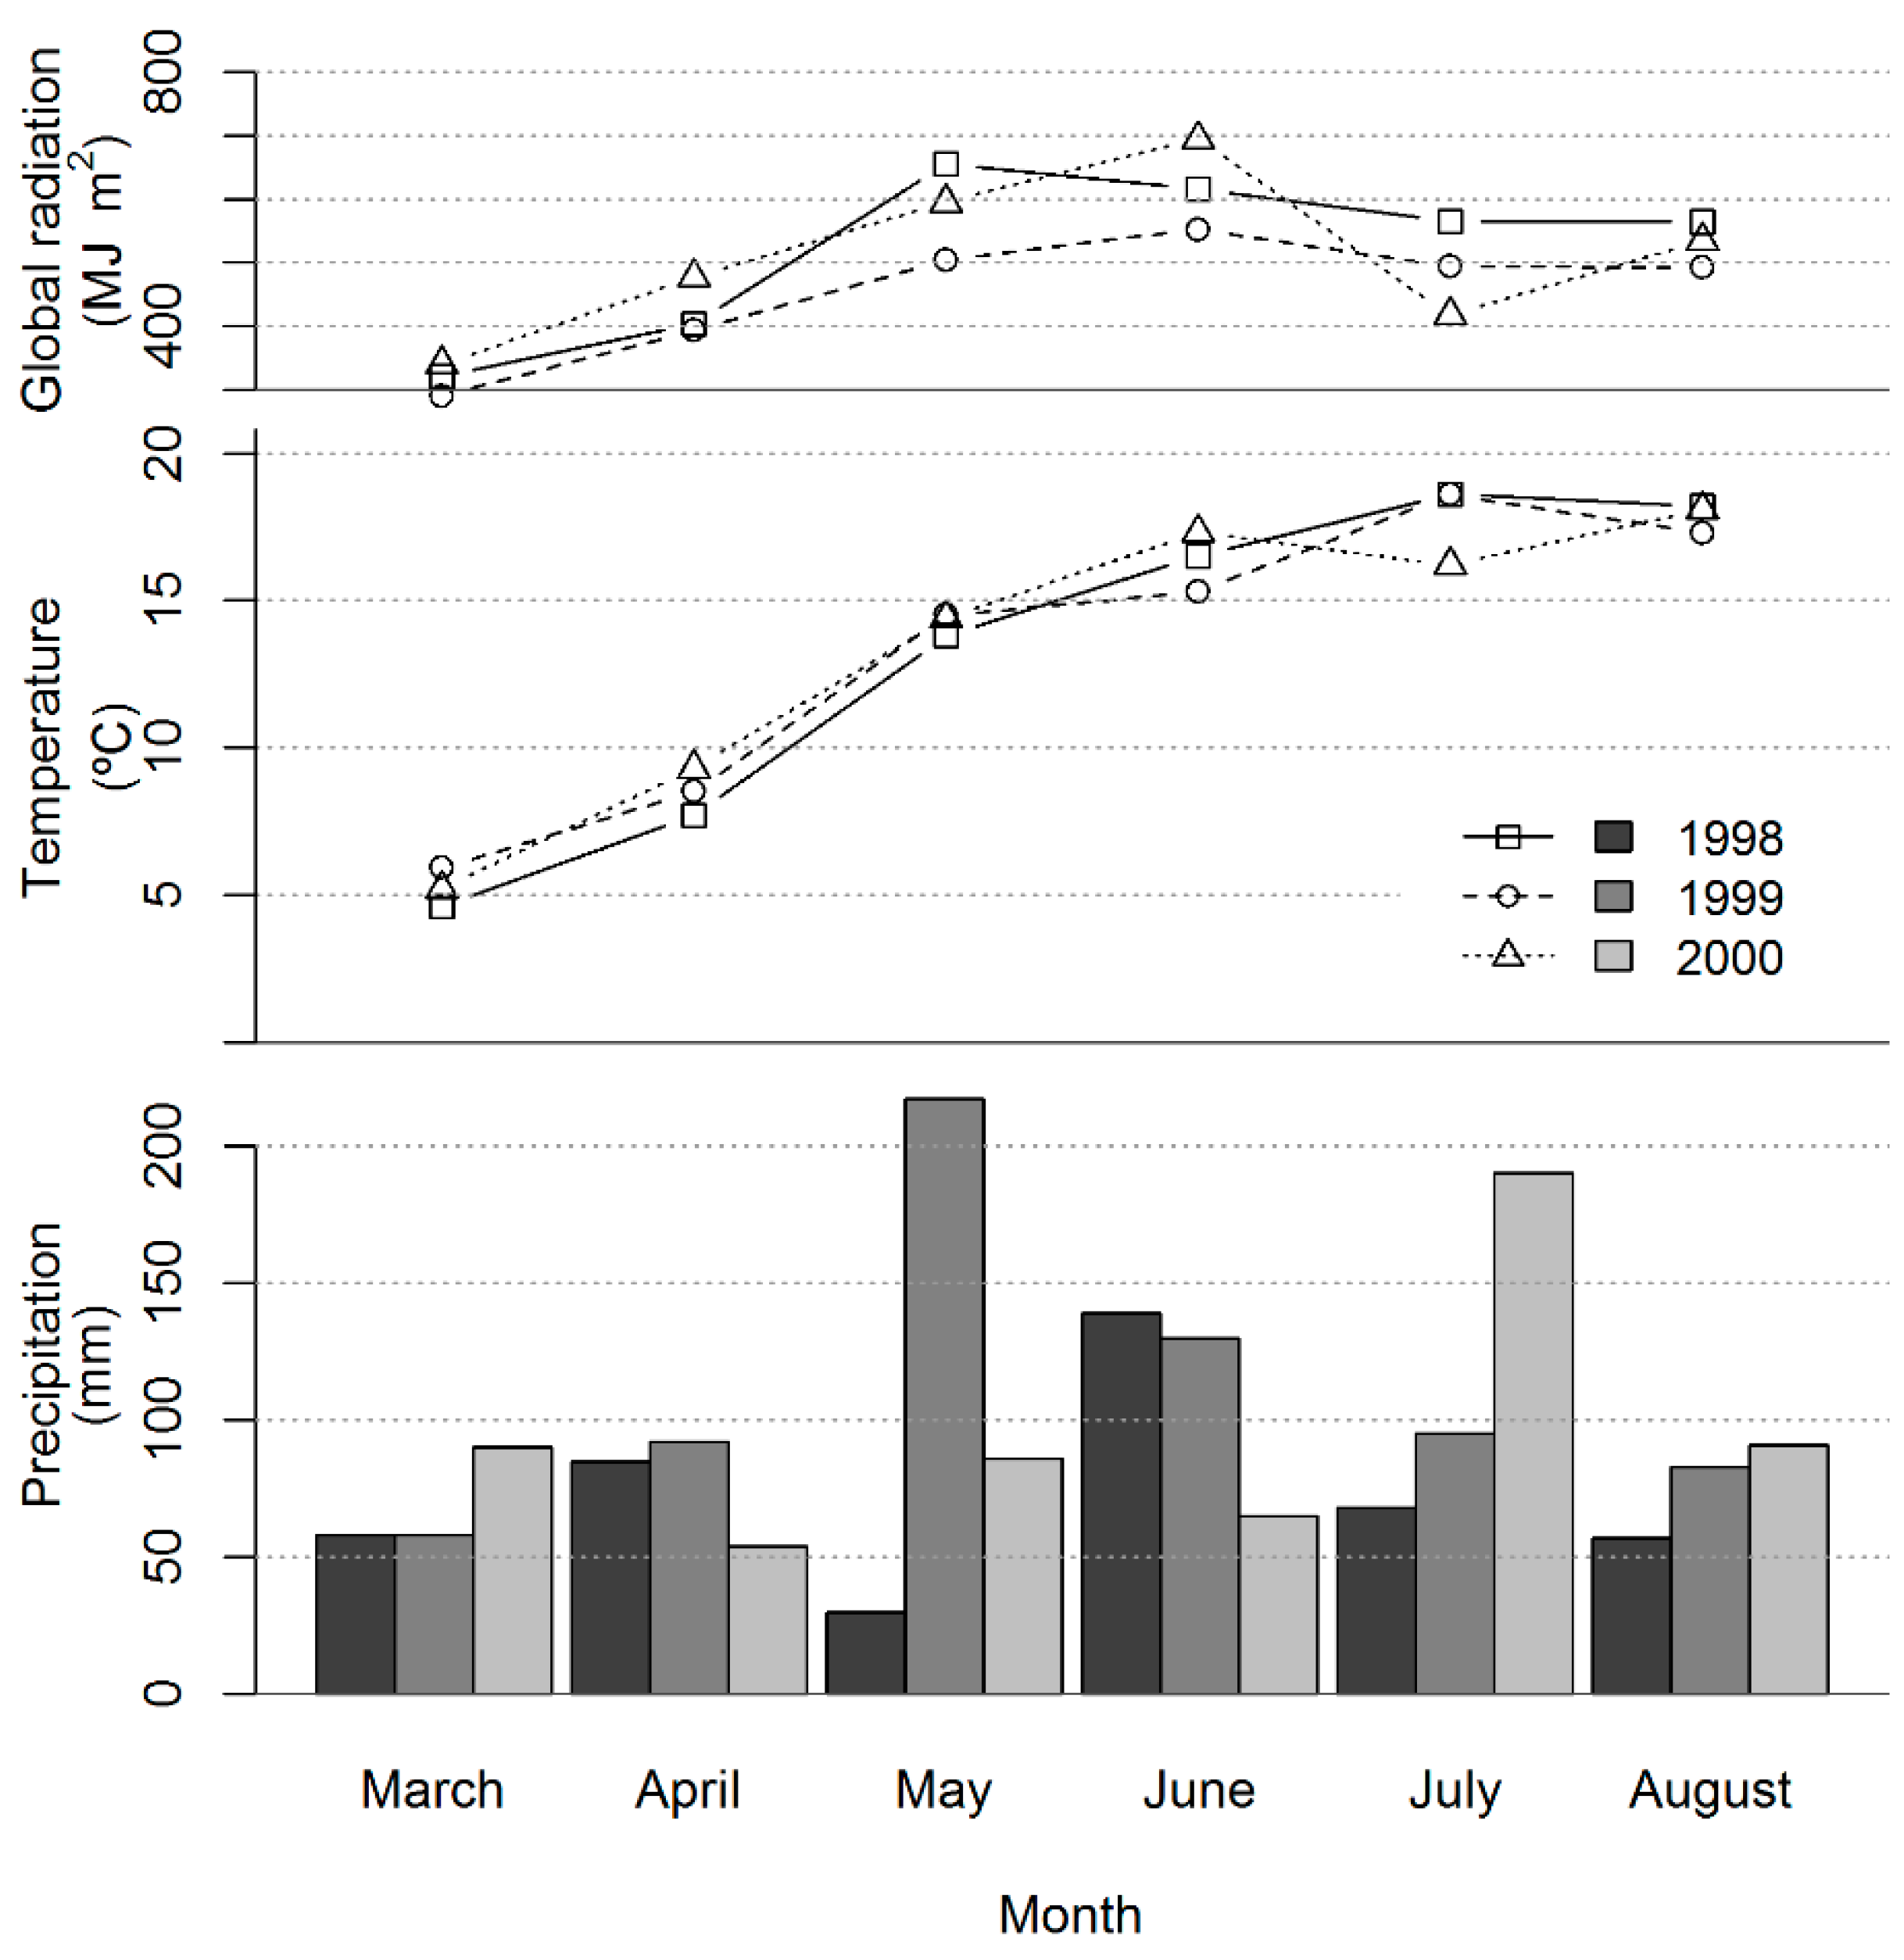
3.1. Growth Conditions

Global radiation was lower during most of the growing season for spring wheat in 1999 compared to 1998 and 2000. The mean air temperature for the entire growing season of spring wheat (~13.0 °C) was very similar among the three years; however, it was lower from sowing to anthesis in 1998 than in 1999 and 2000 (Figure 2). Furthermore, the temperatures were slightly higher in all growing seasons compared to the average for the preceding 10-year period (12.6 °C, 1987 to 1997).
Season-long precipitation for the spring wheat crop was highest and closest to the 10-year average (653 mm) in 1999 (675 mm), and 140 and 100 mm lower in 1998 and 2000, respectively. Additionally, the distribution of rain varied across the years (Figure 2). The precipitation from sowing to stem elongation was similar between 1998 and 1999, and it was lower by approximately 200 mm in 2000. During grain filling, the highest precipitation was registered in 2000.

3.2. Crop Growth

Table 1 shows the estimated means of the biomass yield and the shoot N-related parameters. All the shoot parameters considered were significantly affected by the N supply and the year. As expected, the grain yield, biomass N yield, biomass yield, and shoot N concentration were higher under HN than under LN. Under LN, the former parameters were similar in 1998 and 2000 but significantly lower in 1999. Under HN, the grain yield was similar in all three years, while the highest biomass yield and shoot N concentration were observed in 1999 and 2000, respectively. Consequently, the biomass N yield under HN significantly varied across the years; it was highest in 2000 and lowest in 1998. The biomass N yield under HN exceeded that of the LN by a factor of 1.2 (1998), 2.9 (1999), and 1.5 (2000).
The grain yield of Toronit tended to be the highest; on average for the three years, it exceeded that of the other genotypes by 19% (L94491) and 17% (Albis) under LN, and by 7% (L94491) and 25% (Albis) under HN. Similarly, the total shoot biomass of Toronit was always higher than that of the other genotypes. Despite considerable differences in biomass, under HN, the N yield of Toronit and L94491 shoots were similar and significantly higher compared to that of Albis. Under LN, the biomass N yield was similar for the three genotypes. The L94491 had the highest shoot N concentration despite having the lowest biomass, which resulted in a generally high biomass N yield. The shoot N concentration was lowest for Toronit and intermediate for Albis. Therefore, the biomass N yield was not simply a function of the above-ground biomass production.
In 2000, the root production (ASYM) was on average 24% higher and terminated earlier, as indicated by the XMID and SCAL, than in 1999. The HN increased the RD (+14% ASYM) and delayed its maximal value (+11% XMID and +18% SCAL). The genotypes had a significant effect on the ASYM only under low N supply (Table 2); the ASYM of Toronit under LN was 9% higher (averaged across the two years) compared to L94491; the ASYM of Albis was intermediate under LN. Although the XMID was larger for Albis compared to the other genotypes under both N supplies, the difference was significant under LN only. No consistent effect of the genotypes was found for the SCAL.

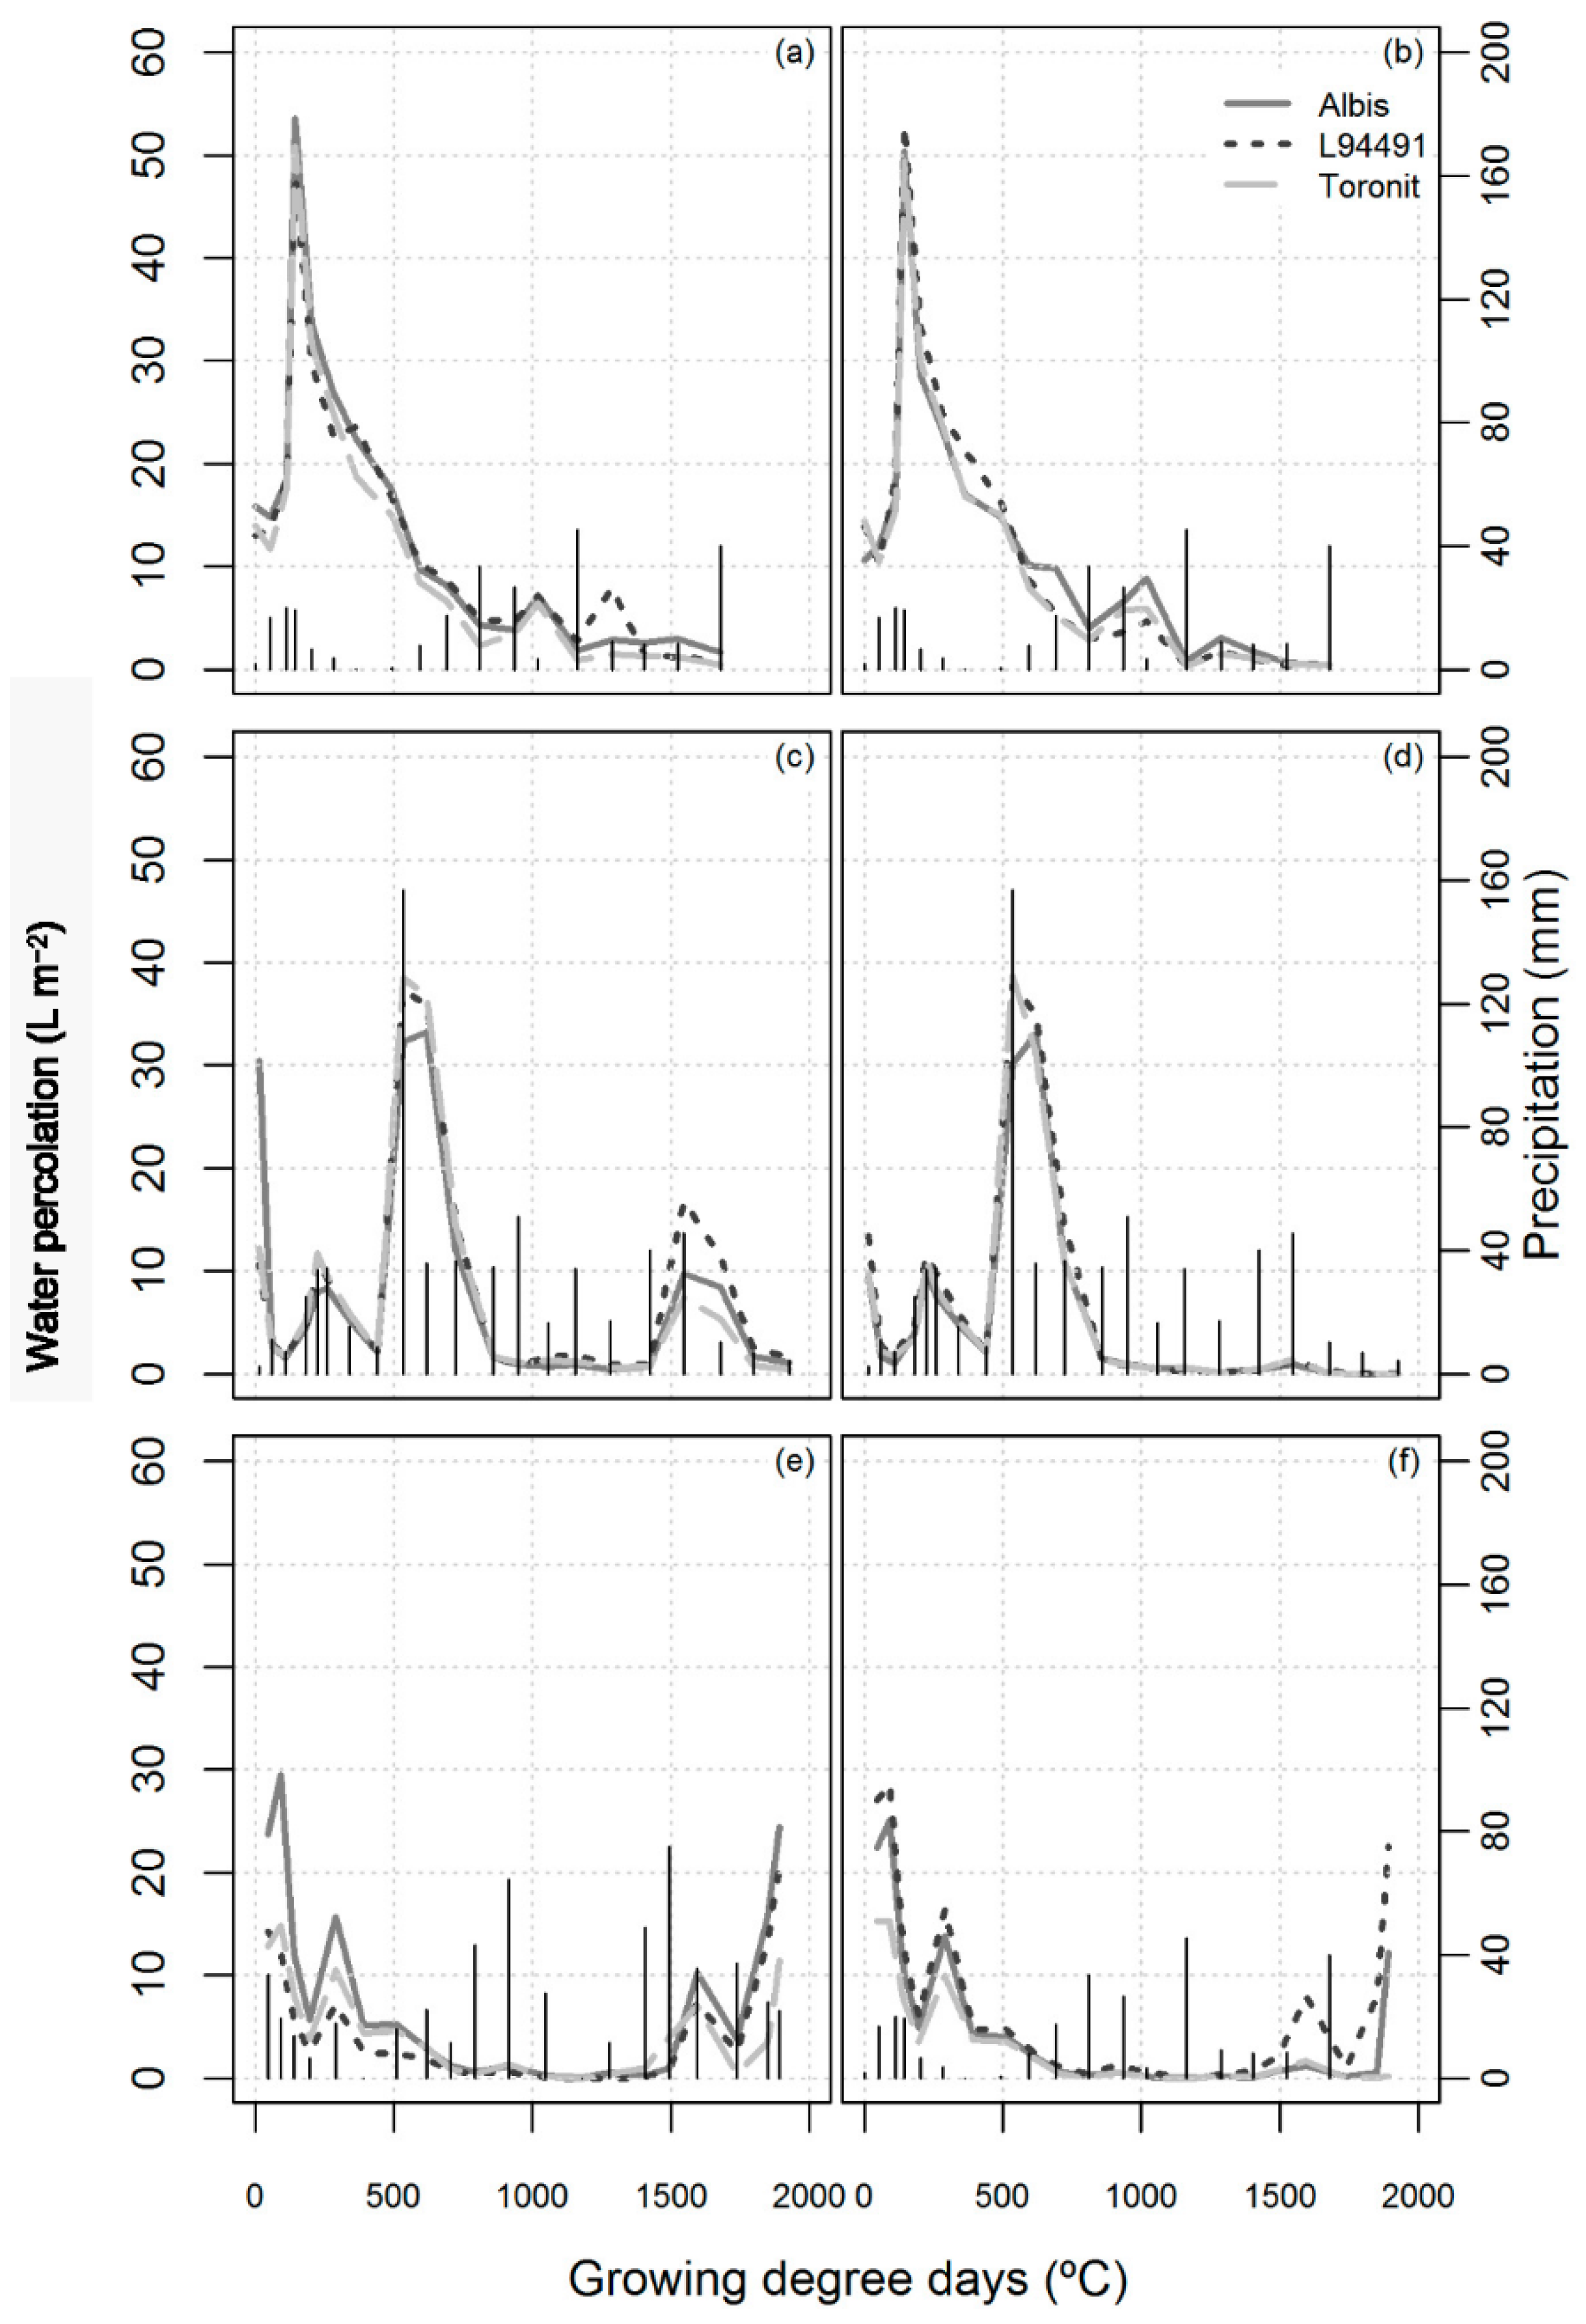
3.3. Water Percolation
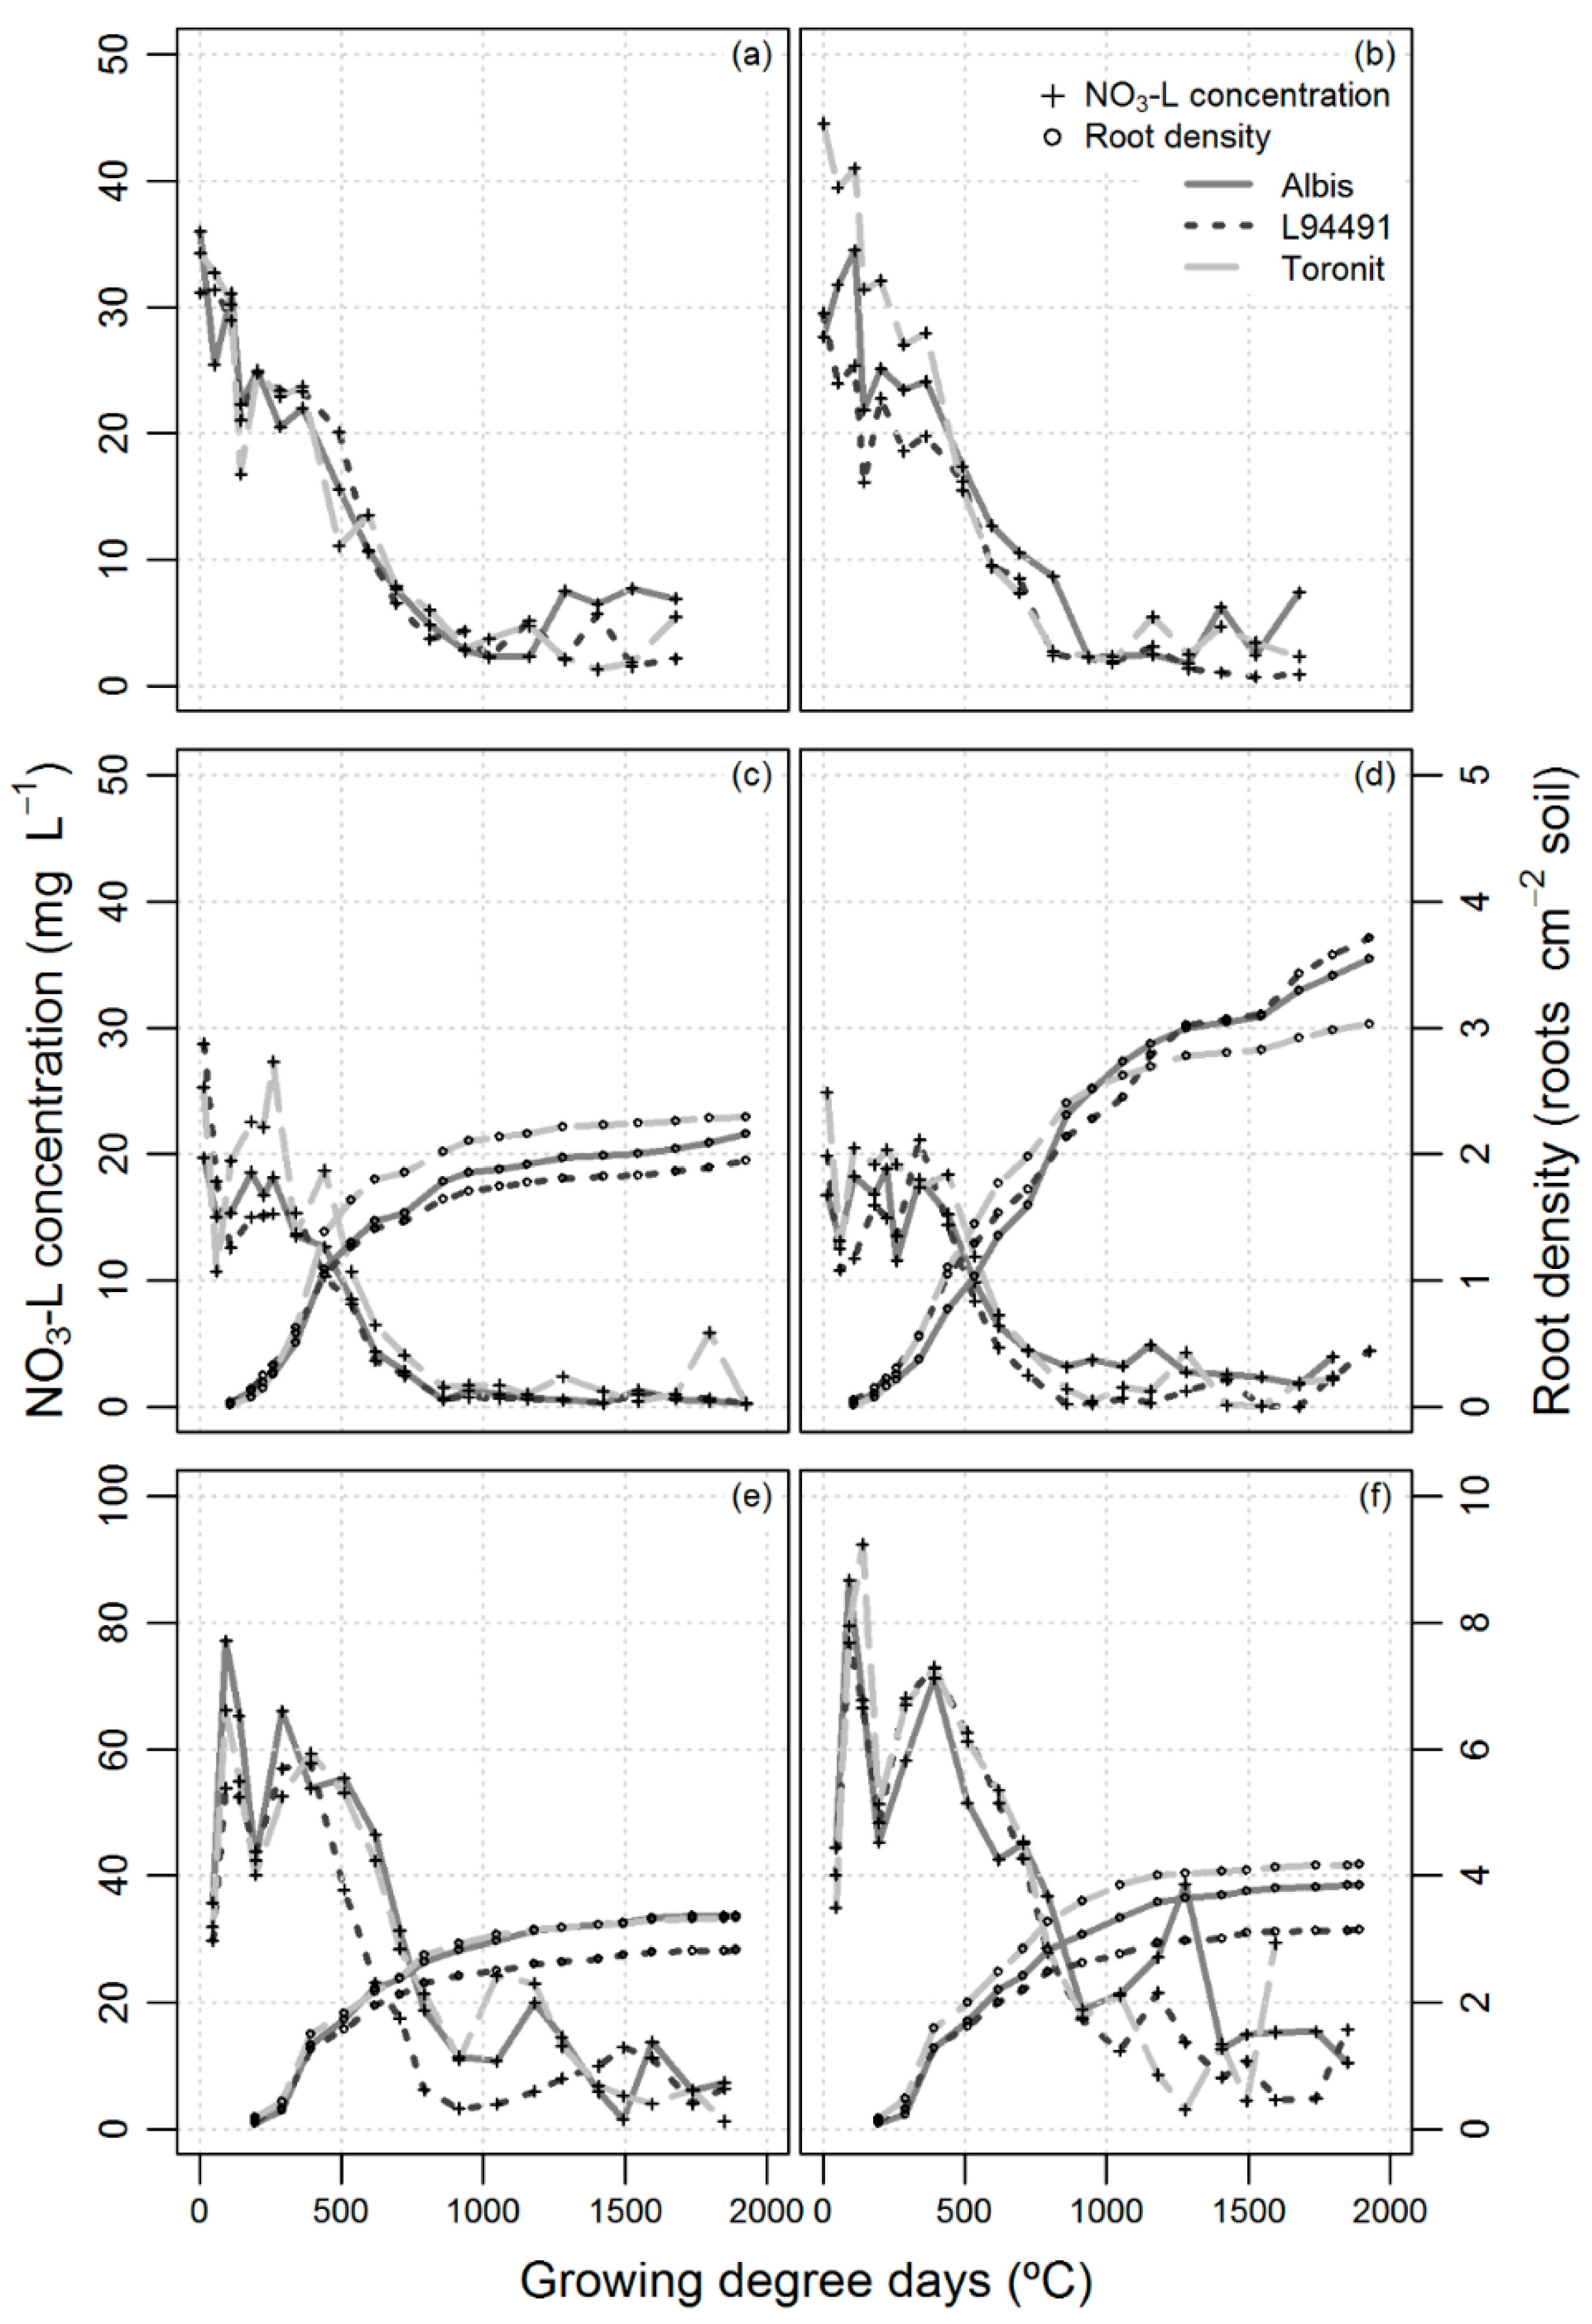
Water percolation lacked a general distribution pattern across the years. The season-long water percolation was significantly affected by the N supply and the year but not by the genotype (Table 3). The water percolation was significantly higher in 1998 (225 L m−2) than in 1999 (−32%) and 2000 (−44%). Yearly rankings of the water percolation (Table 3) did not follow precipitation (Figure 2), which was highest in 1999. Most of the precipitation in 1999 occurred when the crop was already established and was able to extensively absorb water. When averaged across the three spring wheat seasons, significantly more water (+13%) percolated from the lysimeters under LN than under HN. These differences were established after stem elongation and during grain filling; the water percolation under LN and HN was similar during the early development of spring wheat.

3.4. NO3-N Leaching

During the growing season of the spring wheat, the weekly concentrations of NO3 in the leachate (NO3-L) varied greatly (Figure 3). During the first weeks after sowing, the NO3-L reached its maximum between 28 (1999) and 90 mg L−1 (2000). NO3-L remained high until stem elongation (~500 GDD) and then fell continuously, eventually rising again shortly after anthesis (2000) or later during grain filling (1998 and 1999). The continuous decrease in the NO3-L coincided with a rather linear increase in the root density (Figure 3c–f) that likely indicates an intense uptake of water and soil NO3 by the spring wheat. The highest early (90 mg L−1, exceeding the European Union’s standard for drinking water) and late NO3-L (~40 mg L−1) readings were both observed in 2000. The temporal pattern of the NO3-L was similar for LN and HN, but lower values were recorded in 1999 and 2000 under LN. The genotypes lacked consistent differences in NO3-L.
The amount of NO3-N leached over the entire growing season of spring wheat was 1% higher under LN in 1998, 11% higher under LN in 1999 and 29% higher under HN in 2000 than the contrasting N treatment, respectively. However the differences between N treatments were not significant. In contrast, there was a significant difference among years, i.e., the amount was lower in 1999 than in 1998 and 2000 (Table 3). These differences were mainly produced between the time of sowing and the beginning of tillering, accounting for 80%, 43%, and 65% of the whole season losses in 1998, 1999, and 2000, respectively. Furthermore, 98%, 85%, and 91% of the seasonal NO3-N leaching, respectively, was recorded by the time of stem elongation. After anthesis, the NO3-N leaching was affected by a three-way genotype × N supply × year interaction, reflecting: a) no differences in 1998, b) a single main effect on the N supply in 1999, and c) a significantly higher NO3-N leaching for Albis under LN and for L94491 under HN in 2000.
Averaged across the years and genotypes, the NO3-N leached during the growing season for spring wheat was 15% of the fertilizer input and 14% of the biomass N yield of the spring wheat under HN. The water percolation (Figure 4), N concentration in the leachate (Figure 3), and leached NO3-N (Table 3) were mostly affected by the factor year. Therefore, the differences in biomass N yield and fertilizer N recovery among the genotypes were not associated with the amount of NO3-N leached (Table 3).

3.5. Fertilizer N Recovery

The fertilizer N recovery was affected by the year irrespective of the calculation method and by the genotype. Toronit and L94491 had a higher recovery of N fertilizer than Albis according to both the ANR and NR (Table 4). Although the magnitude of the differences in fertilizer N recovery among the genotypes was different for the ANR and NR, the ranking of the genotypes within the years was the same. The fertilizer N recovery averaged across the years and the genotypes was lower when estimated by NR (49.7%) than by ANR (57.9%). The ANR was highly variable and significantly different among the years, i.e., 71%, 38%, and 15% in 1999, 2000, and 1998, respectively. In contrast, the NR was less variable at 59% (1999) and 46% (2000). The absolute difference between the two N-recovery methods was only affected by year. The ANR compared to the NR was 24% higher and 8% lower in 1999 and 2000, respectively (Table 4). The differences between HN and LN for the parameters that influence the ANR were 188% and 54% (Biomass N yield; Table 1), 69% and −12% (ASYM parameter of root growth; Table 2), and −9% and 23% (NO3-N leaching;) in 1999 and 2000. The main difference between NR and ANR is that the NR relies on a direct quantification of the recovered N whereas the ANR is indirectly calculated based on the N uptake of the non-fertilized plots. From the three parameters, the differences for NO3-N leaching between HN and LN were approximated closely each year by the differences between the two methods used to determine the fertilizer N recovery.

4. Discussion

Nitrate leaching for spring wheat (Table 3) was within the range reported in other studies for spring wheat (4 to 12 g N m−2; [21]) or spring cereals, e.g., 0.7 to 7.5 g N m−2 [32] and 1.61 to 9.63 g N m−2 [33]. The percentage of the NO3-N leaching to the fertilizer N input (14%) was in range of the 0.10 reported by Uhlen [21] for spring wheat grown in a similar climate. However, Uhlen [21] reported a higher percentage of NO3-N leaching compared to the biomass N yield (44%) than we found here (13%). In the present study, increasing the N fertilization was accompanied by a larger accumulation of N in the spring wheat biomass but not by an increased NO3-N leaching, as found by Eriksen et al. [19] and Sieling and Kage [19]. The nitrogen fertilizer in these studies was supplied just once, suggesting that the split application in our experiments was a successful strategy to minimize N losses and increase N recovery. To avoid most of the N under the HN being lost due to the low N demand in the early stages of spring wheat development, the N supply was split according to the results of previous studies in the field [34,35]. The higher water percolation under LN compared to HN may have been due to the more limited growth of the spring wheat; under LN, less of the soil water may have been utilized than what was available. Our results also support Macdonald et al.’s [36] view that reductions in the fertilizer N supply do not guarantee reduced NO3-N leaching. Similarly, when Bergstrom and Brink [37] studied N fertilization rates from 0 to 200 kg ha−1, they reported various situations where the NO3-N leaching was higher in the unfertilized plots. However, we should also keep in mind that significant amounts of NO3-N may be leached after the crop’s harvest [38].
Although Ehdaie et al. [39] found significant differences in NO3-N leaching among wheat genotypes grown in sand columns under controlled conditions in a glasshouse, a systematic benefit of growing spring wheat genotypes specifically developed to reduce NO3-N leaching was not evident from the present study; NO3-N leaching was dominated by environmental effects. The temporal patterns of the NO3-L were rather similar among the spring wheat genotypes (Figure 3), and no significant difference was found among them in the total NO3-N leached throughout the growing season (Table 3).
From 85% (1999) to 98% (1998) of the NO3-N leaching of the entire crop cycle was already leached by the time of stem elongation, i.e., most occurred before the time when the wheat is reported to achieve its maximum N uptake rate [40]. Very little N remains to be saved from leaching during the principal growth period of the spring wheat crop. Although only a limited number of genotypes were tested, it is highly unlikely that any other set of genotypes would have more greatly impacted the N leaching. The potential of using genotypes that differ in N uptake and fertilizer N recovery to reduce NO3-N leaching is rather limited. Although genotypic differences in early vigor characteristics have been reported [41], these differences are probably not enough to reduce the NO3-N leaching in environments similar to those found in the Swiss Midlands, and minimizing the NO3-N leaching is more likely related to designing rotations where the crops’ maximum N uptake coincides with the higher leaching periods.
Additional factors, that may have contributed to the differences in biomass N yield (Table 1) and fertilizer N recovery (Table 4) among the spring wheat genotypes, were not associated with differences in the leaching of NO3-N (Table 3). These factors include: i) NO3-N leaching, which represented a relatively small proportion of the fertilizer N input (14%) or the biomass N yield (13%), and ii) N leaching, which is largely influenced by the release of soluble N from the soil organic matter; e.g. Uhlen [21], Macdonald et al. [42], and Abril et al. [43] reported that the highest fraction of N lost by leaching originates from the soluble N in the soil organic matter.
The isotopic fertilizer N recovery (NR) ranged from 36% to 64%, indicating that at minimum 64% of the shoot N was taken up from other sources than the fertilizer. The fertilizer N recovered by the crops can be expected to be slightly higher than the reported values because the N accumulated in the roots is usually not included as part of the recovered fertilizer [6]. Although there were no significant differences in the means of the ANR in 2000, the differences among the genotypes in the recovery of the N fertilizer in the present study were mainly associated with the differences in the biomass N yield (Table 1). Therefore, as was suggested by Below [44], the capacity of the genotypes to recover N fertilizer in this study depended on their capacity to absorb N.
An additional goal of the present study was to assess the possible impact of NO3-N leaching and root growth on the differences that are commonly obtained when the fertilizer recovery is estimated according to the ANR and NR. It is the fundamental assumption of the ANR method that the higher N supply from fertilization is the single factor resulting in the differences in N uptake between fertilized and unfertilized plots. However, it is unlikely that this assumption holds absolutely; for example, it has been reported that stimulation of microbial activity by the addition of fertilizer N (i.e., the priming effect) also increases the soil N uptake [45]. Unlike the NR, the ANR depends on the estimation of the biomass N yield in the LN plots. The difference between the ANR and NR was more closely related to the difference between LN and HN in NO3-N leaching than in root growth. The explanation may be that the differences between LN and HN that determine the ANR are influenced by a more linear relationship with NO3-N leaching than with root growth; with increasing N availability, the increases in root growth and root N content will not occur to the same extent as the increase in biomass and N accumulation in the above-ground organs. The effect of increasing the N supply is often greater on shoot growth than on roots [46].

5. Conclusions

The genotypes varied in fertilizer N recovery, but not in NO3-N leaching. The NO3-N lost through leaching was very low in relation to the amount of N fertilizer applied. The differences in the biomass N yield, fertilizer N recovery and root growth among the genotypes were not associated with the extent of NO3-N leaching because most of the NO3-N leaching measured for the entire growing season had occurred by the stage of stem elongation. Thus, the ability to minimize NO3-N leaching by using spring wheat genotypes that differ in N uptake is rather limited in environments like the Swiss Midlands.
A detailed analysis of root growth was important to discover that the impact of the root growth differences between LN and HN plots in influencing the ANR is relatively small. In contrast, the differences in NO3-N leaching are more closely related to the differences between the the apparent and isotopic methods to quantify recoveries of N fertilizer.

Acknowledgments

We thank the contributions of two anonymous reviewers to improve the final manuscript.

Author Contributions

All authors contributed substantially to the work reported in this paper. Peter Stamp and Christos Noulas conceived and designed the experiments. Christos Noulas collected the crop and nitrogen leaching data and Juan Manuel Herrera collected the root data. Juan Manuel Herrera and Didier Pellet analyzed the data and wrote the first draft of the paper. All authors discussed the results and implications and commented on the manuscript at all following stages.

Conflicts of Interest

The authors declare no conflict of interest.

Abbreviations

ANR
apparent fertilizer N recovery
GDD
growing degree days
HN
high N supply
LN
low N supply
NO3ˉ
nitrate
NO3-N
nitrogen in the form of nitrate
NR
isotopic fertilizer N recovery efficiency
NO3-L
nitrate concentration in the leachate solution

References

  1. David, M.B.; Gentry, L.E.; Kovacic, D.A.; Smith, K.M. Nitrogen balance in and export from an agricultural watershed. J. Environ. Qual. 1997, 26, 1038–1048. [Google Scholar] [CrossRef]
  2. Mitsch, W.J.; Day, J.W. Restoration of wetlands in the Mississippi-Ohio-Missouri (MOM) River Basin: Experience and needed research. Ecol. Eng. 2006, 26, 55–69. [Google Scholar] [CrossRef]
  3. Galloway, J.N.; Townsend, A.R.; Erisman, J.W.; Bekunda, M.; Cai, Z.; Freney, J.R.; Martinelli, L.A.; Seitzinger, S.P.; Sutton, M.A. Transformation of the nitrogen cycle: Recent trends, questions, and potential solutions. Science 2008, 320, 889–892. [Google Scholar] [CrossRef] [PubMed]
  4. Schindler, F.V.; Knighton, R.E. Fate of fertilizer nitrogen applied to corn as estimated by the isotopic and difference methods. Soil Sci. Soc. Am. J. 1999, 63, 1734–1740. [Google Scholar] [CrossRef]
  5. Hauck, R.D.; Bremner, J.M. Use of tracers for soil and fertilizer nitrogen research. In Advances in Agronomy; Academic Press: Philadelphia, PA, USA, 1976; Volume 28, pp. 219–266. [Google Scholar]
  6. Rao, A.C.S.; Smith, J.L.; Parr, J.F.; Papendick, R.I. Considerations in estimating nitrogen recovery efficiency by the difference and isotopic dilution methods. Fertil. Res. 1992, 33, 209–217. [Google Scholar] [CrossRef]
  7. Roberts, T.L.; Janzen, H.H. Comparison of direct and indirect methods of measuring fertilizer N uptake in winter-wheat. Can. J. Soil Sci. 1990, 70, 119–124. [Google Scholar] [CrossRef]
  8. Smil, V. Nitrogen in crop production: An account of global flows. Glob. Biogeochem. Cy. 1999, 13, 647–662. [Google Scholar] [CrossRef]
  9. Cassman, K.G.; Dobermann, A.; Walters, D.T. Agroecosystems, nitrogen-use efficiency, and nitrogen management. Ambio 2002, 31, 132–140. [Google Scholar] [CrossRef] [PubMed]
  10. Olson, R.V.; Swallow, C.W. Fate of labeled nitrogen-fertilizer applied to winter-wheat for 5 years. Soil Sci. Soc. Am. J. 1984, 48, 583–586. [Google Scholar] [CrossRef]
  11. Robinson, D. The responses of plants to non-uniform supplies of nutrients. New Phytol. 1994, 127, 635–674. [Google Scholar] [CrossRef]
  12. Raun, W.R.; Johnson, G.V. Improving nitrogen use efficiency for cereal production. Agron. J. 1999, 91, 357–363. [Google Scholar] [CrossRef]
  13. Ladha, J.K.; Pathak, H.; Krupnik, T.J.; Six, J.; van Kessel, C. Efficiency of fertilizer nitrogen in cereal production: Retrospects and prospects. Adv. Agron. 2005, 87, 85–156. [Google Scholar]
  14. Banziger, M.; Feil, B.; Schmid, J.E.; Stamp, P. Genotypic variation in grain N content of wheat as affected by mineral n supply in the soil. Eur. J. Agron. 1992, 1, 155–162. [Google Scholar] [CrossRef]
  15. Le Gouis, J.; Beghin, D.; Heumez, E.; Pluchard, P. Genetic differences for nitrogen uptake and nitrogen utilisation efficiencies in winter wheat. Eur. J. Agron. 2000, 12, 163–173. [Google Scholar] [CrossRef]
  16. Rodgers, C.O.; Barneix, A.J. Cultivar differences in the rate of nitrate uptake by intact wheat plants as related to growth-rate. Physiol. Plant. 1988, 72, 121–126. [Google Scholar] [CrossRef]
  17. Caspari, H.W.; Behboudian, M.H.; Chalmers, D.J.; Renquist, A.R. Pattern of seasonal water-use of Asian pears determined by lysimeters and the heat-pulse technique. J. Am. Soc. Hort. Sci. 1993, 118, 562–569. [Google Scholar]
  18. Wegehenkel, M.; Zhang, Y.Q.; Zenker, T.; Diestel, H. The use of lysimeter data for the test of two soil-water balance models: A case study. J. Plant Nutr. Soil Sci. 2008, 171, 762–776. [Google Scholar] [CrossRef]
  19. Eriksen, J.; Pedersen, L.; Jorgensen, J.R. Nitrate leaching and bread-making quality of spring wheat following cultivation of different grasslands. Agric. Ecosyst. Environ. 2006, 116, 165–175. [Google Scholar] [CrossRef]
  20. Knappe, S.; Haferkorn, U.; Meissner, R. Influence of different agricultural management systems on nitrogen leaching: Results of lysimeter studies. J. Plant Nutr. Soil Sci. 2002, 165, 73–77. [Google Scholar] [CrossRef]
  21. Uhlen, G. The leaching behavior and balances of nitrogen and other elements under spring wheat in lysimeter experiment 1985–92. Acta Agric. Scand. Sect. B-Soil Plant Sci. 1994, 44, 201–207. [Google Scholar]
  22. Webster, C.P.; Shepherd, M.A.; Goulding, K.W.T.; Lord, E. Comparisons of methods for measuring the leaching of mineral nitrogen from arable land. J. Soil Sci. 1993, 44, 49–62. [Google Scholar] [CrossRef]
  23. Liedgens, M.; Richner, W.; Stamp, P.; Soldati, A. A rhizolysimeter facility for studying the dynamics of crop and soil processes: Description and evaluation. Plant Soil 2000, 223, 87–97. [Google Scholar] [CrossRef]
  24. Lancashire, P.D.; Bleiholder, H.; Vandenboom, T.; Langeluddeke, P.; Stauss, R.; Weber, E.; Witzenberger, A. A uniform decimal code for growth-stages of crops and weeds. Ann. Appl. Biol. 1991, 119, 561–601. [Google Scholar] [CrossRef]
  25. Crocker, T.L.; Hendrick, R.L.; Ruess, R.W.; Pregitzer, K.S.; Burton, A.J.; Allen, M.F.; Shan, J.P.; Morris, L.A. Substituting root numbers for length: Improving the use of minirhizotrons to study fine root dynamics. Appl. Soil Ecol. 2003, 23, 127–135. [Google Scholar] [CrossRef]
  26. Upchurch, D.R.; Ritchie, J.T. Root observations using a video recording-system in mini-rhizotrons. Agron. J. 1983, 75, 1009–1015. [Google Scholar] [CrossRef]
  27. Smit, A.L.; George, E.; Groenwold, J. Root observations and measurements at (transparent) interfaces with soil. In Root Methods: A Handbook; Smit, A.L., Bengough, A.G., Engels, C., van Noordwijk, M., Pellerin, S., van de Geijn, S.C., Eds.; Springler-Verlag: Berlin, Germany, 2000; pp. 236–271. [Google Scholar]
  28. Hunt, R. Plant Growth Curves; Edward Arnold: London, UK, 1982. [Google Scholar]
  29. Meredith, M.P.; Stehman, S.V. Repeated measures experiments in forestry: Focus on analysis of response curves. Can. J. For. Res. 1991, 21, 957–965. [Google Scholar] [CrossRef]
  30. R Development Core Team. R: A Language and Environment for Statistical Computing; R Foundation for Statistical Computing: Vienna, Austria, 2007. [Google Scholar]
  31. Pinheiro, J.; Bates, D. Mixed-effects Models in S and S-plus; Springer: New York, NY, USA, 2000. [Google Scholar]
  32. Thomsen, I.K. Nitrate leaching under spring barley is influenced by the presence of a ryegrass catch crop: Results from a lysimeter experiment. Agr. Ecosyst. Environ. 2005, 111, 21–29. [Google Scholar] [CrossRef]
  33. Hooker, K.V.; Coxon, C.E.; Hackett, R.; Kirwan, L.E.; O’Keeffe, E.; Richards, K.G. Evaluation of cover crop and reduced cultivation for reducing nitrate leaching in ireland. J. Environ. Qual. 2008, 37, 138–145. [Google Scholar] [CrossRef] [PubMed]
  34. Banziger, M.; Feil, B.; Schmid, J.E.; Stamp, P. Utilization of late-applied fertilizer nitrogen by spring wheat genotypes. Eur. J. Agron. 1994, 3, 63–69. [Google Scholar] [CrossRef]
  35. Noulas, C.; Stamp, P.; Soldati, A.; Liedgens, M. Nitrogen use efficiency of spring wheat genotypes under field and lysimeter conditions. J. Agron. Crop. Sci. 2004, 190, 111–118. [Google Scholar] [CrossRef]
  36. Macdonald, A.J.; Powlson, D.S.; Poulton, P.R.; Jenkinson, D.S. Unused fertilizer nitrogen in arable soils—Its contribution to nitrate leaching. J. Sci. Food Agric. 1989, 46, 407–419. [Google Scholar] [CrossRef]
  37. Bergstrom, L.; Brink, N. Effects of differentiated applications of fertilizer N on leaching losses and distribution of inorganic n in the soil. Plant Soil 1986, 93, 333–345. [Google Scholar] [CrossRef]
  38. Herrera, J.M.; Liedgens, M. Leaching and utilization of nitrogen during a spring wheat catch crop succession. J. Environ. Qual. 2009, 38, 1410–1419. [Google Scholar] [CrossRef] [PubMed]
  39. Ehdaie, B.; Merhaut, D.J.; Ahmadian, S.; Hoops, A.C.; Khuong, T.; Layne, A.P.; Waines, J.G. Root system size influences water-nutrient uptake and nitrate leaching potential in wheat. J. Agron. Crop. Sci. 2010, 196, 455–466. [Google Scholar] [CrossRef]
  40. Baethgen, W.E.; Alley, M.M. Optimizing soil and fertilizer nitrogen use by intensively managed winter-wheat.I. Crop nitrogen uptake. Agron. J. 1989, 81, 116–120. [Google Scholar] [CrossRef]
  41. Liao, M.T.; Palta, J.A.; Fillery, I.R.P. Root characteristics of vigorous wheat improve early nitrogen uptake. Aust. J. Agric. Res. 2006, 57, 1097–1107. [Google Scholar] [CrossRef]
  42. Macdonald, A.J.; Poulton, P.R.; Howe, M.T.; Goulding, K.W.T.; Powlson, D.S. The use of cover crops in cereal-based cropping systems to control nitrate leaching in SE England. Plant Soil 2005, 273, 355–373. [Google Scholar] [CrossRef]
  43. Abril, A.; Baleani, D.; Casado-Murillo, N.; Noe, L. Effect of wheat crop fertilization on nitrogen dynamics and balance in the humid pampas, Argentina. Agric. Ecosyst. Environ. 2007, 119, 171–176. [Google Scholar] [CrossRef]
  44. Below, F.E. Nitrogen metabolism and crop productivity. In Handbook of Plant and Crop Physiology; Pessarakli, M., Ed.; Marcel Dekker: New York, NY, USA, 2002; pp. 385–406. [Google Scholar]
  45. Jenkinson, D.S.; Fox, R.H.; Rayner, J.H. Interactions between fertilizer nitrogen and soil-nitrogen—The so-called priming effect. J. Soil Sci. 1985, 36, 425–444. [Google Scholar] [CrossRef]
  46. Welbank, P.J.; Gibb, M.J.; Taylor, P.J.; Williams, E.D. Root growth of cereal crops. In Rothamsted Experimental Station Report for 1973, Part 2; Rothamsted Press: Harpenden, UK, 1974; Volume 199, pp. 26–66. [Google Scholar]
Figure 1. An example of the logistic model fitted to the root density of Toronit under high N supply in 2000, showing the parameters ASYM (the asymptotic limit of root density), XMID (the time at which 0.5 of the asymptotic value is reached), and SCAL (the time lag between the time at which 0.5 of the asymptotic value is reached and the time at which root density reaches 0.75 of the asymptotic value).
Agronomy 06 00029 g001
Figure 2. Global radiation, temperature, and precipitation during the experiment.
Agronomy 06 00029 g002
Figure 3. The means of nitrate concentration (NO3-L) in the leachate and root density for the genotypes under low (2 g N m-2; (a), (c), and (e)) and high (27 g N m-2; (b), (d), and (f)) N supply throughout the growing seasons of 1998 ((a) and (b)), 1999 ((c) and (d)), and 2000 ((e) and (f)). Note: the scale for the NO3-L data is different for the year 2000.
Agronomy 06 00029 g003
Figure 4. The means of water percolation (L m−2) for the genotypes under low (2 g N m−2; (a), (c), and (e)) and high (27 g N m−2; (b), (d), and (f)) N supply throughout the growing seasons of 1998 ((a) and (b)), 1999 ((c) and (d)), and 2000 ((e) and (f)). Bars represent weekly amounts of precipitation and irrigation.
Agronomy 06 00029 g004
Table 1. The means of the shoot biomass and N-related parameters of spring wheat genotypes grown under a low (LN: 2 g N m−2) or high (HN: 27 g N m−2) supply of N.
Year 199819992000
N supply LNHNLNHNLNHN
Grain yield (g m−2)Albis679758464 a,†726 b664 c646 c
L94491699871385 b835 ab685 b787 b
Toronit844853471 a939 a795 a885 a
Biomass yield (g m−2)Albis1376 b16061083 b1878 b1572 a1681 b
L944911421 b1689890 c1892 b1476 b1707 b
Toronit1671 a17531257 a2240 a1666 a1936 a
Shoot N concentration (%)Albis1.41 ab1.49 ab0.95 ab1.53 ab1.37 ab1.81 ab
L944911.47 a1.53 a1.18 a1.58 a1.52 a2.01 a
Toronit1.26 b1.38 b0.94 b1.44 b1.35 b1.71 b
Biomass N yield (g N m−2)Albis19.422.9 b9.2824.57 b19.5326.71 b
L9449120.826.5 a9.4427.83 a19.7433.07 a
Toronit21.524.0 a9.7429.75 a20.1632.03 a
† Within columns, values for the same year followed by different letters are significantly different according to the LSD test (p < 0.05); LN, low nitrogen; HN, high nitrogen.
Table 2. Root growth parameters of three spring wheat genotypes grown under low (LN: 2 g N m−2) and high (HN: 27 g N m−2) in 1999 and 2000.
N supplyParameterUnit19992000
AlbisL99491ToronitAlbisL99491Toronit
LNASYMroots cm−22.011.842.193.75 a,†3.05 b4.12 a
XMID°C460 a429 ab411 b568514538
SCAL°C132 a130 a97 b174160170
HNASYMroots cm−23.373.842.883.232.683.22
XMID°C703 ab744 a546 b509472489
SCAL°C202 ab260 a155 b153139154
† Within rows, values for the same year followed by different letters are significantly different according to the LSD test (p < 0.05); the parameters are ASYM (the asymptotic limit of root density), XMID (the time at which 0.5 of the asymptotic value is reached), and SCAL (the time lag between the time at which 0.5 of the asymptotic value is reached and the time at which the root density reaches 0.75 of the asymptotic value); LN, low nitrogen; HN, high nitrogen.
Table 3. Water percolation and nitrate (NO3-N) leaching during the growing season of spring wheat as influenced by year.
ParameterYearSO-BT †,1BT-SE 2SE-AN 3AN-PM 4Total 5
Water percolation (L m−2)1998150 a45 b23 b6 b225 a
199934 c52 a50 a13 ab152 b
200059 b20 c5 c21 a126 b
NO3-N leaching (g N m−2)19983.84 a0.82 b0.10 b0.01 b4.78 a
19990.65 b0.60 b0.23 a0.01 b1.50 b
20003.23 a1.27 a0.15 b0.28 a4.77 a
Sums over the periods from: 1 sowing (SO) to the beginning of tillering (BT); 2 the beginning of tillering (BT) to stem elongation (SE); 3 stem elongation (SE) to anthesis (AN); 4 anthesis (AN) to physiological maturity (PM); 5 sowing (SO) to physiological maturity (PM).
Table 4. The apparent N recovery (ANR) and isotopic fertilizer N recovery (NR) as influenced by genotype.
ParameterANRNR
19981999200019992000
Albis (%)14.060.6 b,†29.954.0 b36.2 b
L94491 (%)22.574.2 a46.156.6 b47.1 a
Toronit (%)10.181.4 a47.663.7 a48.1 a
† Within columns, values for the same year followed by different letters are significantly different according to the LSD test (p < 0.05); data are the means of three years (ANR) and of the years 1999 and 2000 (NR).

