1. Introduction
Warming during the crop growing season has been shown to reduce grain yields for major crops such as corn, wheat and soybean worldwide [
1,
2,
3,
4,
5]. An analysis of global mean air temperatures indicated that daily minimum temperatures increased at a faster rate than daily maximum temperatures [
6], leading to higher night temperatures. Compared with day-time warming, crop grain yields are particularly sensitive to nighttime warming trends, as shown in rice [
7,
8,
9] and cotton [
10]. Eco-physiological mechanisms leading to the yield losses include increased respiratory carbon loss associated with increased temperature [
10], hastened crop development [
11], impairment to crop reproduction processes (male sterility, pollination, fertilization and grain filling), as well as impact on biological membrane integrity and increased bio-protective enzymes under heat stress associated with warming [
8,
9]. Ultimately crop growth and yield in response to warming depends on the nature and extent of plant acclimation to high temperature stress [
12,
13,
14].
To mitigate the negative impact of increased growing season temperatures on crop growth and yield, especially in low latitude regions, heat- and drought-tolerant crop varieties, as well as modified farm management practices are needed, especially for the areas when irrigation is needed for crop production and irrigation water depends on the underground aquifers. Mohammed and Tarpley [
8] showed that foliar chemical spray can ameliorate growing season heat stress in rice. In C4 plants such as corn, excessive photorespiration under high heat and high light conditions is limited. However, dark respiration, especially the maintenance component [
15], increased at a pattern similar to C3 plants under high temperature. Breeding to create new genetics with compact plants has been shown to improve drought tolerance and grain yield increase in agriculture crops since the last green revolution [
16]. Under global warming scenarios, change in plant architecture from big and tall plants to more compact plants remains to be highly relevant to curb excessive carbon loss through maintenance respiration, yet field demonstration is needed to show agronomic relevance.
Current studies on crop response to high temperature stress almost always considers the plant aerial part (shoot) and its immediate environment, while the adverse effect of high soil temperatures on crop growth has not been examined. As soil temperatures lag behind air temperatures for hours, predicted future scenarios of elevated nighttime air temperatures would potentially further push root-zone soil temperature to higher degrees beyond its already high levels under natural diurnal variation. In warm summer months, the peak of surface soil temperature may occur in early evenings, which may cause excessive carbon loss from maintenance respiration of plant roots exposed to the high temperature. Repeated and prolonged high night temperature stress may compromise plant growth and yield. In past hybrid performance trials, we observed that the same set of corn hybrids had similar plant height but much lower grain yield in Uvalde than in either Halfway or Etter, TX. Uvalde (latitude 29°12’34” N, longitude 99°45’03” W, elevation 276 m) and Etter (latitude 35°59’55” N, longitude 101°59’18” W, elevation 1097 m) are located almost on the same longitude, but Uvalde’s day and night temperatures during corn growing season are much higher due to its lower latitude and elevation. We hypothesized that the lower grain yield (i.e., lower harvest index) in Uvalde was primarily due to higher night temperature and dark respiration. Hence, we propose that a corn crop production system with an improved harvest index (fraction of marketable biomass out of total above-ground biomass at harvest) and water use efficiency, defined as the amount of marketable biomass obtained per unit of water transpired per unit of land area during the crop season, should use corn hybrids with compact plant architecture and irrigation should be applied at a night time to reduce night soil temperature. Delivering irrigation water through drip in early evenings may help reduce soil temperature and thus improve plant growth. Compared to other irrigation methods such as pivot and furrow irrigation, drip system can apply water to the entire field simultaneously. Subsurface drip irrigation system also has the highest irrigation efficiency, applies water directly to the root zone, can use low-capacity wells that may not be used by a pivot system for watering crops. In the Uvalde and the greater San Antonio area, the Edwards Trinity Aquifer is a primary water source for urban and production agriculture. The Ogallala Aquifer is the primary source of water for the High Plains. With the declining water levels of the aquifers, it is critically important to develop plant varieties and crop management practices that can mitigate the high temperatures and drought stress and provide a sustainable and water-use efficient cropping system. We tested our hypothesis in southwest Texas where air temperatures are above national averages year-round. In particular, corn growers in this region typically use high-stature varieties that inevitably incur excessive respiratory carbon loss from roots and transpiration water loss under high night temperature conditions. Thus, we hypothesized that (a) delivering drip water at night-time would improve corn agronomic performance; and (b) using more compact (short-statured) plants may further improve plant growth and grain yield under high-temperature stress situations.
2. Materials and Methods
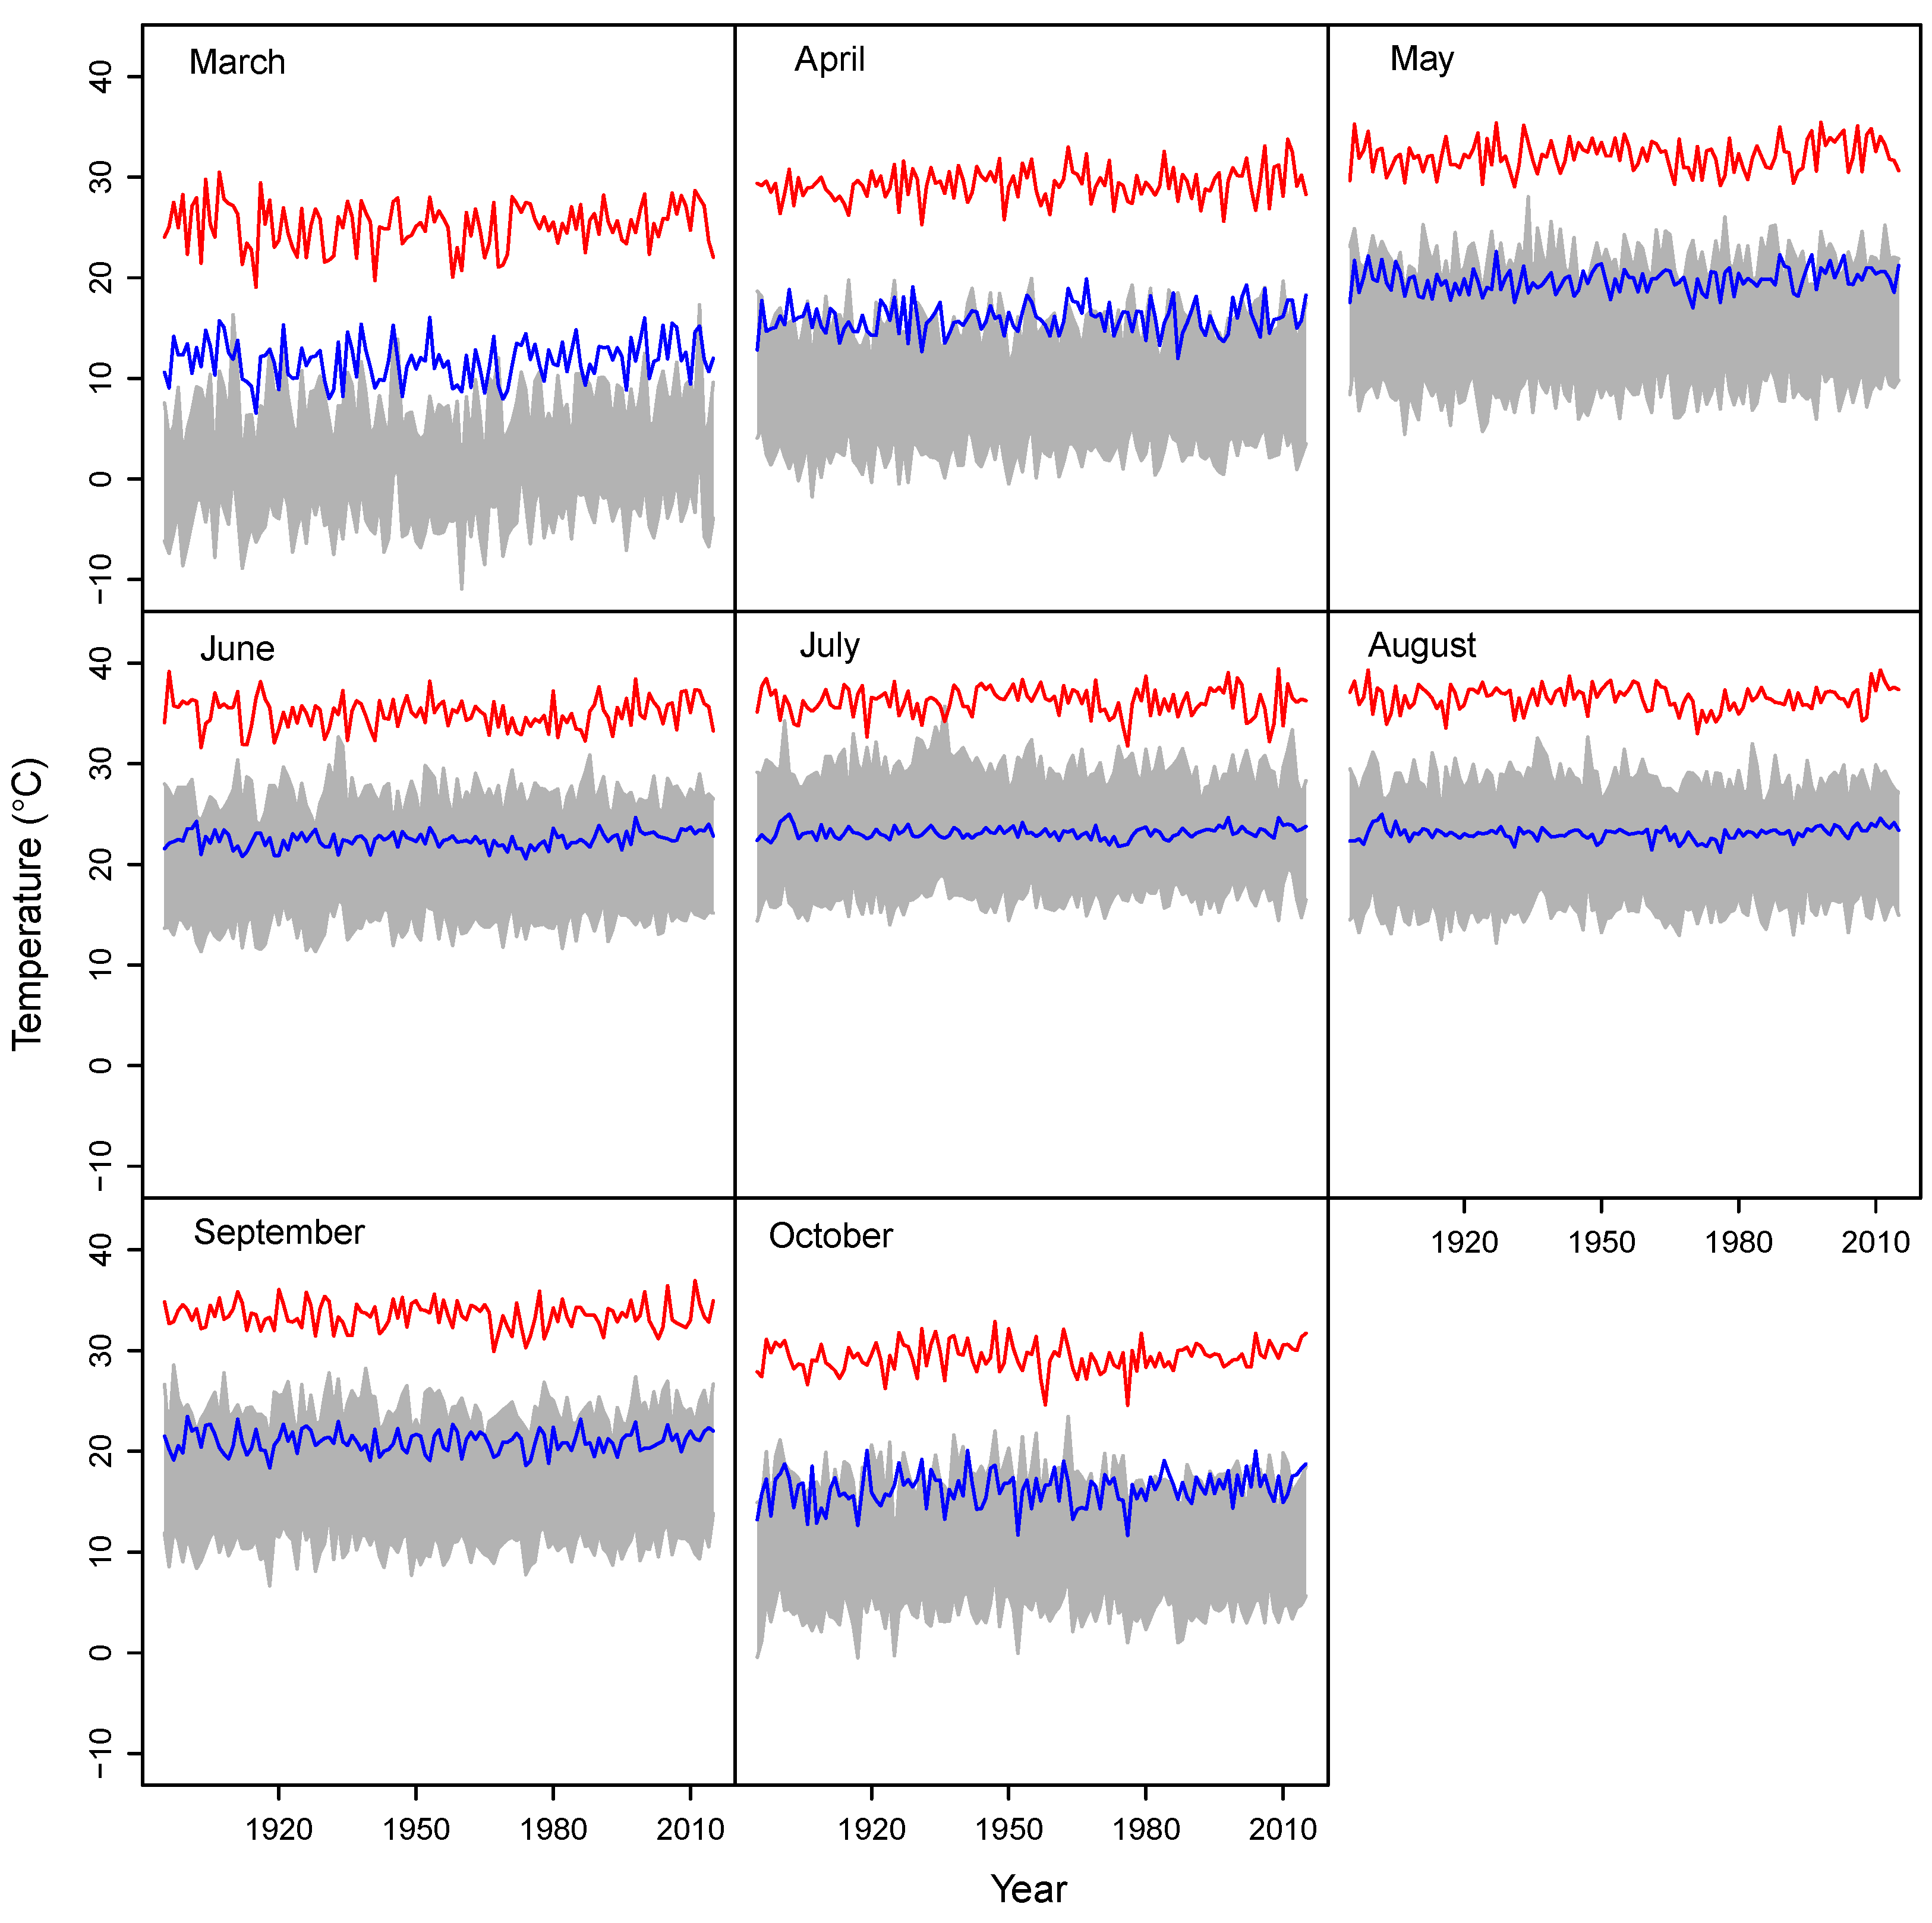
The experiment was conducted in 2014 at the Texas A&M AgriLife Research and Extension Center at Uvalde, TX (longitude 29°12’34″ N, latitude 99°45’03″ W, elevation 276 m) on a clay soil (Hyperthermic Aridic Cal-ciustolls) of the Uvalde series. The study site has a semi-arid climate (see
Figure 1 for the monthly temperatures of corn growing season). Mean annual precipitation is 663 mm and annual evapotranspiration is 1506 mm, and thus irrigation is necessary for crop production. A land area of 0.12 ha was divided into 24 plots, each 3 m × 6 m, arranged as a factorial design, for planting 3 corn hybrids (compact, tall and control hybrid BH9029) and 2 irrigation regimes (day-time
vs. night-time drip). Each treatment was replicated 4 times (see
Supplementary Materials Figure S1). The compact and tall hybrids were developed by the Texas A&M AgriLife corn breeding program in Lubbock, TX, USA and share a common parent line. Seeds were planted manually on 25 March 2014 at 1 m row spacing (each plot had three rows). The plants were harvested on 30 July 2014.
Prior to planting soil samples from top 15 cm depth of soil in each of the 24 plots were collected and chemical properties were determined at the Soil and Water Laboratory at Texas A & M University, College Station. Based on soil test results, 118 kg/ha of N was applied through the drip water during seven irrigation events (each time 17 kg/ha N). No P and K fertilizers were added as soil test suggested these nutrients were not limiting. From March to July 2014, 12 irrigation events (191 mm) of water were applied. Day-time irrigation started at 8:00 a.m. and night-time irrigation at 5:00 p.m. The amount of irrigation applied was determined using a lysimeter-measured reference evapotranspiration (ET), as described in [
18], multiplied by growth-stage specific crop coefficients (Kc) for corn, as obtained from [
19]. Irrigation was applied using a subsurface drip system described in [
20], in which drip tape was placed at 10 cm depth of soil with emitters spaced every 30 cm. The timing of irrigation was set to either day-time or night-time delivery, depending on the treatment. Each irrigation event lasted 4–8 h, depending on the amount of water applied, which in turn was determined by local weather conditions and crop growth stage. On 5 May 2014, six soil water sensors (Model CS-655 Campbell Scientific Inc., Logan, UT, USA) were installed at 10 cm depth (in vicinity of the buried drip lines, which were installed at 10–15 cm depth) in three day-time and three night-time irrigated plots. The soil sensors were connected to a datalogger (Model CR-3000, Campbell Scientific Inc.) to record soil water and temperature data at 30-min intervals from 6 May to 20 July 2014. The datalogger was powered by a solar panel. Air temperatures at 2 m screening height were measured from a weather station located 50 m from the soil temperature measurement plots.
When plants were about 15 cm tall, twelve minirhizotron tubes were installed in selected plots (also see
Supplementary Materials Figure S1) at a 45° angle to measure root growth. The CAB (Cellulose Acetate Butyrate) tubes (1.5 m long 50 mm inner diameter) were installed in a way similar to [
21], involving the use of giddings hydraulic powered soil sampling system (Giddings Machine Company, Inc., Windsor, CO, USA; GSRPST-Model/Serial-1853) mounted to a tractor (Model 2030, John Deere,Moline, IL, USA). In each installation, a hole was bored to insert a rhizotron tube in tight contact with soil but not being bent or scratched. The part of the tubes protruding the soil surface (about 20–30 cm in length) were painted twice using black and white paint to maintain darkness below the soil surface in the immediate vicinity of the tube-occupied space. The vertical insertion depth was about 45 cm. To take root pictures, a digital image capturing system (Model BTC 1-CAP, Bartz Technology Corp., Carpinteria, CA, USA) was guided into the CAB tube and consecutive pictures were taken in 1 cm increments starting at the top cm of soil. The first set of image was taken on 30 April 2014. However, possibly due to recent irrigation the images were corrupted with numerous bubbles, which prevented further root measurement. The pictures taken on 30 May and 30 June were further analyzed to determine root length and thickness using commercial software (the WinRHIZO Tron MF, Regent Instruments Inc., Chemin Sainte-Foy, Québec, QC, Canada). Each image represented a window of 1.4 cm by 1 cm. All the images showing roots were analyzed individually by tracing every and all root segments seen in the images. Plant height, ear height and leaf chlorophyll levels were measured at silking stage. Upon harvest, grain chemical composition was analyzed using near infrared reflectance spectroscopy (NIRS).
To understand the relationship between long-term air temperature and corn grain yield, we retrieved historical data of monthly maximum and minimum air temperatures from the National Climatic Data Center [
17] and available past corn yield data in southwest Texas at National Agricultural Statistics Service [
22]. The historical data were used to help understand field measured results in 2014. Data analysis was done using ANOVA and regression procedures (Minitab Inc., State College, PA, USA) and some of the graphical analysis was done using R (version 3.1.0, R Foundation for Statistical Computing, Vienna, Austria). The complete source data files, as well as computer programs to reproduce all figures, are included in the
Supplementary Files folder.
3. Results and Discussion
Historical weather data (
Figure 1) showed that in southwest Texas both the maximum and minimum monthly air temperatures were much higher than the corresponding temperatures in the American corn belt region [
23] based on 121 years record from 1895 to 2015. Although the corn growing seasons cover different months in southwest Texas (mid-March to late July) and American corn belt region (early May to early October), temperatures in southwest Texas tended to be higher than in the corn belt region (
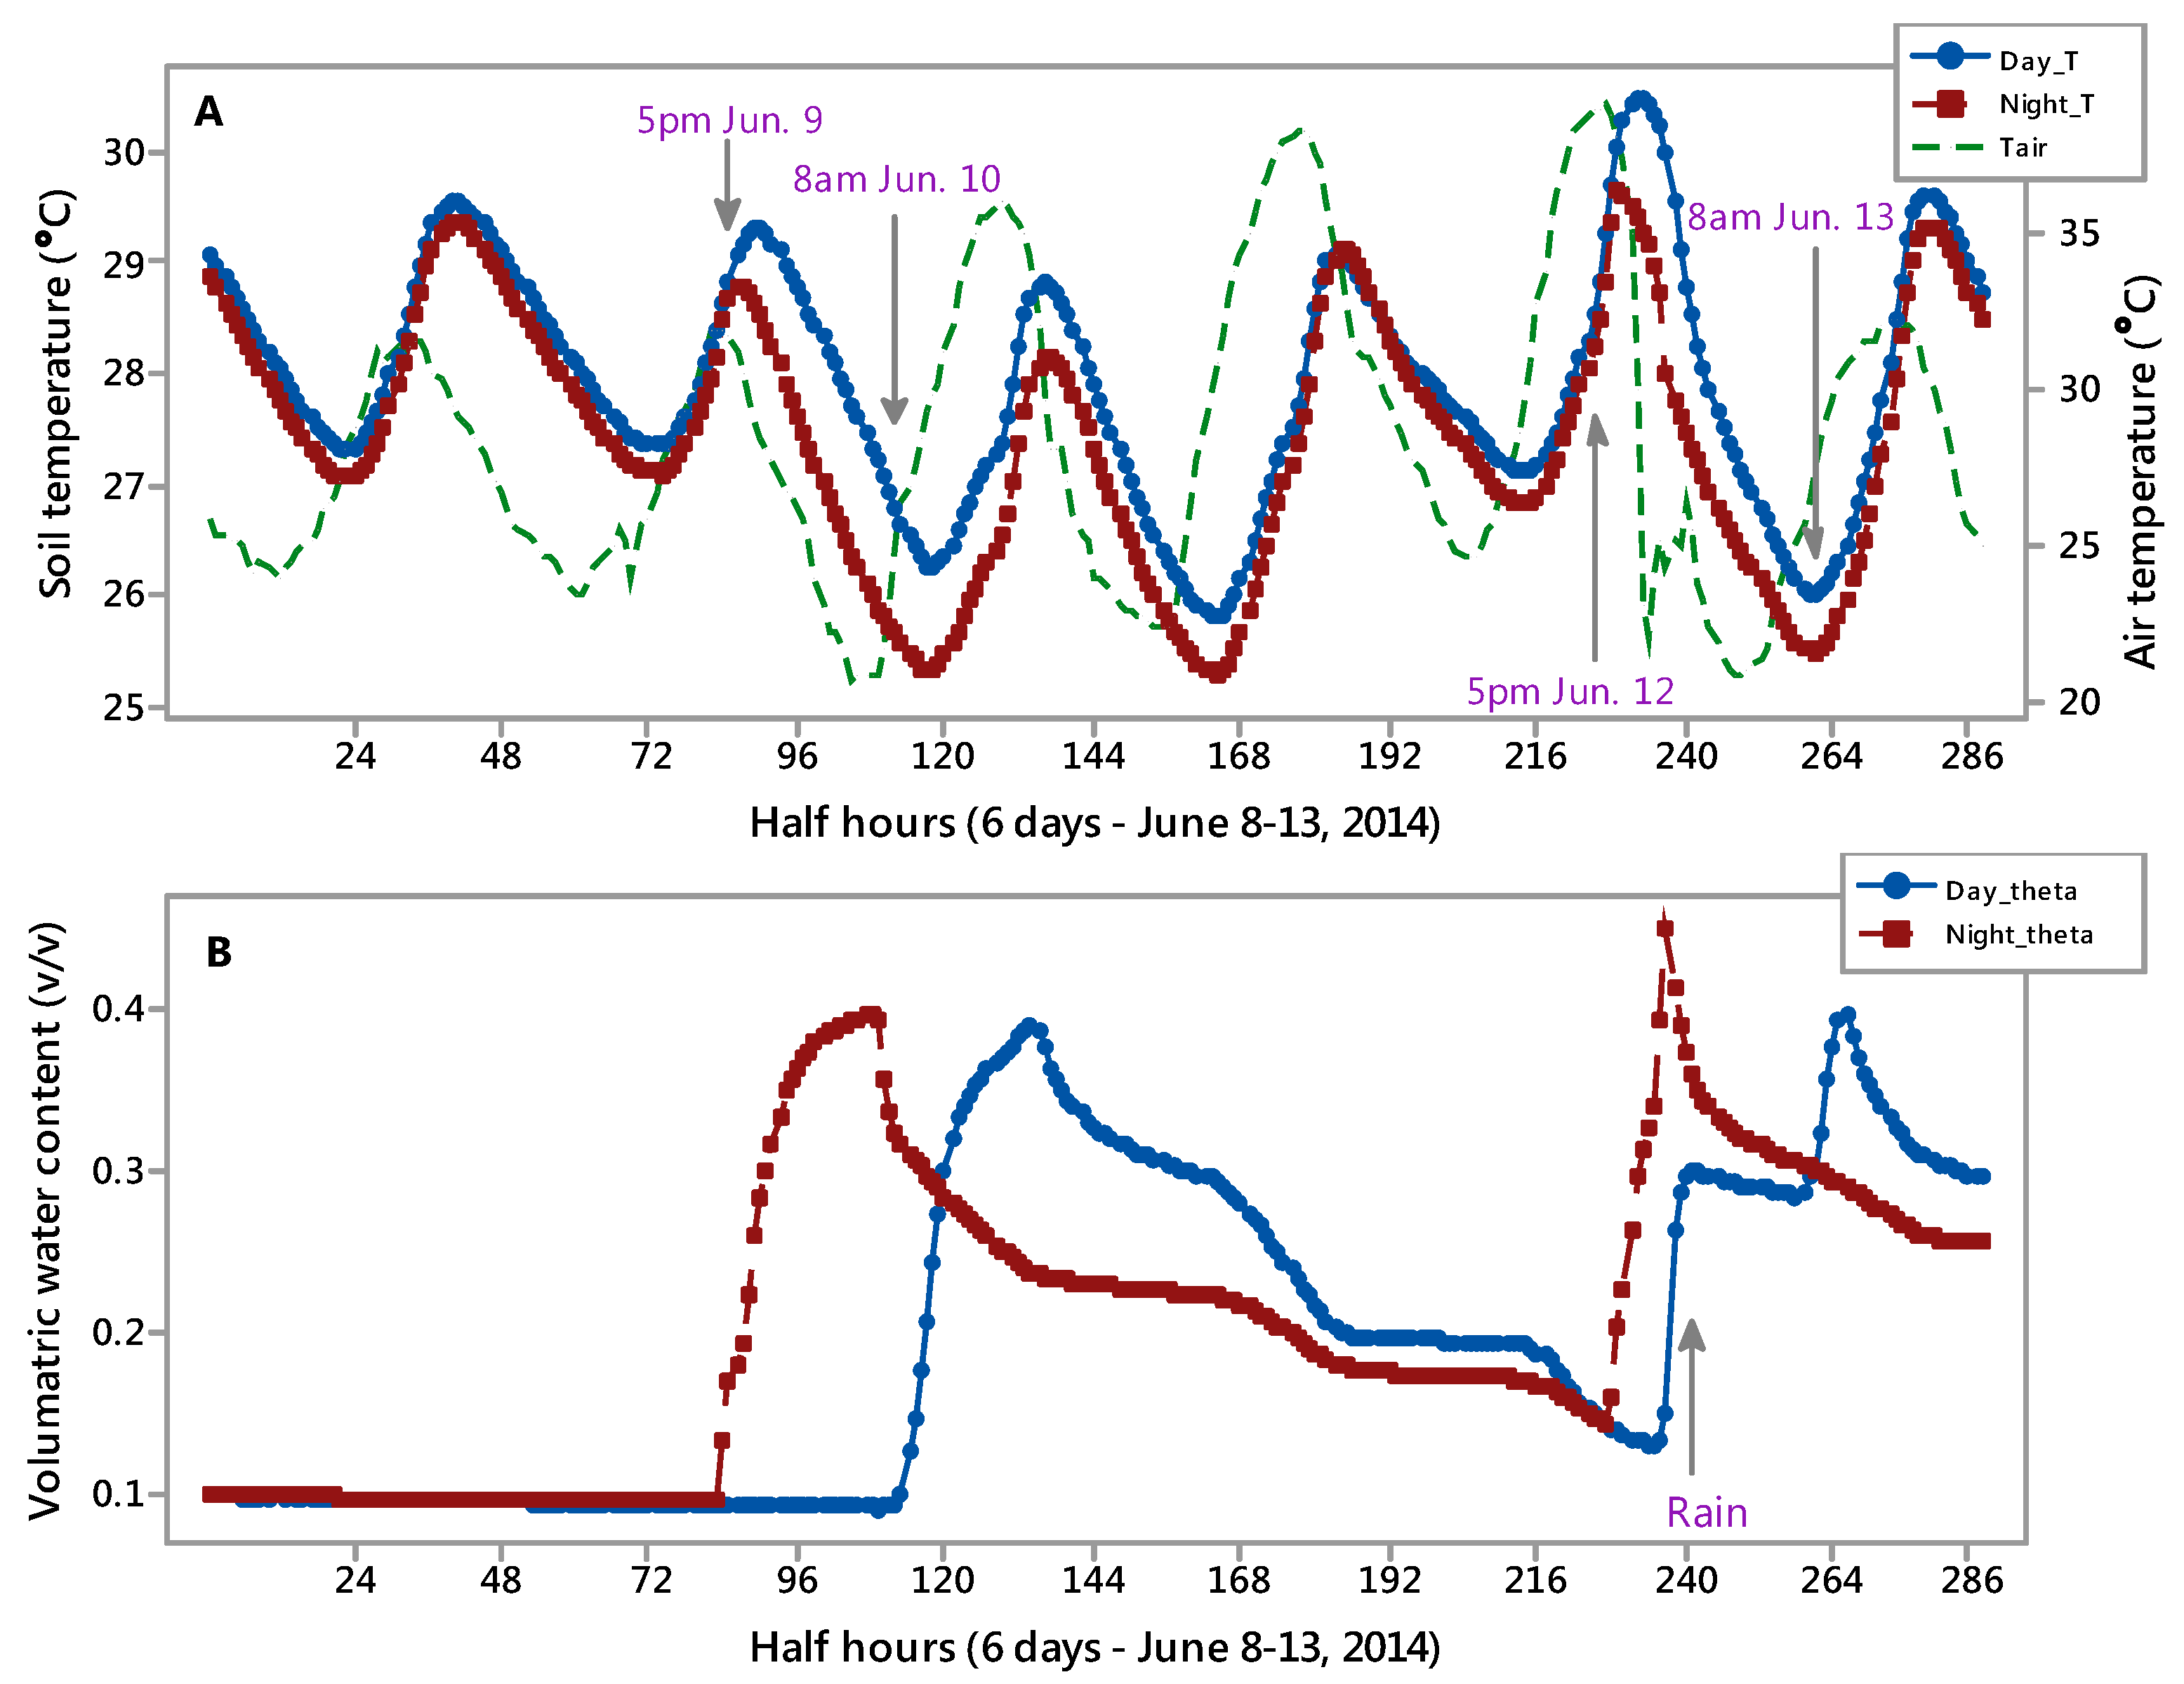
Figure 1). Soil temperatures measured at Uvalde, Texas at the top 10 cm were lower under night-time drip irrigation, when compared with day-time irrigation, as seen in the soil temperature time series during 8–13 June 2014 (
Figure 2). As seen in both 9 June and 12 June, the night-time irrigated plots were irrigated when the soil temperature was near diurnal maximum values, which lagged behind the measured air temperature values by about 4 h). Each irrigation event may last for 5 to 8 h depending on the amount of water applied and depending on actual ET rate on a weekly basis. Following night-time irrigation, soil temperature tended to decrease, as compared to day-time irrigated plots. The day-time irrigated plots received irrigation water at 8:00 a.m. when the soil temperature was near diurnal minimum. For the eight irrigation events from May to July, the time period where soil temperature was measured as given in
Table 1, the standard deviations (SD) of the soil temperature measured at 10 cm depth tended higher under night-time irrigated plots, when compared with the day-time irrigated plots, which were not irrigated until 8 a.m. the following morning. Yet, a paired
t-test (comparing night-time
vs. day-time irrigated plots) showed that the reduction in the 10-cm soil temperatures due to night-time irrigation was statistically significant for the eight days shown in
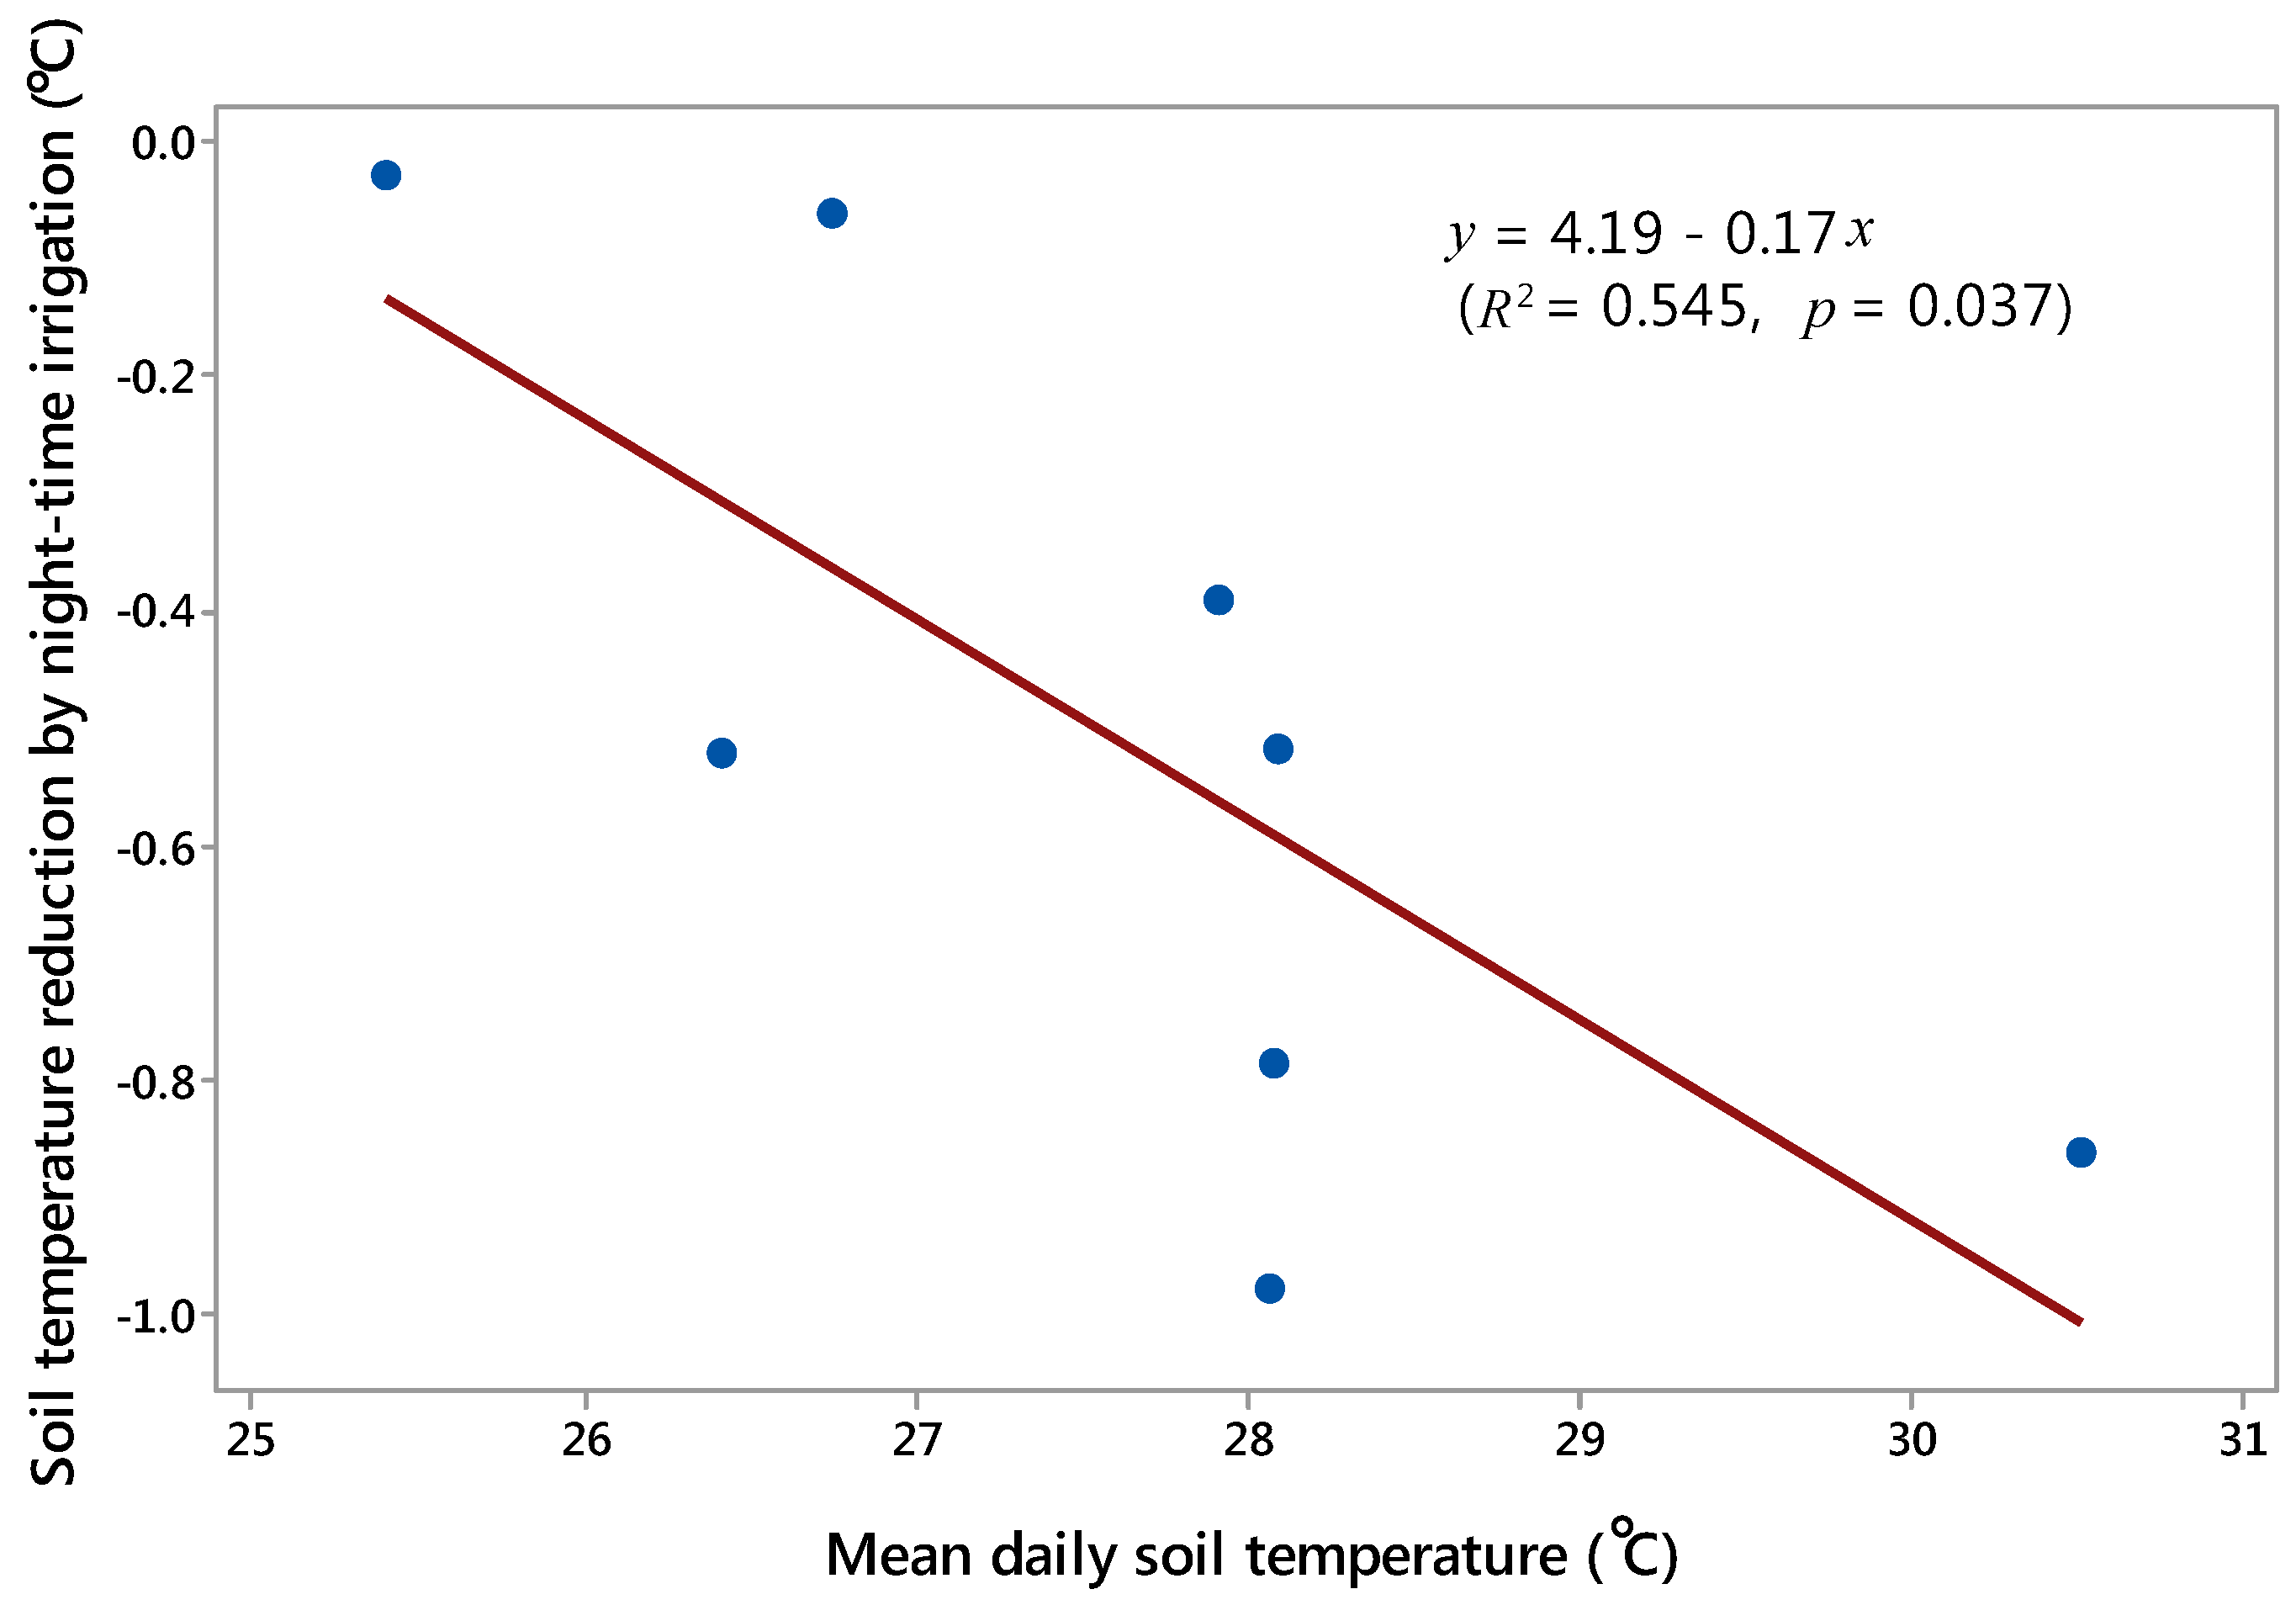
Table 1. The larger SD’s seen in night-time irrigated plots may result from the accelerated soil-air heat exchange in response to the application of water, the temperature of which should be colder than the average 10-cm soil temperature, which was near diurnal maximum at 5 p.m. when the night-time irrigation was applied through drip. Average daily soil temperature during the 74 days from 7 May 7 to 20 July 2014 was 26.8 °C under night-time irrigation regime, as compared to 27.4 °C in the day-time irrigation regime. The cooling effect of night-time drip irrigation is related to the average daily soil temperature, with larger extent of temperature reduction occurring on days when the soil was warmer. As shown in
Figure 3, soil temperature reduction due to night-time irrigation,
i.e., the difference between soil temperature in night-time and day-time irrigated plots, was negatively correlated with mean daily soil temperature, resulting in 0.17 °C reduction in 10-cm depth soil temperature for each 1 °C increase in daily mean soil temperature. This demonstrates that soil temperature may be reduced by applying water, even though we could not change the high night air temperature. The median temperature of the well-water used for irrigation is usually at 19.2 °C, ranging from 17.4 °C to 23.7 °C [
24].
Overall, our results suggest that delivering well-water at night-time through drip irrigation reduced root-zone soil temperature by 0.6 °C, increase root length by five folds, plant height by 2%, and marginally increase grain yield by 10% on the average. It is interesting, however, to note that the grain yield in the control hybrid BH9029 increased as much as 29% under night-time irrigation. This contrasts the measured modest increases in root length and plant height in this hybrid (
Table 2). The underlying mechanisms for such large extent of increase in yield in BH9029 are unclear from the physiological data we have so far. Further experiment and analysis is needed to investigate this important trend. Although our original focus in this experiment was on the changes in soil temperature and the same amount of irrigation was applied to two types of plots (night-time
vs. day-time irrigation), it is still possible that changes in soil temperature may cause changes in soil thermal fluxes and thus some changes in soil water content and plant water relations, which in turn may have influenced plant growth. We measured leaf stomatal conductance and photosynthetic rates, using a LI-6400 Portable Photosynthesis System (LI-COR Bioscience, Lincoln, NE, USA); however, the results obtained were inconclusive due to cloudy conditions on the day of measurements. Other types of plant water relations parameters were not measured and we leave this for future work. Yet, we speculate that the effect of night-time irrigation on water use efficiency may be an indirect one, in which night-time irrigation first influenced soil temperature and root growth, and over time, the changed root growth may affect plant water uptake and water use efficiency.
The kernel chemical composition (
Table 3), ear height, leaf chlorophyll content and stomatal conductance did not exhibit a clear response to irrigation timing (data not shown). When root length results are compared between two measurement dates (
i.e., from 30 May to 30 June 2014, seen in
Table 2), roots of the compact hybrid showed no further extension under day irrigation, but continued to grow under night-time irrigation. Different from our hypothesis, the shorter, more compact corn hybrid did not exhibit a higher yield and growth as compared with taller hybrids. It was possible that the advantage of this compact genotype was not realized due to the below-average temperatures in May and June 2014 as compared with the long-term averages in the Uvalde region (
Figure 1). We speculate that, in a warm and dry summer, which is common in southwest Texas, delivering cool irrigation water, in our case it was pumped from 30 m deep aquifer, through a drip irrigation system would have more significant impact on corn carbon balance and yields.
The average corn grain yields in the past 47 years in southwest Texas was negatively correlated with the air temperature during the crop growing season from April to July (
Supplementary Materials Figure S2), except for the case using April minimum temperature in which the correlation was positive (
p = 0.05). The first difference was calculated as the difference in temperatures (or yields) between two consecutive years within the 47-year time series (shown as Δ in
Supplementary Materials Figure S2). The reason for using the first difference of yields and temperatures, instead of the originally recorded yields and temperatures, is to “filter out” longer term improvements of corn yields due to technological advances and crop management (including new variety releases), which tended to happen over longer time scale than within two consecutive years [
5]. This approach makes sense here in our case since we are interested in seeing the effect of growing season temperature changes on corn yields. From May to July, while there were no statistically significant differences in the slopes of the ΔYield
vs. ΔT regressions in
Supplementary Materials Figure S2 (using method of [
25]), numerically, corn yield reduction in southwest Texas tended to be more sensitive to the increases in monthly minimum temperature, than maximum temperatures. These responses have also been shown in other regions [
1,
7,
10].
Although a number of reports have focused on crop yield reduction under climate warming, to our knowledge, this is the first report on the effect of cooling soil temperature and its positive effect on crop growth and yield under field conditions. The fact that adjusting irrigation timing would not incur an extra cost for farmers, the finding reported here has immediate practical implications for farm scale adaptation to climate warming climate, which has become eminently important for agriculture at the global scale. At the same time, we acknowledge that modifying root-zone soil temperature to achieve a beneficial agronomic goal is a difficult problem and that this experiment is an attempt to do an initial evaluation. Targets of future research include elaborating eco-physiological and biophysical mechanisms responsible for the observed positive yield effect due to adjusting irrigation timing under controlled and open field conditions. In particular, the following questions may be further explored:
- (1)
How much do root and whole plant respiration and growth rate differ between night-time irrigated and day-time irrigated corn? What about changes in root metabolites and enzymes and how they respond to irrigation timing?
- (2)
What is the extent of changes in temperature regimes of deeper soil profile, as well as the soil-plant system thermal balance, due to the use of night-time irrigation through surface drip system?
- (3)
If and to what extent the use of night-time irrigation through surface drip system may modify soil and plant water relations and water use efficiency? What are the ecophysiological mechanisms involved?


