Article

Growing Degree Days during the Late Reproductive Phase Determine Spike Density and Cognate Yield Traits

1
Rice Research Institute, Sichuan Agricultural University, 211-huimin Road, Chengdu 611130, Sichuan, China
2
Department of Plant Breeding and Genetics, University of Agriculture, Faisalabad 38000, Pakistan
3
Department of Renewable Resources, University of Alberta, Edmonton, AB T6G 2H1, Canada
4
Sugarcane Research Institute, Ayub Agricultural Research Institute (AARI), Faisalabad 38000, Pakistan
*
Authors to whom correspondence should be addressed.
Submission received: 15 August 2018 / Revised: 28 September 2018 / Accepted: 29 September 2018 / Published: 4 October 2018

Abstract

:
Drought has become more frequent in central Asia causing large losses in cereal yield. To surmount the existing problem, it is imperative to emphasize early maturing varietal development. However, the impact of heat units on spike morphology and its relationship with yield potential is still unclear. Thus, the current investigation was carried out to test wheat lines and varieties for variation in total heat unit’s accretion for anthesis and maturity and to understand the manipulating impact of sunlight on spike morphology, grain yield and its cognate traits. Furthermore, the gene action controlling major traits inheritance, combining ability effects, heritability, and association studies were also estimated. Following the Half Sib/Full Sib approach 27 hybrids along with 12 parents were tested. Results depicted broad variation in genetic stock. Correlation study demonstrated that earliness negatively affects the yield, while positively influencing spike density. Genetic variances were greater than variances due to environment, pointing to higher heritability (>50%) for all the characters except for grain’s weight spike−1. The degree of dominance revealed that the partial and over-dominant type of gene action conditioned inheritance of investigated traits. Thus, earliness can be used as an indirect selection criterion for yield advance.

1. Introduction

The primary concern of many researchers is about yield’s enhancement. During the past few decades, the improvement in production is not as obvious as it was half a century ago, while the increase in population is at its highest [1]. To keep rising wheat yield at a similar pace of population growth, we have to rely on genetic improvements more than ever [2]. No significant new growing areas will be incorporated in the future, nor will the contribution of management practices be noteworthy enough to improve yield, due to environmental and economic concerns. The apparent trend in current production showed a negligible increase in average yields. There is a need to employ alternative approaches for yield improvement. It could be possible either by nutrient supplementation in crop species (biofortification) [3] or by direct or indirect selection criterion for yield improvement. A majority of the crops are supplemented for health benefits with various elements like selenium, zinc, amylose and organic micronutrients [4], while the process of supplementation by means of exogenous fertilizers lead towards positive as well as negative impacts on crops physiology [5]. Environmental and abiotic factors have influential effects on yield and can serve as indirect selection criteria for its improvement. In this context, physiological basis provides help to identify opportunities for future breeding (using either conventional or molecular tools) and may help to break the apparent barriers to keep yield gains as healthy as they used to be during the 1960–1990s [6].
Harsh climatic conditions, especially the damaging impacts of abiotic factors (specifically drought) on the physiological response of plants, manipulate the normal functioning of crop species. In addition, genetic and environmental interactions greatly influence yield. The efforts to attain yield improvement of major field crops are always demanding. For a successful breeding program, the selection of parents is of immense importance. Based on the magnitude and nature of variation among the population and the association of connate characters, better parents can be selected [7]. Production can be enhanced by developing early maturing varieties, which must be productive and can be grown in different stresses and agro-climatic conditions. Selection for the improvement in grain yield can be most effective only when the genetic material displays variability [8]. A technique developed by Kempthorne is a powerful tool to use in pedigree selection, in order to assess combining ability estimates among parents and progenies [9]. The performances do not obligatorily predict the combining abilities of parents as a good or poor combiner. To overcome this arduousness, it is essential to amass knowledge about gene actions [10]. The information about heritability adds another dimension in assessing the natural response. Heritability is determined by the type of gene action and gives information about genetic variability. Hence, it is valuable to predict the selection response in the prospering generations [11]. Selection in early generations with desirable characteristics can be fruitful with higher heritability along with high genetic advance [12]. However, the association studies for earliness and heat units consumed by the crop to attain its physiological maturity, and how it affects the spike density and yield of the plant is still unclear.
Wheat served as an important everyday diet worldwide and belongs to family Poaceae, being the leading cereal worldwide and staple food in Pakistan. It has more nutritional value than any other food source, provides 55% of the carbohydrates and 20% of the calories of the world’s need annually [13]. Diversified climatic and abiotic factors certainly influence its yield. Hence, all the minor factors should also be taken into consideration for future use and are of similar value as major productive traits. However, our understanding of the influence of climatic factors on spike morphology and yield potential is limited, especially in wheat. The present investigation was directed to explore the nature and magnitude of gene action, heritability and association studies for growing degree days and yield cognate traits in Triticum aestivum L. and their possible interactive roles for improved production.

2. Materials and Methods

2.1. Experimental Conditions

The experiment was carried out at coordinates 31.4310° N, 73.0695° E during the 2013/2014 and 2014/2015 cropping season. To test the correlations and nature of gene action, material from our previous report was used [14]. Three male testers viz; E-108, E-113, E-114 (of International Maize and Wheat Improvement Center (CIMMYT) origin) represented broad genetic base and nine locale female parental lines (three varieties and six inbred lines) viz; Punjab-11 abbreviated as PB-11, AAS-11, AARI-11, 9859, 9860, 9861 and 9730, 9731, 9733 were crossed using line × tester mating design and 27 F1 hybrids developed during the 2013/2014 cropping year. The seeds were sown in three replications using randomized complete block design (RCBD) during the 4th week of November of the 2014/2015 cropping season. The distance maintained for plant × plant and row × row was 15 cm and 30 cm respectively. The data presented for parents were the pooled data of two years (when parental material was used to develop crosses 2013/2014, and next year sown with crosses 2014/2015) and presented as mean average data of 2 years while the data presented for F1 was 1-year triplicate mean average data. Moreover, triplicate experimental repeats of the material at different places made the results statistically more reliable.

2.2. Agronomic Practices and Data Collection

Data were collected for metric traits, namely: Days to 50% maturity, productive tillers plant−1, ×1000-grain weight (g), and grain weight spike−1 (g) measured in grams [15]. Growing degree days (GDD) (measured in terms of heat units from sowing to complete maturity of the crop) was calculated according to [16] with a little modification i.e.,
GDD = ((Max TempMin Temp of a day)/2) − base temperature of the crop,
Temperature was taken in degrees Celsius (°C) while base temperature of the crop was set as 5.
Spike density (SD) was measured by the formula:
SD = Fertile spikelets per main spike/Spike length (cm),
Genetic variances were computed, using general combining ability (GCA) and specific combining ability (SCA) values, as [17]
Additive genetic variance (б2D) = 2 × б2GCA,
Dominance genetic variance (б2H) = б2SCA,
б2 = Variance, б2GCA = Variance of GCA, б2SCA = Variance of SCA.
Expected genetic advance (GA) was evaluated with one selection cycle at 10% selection intensity as [18]
G A = K × σ 2 P × h 2 ,
K = selection differential, being 2.06 and 1.75 at 5% and 10% selection intensity, respectively.
σ 2 P = standard deviation of the phenotypic variance of the population under selection.
h2 = heritability estimates in fraction of the trait under study.

2.3. Statistical Analysis

Data were expressed as means with least significant difference (LSD) in order to separate and compare the means, then subjected to analysis of variance (ANOVA) [19]. General combining ability (GCA) and specific combining ability (SCA) effects were determined as in an earlier report [20]. The t-test (2 and 1 tailed) at p ≤ 0.05 or 0.01 was applied to test the significance for correlation and combining ability estimates. Correlations and heritability analysis were performed using Agricolae package “R” version 3.4.2 [21]. Other statistical analyses were performed using Microsoft Excel 2016 and GenStat (10th statistical package) [22].

3. Results and Discussion

The analysis of variance for combining ability exposed significant differences among all traits for parents and hybrids. The mean values, combining ability effects, nature of genetic control for the inheritance of traits and the proportion of heritable change were accessed. However, correlation studies of earliness influencing spike density and yield were the major concern under study.

3.1. Estimation of Mean Square Values

Concomitant paramount differences were observed between mean square values. Treatment effects were highly significant for all traits under study at probability p ≤ 0.01, while non-significant differences were observed between replications. Parents and crosses depicted highly significant differences for all traits. While parents vs. crosses (interaction) revealed differences that were highly significant for ×1000-kernel weight and spike density. Adequate genetic variability was present in the material to assess combining ability effects (Table 1).

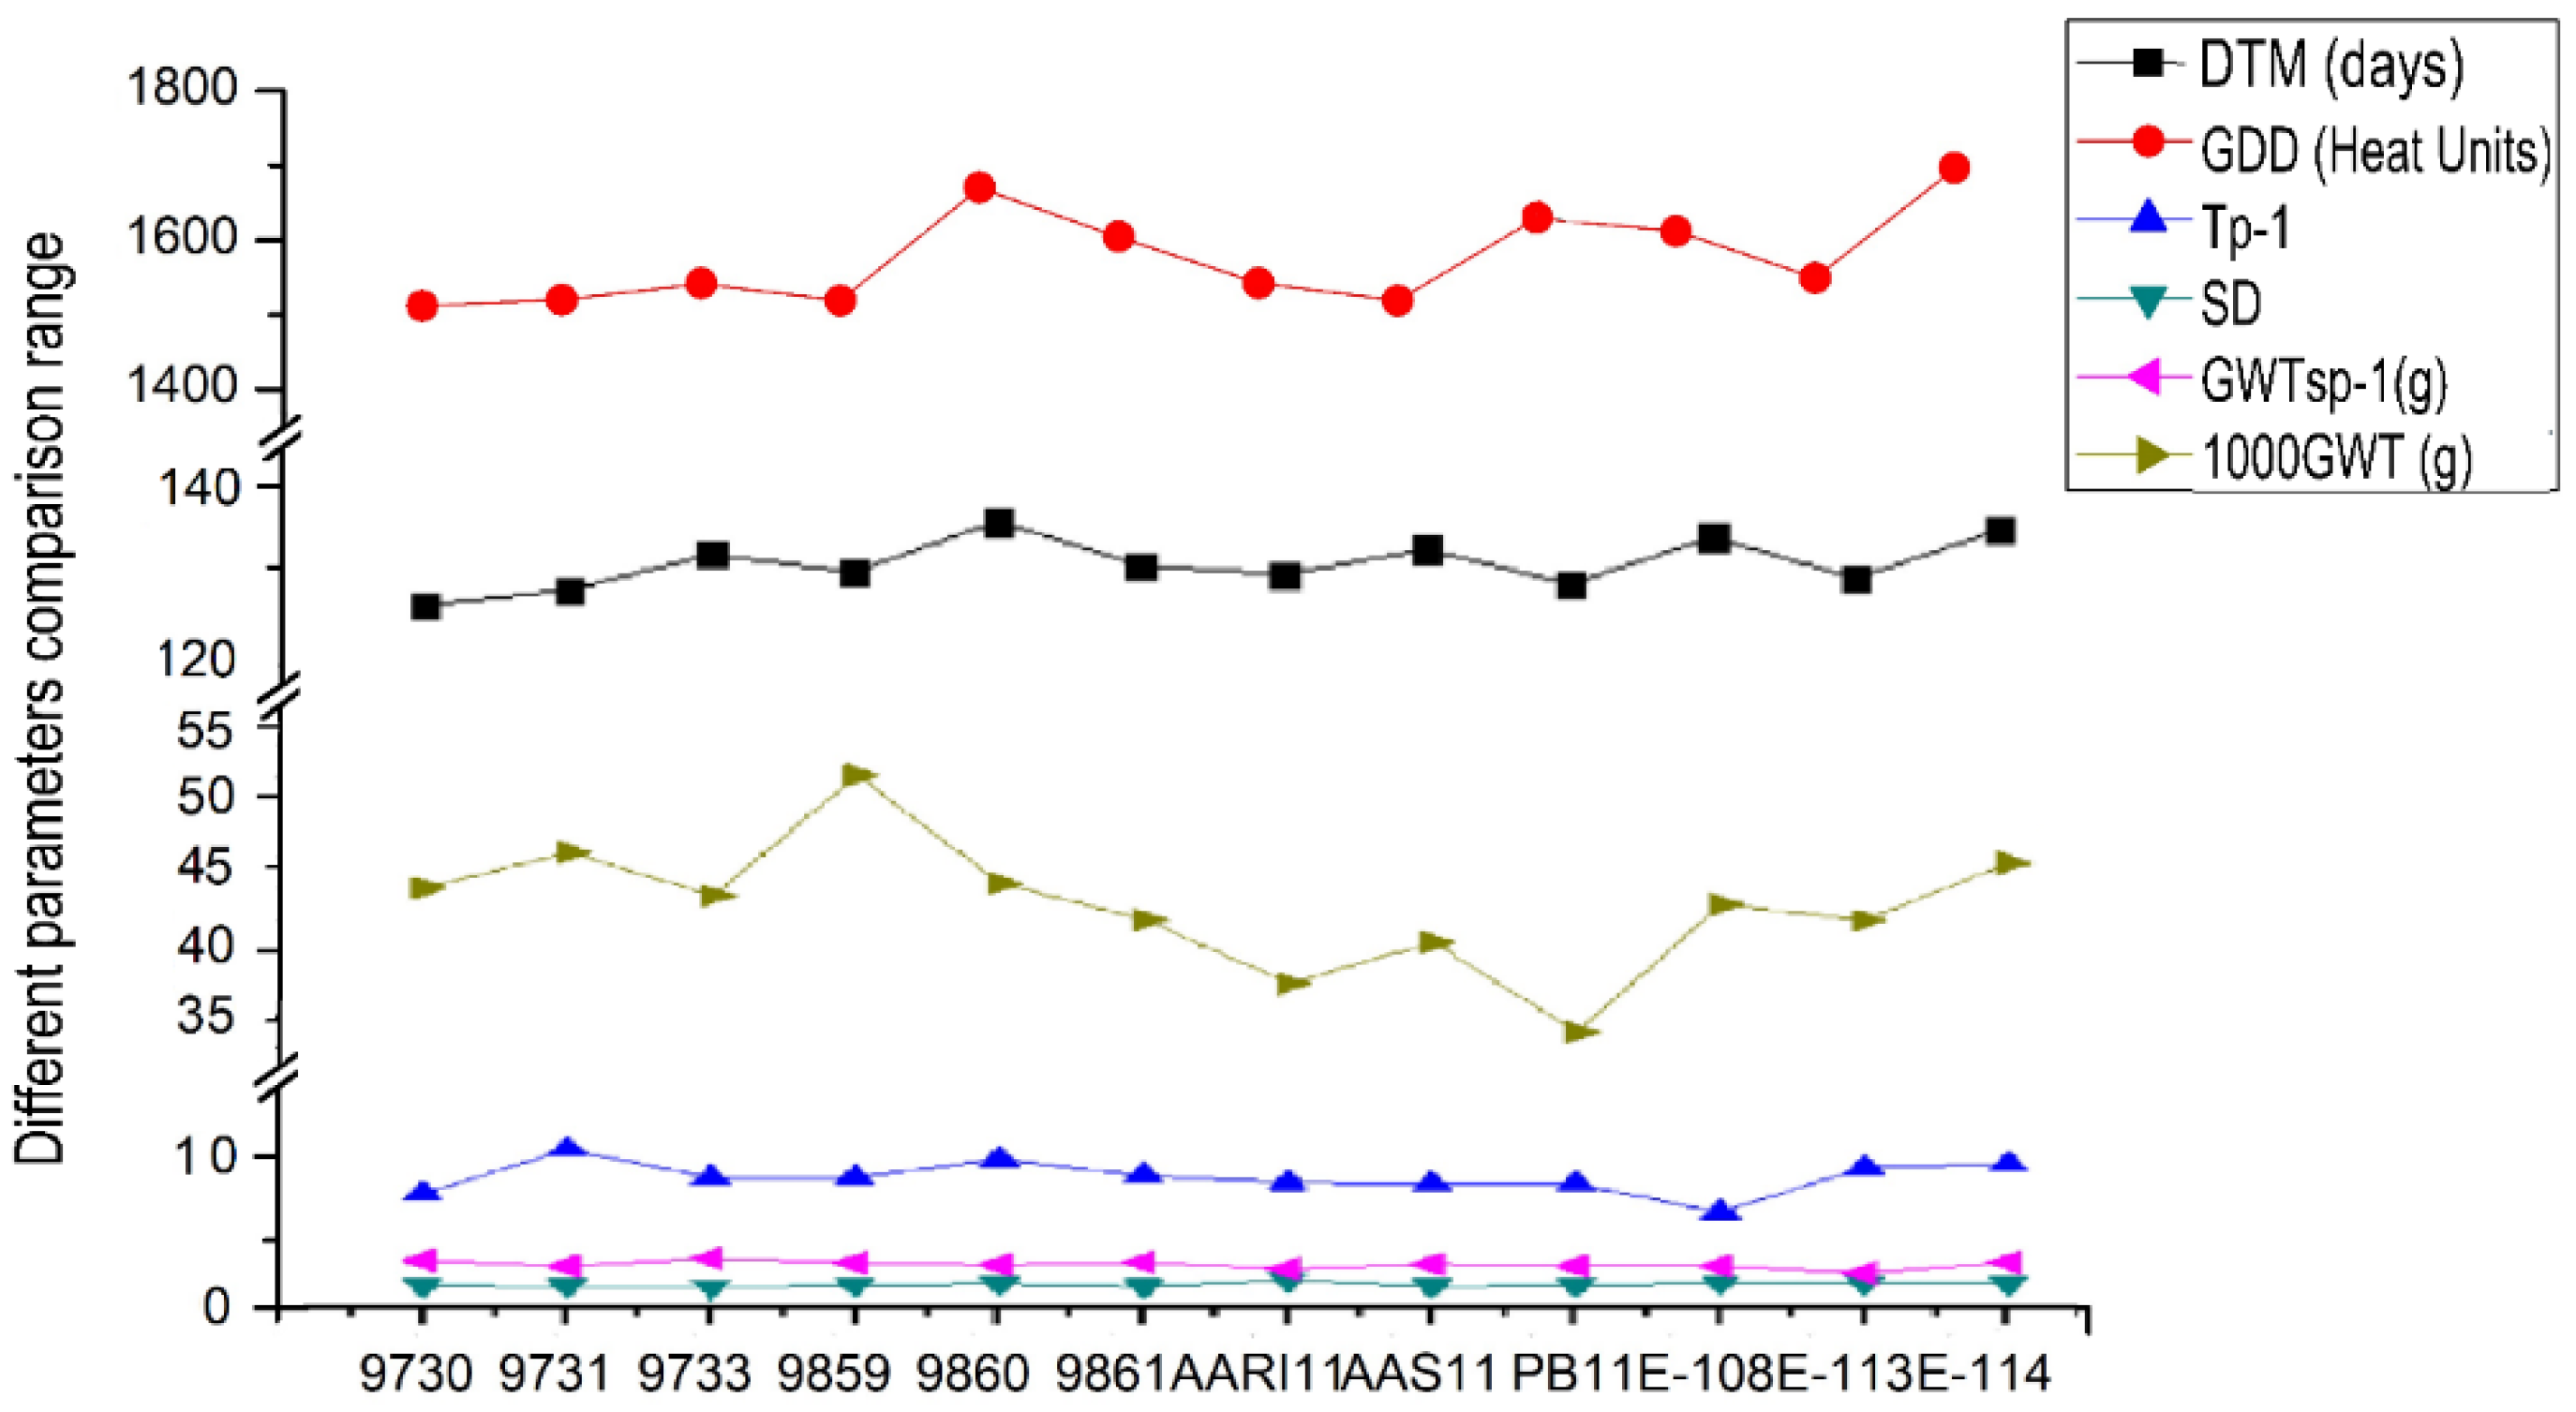
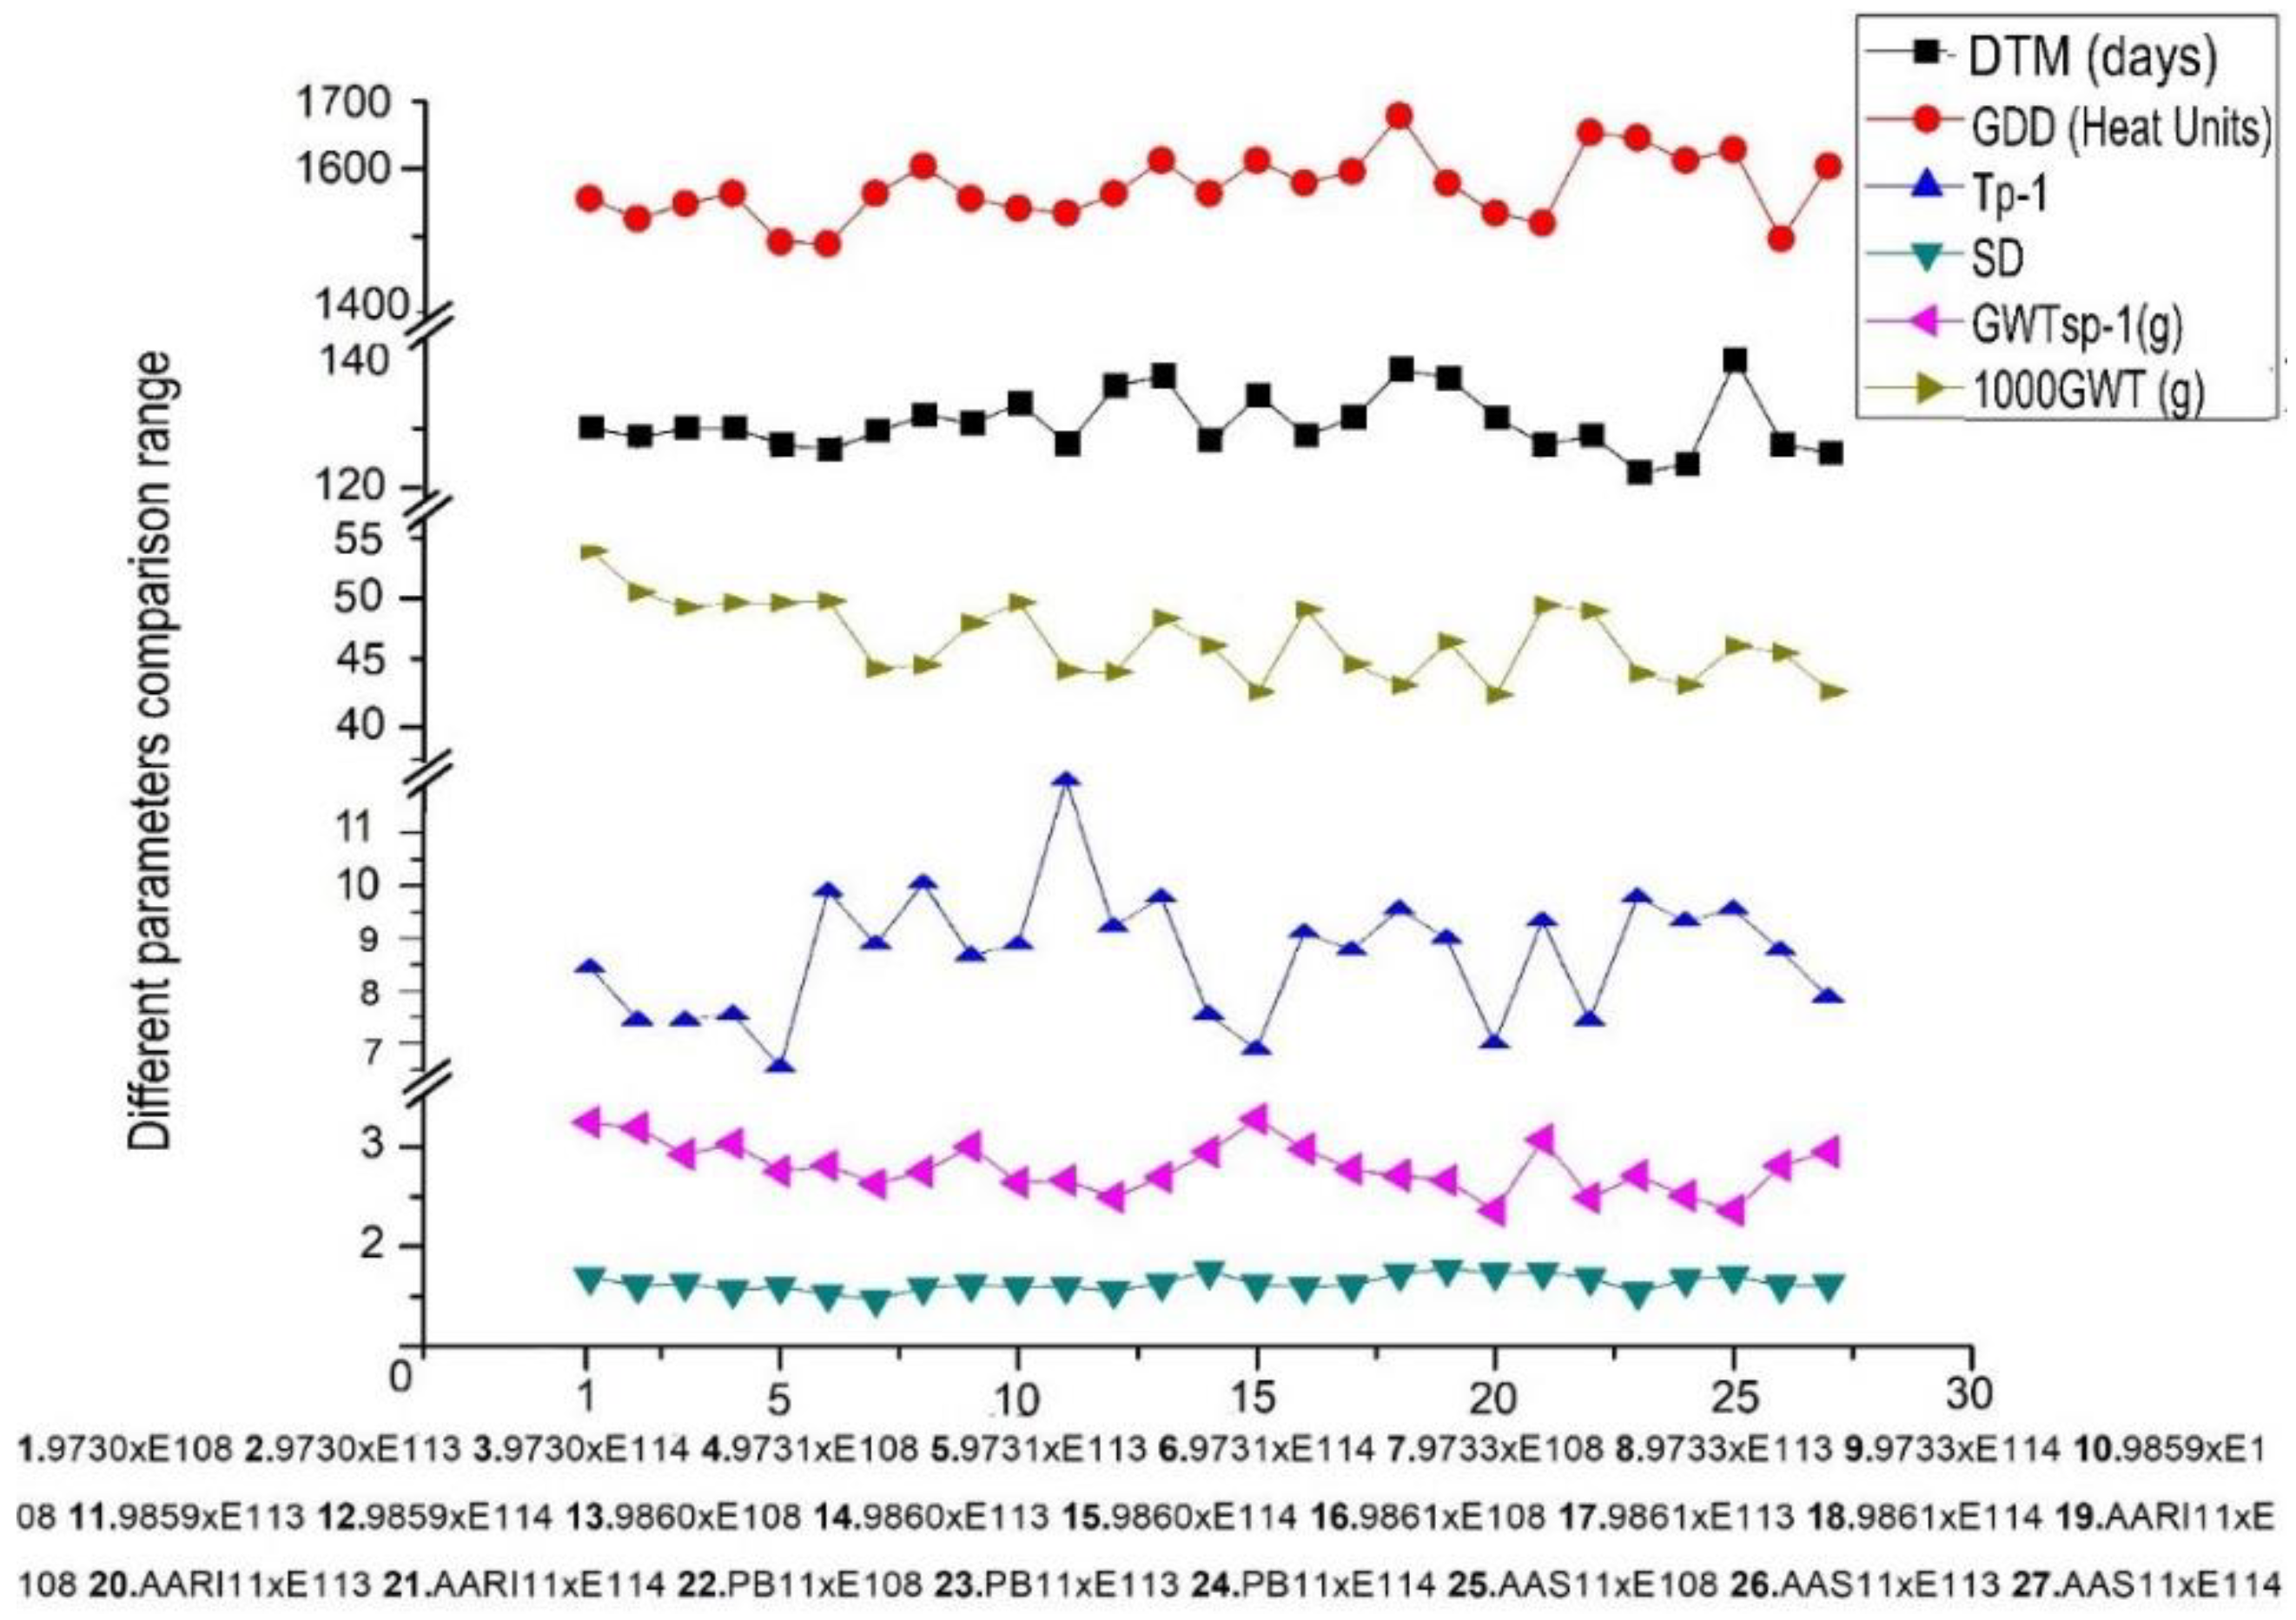
3.2. Study of Mean Values among Parents

Genetic variation and mean performance could be exploited for genotypic evaluation of the parents and hybrids. The average mean differences were 130.9 days, 1584.6 heat units, 8.69 tillers, 1.68, 2.83 g and 44.16 g for parameters like days to 50% maturity, growing degree days, tillers plant−1, spike density, grain weight spike−1 and ×1000-kernel weight respectively (Figure 1). Moreover, overall mean differences revealed that lines and hybrids were 2.15 days earlier and consumed 57.2 fewer heat units to meet their physiological maturity, while hybrids gained ×1000-kernel weight advantage of 3.47 g over parents. Parents along with hybrids depicted similar results for tillers plant−1, spike density and weight of grain spike−1. Among parents, line 9730 performed better with the least mean value (126.03 days) for days to 50% maturity and (1512.12) growing degree days. Hence, early maturing parents could be preferred to overcome the drought problem. Maximum tillers contributed as (10.6) by line 9731. Line 9859 showed a promising advantage for ×1000-grain weight (51.667 g) with the weight of grain spike−1 (3.02 g). While AARI-11 was superior for spike density (1.88).
Unlike parents, the average mean differences for hybrids showed broad variation for almost all the traits: 13.66 days, 189.25 heat units, 5.44 tillers, grain weight spike−1 (0.913 g) and ×1000-grain weight (11.93 g) (Figure 2). The minimum mean values were observed in crosses PB-11 × E-113 and 9731 × E-114 for days to 50% maturity and growing degree days respectively. However, mean performances are not a valid measure to assess variation between parents and hybrids. Screening of genetic stocks should be based on GCA/SCA effects, not just mean values.

3.3. Estimation of GCA and SCA Effects

Among lines, 9733 and PB-11 proved best for days to 50% maturity, growing degree days, tillers per plant and spike density. While testers E-108 and E-114 were best for growing degree days, spike density, grain weight and productive tillers plant−1 [23]. The lines 9731, 9860 and 9861 showed high GCA effects for spike density and grain weight per spike (Table 2). Both poor and good combiners can contribute to the elevated performance of a specific cross combination, by crossing recessive and dominant alleles from them respectively [24].
Crosses which showed significant positive effects for kernel yield are listed in Table 3. The combination AARI-11 × E-114 holds potential to be used as the best hybrid for the traits: Weight of grain, ×1000-kernel weight, tiller plant−1, growing degree days and spike density. Similar significant SCA effects were observed in cross combination AARI-11 × E-108 in the desired direction for productive tillers, GDD, spike density and tillers plant−1. 9731 × E-108 and AARI-11 × E-114 exhibited significant negative SCA effects for days to 50% maturity and growing degree days. Although positive SCA effects were also observed in them for yield traits. A similar trend in cross combinations 9730 × E-113, 9860 × E-108, 9860 × E-114 and 9861 × E-113 was observed for earliness and ×1000-kernel weight. The trend fluctuated among different cross combinations for the traits under study (Table 3). The parents with good GCA can also be used to develop a pure line with the yield improvement due to the additive type of gene even though these cross combinations depicted non-significant SCA effects [25].

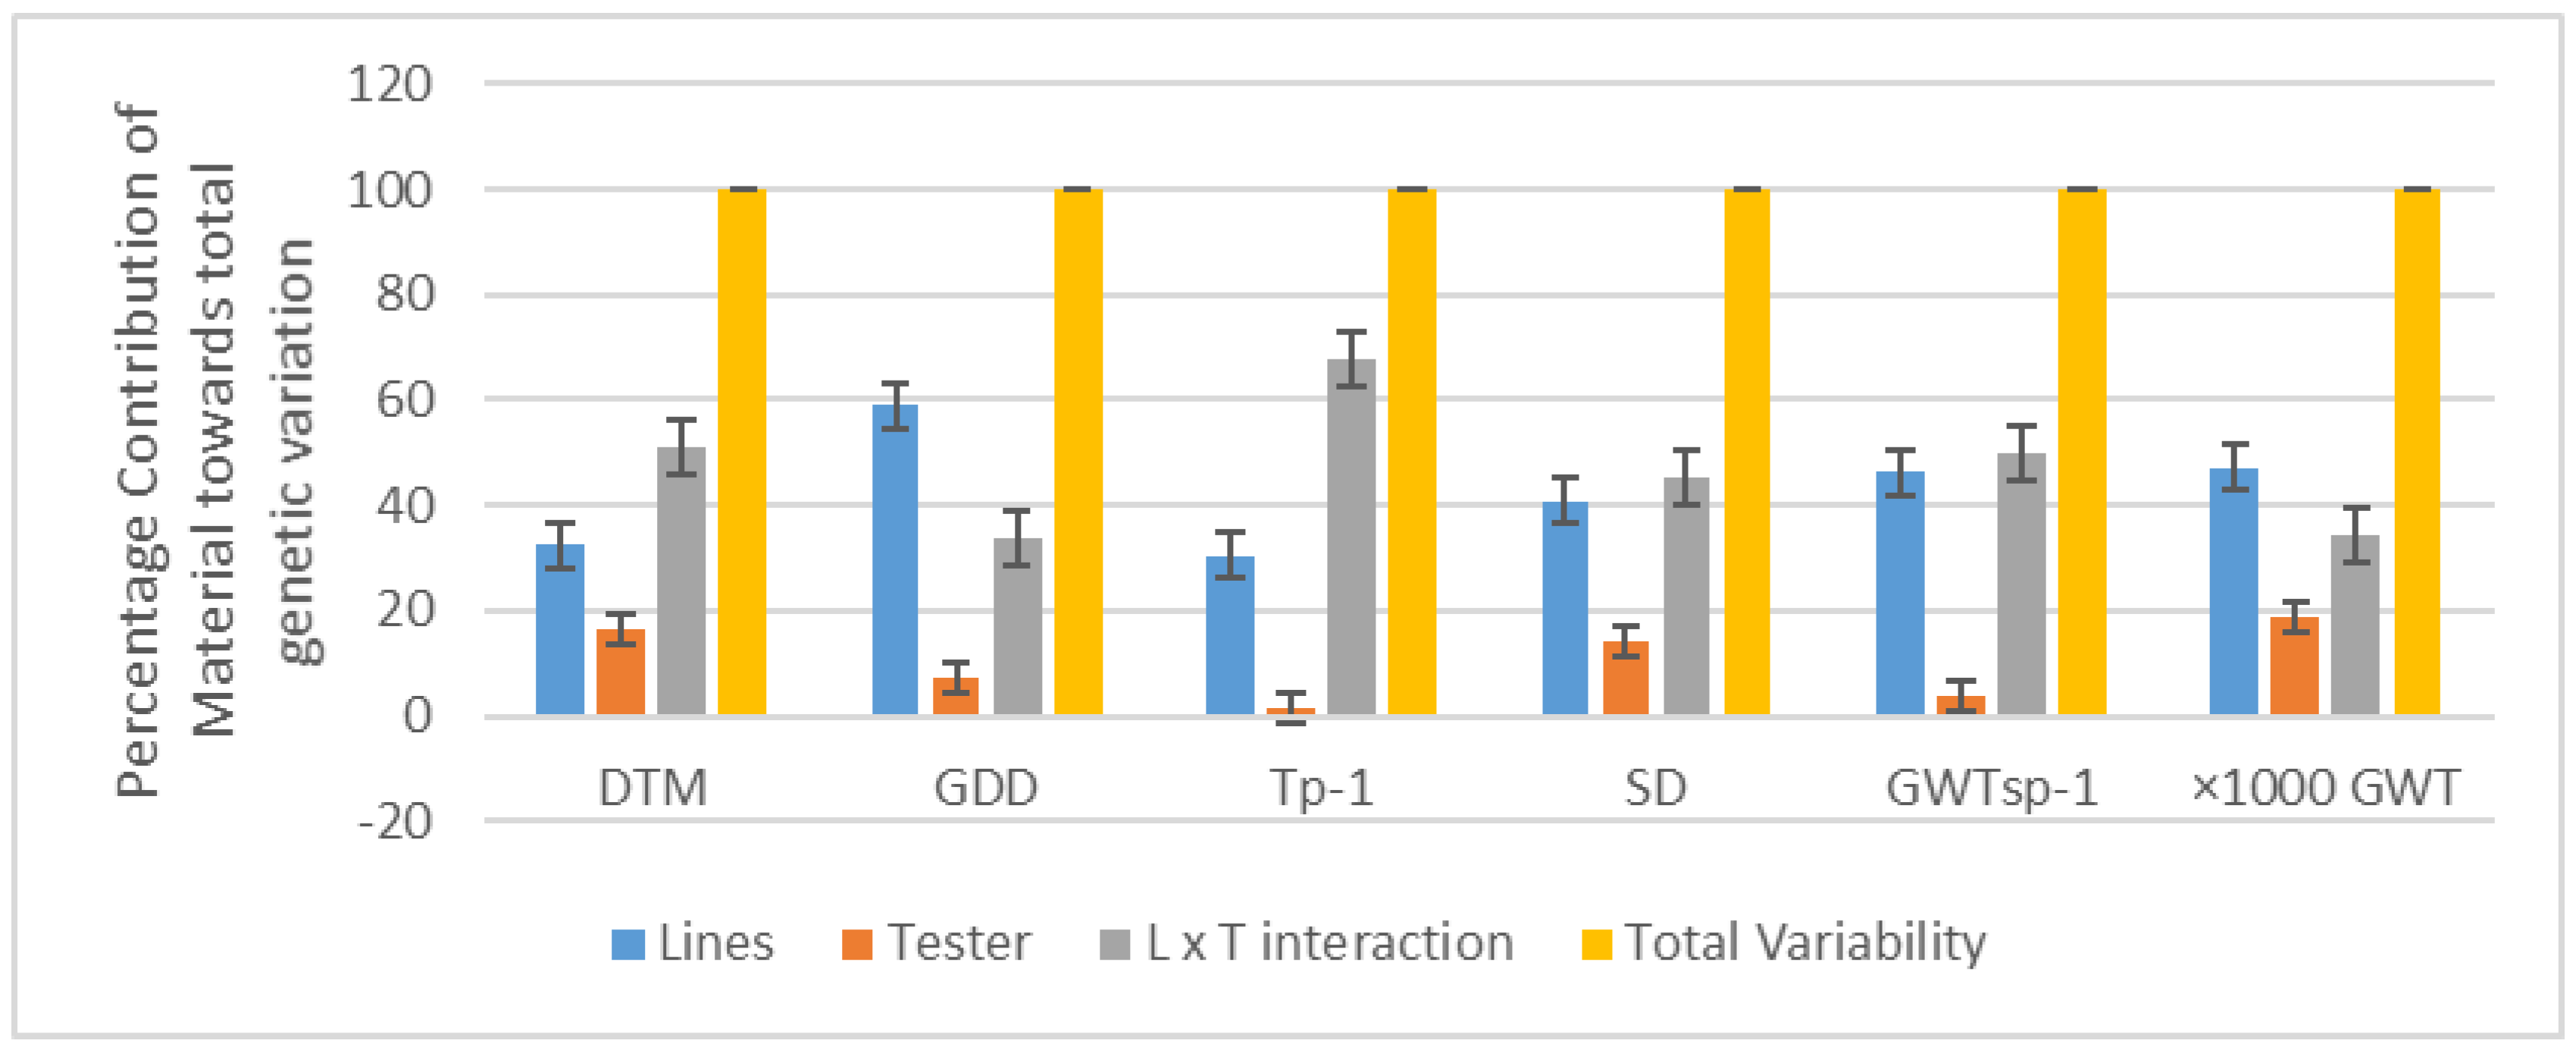
3.4. Proportional Contribution of Line and Testers

Maternal influence was predominant for traits like growing degree days (59.10%) and ×1000 kernel weight (47.10%) [26,27], while maternal × paternal interaction was predominant for days to 50% maturity (51.073%), tillers/plant (68.031%), spike density (45.353%) and grain weight/spike (49.935%). The paternal influence was not so obvious for most of the traits (Figure 3). The results depicted that maternal and maternal × paternal interaction contribute more towards genetic variation of cognate traits [27].

3.5. Genetic Components and Degree of Dominance

GCA variance was lower than the SCA variance for all the mentioned traits (Table 4). These findings are favored by the ratio of GCA/SCA variance which was smaller than unity [17]. Therefore, it is perceivable that the dominant gene action conditioned parameters inheritance [28]. The non-additive genetic variance for grain yield plant−1 and other cognate characters was also pointed out previously [29,30]. The differences in the results were mainly due to breeding material and the diversified genotype and environment interactions. Among all the studied traits, over-dominance was observed for tillers/plant, spike density and days to 50% maturity. The dominance genetic effects were observed for grain weight, ×1000-kernel weight and duration of the vegetative growth period (growing degree days for earliness), revealing that selection of superior genotypes in an F1 generation could be useful for producing productive hybrids.

3.6. Heritability, Genetic Gain and Correlation

Heritability and expected genetic advance are mentioned in Table 5. It was found that a major proportion of variability in phenotype was due to genotypic variation and not environmental variation. High heritability was found (>50%) for all traits while grain weight spike−1 (32.5%) was moderately heritable [31]. The heritability values fluctuate between moderate to highly heritable i.e., 32.5% to 96.8% for different parameters [32] shadowed by genetic advance ranged from 0.19 g (grain weight spike) to 85.4 heat units (growing degree days). Hence, beneficial highly heritable characters could be recovered in the very next generations.
It is possible to test whether the direct effects of different photoperiods on the length of spike also translate into grain number differences. At days to 50% and 100% maturity, the number of fertile florets and days taken by genetic stock to attain its maturity were counted, which reflects closely the number of grains in most conditions. The dynamics of floret development was significantly affected by the photoperiod during the spike length elongation period. The longer the length of spike associated with shorter photoperiod, the higher the spikelet fertility will be because distal and less developed floret primordia were able to progress to the fertile floret stage. These findings favoured by correlation studies were the same as previously reported [33]. Early maturing crops can best fit in double pattern cropping season, with benefits over moisture use and avoiding delay seasonal effects, insects and pest damage. That may allow wheat to flourish and best fit with ever-changing demand. Moreover, chemical and pesticides used as fertilizer and irrigation applications could be minimized. Hence, reduction in the maturity time of crop can bring ultimate benefits to cope with ever-increasing challenges [34]. A significant positive relationship among DTM, spike density and growing degree days was found (Table 6, rg = 0.25, rp = 0.19, p < 0.01). The assessments of correlation clearly demonstrated strong and negative association of earliness (DTM, GDD) with ×1000 grain weight (rg = −0.289, rp = −0.275) and grain weight/spike (rg = −0.1906). In this presentation, we attempted to envisage, from published and recent unpublished evidence, using studies carried out under both controlled and field conditions. The rate of crop development was manipulated during the late reproductive phase. The later the crop is harvested, the more negative its yield will be. Thus, harvesting at the right time results in the most fruitful output.
In the case of the field study, changes in heat unit duration also related to changes in the weight of grains set in both parents and hybrids. Averaging across years, grain weight per spike was reduced by exposing the plants at days to 50% and 100% maturity. This could be one of the reasons for low yield in genetic stock under consideration. Moreover, earliness greatly influences the spike density positively. The days required by the crop to meet 50% maturity and the total amount of heat units consumed by crop while reaching its maturity greatly affect spike density. The association was positive and significant at phenotypic and genotypic levels (Table 6). The growing degree days positively regulate the spikelets density, however the environmental changes at the grains filling stage may lead to an earlier onset of physiological maturity resulting in lower transfer of nutrients and essential elements in grains, which ultimately affects yield.
The studies in which the plants were subjected to different photoperiods throughout development also tended to show that the longer the duration of the heat units consumed by crop, the higher the number of grains per spike. However, the increase in the weight of grain was not as obvious as the number of grains, which ultimately affect yield. Although these cases confirm the results from experiments with manipulations of photoperiods focussed on spike density alone, they also may reflect ‘memorised effects’ of the photoperiod [35] from previous phases.

4. Conclusions

From the aforementioned discussion, it can be seen that the late reproductive phase manipulated the wheat yield as a strong and negative association seen. Majorly, parameters were conditioned by the dominant and over-dominant type of gene interaction. Combination AARI-11 × E-114 proved to be the best hybrid, consuming lesser amounts of heat units while reaching its maturity and at the same time had maximum positive SCA estimates for spike density, grain weight and ×1000-kernel weight favored by association studies. Among parents, E-114 and PB-11 revealed significant GCA estimates for yield traits. High heritability was observed for all traits except for the weight of grain spike−1, which was moderately heritable escorted by genetic gain. Hybrid breeding is recommended for improving the quality traits as the dominance variance was predominant for traits under study. These evidences provide experimental support, with plants grown in the field, that sensitivity to photoperiod may actually be used as an indirect tool to further rise wheat yield. This opens the possibility to manipulate the sensitivity to photoperiod during spike elongation and fertile spikelet’s formation (a mirror action of modifying the photoperiods) as an alternative avenue for wheat breeders to increase yield potential.

Supplementary Materials

The following are available online at https://0-www-mdpi-com.brum.beds.ac.uk/2073-4395/8/10/217/s1, Table S1: Supplementary data (Figure 1: Mean performance for 12 parents (9 lines and 3 testers)), Table S2: Supplementary data (Figure 2: Mean performance for 27 F1).

Author Contributions

A.S.K. and M.U.F. conceived the project and designed the experiments; M.U.F. performed the experiment; M.U.F., I.I. and A.C. analyzed the data; M.U.F., S.A. and A.A. finalized the manuscript; Funding acquisition, J.Z.; all authors discussed the results and reviewed the manuscript.

Funding

The APC was funded by KY201301005.

Acknowledgments

I bestow an honor to my father (Muhammad Ayub), brothers (Ali Ayub, Usman Ayub, Muhammad Abubakar and Ahmad Ayub) for their continuous support and prayers, Zhu Jianqing and Muhammad Akbar (Senior research officer at WRI, AARI, Faisalabad) for guidance and fruitful discussion.

Conflicts of Interest

The authors declare no conflict of interest.

References

  1. Slafer, G.A.; Abeledo, L.G.; Miralles, D.J.; Gonzalez, F.G.; Whitechurch, E.M. Photoperiod sensitivity during stem elongation as an avenue to raise potential yield in wheat. Euphytica 2001, 119, 191–197. [Google Scholar] [CrossRef]
  2. Slafer, G.A. Differences in phasic development rate amongst wheat cultivars independent of responses to photoperiod and vernalization. A viewpoint of the intrinsic earliness hypothesis. J. Agric. Sci. 1996, 126, 403–419. [Google Scholar] [CrossRef]
  3. Liang, Y.; Farooq, M.U.; Zeng, R.; Tang, Z.; Zhang, Y.; Zheng, T.; Ei, H.H.; Ye, X.; Jia, X.; Zhu, J. Breeding of selenium rich red glutinous rice, protein extraction and analysis of the distribution of selenium in grain. Int. J. Agric. Biol. 2018, 20, 1005–1011. [Google Scholar]
  4. Liang, Y.; Farooq, M.U.; Hu, Y.; Tang, Z.; Zhang, Y.; Zeng, R.; Zheng, T.; Ei, H.H.; Ye, X.; Jia, X.; et al. Study on stability and antioxidant activity of red anthocyanidin glucoside rich hybrid rice, its nutritional and physicochemical characteristics. Food Sci. Technol. Res. 2018, 24, 687–696. [Google Scholar]
  5. Farooq, M.U.; Tang, Z.; Zeng, R.; Liang, Y.; Zhang, Y.; Zheng, T.; Ei, H.H.; Ye, X.; Jia, X.; Zhu, J. Accumulation, mobilization and transformation of selenium in rice grain provided with foliar sodium selenite. J. Sci. Food Agric. 2018. In press. [Google Scholar]
  6. Reynolds, M.P.; Rajaram, S.; Mcnab, A. Increasing Yield Potential in Wheat: Breaking the Barriers; CIMMYT: Ciudad Obregon, Sonora, Mexico, 1996. [Google Scholar]
  7. Ali, M.A.; Nawab, N.N.; Rasool, G.; Saleem, M. Estimates of variability and correlations for quantitative traits in Cicer arietinum. J. Agric. Soc. Sci. 2008, 4, 177–179. [Google Scholar]
  8. Khaliq, I.; Parveen, N.; Chowdhry, M.A. Correlation and path coefficient analyses in bread wheat. Int. J. Agric. Biol. 2004, 6, 633–635. [Google Scholar]
  9. Jain, S.; Sastry, E. Heterosis and combining ability for grain yield and its contributing traits in bread wheat (Triticum aestivum L.). J. Agric. Allied Sci. 2012, 1, 17–22. [Google Scholar]
  10. Iqbal, M.; Navabi, A.; Salmon, D.F.; Yang, R.-C.; Murdoch, B.M.; Moore, S.S.; Spane, D. Genetic analysis of flowering and maturity time in high latitude spring wheat. Euphytica 2007, 154, 207–218. [Google Scholar] [CrossRef]
  11. Chowdhary, M.; Sajad, M.; Ashraf, M. Analysis on combining ability of metric traits in bread wheat, Triticum aestivum. J. Agric. Res. 2007, 45, 11–17. [Google Scholar]
  12. Mangi, S.A.; Sial, M.A.; Ansari, B.A.; Arain, M.A. Study of genetic parameters in segregating populations of spring wheat. Pak. J. Bot. 2008, 39, 2407–2413. [Google Scholar]
  13. Widyaratne, G.; Zijlstra, R. Nutritional value of wheat and corn distiller’s dried grain with solubles: Digestibility and digestible contents of energy, amino acids and phosphorus, nutrient excretion and growth performance of grower-finisher pigs. Can. J. Anim. Sci. 2007, 87, 103–114. [Google Scholar] [CrossRef] [Green Version]
  14. Farooq, M.U.; Cheema, A.A.; Ishaaq, I.; Zhu, J. Correlation and genetic component studies for peduncle length affecting grain yield in wheat. Int. J. Adv. Appl. Sci. 2018, 5, 67–75. [Google Scholar] [CrossRef]
  15. Sayre, K.D.; Rajaram, S.; Fischer, R. Yield potential progress in short bread wheats in northwest Mexico. Crop Sci. 1997, 37, 36–42. [Google Scholar] [CrossRef]
  16. Nielsen, R. What Exactly do You Mean by ‘Growing Degree Day’. Available online: https://www.agry.purdue.edu/ext/corn/news/articles.01/Corn_GDD_Calc-0423.pdf (accessed on 1 May 2015).
  17. Fellahi, Z.E.A.; Hannachi, A.; Bouzerzour, H.; Boutekrabt, A. Line× tester mating design analysis for grain yield and yield related traits in bread wheat (Triticum aestivum L.). Int. J. Agron. 2013. [Google Scholar] [CrossRef]
  18. Panse, V.G. Statistical Methods for Agricultural Workers; Indian Council of Agricultural Research: New Delhi, Indian, 1954; pp. 154–196. [Google Scholar]
  19. Steel, R.G.D.; Torrie, J.C. Principles and Procedures of Statistics: A Biometrical Approach; McGraw-Hill: New York, NY, USA, 1980. [Google Scholar]
  20. Kempthorne, O. An Introduction to Genetic Statistics; John Wiley and Sons, Inc.: New York, NY, USA, 1957. [Google Scholar]
  21. Team, R.C. R: A Language and Environment for Statistical Computing; The R Foundation for Statistical Computing: Vienna, Austria, 2014. [Google Scholar]
  22. Clewer, A.G.; Scarisbrick, D.H. Practical Statistics and Experimental Design for Plant and Crop Science; John Wiley and Sons, Inc.: Chichester, UK; New York, NY, USA, 2001. [Google Scholar]
  23. Singh, N.; Singh, Y.; Singh, V. Variation in physiological traits in promising wheat varieties under late sown condition. Indian J. Plant Physiol. 2005, 10, 171. [Google Scholar]
  24. Verma, O.; Srivastava, H. Genetic component and combining ability analyses in relation to heterosis for yield and associated traits using three diverse rice-growing ecosystems. Field Crop. Res. 2004, 88, 91–102. [Google Scholar] [CrossRef]
  25. Tiwari, D.K.; Pandey, P.; Giri, S.P.; Dwivedi, J.L. Prediction of gene action, heterosis and combining ability to identify superior rice hybrids. Int. J. Bot. 2011, 7, 126–144. [Google Scholar] [CrossRef]
  26. Sarker, U.; Biswas, P.S.; Prasad, B.; Mian, M.K. Heterosis and genetic analysis in rice hybrids. Pak. J. Biol. Sci. 2002, 5, 1–5. [Google Scholar]
  27. Rashid, M.; Cheema, A.A.; Ashraf, M. Line × tester analysis in basmati rice. Pak. J. Bot. 2007, 39, 2035–2042. [Google Scholar]
  28. Borghi, B.; Perenzin, M.; Nash, R. Combining ability estimates in bread wheat and performance of 100 F1 hybrids produced using a chemical hybridising agent. J. Genet. Breed. 1989, 43, 11–16. [Google Scholar]
  29. Javaid, A.; Masood, S.; Minhas, N. Analysis of combining ability in wheat (Triticum aestivum L.) using F2 generation. Pak. J. Biol. Sci. 2001, 4, 1303–1305. [Google Scholar]
  30. Nazeer, W.; Hussain, T.; Khan, M.A.; Naeem, M.; Amjid, M.W.; Hussain, K. Mechanism of inheritance for quantitative traits in interaspecific crosses of Triticum aestivum L. World Appl. Sci. J. 2013, 22, 1440–1448. [Google Scholar]
  31. Hussain, Q.; Aziz, T.; Khalil, I.H.; Ahmad, N.; Asim, M.; Adnan, M.; Farooq, M.U. Estimation of heritability and selection response for some yield traits in F3 populations of wheat. Int. J. Agric. Appl. Sci. 2017, 9, 6–13. [Google Scholar]
  32. Yadav, A.K.; Maan, R.K.; Kumar, S.; Kumar, P. Research note variability, heritability and genetic advance for quantitative characters in hexaploid wheat (Triticum aestivum L.). Electron. J. Plant Breed. 2011, 2, 405–408. [Google Scholar]
  33. Miralles, D.J.; Katz, S.D.; Colloca, A.; Slafer, G.A. Floret development in near isogenic wheat lines differing in plant height. Field Crop. Res. 1998, 59, 21–30. [Google Scholar] [CrossRef]
  34. Rajper, A.A.; Baloch, S.K.; Baloch, K.; Ahmed, S.; Kaleri, A.A.; Leghari, A.L.; Kaleri, S.H.; Soothar, J.K.; Soomro, S.R.; Kaleri, R.R. 14. Analysis path coefficient of yield earliness traits in wheat (Triticum aestivum L.). Pure Appl. Biol. 2018, 7, 112–120. [Google Scholar]
  35. Slafer, G.A.; Rawson, H. Sensitivity of wheat phasic development to major environmental factors: A re-examination of some assumptions made by physiologists and modellers. Funct. Plant Biol. 1994, 21, 393–426. [Google Scholar] [CrossRef]
Figure 1. Mean performance for 12 parents (9 lines and 3 testers) compared at least significant difference (LSD)0.05. DTM, Days to 50% maturity; GDD, Growing degree days (heat unit); Tp−1, Productive tiller plant−1; SD, Spike density; GWTsp−1, Grain weight spike−1 (g); 1000 GWT, 1000 grain weight (g). Figure’s data can be found at Table S1.
Agronomy 08 00217 g001
Figure 2. Mean performance for 27 F1 compared at Lease Significant Difference (LSD)0.05. DTM, Days to 50% maturity; GDD, Growing degree days (heat unit); Tp−1, Productive tiller plant−1; SD, Spike density; GWTsp−1, Grain weight spike−1 (g); 1000 GWT, 1000 grain weight (g). Figure’s data can be found at Table S2.
Agronomy 08 00217 g002
Figure 3. Contribution of material towards variability. DTM, Days to 50% maturity; GDD, Growing degree days (heat unit); Tp−1, Productive tiller plant−1; SD, Spike density; GWTsp−1, Grain weight spike−1 (g); ×1000 GWT, 1000 grain weight (g).
Agronomy 08 00217 g003
Table 1. Mean square (MS) values from analysis of variance (ANOVA) for metric traits.
Source of Variationd.fDTMGDDTp−1SDGWTsp−1×1000 GWT
Replications20.577 NS1810.200 *0.855 NS0.0097776 NS0.106 NS2.943 NS
Treatments3832.710 **8531.742 **4.086 **0.027416 **0.196 **46.924 **
Parents1123.174 **12281.764 **3.684 **0.00302 **0.202 **58.984 **
Parents vs. crosses10.145 NS372.657 NS0.201 NS0.313389 *0.398 *337.790 **
Crosses2637.997 **7259.005 **4.405 **0.017475 **0.185 **30.634 **
Lines840.255 **13944.306 **4.566 **0.007112 **0.278 **46.898 **
Testers280.658 **6959.387 **0.044 NS0.02436 **0.093 NS73.961 **
Lines × Testers1631.535 **3953.807 **4.870 **0.036279 *0.150 *17.086 **
Error760.349406.0720.7120.0066780.0801.477
d.f, degree of freedom; DTM, Days to 50% maturity; GDD, Growing degree days (heat units); Tp−1, Productive tillers per plant; SD, Spike density; GWTsp−1, Grain weight per spike (g); ×1000 GWT, 1000-grain weight (g). Different values derived from ANOVA indicate significant differences at probability; ** = p ≤ 0.01; * = p ≤ 0.05; NS = Non-significant.
Table 2. General combining ability (GCA) effects of parents.
LinesDTMGDDTp−1SDGWTsp−1×1000 GWT
9730−0.977 NS−28.812 NS−0.918 NS1.245 *0.324 NS4.685 NS
9731−2.177 NS−57.585 NS−0.696 NS−0.283 NS0.071 *3.130 NS
97330.004 *2.132 *0.504 *−0.070 NS0.000 NS−1.037 NS
98591.463 NS−25.590 NS1.340 NS0.306 *−0.194 NS−0.704 NS
98602.352 NS23.504 NS−0.624 NS0.447 *0.180 *−1.004 NS
98611.887 NS45.438 NS0.449 *2.191 **0.026 *−1.093 NS
AARI-111.142 NS−27.835 NS−0.252 NS0.508 *−0.096 NS−0.626 NS
AAS-11−4.163 NS64.660 NS0.155 *−1.640 *−0.225 NS−1.393 NS
PB-110.468 **4.088 *0.042 *2.063 **−0.087 NS−1.959 NS
Testers
E-1081.767 NS13.956 **0.043 *1.597 *−0.046 NS−0.963 NS
E-113−1.687 NS−17.546 NS−0.037 NS1.448 *−0.020 NS−0.948 NS
E-114−0.079 NS3.590 *−0.006 NS2.222 *0.066 *1.911 NS
S.E for lines0.1976.7170.2810.7940.0940.405
S.E for testers0.1143.8780.1620.7970.0540.234
DTM, Days to 50% maturity; GDD, Growing degree days (heat units); Tp−1, Productive tillers per plant; SD, Spike density; GWTsp−1, Grain weight per spike (g); ×1000 GWT, 1000-grain weight (g); S.E = Standard Error; * and ** = significance at the 0.05 and 0.01 levels of probability, respectively (1-tailed); NS = Non-significant.
Table 3. Specific combining ability (SCA) effects of F1.
HybridsDTMGDDTp−1SDGWTsp−1×1000 GWT
9730 × E-108−1.433 NS−1.390 NS0.625 *−18.077 NS0.171 *0.789 *
9730 × E-1131.021 NS0.229 *−0.295 NS2.811 NS0.091 *0.215 *
9730 × E-1140.413 *1.160 *−0.329 NS1.153 *−0.262 NS−1.004 NS
9731 × E-108−0.233 *34.466 NS−0.488 NS1.522 **0.211 *−1.956 NS
9731 × E-1131.221 NS−5.265 NS−1.408 NS0.527 *−0.089 NS0.904 *
9731 × E-114−0.987 NS−29.201 NS1.895 NS−13.108 NS−0.122 NS1.052 *
9733 × E-108−2.791 NS−25.251 NS−0.358 NS−8.589 NS−0.118 NS−3.256 NS
9733 × E-1132.700 NS47.118 NS0.882 **0.297 *−0.024 NS−0.130 NS
9733 × E-1140.091 *−21.867 NS−0.525 NS4.840 NS0.142 *3.385 NS
9859 × E-108−0.840 NS−18.678 NS−1.194 NS1.425 **0.088 *1.911 NS
9859 × E-113−2.313 NS5.473 *2.002 NS1.939 NS0.082 *−0.896 NS
9859 × E-1143.153 NS13.205 *−0.808 NS3.440 NS−0.171 NS−1.015 NS
9860 × E-1081.604 NS2.194 *1.660 NS0.767 *−0.232 NS0.878 *
9860 × E-113−2.721 NS−14.754 NS−0.480 NS−3.878 NS−0.004 NS1.470 NS
9860 × E-1141.117 NS12.560 *−1.180 NS3.625 NS0.236 *−2.348 NS
9861 × E-108−5.180 NS−52.673 NS−0.080 NS84.000 NS0.202 *1.700 NS
9861 × E-1130.487 *−4.354 NS−0.333 NS−9.800 NS−0.024 NS0.026 *
9861 × E-1144.693 NS57.027 NS0.413 *−29.697−0.178 NS−1.726 NS
AARI-11 × E-1082.558 NS20.599 **0.515 *0.735 *0.011 *−1.467 NS
AARI-11 × E-1131.155 NS7.718 *−1.409 NS2.047 NS−0.315 NS−2.974 NS
AARI-11 × E-114−3.713 NS−28.317 **0.894 **1.454 **0.305 **4.441 *
PB-11 × E-1080.860 NS2.522 *−1.452 NS−13.591 NS−0.034 NS1.867 NS
PB-11 × E-113−0.126 NS26.073 NS0.965 **−0.149 NS0.160 *−0.441 NS
PB-11 × E-114−0.734 NS−28.595 NS0.487 *0.850 *−0.126 NS−1.426 NS
AAS-11 × E-1085.456 NS38.210 NS0.771 *−1.545 NS−0.298 NS−0.467 NS
AAS-11 × E-113−1.424 NS−62.238 NS0.075 *−2.097 NS0.122 *1.826 NS
AAS-11 × E-114−4.032 NS24.027 NS−0.846 NS−1.108 NS0.176 *−1.359 NS
S.E for crosses0.34111.6340.4870.7960.1630.702
DTM, Days to 50% maturity; GDD, Growing degree days (heat units); Tp−1, Productive tillers per plant; SD, Spike density; GWTsp−1, Grain weight per spike (g); ×1000 GWT, 1000-grain weight (g); * and ** = significance at the 0.05 and 0.01 levels of probability, respectively (1-tailed); NS = Non-significant.
Table 4. Genetic component variations (additive, dominance genetic effects).
Genetic VariationDays to 50% MaturityGrowing Degree DaysProductive Tillers per PlantSpike DensityGrain Weight per Spike×1000-Grain Weight
Variance of GCA3.336933.0600.2131.0020.0173.880
Variance of SCA10.3951182.5781.3867.1220.0245.203
Additive variance6.6711866.1210.4271.0020.0347.761
Dominance variance10.3951182.5781.3867.1220.0245.203
Variance ratio of GCA to SCA0.3210.7890.1540.1410.7140.746
Degree of dominance1.2480.7961.8022.6660.8370.819
Table 5. Heritability, genetic gain and coefficient of variability.
DTMGDDTp−1SDGWTsp−1×1000 GWT
Ve0.3406.10.70.00670.11.5
Vg10.7872708.5571.1246670.0069070.03866715.149
Vp11.1363114.6291.8366670.0135850.11866716.626
H20.968660.8696240.6123410.5084310.3258430.911163
GA5.68916885.417621.4605660.1042990.1975546.538871
CV%0.51.39.75.0102.7
Ve, Environmental variance; Vg, Genotypic variance; Vp, Phenotypic variance; H2, Heritability; GA, Genetic advance; CV, Coefficient of variability; DTM, Days to 50% maturity; GDD, Growing degree days (heat units); Tp−1, Productive tillers per plant, SD, Spike density; GWTsp−1, Grain weight per spike (g); ×1000 GWT, 1000-grain weight (g).
Table 6. Genotypic and Phenotypic correlations.
Phenotypic CorrelationGenotypic Correlation
DTMGDDTp−1SDGWTsp−1×1000 GWT
DTM1 **0.45125 **0.08029 NS0.2902 **−0.19064 *−0.0225 NS
GDD0.40744 **1 **0.13473 NS0.25388 **−0.18587 *−0.28906 **
Tp−10.05706 NS0.13118 NS1 **−0.1084 NS−0.31496 **−0.02665 NS
SD0.20942 *0.19091 *−0.17791 *1 **−0.46559 **−0.01083 NS
GWTsp−1−0.10889 NS−0.08238 NS−0.16573 NS−0.24462 **1 **0.2847 **
×1000 GWT−0.01657 NS−0.27514 **−0.01835 NS−0.01083 NS0.20208 **1 **
DTM, Days to 50% maturity; GDD, Growing degree days (heat units); Tp−1, Productive tillers per plant, SD, Spike density; GWTsp−1, Grain weight per spike (g); ×1000 GWT, 1000-grain weight (g). * and ** = Correlation is significant at the 0.05 and 0.01 level of probability, respectively (2-tailed); NS = Non-significant.

