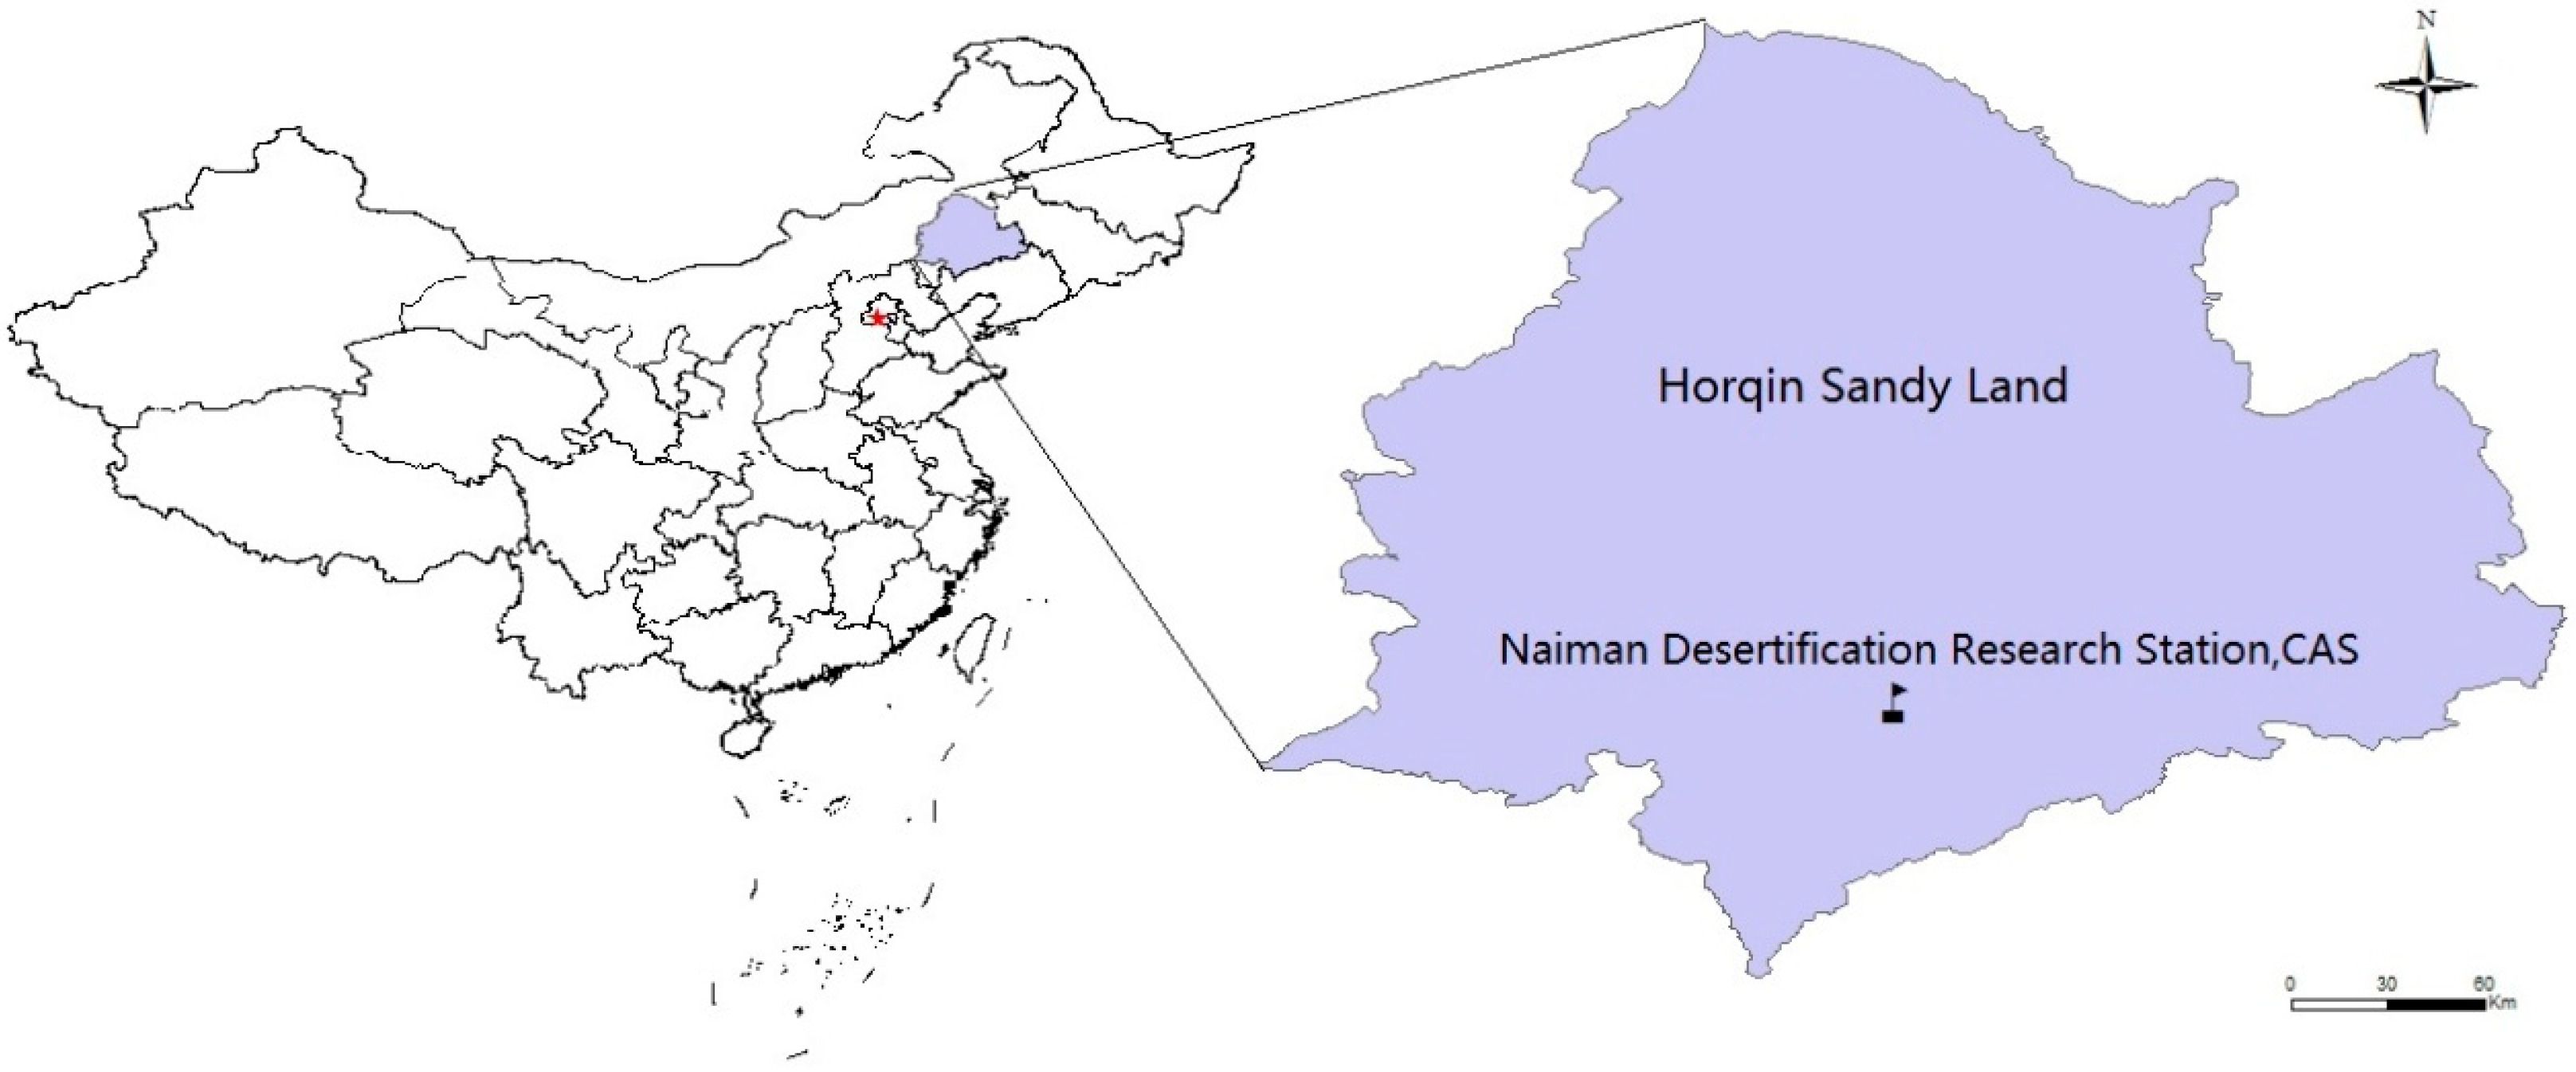
Figure 1.
Location of Naiman desertification research station in China.
Figure 1.
Location of Naiman desertification research station in China.
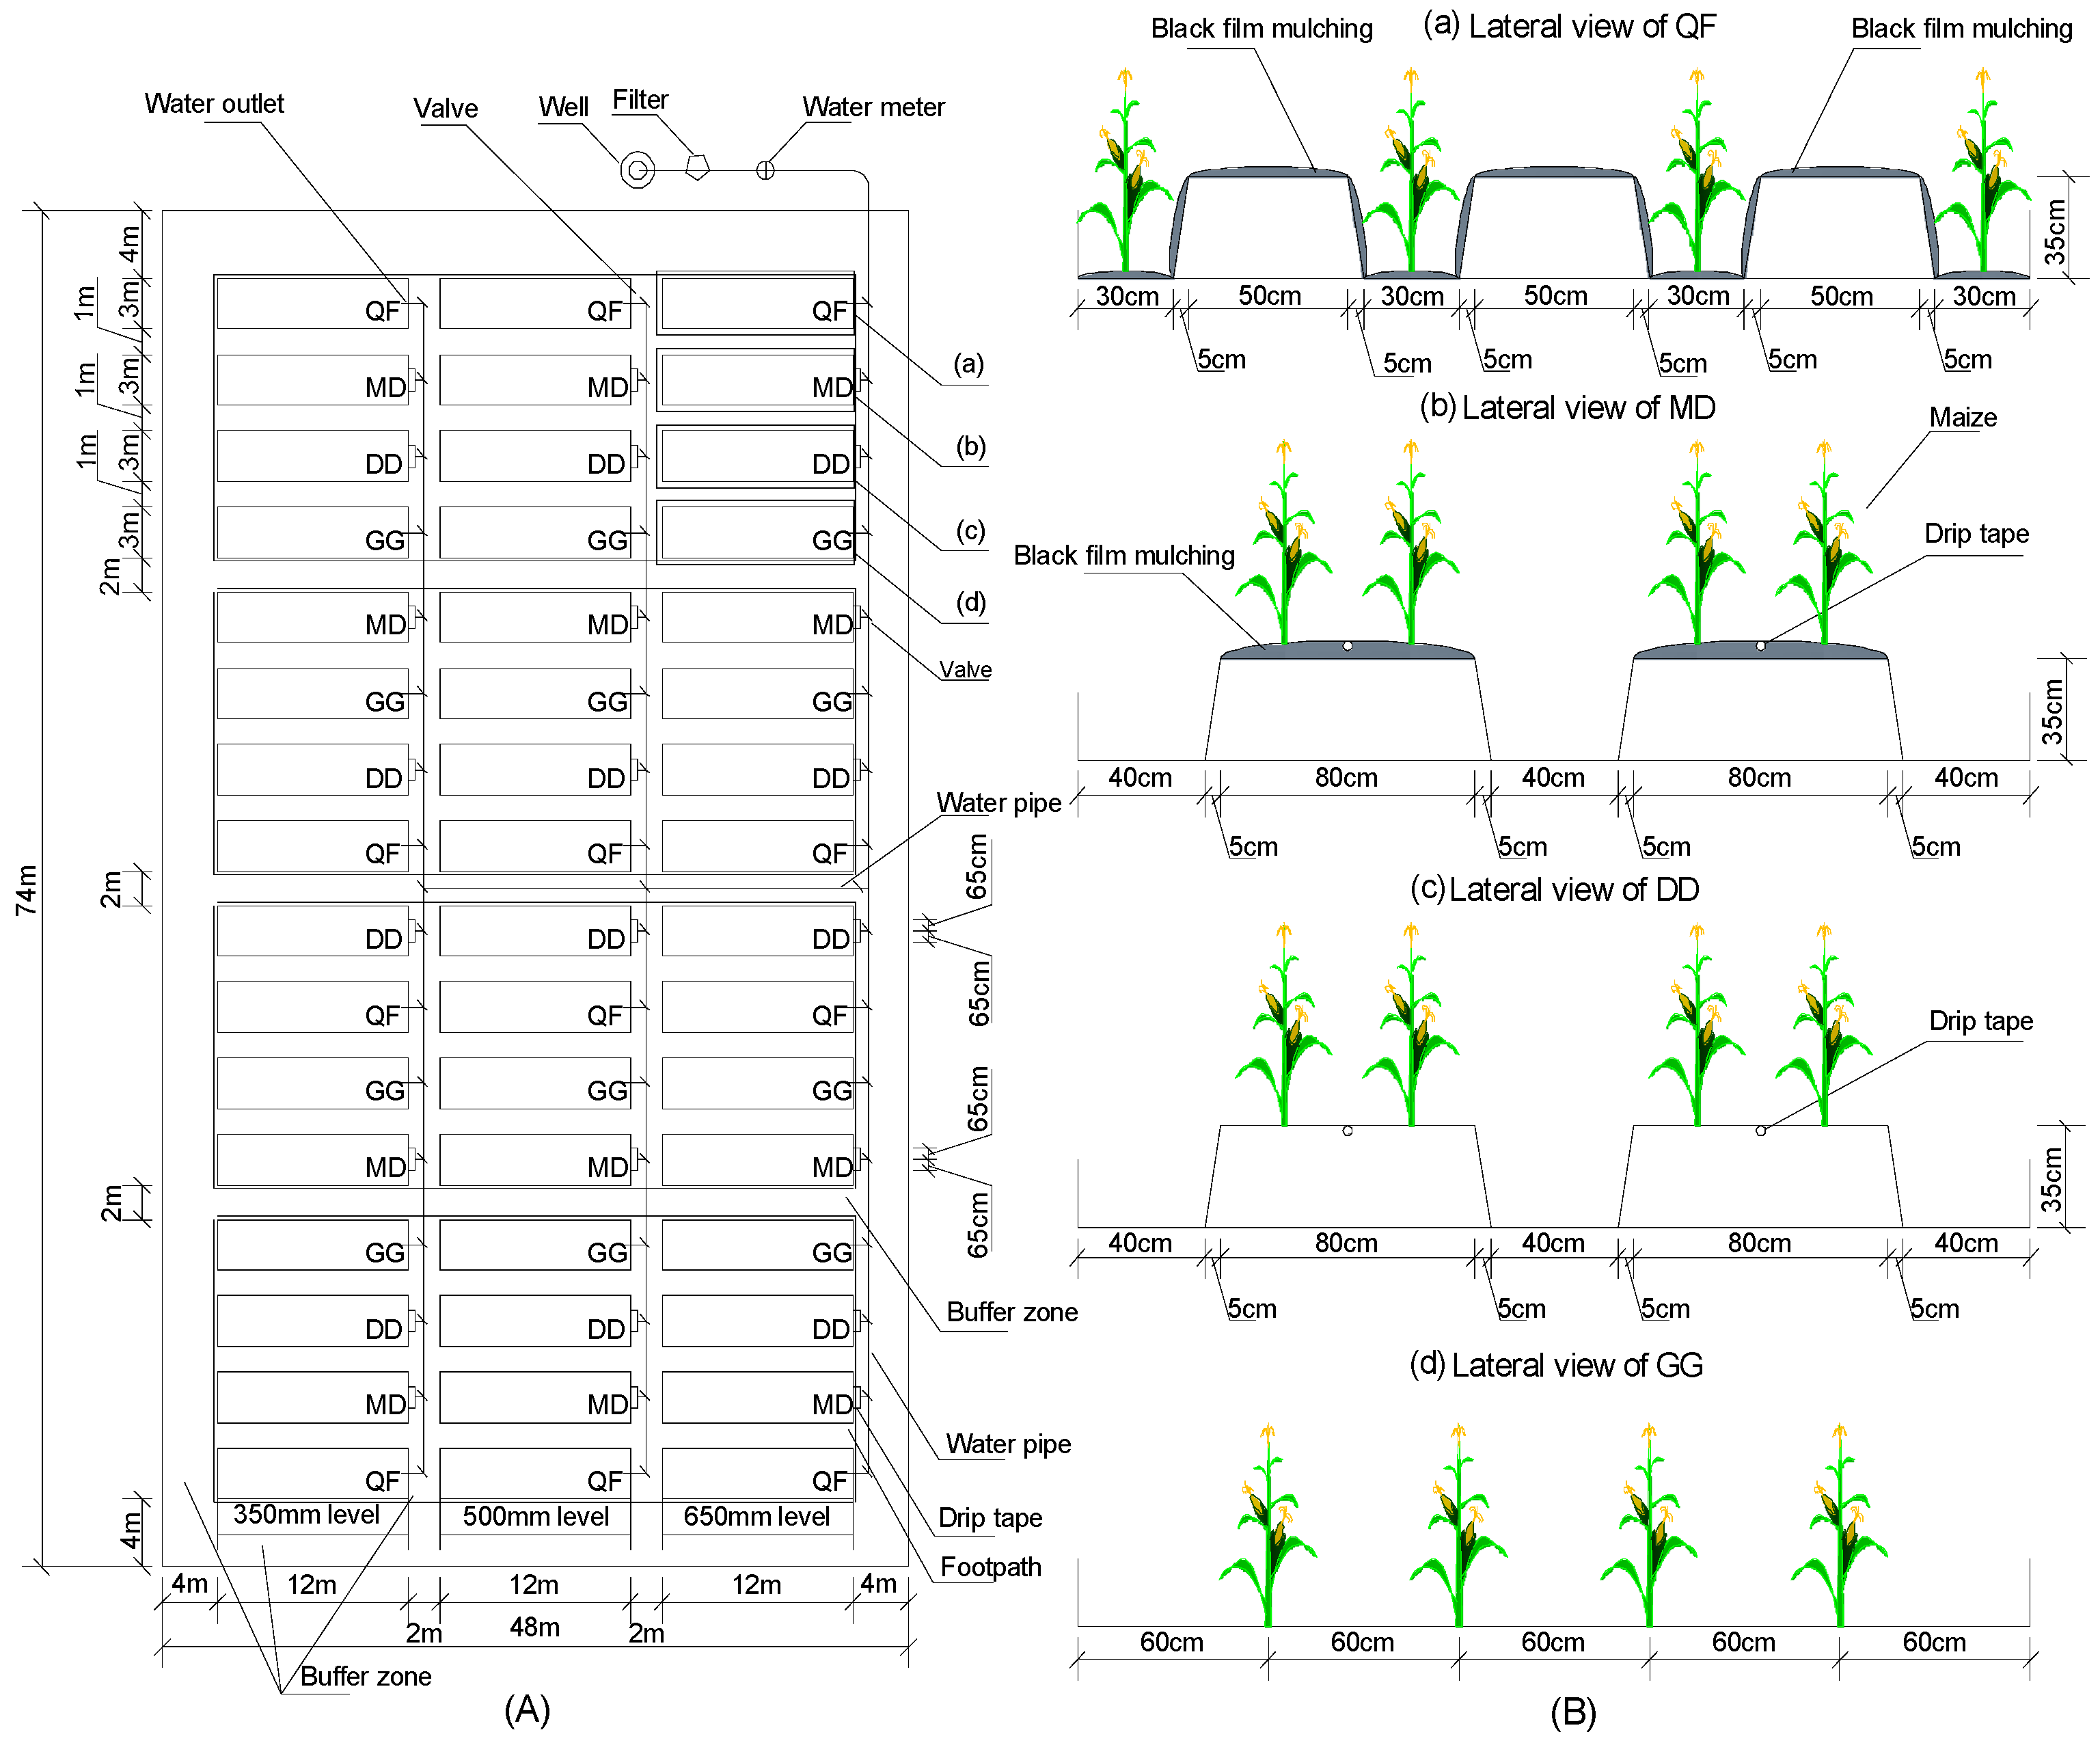
Figure 2.
Schematic diagrams for field experimental plot layout showing four replicated blocks, and four randomly assigned treatments. Plot size: Width 3 m (4 rows at 0.8 m spacing in QF, and at 0.6 m spacing in MD, DD, and GG). (A) represents schematic diagrams of the test field. (B) represents profile diagram of treatments. Length 12 m. Total area (36 m2); 1m buffers among plots, 4 m buffers between crops and on field edges.
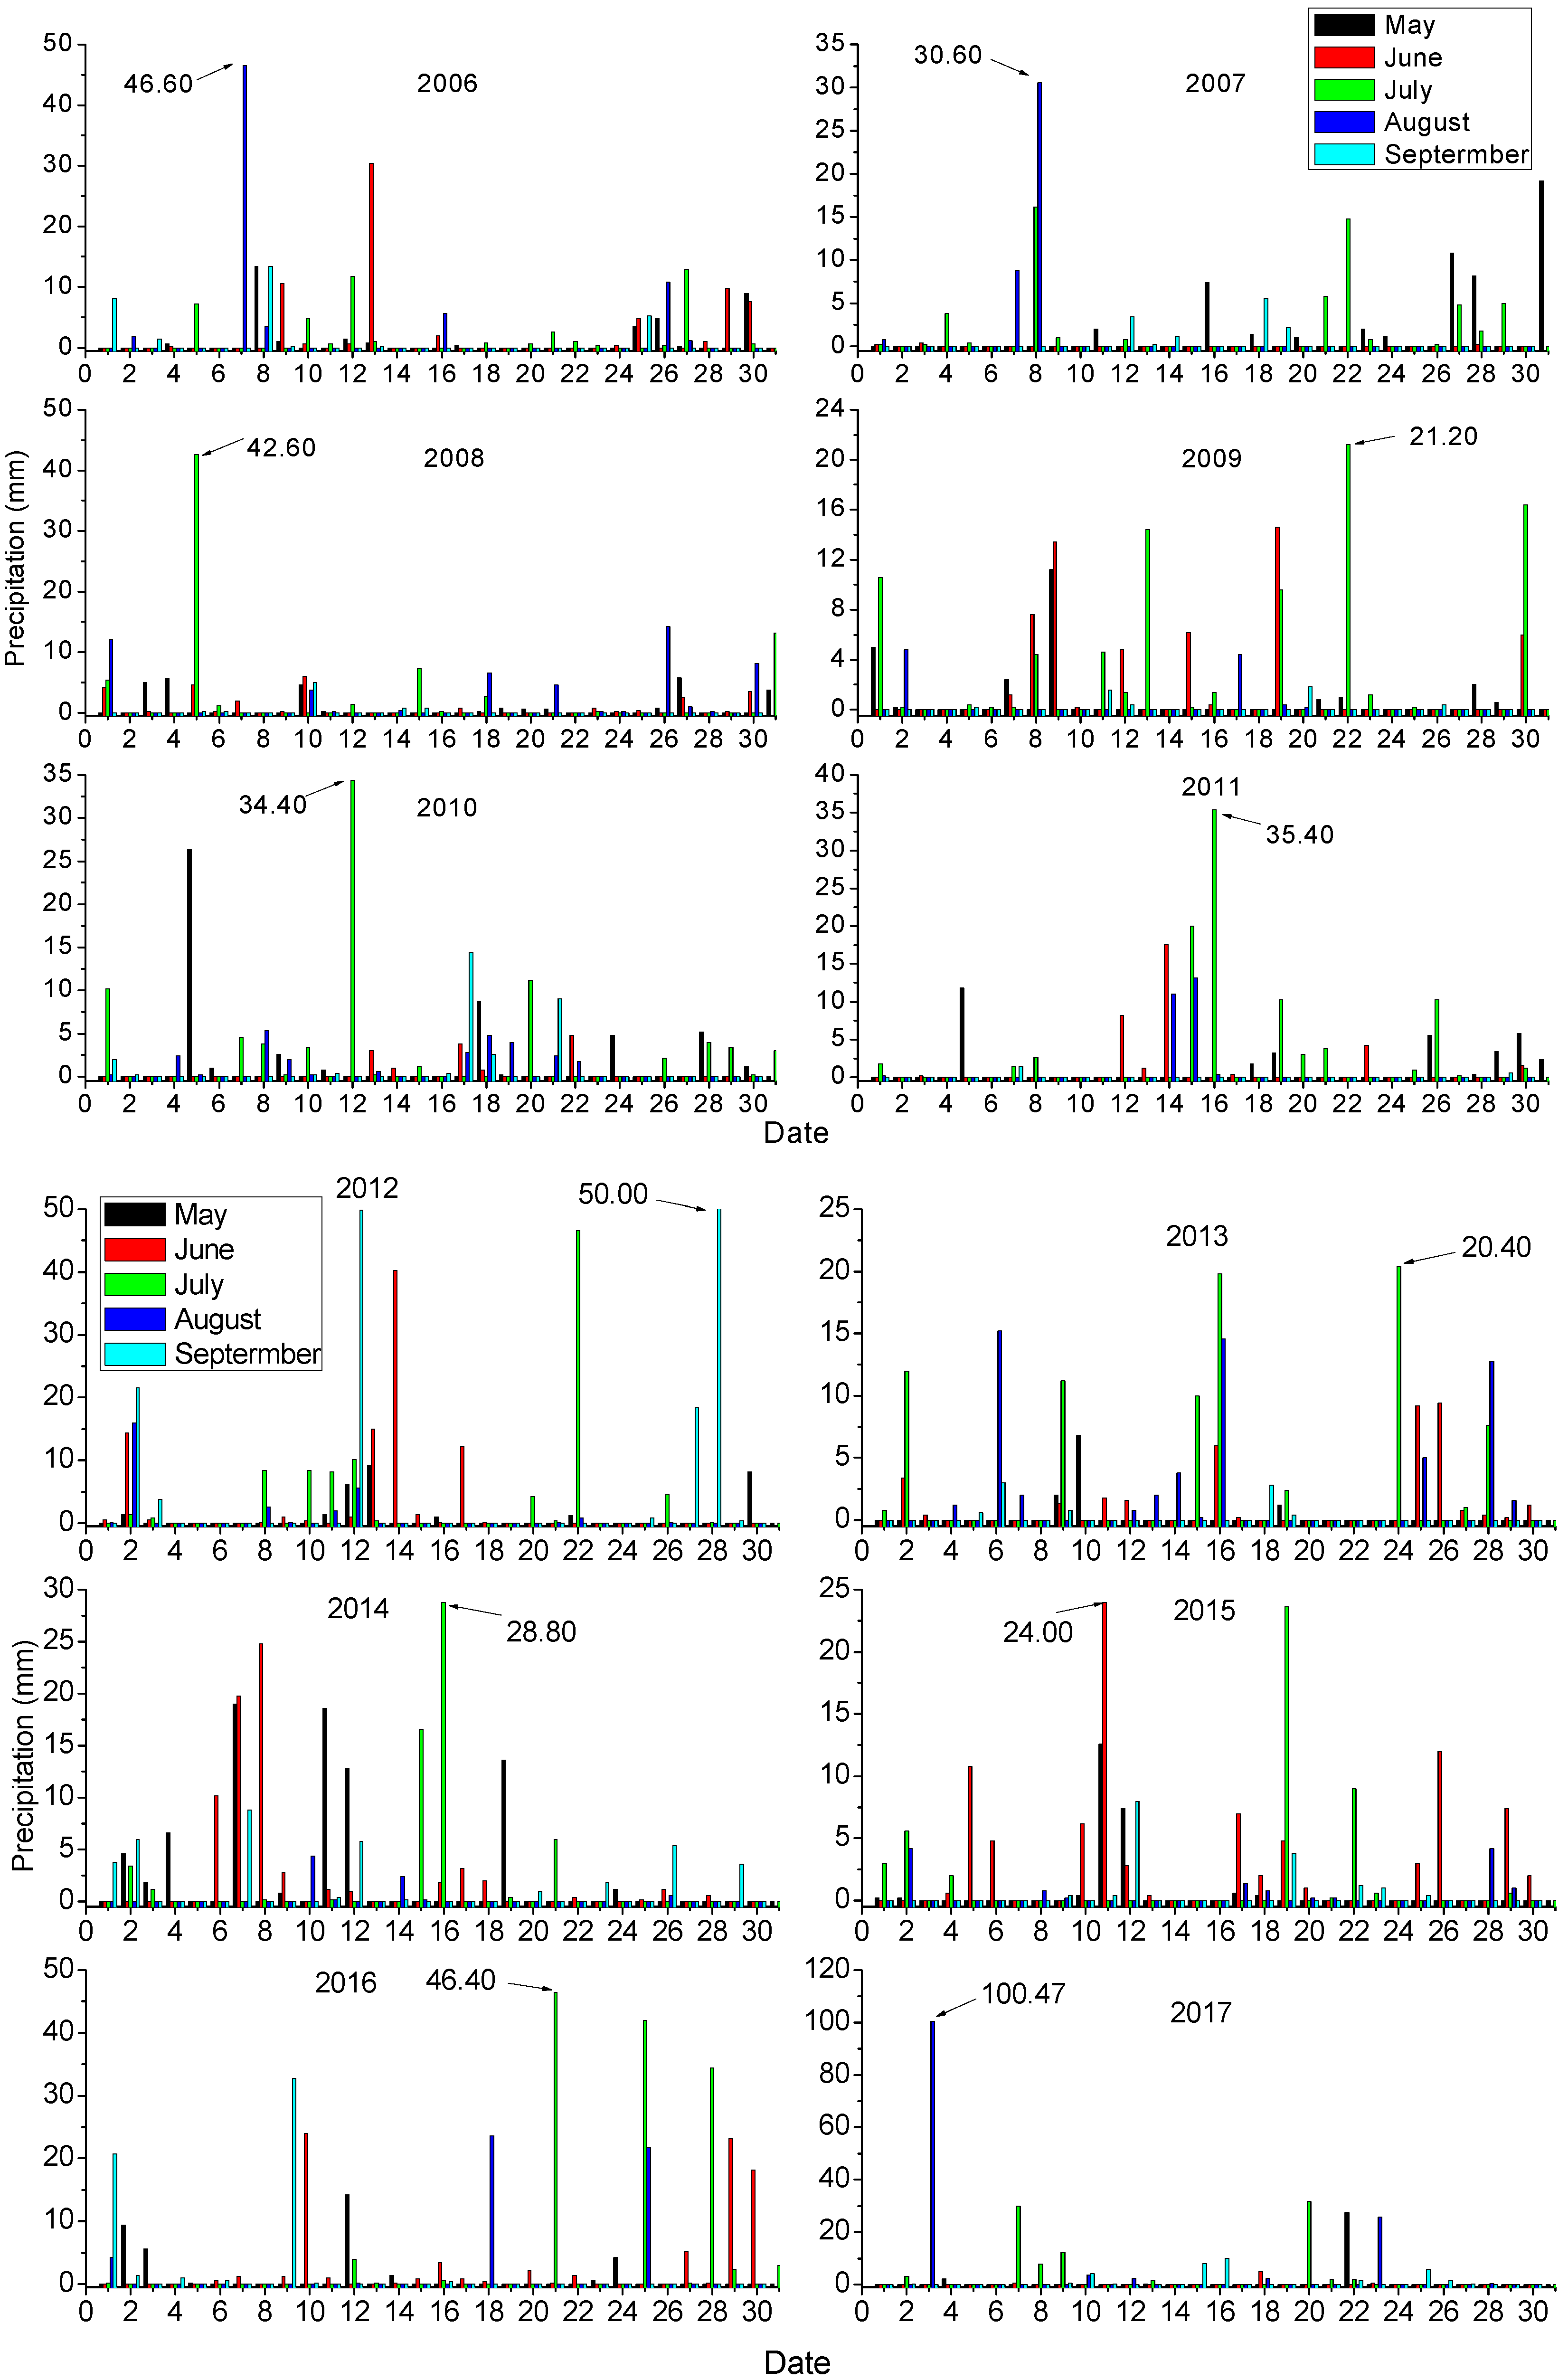
Figure 3.
The mean precipitation diurnal variations during maize growing season (from May to September) in experimental fields at the Naiman Desertification Research Station of the Chinese Academy of Sciences, Naiman, China, from 2006 to 2017.
Figure 3.
The mean precipitation diurnal variations during maize growing season (from May to September) in experimental fields at the Naiman Desertification Research Station of the Chinese Academy of Sciences, Naiman, China, from 2006 to 2017.
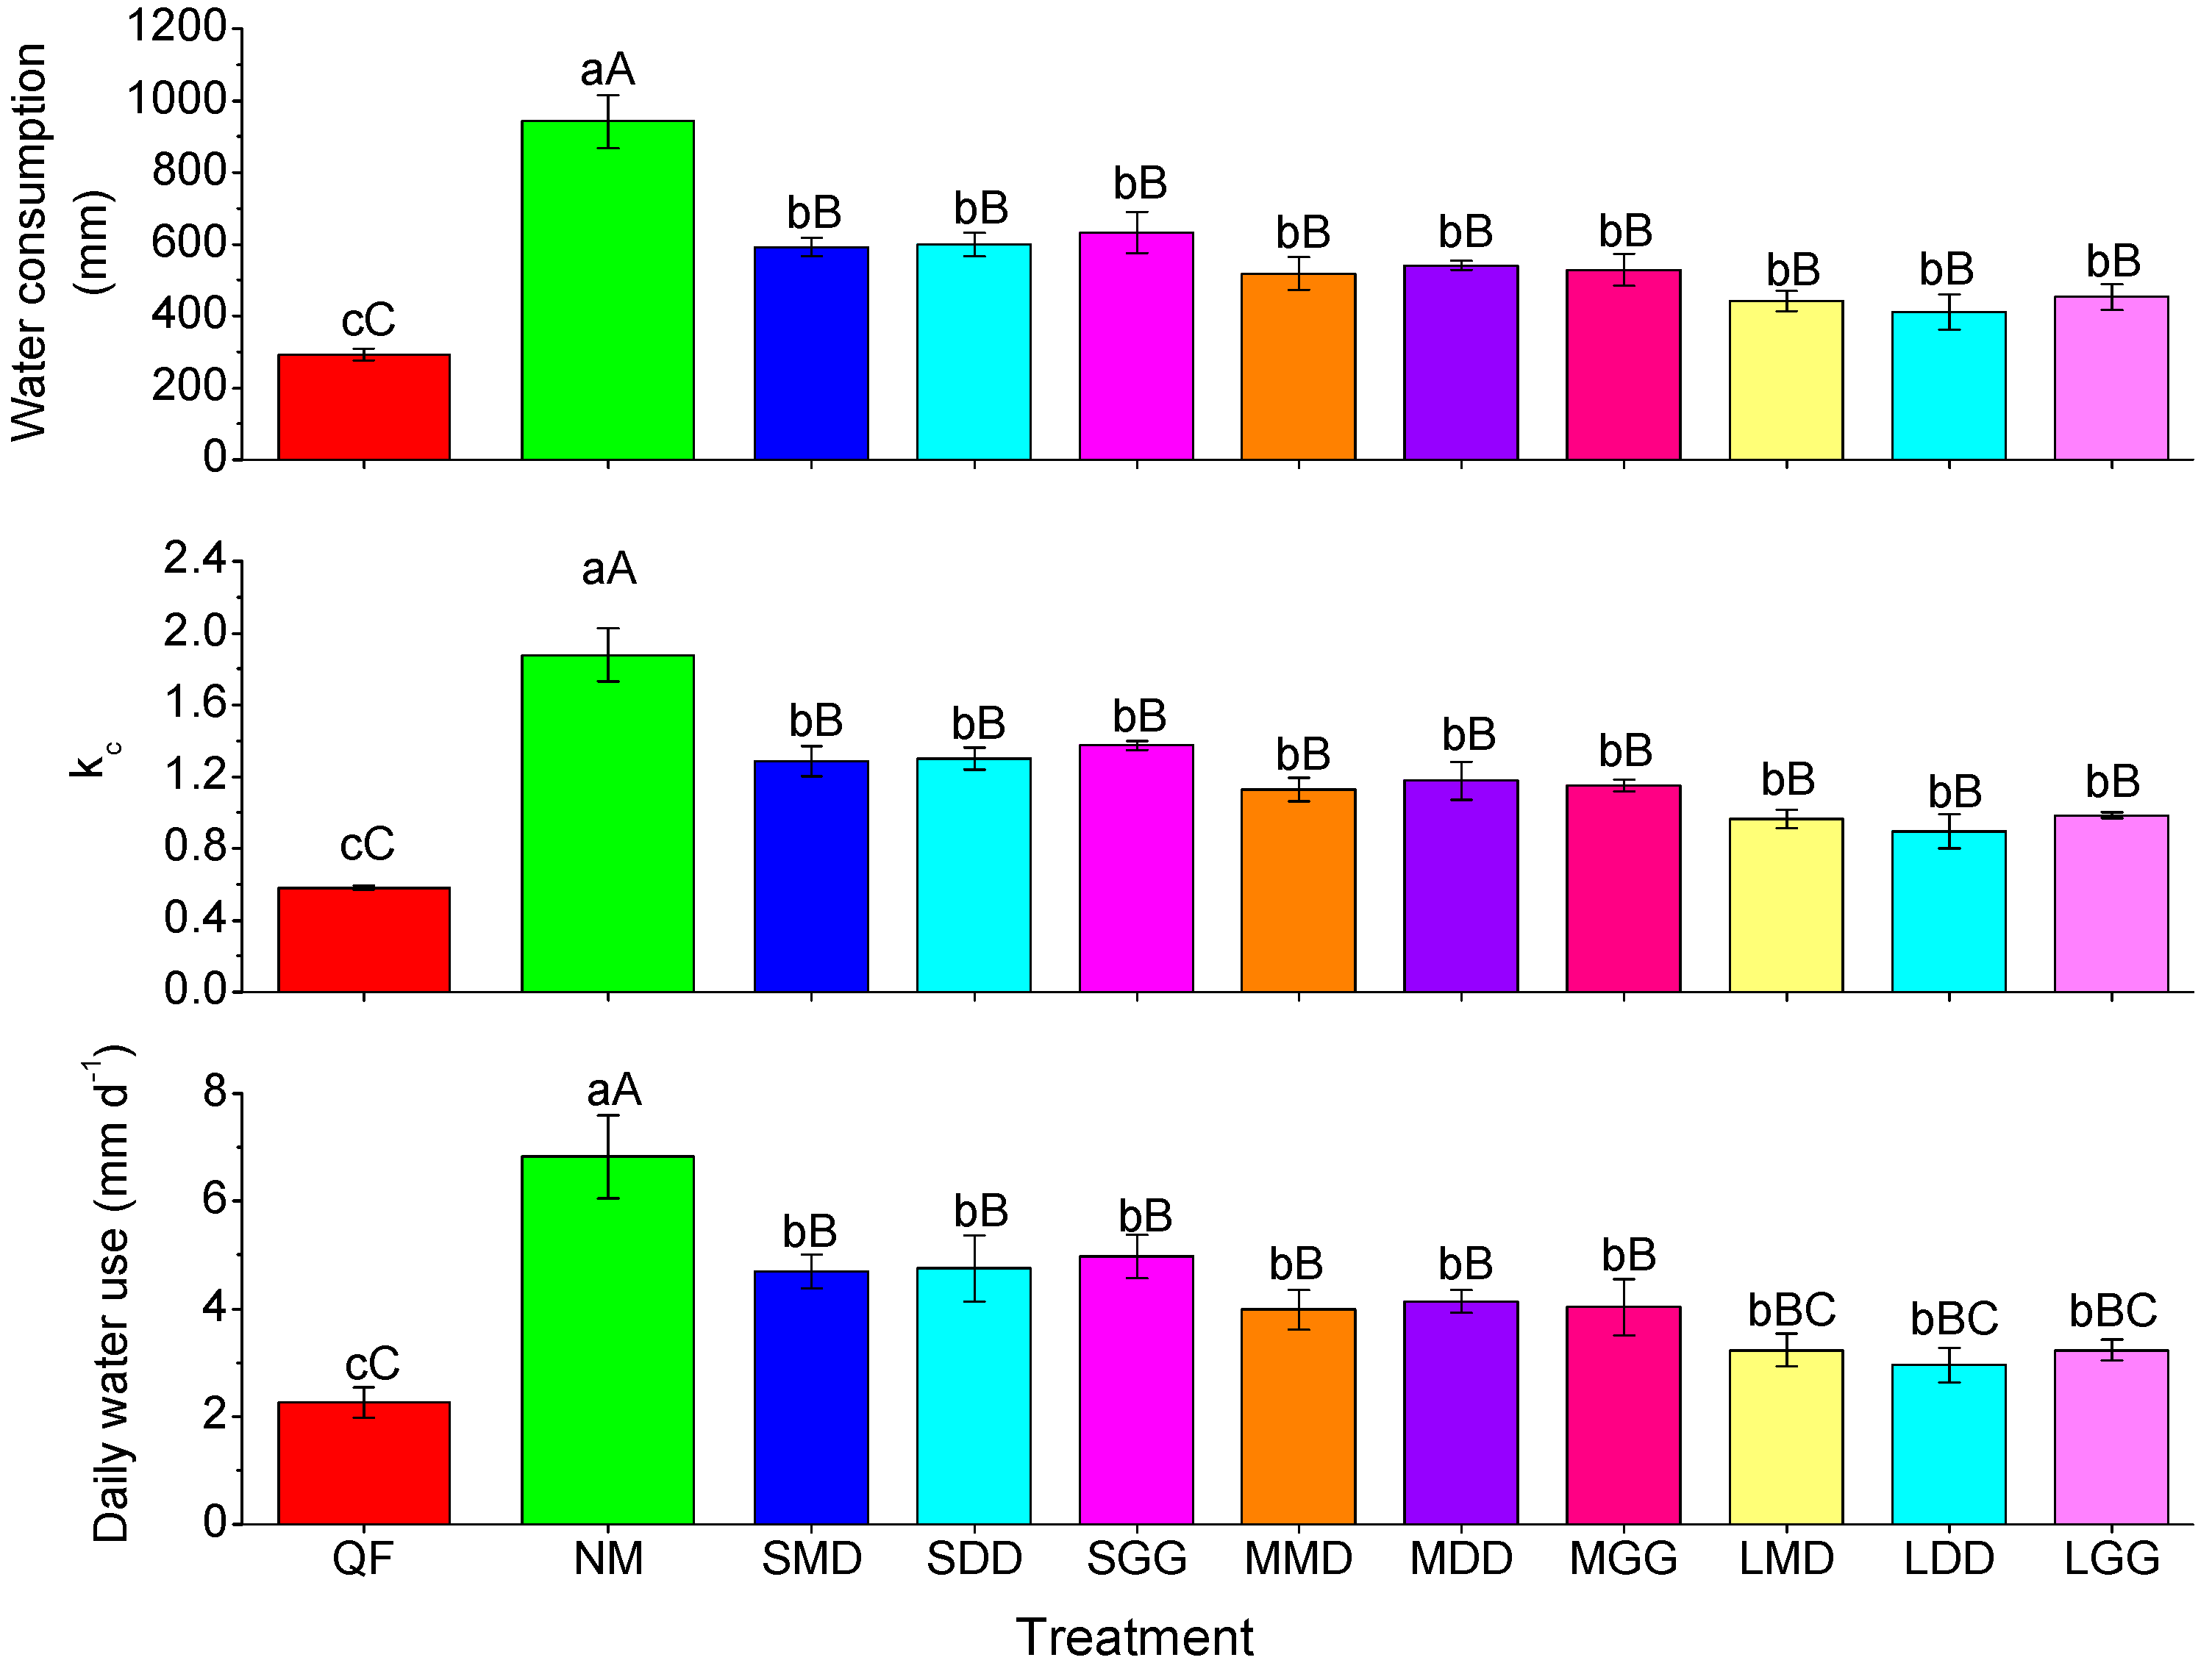
Figure 4.
ETc, reference crop coefficiency (kc), daily water use changes in April–September 2017. QF represents RFPS with film mulching on both ridges and furrows, without water supply after seed emergence; MD represents RFPS with film mulching on continuous ridges; DD represents RFPS without film mulching; GG represents conventional flat planting no film mulching; NM refers to local sufficient irrigation (actual irrigation amount excessively exceed water needed). S refers to high water supply level (650 mm), M refers to moderate water supply level (500 mm), and L refers to low water supply level (400 mm) (the same below). Values represent means ± SE (n = 12). Bars labeled with different letters (lowercase, capital) differed remarkably among the treatments (p ≤ 0.05, p ≤ 0.01).
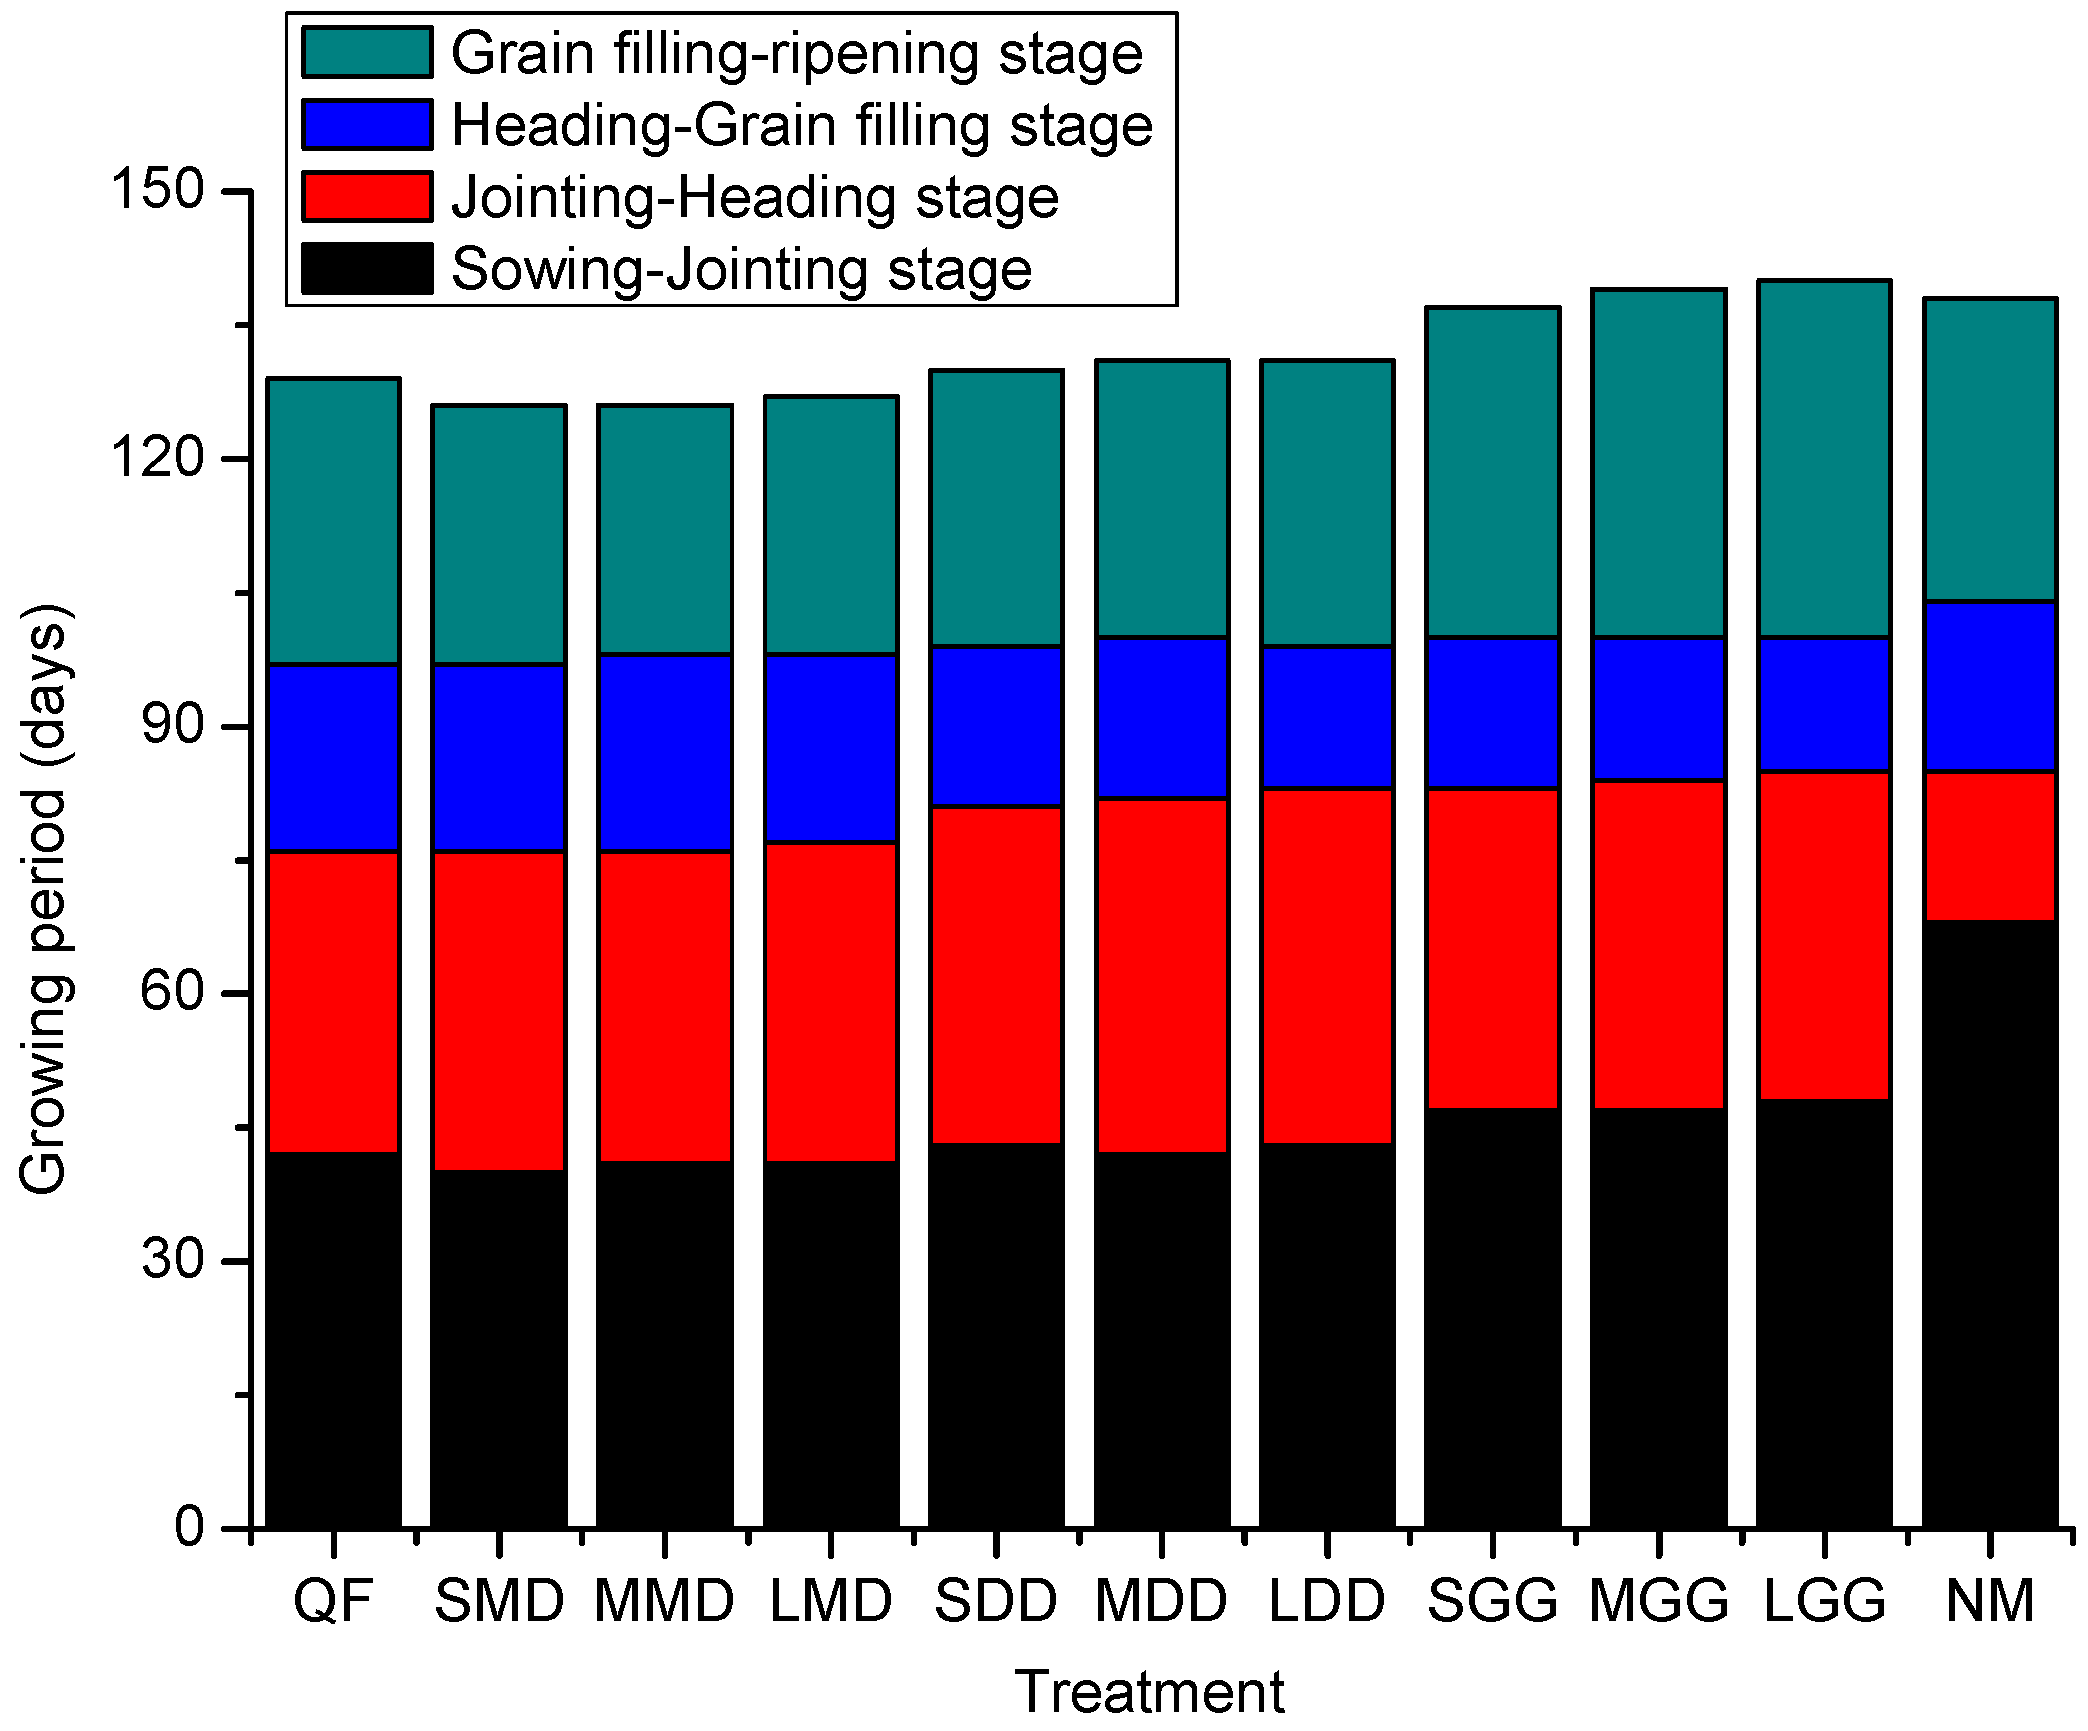
Figure 5.
Growth period of maize in 2017. It was expressed as the bar chart and was comprised of sowing, jointing, heading, grain filling, and ripening stage.
Figure 5.
Growth period of maize in 2017. It was expressed as the bar chart and was comprised of sowing, jointing, heading, grain filling, and ripening stage.
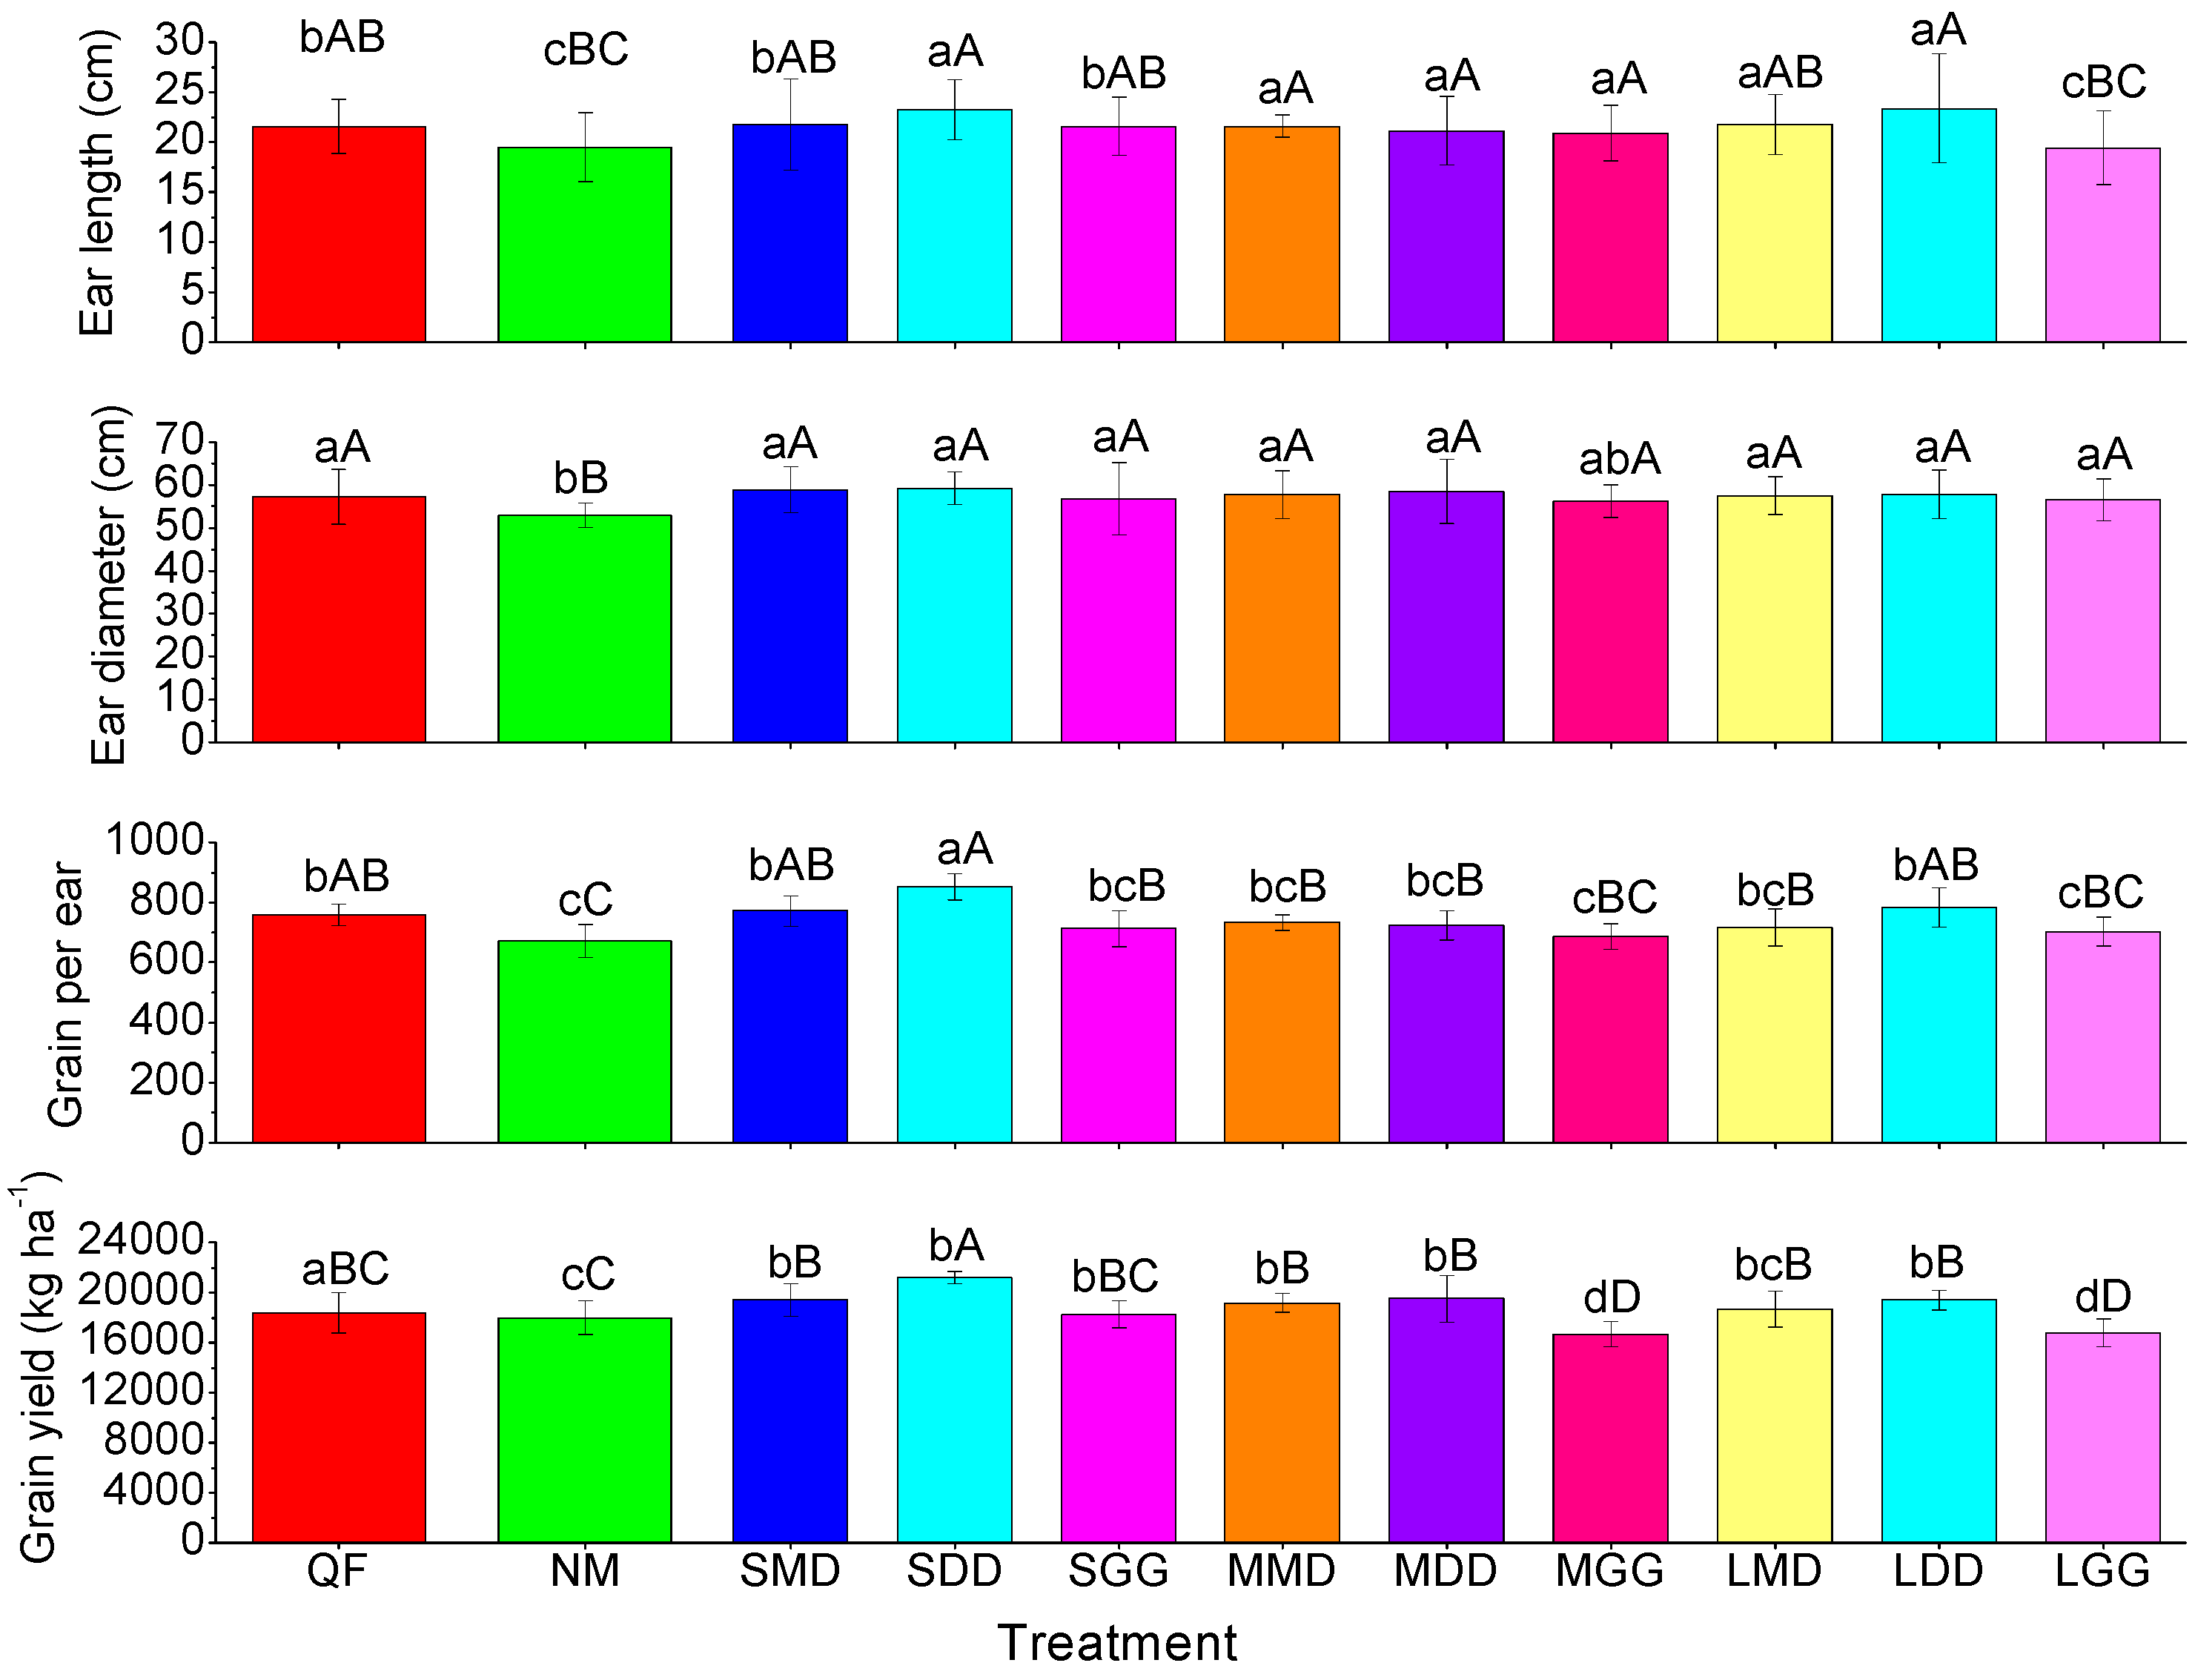
Figure 6.
Characteristics of grain yield components during the growing season in 2017 (ear length, ear diameter, grains per ear, and grain yield). Lowercase and uppercase letters indicate significant differences according to LSD0.05 and LSD0.01, respectively (n = 12). Vertical bars indicate standard errors of means. Bars labeled with different letters (lowercase, uppercase) differed remarkably among the treatments.
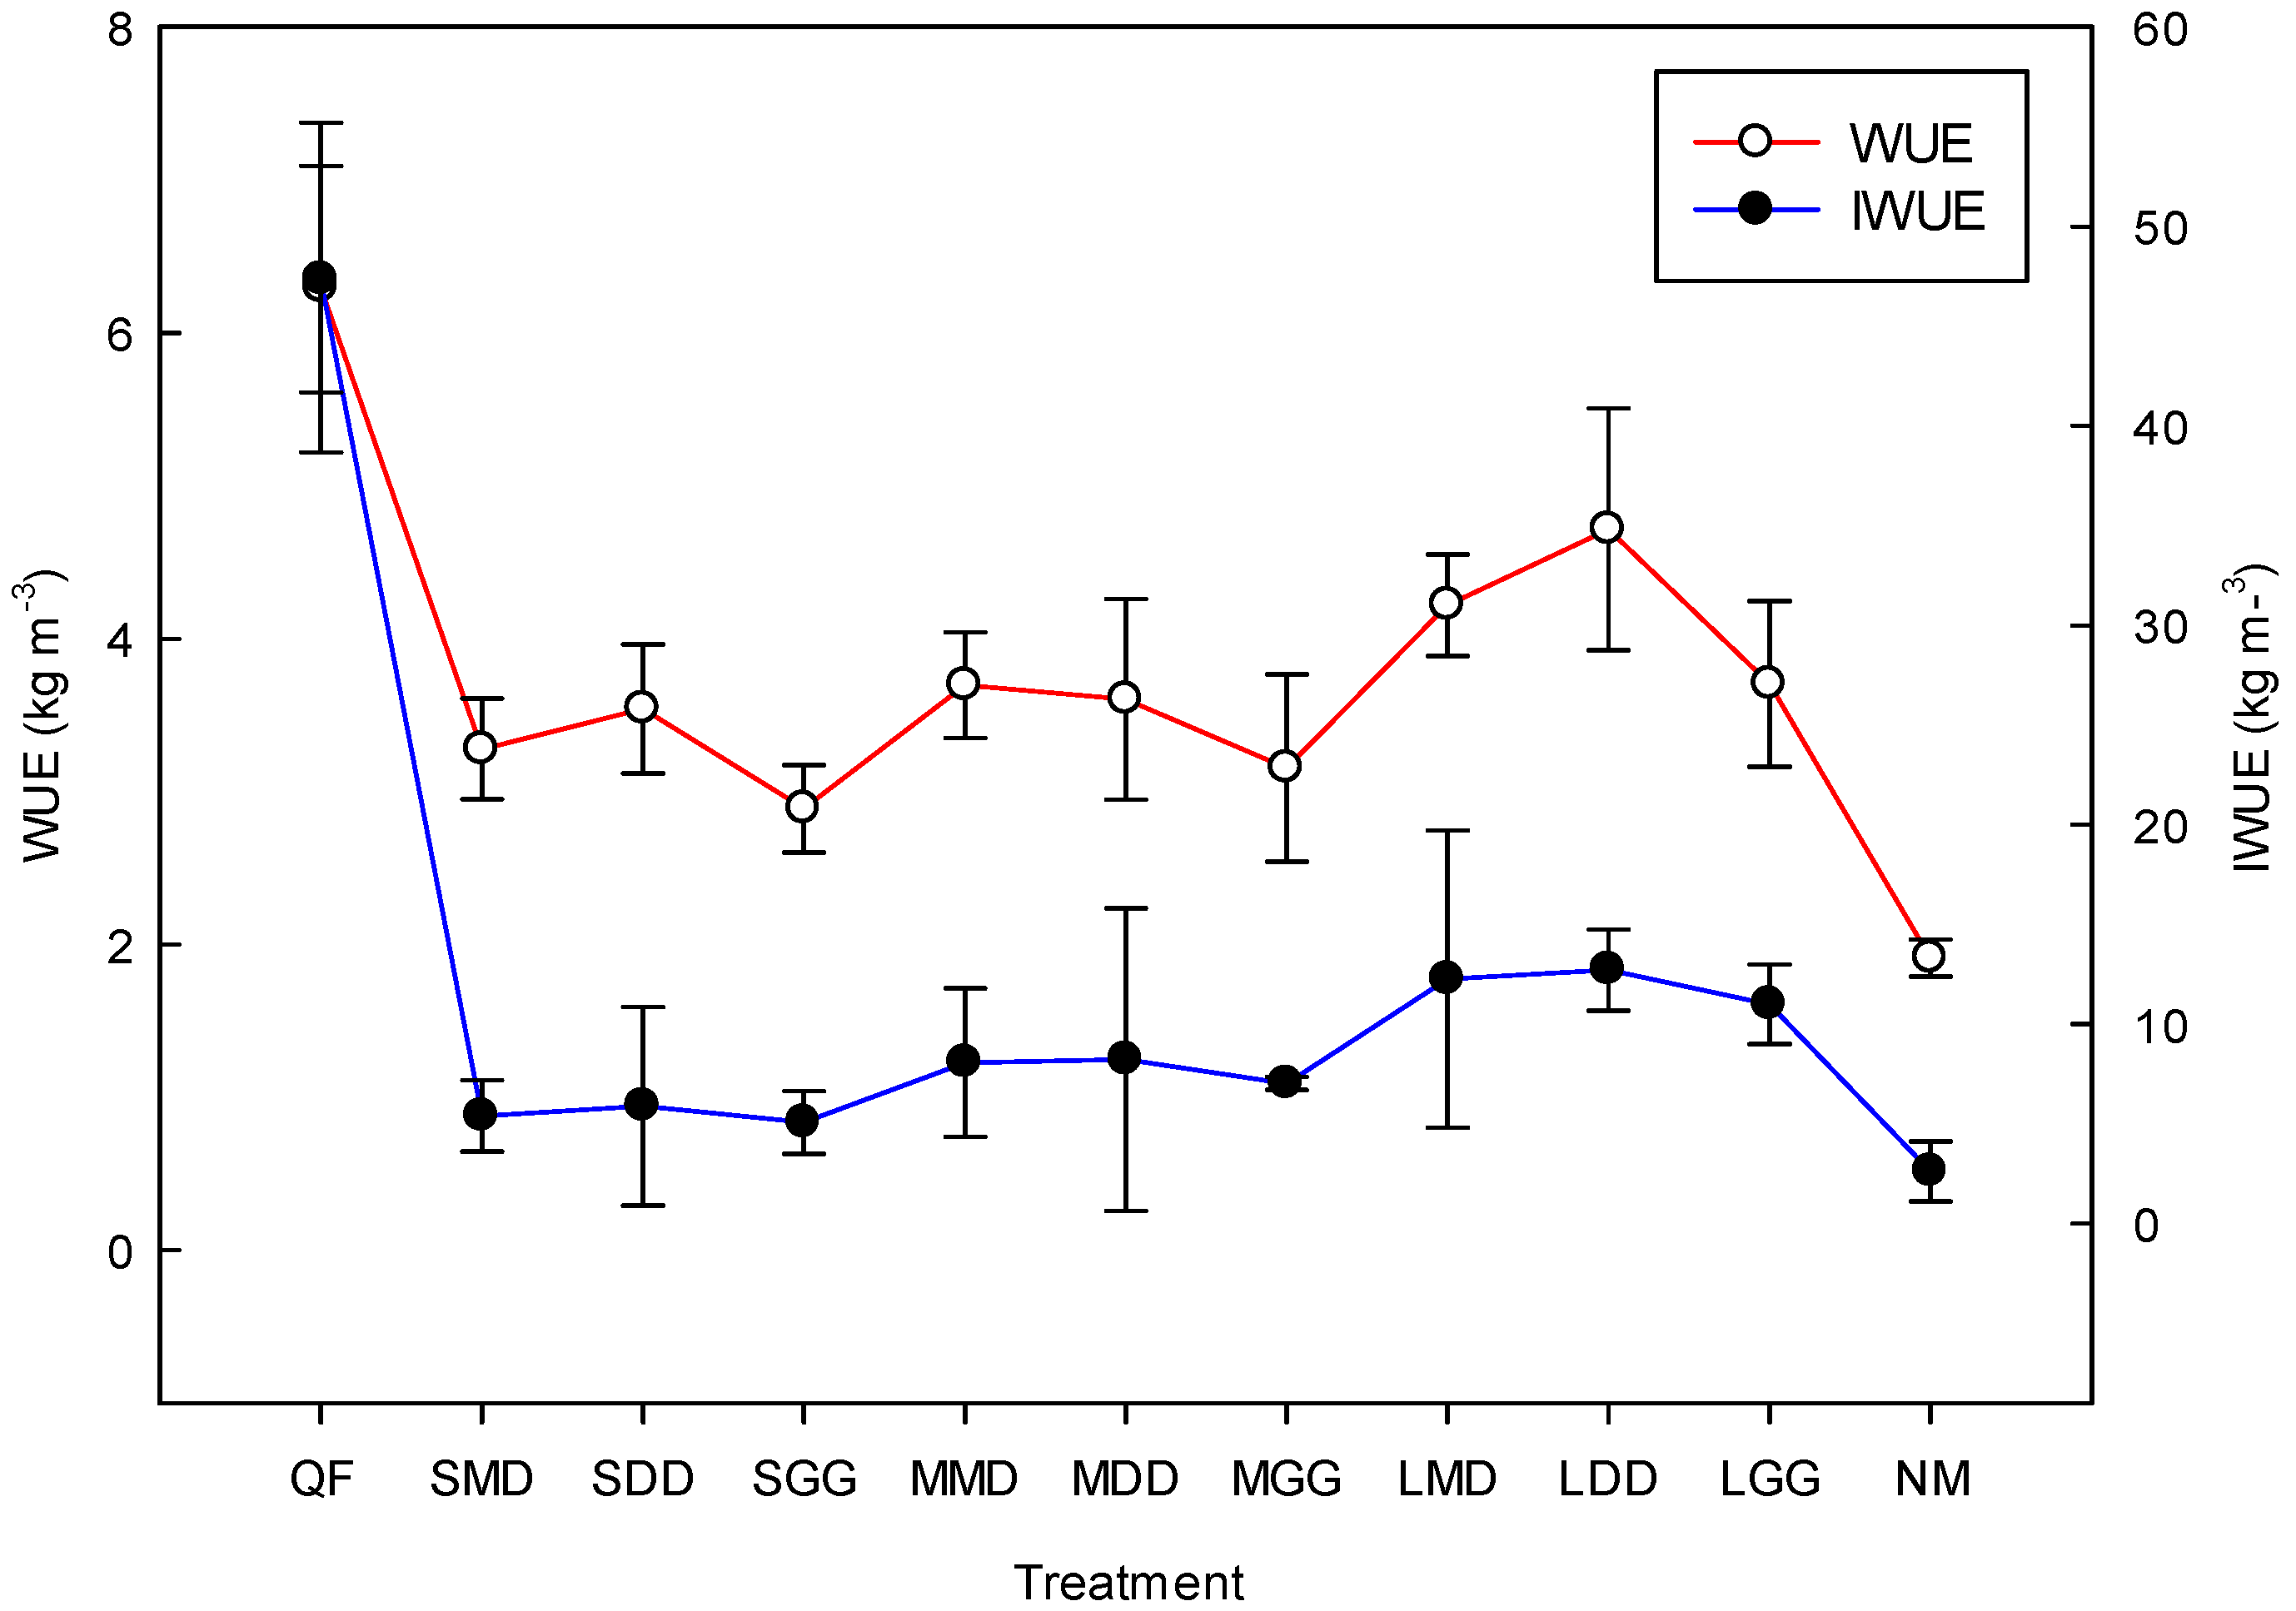
Figure 7.
Trends of WUE and IWUE. Vertical bars indicate standard errors of means.
Figure 7.
Trends of WUE and IWUE. Vertical bars indicate standard errors of means.
Figure 8.
The relationships between irrigation water and ear length, ear diameter, and grains per ear, as well as grain yield. A, B, C, and D represents changes of ear length, ear diameter, grains per ear, and yield with irrigation water, respectively.
Figure 8.
The relationships between irrigation water and ear length, ear diameter, and grains per ear, as well as grain yield. A, B, C, and D represents changes of ear length, ear diameter, grains per ear, and yield with irrigation water, respectively.
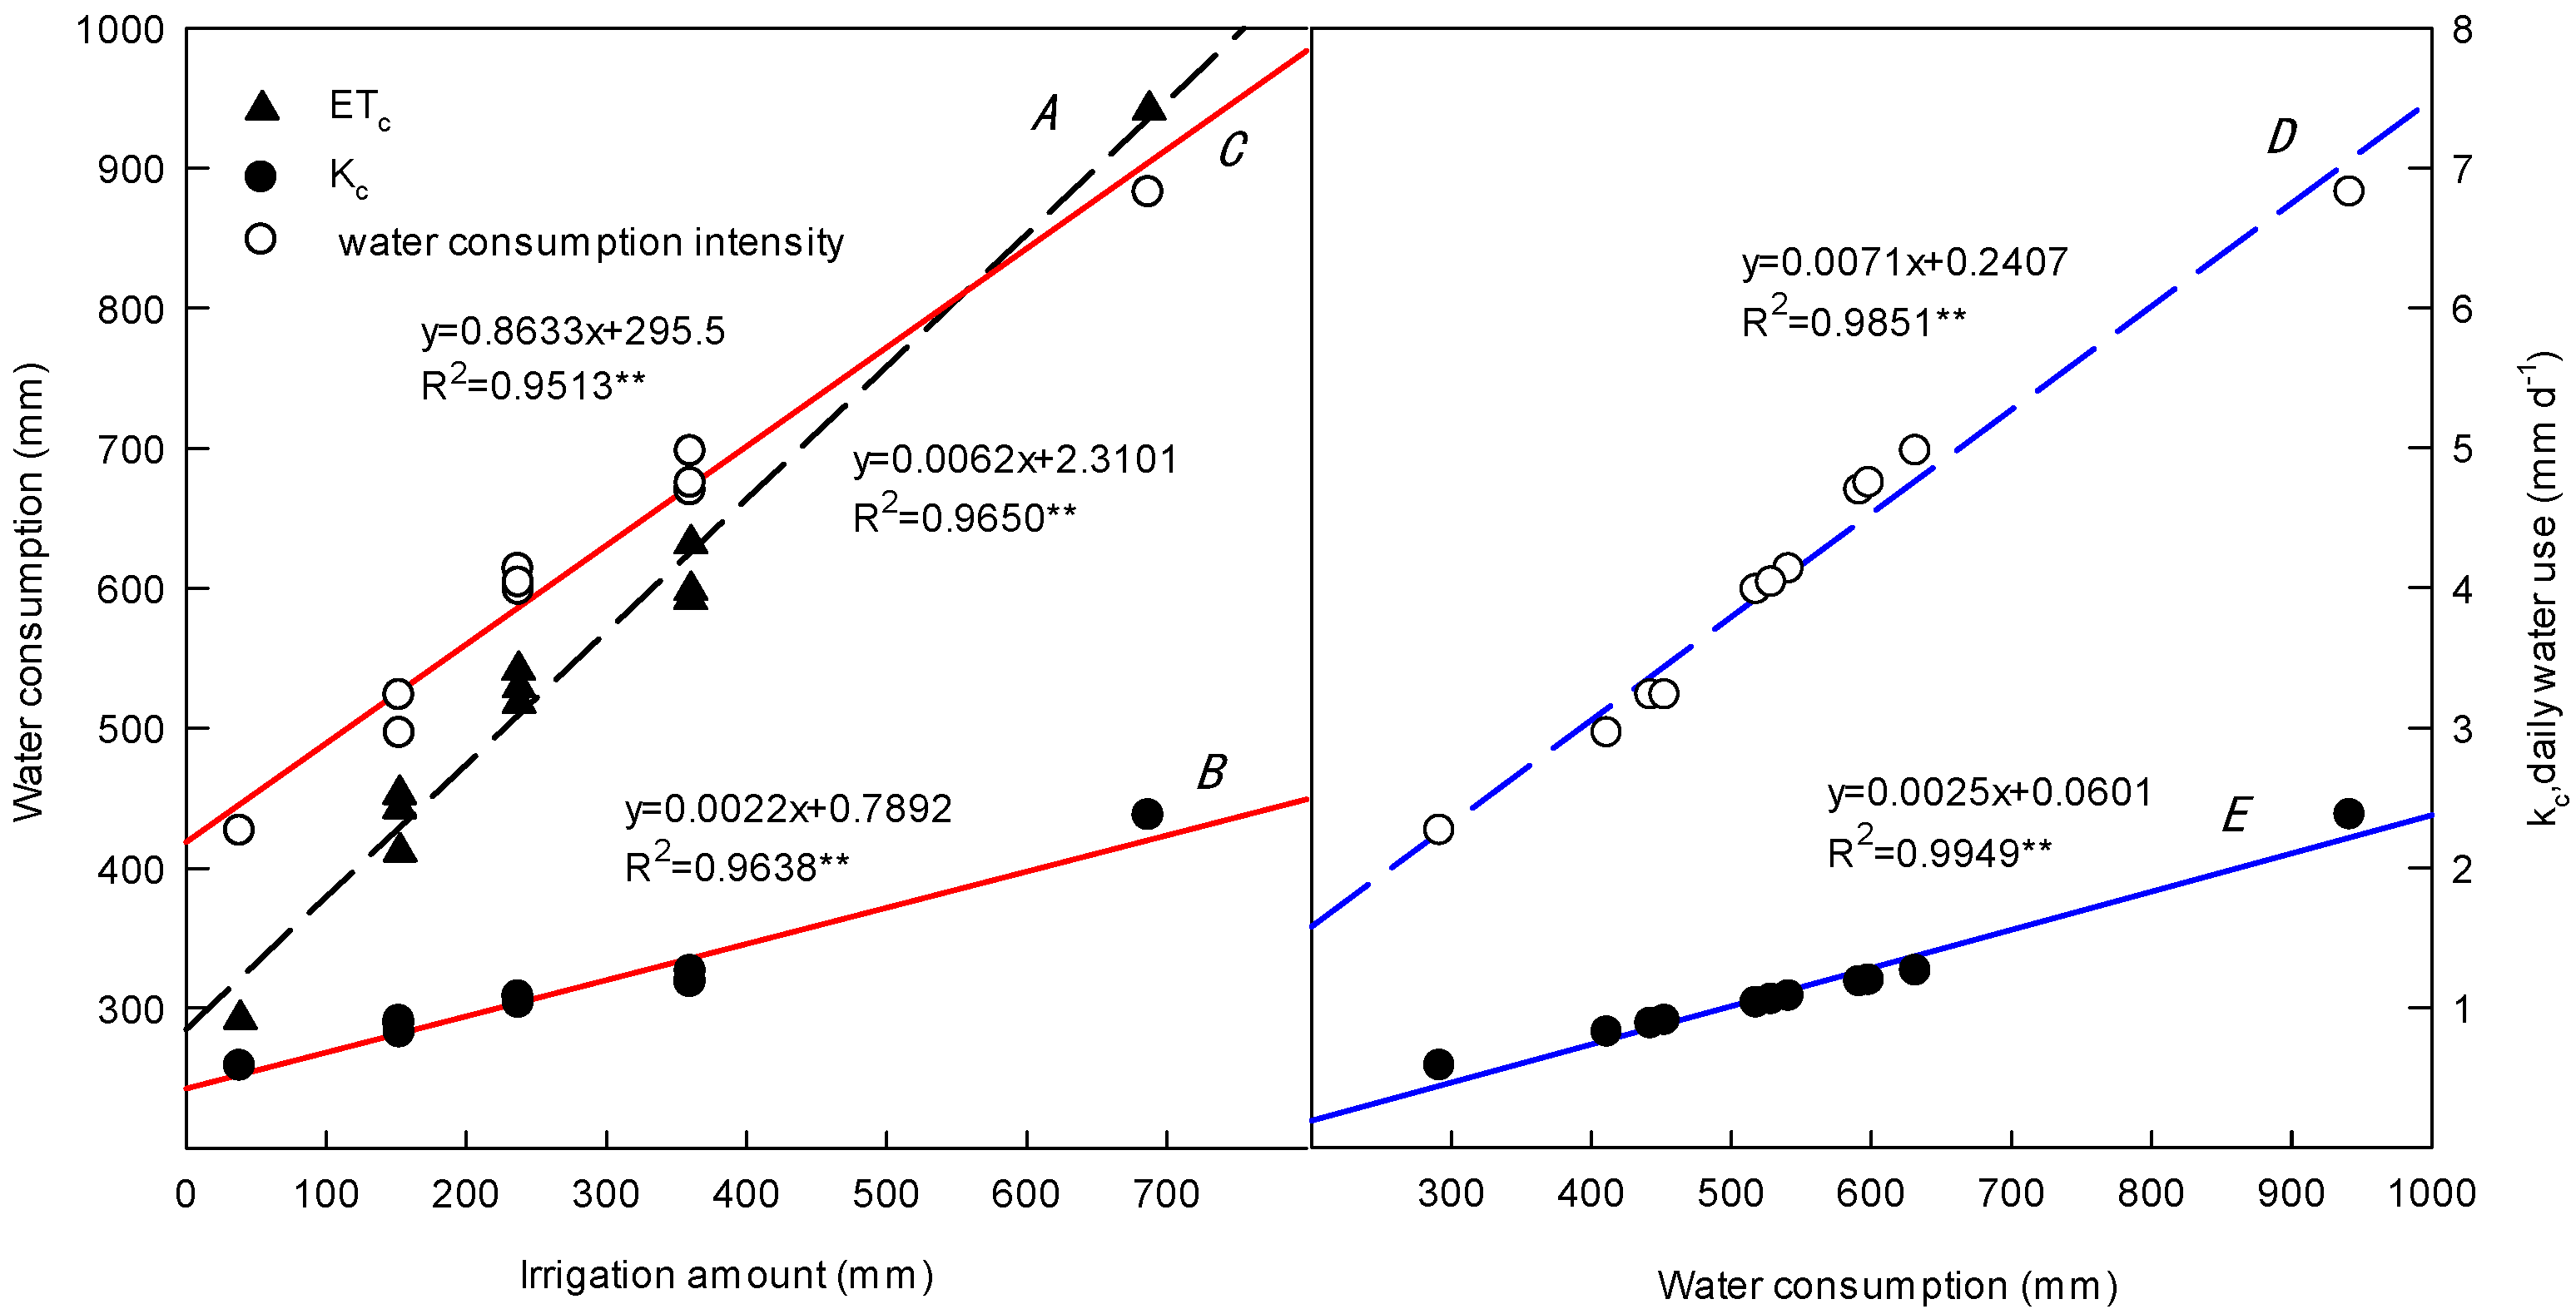
Figure 9.
The relationships between irrigation water and water use characteristics. A, B, and C denote changes of ETc, kc, and daily water use with irrigation water. D and E denote changes of daily water use and kc with irrigation water.
Figure 9.
The relationships between irrigation water and water use characteristics. A, B, and C denote changes of ETc, kc, and daily water use with irrigation water. D and E denote changes of daily water use and kc with irrigation water.
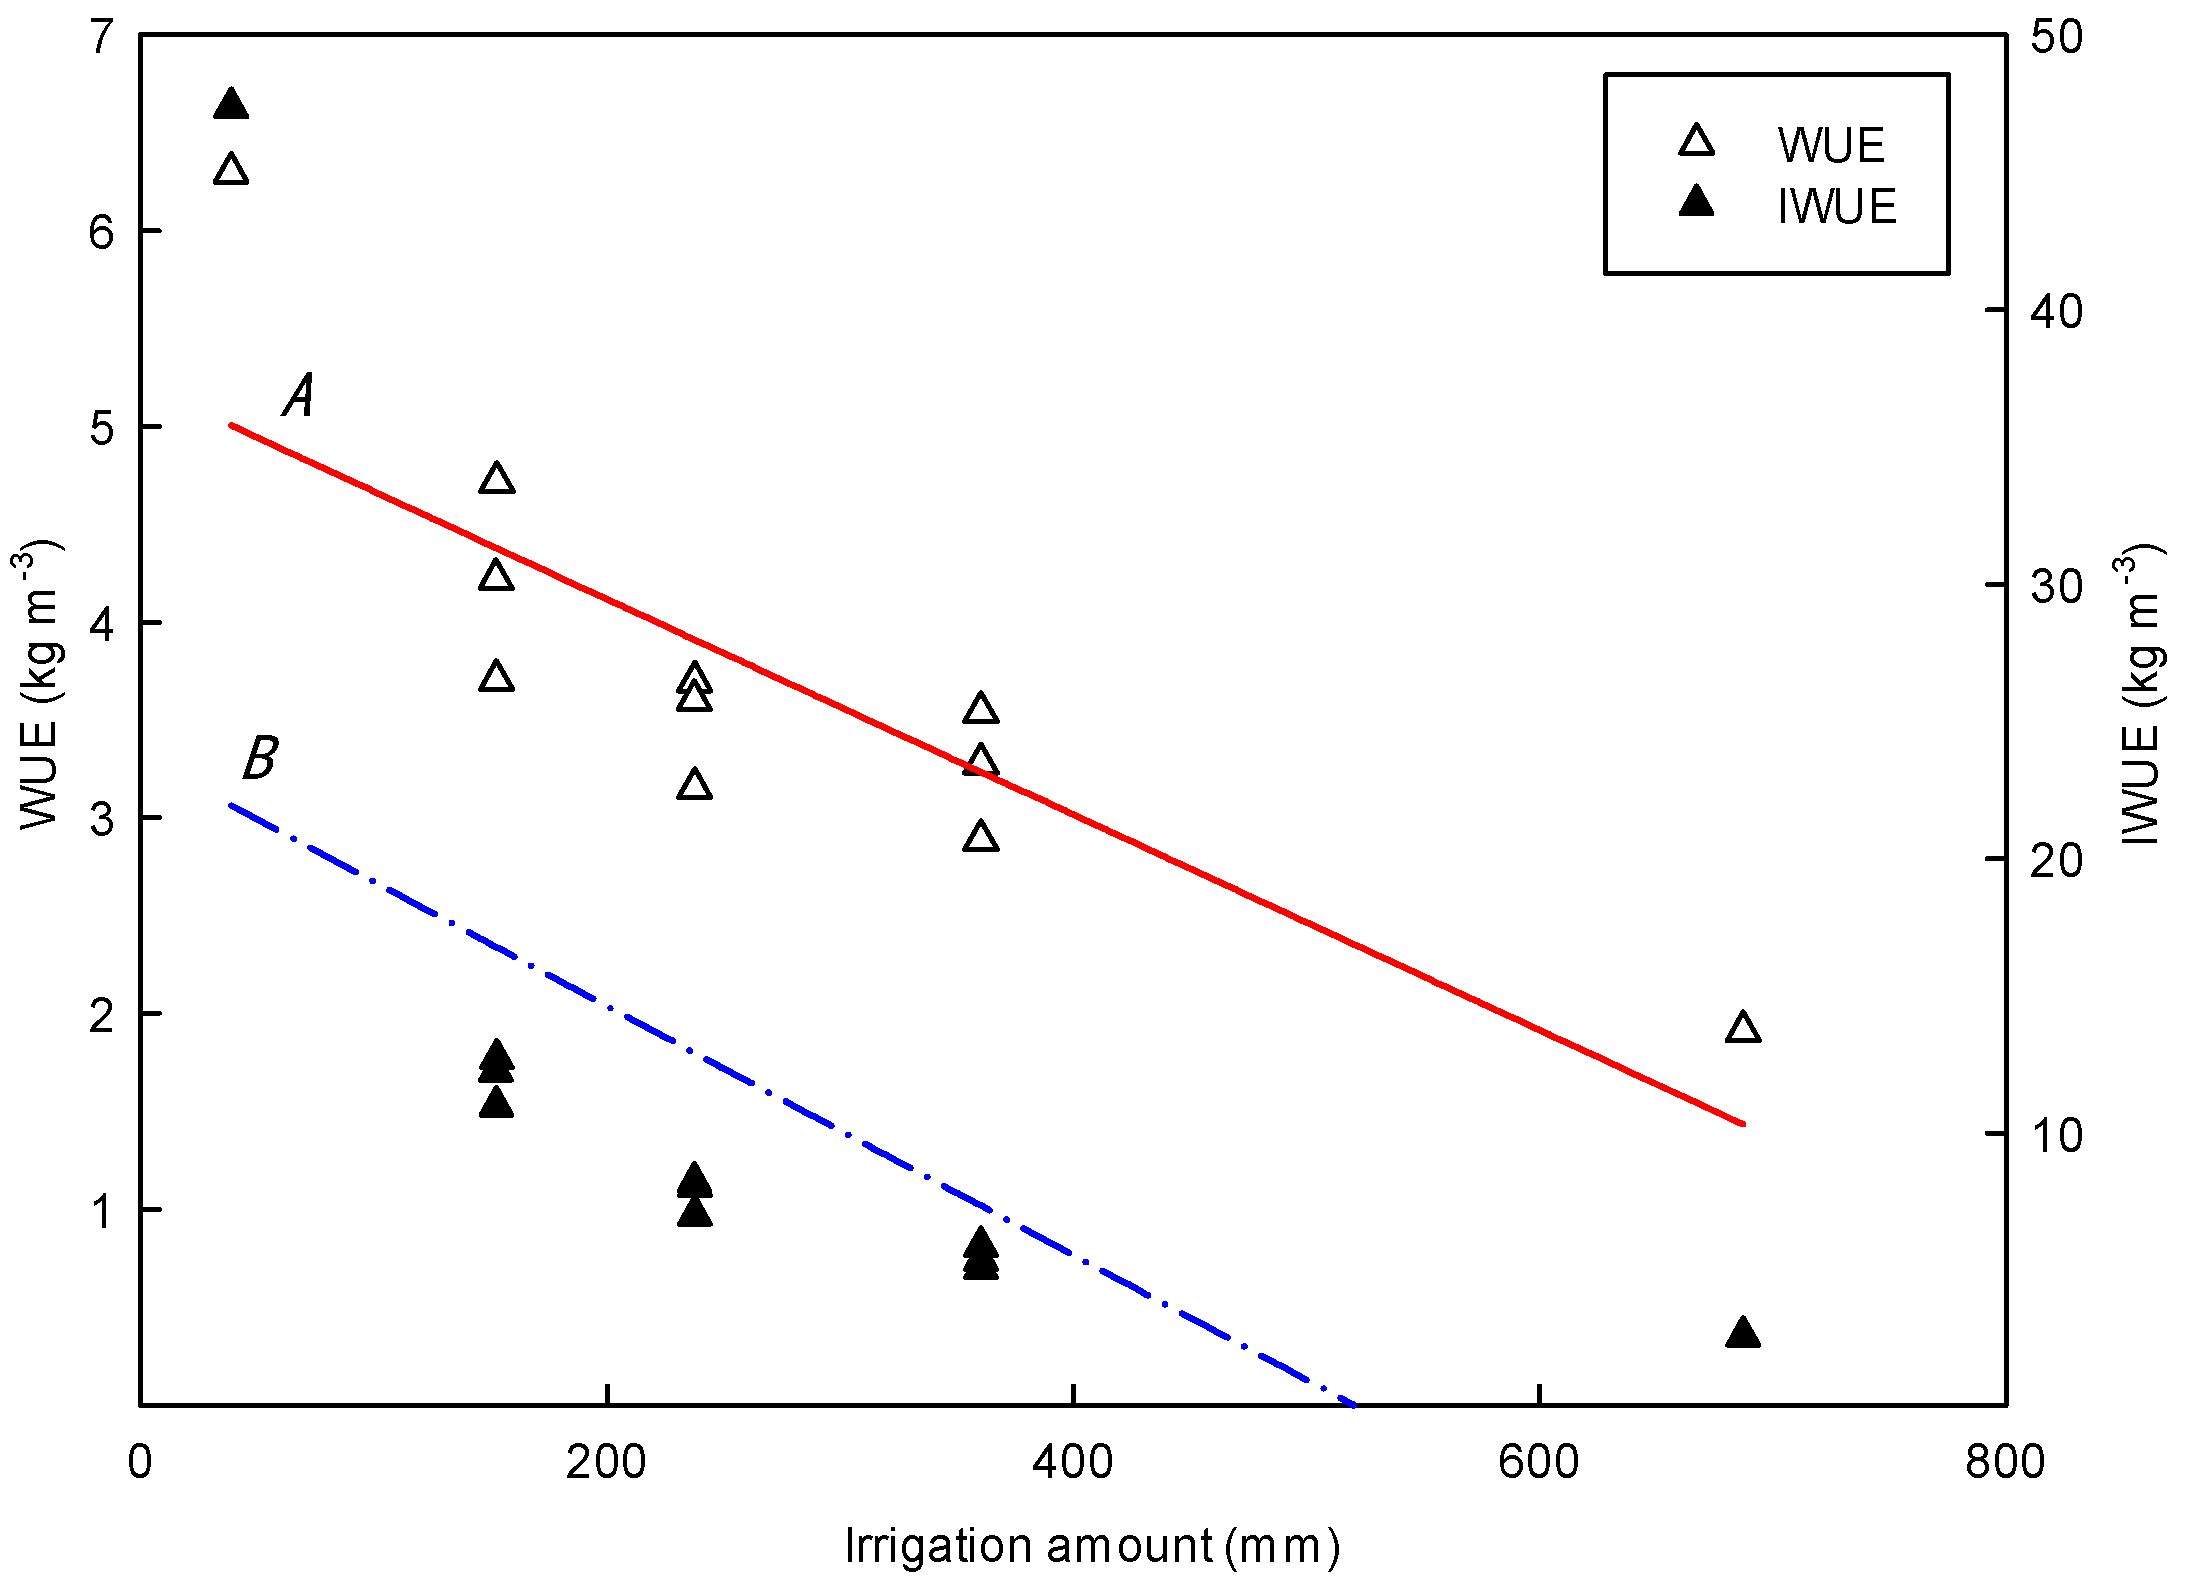
Figure 10.
The relationships between irrigation amount and WUE, IWUE. A and B represent changes of WUE, IWUE with irrigation water, respectively.
Figure 10.
The relationships between irrigation amount and WUE, IWUE. A and B represent changes of WUE, IWUE with irrigation water, respectively.
Table 1.
The specific trial layout in maize growing seasons.
Table 1.
The specific trial layout in maize growing seasons.
| Treaments | Description | Ridge | Furrow | Row Spacing | Plant Spacing |
|---|
| QF | Ridge-furrow mulching system | Plastic film mulch | Plastic film mulch | 0.8 m | 0.22 m |
| MD | Drip irrigation under plastic film | Plastic film mulch | No mulch | 0.6 m | 0.22 m |
| DD | Subsurface drip irrigation | No mulch | No mulch | 0.6 m | 0.23 m |
| GG | Conventional flood irrigation | No mulch | No mulch | 0.6 m | 0.24 m |
Table 2.
The designed water supply scheduling in different growth stages for treatment MD, DD, and GG.
Table 2.
The designed water supply scheduling in different growth stages for treatment MD, DD, and GG.
| Growth Stage | Total Designed Water Supply (%) | Total Water Supply Amount (mm) |
|---|
| 650 mm | 500 mm | 350 mm |
|---|
| Seeding-Jointing Stage | 15.0 | 98 | 75 | 53 |
| Jointing-Heading Stage | 35.0 | 228 | 175 | 123 |
| Heading-Filling Stage | 22.0 | 143 | 110 | 77 |
| Filling-Ripening Stage | 28.0 | 182 | 140 | 98 |
Table 3.
The irrigation regimes across the growing season (April–September 2017).
Table 3.
The irrigation regimes across the growing season (April–September 2017).
| Growth Stage | Precipitation | Irrigation (Excepting Precipitation) | QF | SMD | SDD | SGG | MMD | MDD | MGG | LMD | LDD | LGG |
|---|
| Seeding–Jointing Stage | 26 April–28 April | | 0.0 |
| | 28 April–1 May | 38.82 | 38.79 | 38.80 | 38.84 | 38.93 | 38.94 | 39.12 | 38.74 | 39.04 | 38.75 |
| 2 May–22 May | | 29.9 |
| | 23 May–25 May | N | 28.40 | 28.51 | 28.60 | 6.00 | 5.98 | 5.94 | N | N | N |
| 23 May–8 June | | 0.6 |
| Total Irrigation from Seeding to Jointing Stage | 69.37 | 97.74 | 97.86 | 97.99 | 75.48 | 75.47 | 75.61 | 69.29 | 69.59 | 69.30 |
| Irrigation Deviation | 0.00 | +0.24 | +0.36 | +0.49 | +0.48 | +0.47 | +0.61 | +16.79 | +17.09 | +16.80 |
| Jointing–Heading Stage | | 9 June–13 June | N | 113.48 | 113.45 | 113.24 | 87.04 | 87.11 | 86.94 | 44.41 | 44.12 | 44.37 |
| 14 June–24 June | | 5.5 |
| | 25 June–27 June | N | 51.40 | 51.44 | 51.35 | 38.35 | 38.27 | 38.33 | 25.21 | 25.16 | 25.20 |
| 25 June–15 July | | 54.7 |
| Total Irrigation from Jointing to Heading Stage | 60.12 | 225.00 | 225.01 | 224.71 | 185.51 | 185.50 | 185.33 | 129.74 | 129.40 | 129.69 |
| Irrigation Deviation | 0.00 | −2.5 | −2.49 | −2.79 | +10.51 | +10.50 | +10.33 | +7.24 | +6.90 | +7.19 |
| Heading–Filling Stage | | 16 July–20 July | N | 97.8 | 97.86 | 98.02 | 62.85 | 62.79 | 62.96 | 44.11 | 44.34 | 44.17 |
| 20 July–28 July | | 35.7 |
| Total Irrigation from Heading to Filling Stage | 35.67 | 133.47 | 133.53 | 133.69 | 98.52 | 98.46 | 98.63 | 79.78 | 80.01 | 79.84 |
| Irrigation Deviation | 0.00 | −9.53 | −9.47 | −9.31 | −11.48 | −11.54 | −11.37 | +2.78 | +3.01 | +2.84 |
| Filling–Ripening Stage | 29 July–4 August | | 100.5 |
| | 5 August–7 August | N | 30.38 | 30.41 | 30.34 | 4.37 | 4.33 | 4.40 | N | N | N |
| 5 August–8 September | | 34.8 |
| Total Irrigation from Filling to Ripening Stage | 135.24 | 165.62 | 165.58 | 165.58 | 139.61 | 139.57 | 139.64 | 135.24 | 135.24 | 135.24 |
| Irrigation Deviation | 0.00 | −16.38 | −16.42 | −16.42 | −0.39 | −0.43 | −0.36 | +37.24 | +37.24 | +37.24 |
| Total Water Supply (Irrigation Plus Precipitation) in Whole Growing Season (No Decimals) | 300 | 622 | 622 | 622 | 499 | 499 | 499 | 414 | 414 | 414 |
| Total Precipitation in Whole Growing Season | 261.6 |
| Total Irrigation (Excepting Total Precipitation) in Whole Growing Season (No Decimals) | 39 | 360 | 360 | 360 | 238 | 238 | 238 | 153 | 153 | 153 |
Table 4.
Maximum air temperature (Tmax), minimum air temperature (Tmin), mean air temperature (Tmean), net solar radiation (Rn), relative humidity (RH), wind speed at 2 m height (U2), latitude (Ψ), latent heat(λ), Soil heat flux (G), and reference crop evapotranspiration (ETo) for the months of April–September at Naiman, China in April–September, 2017.
| Date | Tmax (°C) | Tmean (°C) | Tmin (°C) | RHmax (%) | RHmin (%) | U2 (m/s) | Ѱ (rad) | λ (MJ kg−1) | G (MJ m−2) | Rn (MJ m−2) | ETo (mm) |
|---|
| April a | 23.42 | 16.57 | 8.90 | 48.80 | 12.60 | 2.26 | 42.93 | 2.47 | 0.54 | 6.75 | 22 |
| May | 26.55 | 18.99 | 11.05 | 69.81 | 20.19 | 1.73 | 42.93 | 2.46 | 0.05 | 8.04 | 129 |
| June | 30.93 | 24.06 | 17.77 | 87.43 | 36.40 | 1.25 | 42.93 | 2.45 | 0.09 | 9.10 | 114 |
| July | 31.00 | 24.67 | 18.95 | 96.81 | 46.94 | 1.04 | 42.93 | 2.44 | −0.01 | 9.87 | 118 |
| August | 26.52 | 19.50 | 13.39 | 96.07 | 38.28 | 0.98 | 42.93 | 2.45 | −0.14 | 7.70 | 88 |
| September b | 28.31 | 21.26 | 14.49 | 81.72 | 32.20 | 1.26 | 42.93 | 2.46 | 0.06 | 5.82 | 30 |
Table 5.
Results from two-way ANOVA of the effect of various patterns of RFPS and irrigation levels on ETc, kc, and daily water use.
Table 5.
Results from two-way ANOVA of the effect of various patterns of RFPS and irrigation levels on ETc, kc, and daily water use.
| Descriptions | df | ETc (mm) | kc | Daily Water Use (mm d−1) |
|---|
| F | P | F | P | F | P |
|---|
| Water-saving approach | 2 | 3014.287 ** | 0 | 13.694 ** | 0 | 32.302 ** | 0 |
| Irrigation level | 2 | 162843.122 ** | 0 | 449.809 ** | 0 | 4548.837 ** | 0 |
| Water-saving approach × Irrigation level | 4 | 2366.463 ** | 0 | 3.080 * | 0.043 | 38.672 ** | 0 |
Table 6.
Results from two-way ANOVA of the effect of various patterns of RFPS and irrigation levels on yield, WUE and IWUE.
Table 6.
Results from two-way ANOVA of the effect of various patterns of RFPS and irrigation levels on yield, WUE and IWUE.
| Descriptions | df | Yield (kg ha−1) | WUE (kg m−3) | IWUE (kg m−3) |
|---|
| F | P | F | P | F | P |
|---|
| Water-saving approach | 2 | 6.270 ** | 0.009 | 10.749 ** | 0.001 | 6.233 ** | 0.009 |
| Irrigation level | 2 | 1.608 | 0.228 | 21.535 ** | 0 | 168.879 ** | 0 |
| Water-saving approach × Irrigation level | 4 | 0.176 | 0.948 | 0.826 | 0.526 | 0.410 | 0.799 |
Table 7.
Pearson correlations among water use characteristics and yield components.
Table 7.
Pearson correlations among water use characteristics and yield components.
| Descriptions | ETc (mm) | kc | Daily Water Use (mm d−1) | Ear Length (cm) | Ear Diameter (cm) | Grains Per Ear | Yield (kg ha−1) | WUE (kg m−3) | IWUE (kg m−3) |
|---|
| ETc (mm) | 1 | | |
| kc | 1.00 ** | 1 | |
| Daily water use (mm d−1) | 0.99 ** | 0.99 ** | 1 | |
| Ear length (cm) | −0.38 | −0.38 | −0.31 | 1 | |
| Ear diameter (cm) | −0.59 | −0.59 | −0.5 | 0.73 * | 1 | |
| Grains per ear | −0.31 | −0.31 | −0.24 | 0.83 ** | 0.79 ** | 1 | |
| Yield (kg ha−1) | 0.01 | 0.01 | 0.08 | 0.76 ** | 0.7 * | 0.83 ** | 1 | |
| WUE (kg m−3) | −0.9 ** | −0.9 ** | −0.90 ** | 0.41 | 0.53 | 0.4 | 0.13 | 1 | |
| IWUE (kg m−3) | −0.68 * | −0.68 * | −0.69 ** | 0.1 | 0.23 | 0.17 | −0.09 | 0.89 ** | 1 |
Table 8.
The comparisons of grain yield, IWUE, WUE, and ETc of maize under different irrigation strategies in previous studies compared to this study.
Table 8.
The comparisons of grain yield, IWUE, WUE, and ETc of maize under different irrigation strategies in previous studies compared to this study.
| Authors | Irrigation Water (mm) | Grain Yield (kg ha−1) | IWUE (kg m−3) | WUE (kg m−3) | ETc (mm) | Date |
|---|
| Payero et al. [20] | 150 | 10810–12960 | 7.21–8.64 | 1.80–2.05 | 525 | 2005 |
| 150 | 7590–11350 | 5.06–7.57 | 1.56–1.92 | 556 | 2006 |
| Payero et al. [59] | 53–356 | 8440–10850 | 2.92–15.93 | 1.46–1.66 | 394–650 | 2005 |
| 22–226 | 4550–9570 | 4.13–21.08 | 0.98–1.49 | 457–640 | 2006 |
| Sun et al. [60] | 87–162 | 7164–8110 | 1.60–1.928 | 1.58–1.66 | 449–490 | 2004 |
| Dağdelen et al. [61] | 147–488 | 5520–11630 | 2.38–3.75 | 1.98–2.30 | 257–434 | 2003 |
| 149–497 | 4910–11050 | 2.22–3.29 | 1.87–2.00 | 262–450 | 2004 |
| Aydinsakir et al. [62] | 129–722 | 1440–7430 | 1.12–1.67 | 0.55–1.21 | 26–737 | 2013 |
| 129–722 | 3630–9350 | 1.29–2.83 | 1.27–1.57 | 263–738 | 2013 |
| Sampathkumar et al. [49] | 240–400 | 4670–7610 | 1.35–2.68 | 1.00–1.83 | 351–538 | 2008 |
| 231–500 | 4560–7520 | 1.04–2.29 | 0.95–2.1 | 293–551 | 2009 |
| El-Hendawy and Schmidhalter [63] | 357–596 | 721–9146 | 2.02–18.70 | 1.84–17.57 | 380–616 | 2007 |
| Oktem [64] | 610–876 | 8270–13200 | 1.36–1.59 | 1.18–1.33 | 700–1008 | 1998 |
| 612–889 | 8340–14350 | 1.36–1.62 | 1.19–1.36 | 701–1071 | 1999 |
| Ko and Piccinni [51] | 211–422 | 6375–8442 | 2.00–3.02 | 0.85–1.20 | 704–753 | 2003 |
| 209–418 | 5477–7879 | 1.89–2.62 | 0.43–1.26 | 626–1289 | 2003 |
| 116–231 | 6930–8567 | 3.71–5.99 | 0.78–1.03 | 833–887 | 2004 |
| Igbadun et al. [12] | 400–700 | 1710–3832 | 0.43–0.56 | 0.44–0.71 | 389–540 | 2004 |
| 440–750 | 1625–4349 | 0.37–0.62 | 0.41–0.85 | 396–512 | 2005 |
| El-Wahed et al. [65] | 391–559 | 4202–10071 | 0.11–0.18 | 1.03–1.80 | 408–560 | 2009 |
| 477–682 | 2864 –8047 | 0.06–0.12 | 0.60–1.18 | 477–682 |
| 391–559 | 4350–10100 | 0.11–0.18 | 1.03–1.81 | 422–558 | 2010 |
| 477–682 | 3055–8047 | 0.06–0.12 | 0.64–1.18 | 477–682 |
| El-hendawy et al. [66] | 357–596 | 2620–7097 | 0.73–1.19 | | 2005 |
| 357–596 | 2657–7309 | 0.74–1.23 | | 2006 |
| This study | 38–360 | 16685–21197 | 5.06–47.36 | 2.89–6.30 | 292–632 | 2017 |


